- 1School of Civil Engineering, Hefei University of Technology, Hefei, China
- 2Institute of Water Resources and Environmental Systems Engineering, Hefei University of Technology, Hefei, China
With the rapid economic development and the acceleration of urbanization, the pressure on the water resources system is becoming intense. As an important indicator of water resources security and sustainable development, the water resources carrying capacity has become a hot issue. To overcome the limitation of commonly used methods for weight determination and to evaluate the regional water resources carrying capacity reasonably, the index weight determined by the Analytic Hierarchy Process method was revised by the subtraction set pair potential to calculate the dynamic index weight. Then, the dynamic weight was combined with the set pair analysis method to evaluate the regional water resources carrying capacity dynamically. In addition, the Dagum Gini coefficient and its decomposition method were used to analyze the overall difference of water resources carrying capacity in the whole region and the differences within and between subregions considering the lack of quantitative research in spatial equilibrium. Finally, a case study was carried out in Anhui Province, China. The results showed that from 2011 to 2018, most of the water resources carrying capacity for 16 cities in Anhui Province were in a critical state, with the strongest in the south of Anhui Province and the weakest in the north. The overall spatial difference of carrying capacity in Anhui Province showed an increasing trend from 2011 to 2018. Furthermore, the slightest difference within the subregion was in the north of Anhui Province, while the largest was in the south. The most significant difference between the subregions was between the south and the north of Anhui Province. The primary source of carrying capacity spatial difference in Anhui Province was from the difference between subregions. The results of the case study suggested that the method proposed in this paper are conducive to the early find of possible disadvantages of spatial equilibrium and can effectively identify the main source of regional spatial difference in water resources carrying capacity, which means that the method can be widely applied to similar issues.
Introduction
As essential natural resources and strategic economic resources, water resources play an important role in maintaining human survival and sustainable development of economic and social. Since the 20th century, with the rapid development of the economy, the problem of water resources security has become increasingly prominent, which has attracted the great attention of governments around the world. How to measure water safety is one of the key issues of water safety research. The concept of water resources carrying capacity was proposed in this situation, which refers to the maximum support capacity of regional water resources for economic and social development under specific economic conditions, technical level, and the premise of maintaining a good water ecological environment system. As an important indicator of water resources security and regional sustainable development, the water resources carrying capacity has attracted significant attention from the government and scientific workers. How to coordinate the relationship between the rapidly developing social economy and the limited water resources carrying capacity is an important topic related to the comprehensive, coordinated and sustainable development of a region. The relevant research on water resources carrying capacity has become the focus and hot spot in the current water resources research, which is of great significance to the measure of regional water resources security and the optimal allocation of water resources (Jin et al., 2012; Jin et al., 2019). At present, most of the researches on water resources carrying capacity focus on the evaluation. For example, Peng et al., (2021) used cloud model for index weight and comprehensive evaluation calculation to evaluate the water resources carrying capacity in the karst area; Wang et al., (2021) combined the improved fuzzy comprehensive evaluation method and the system dynamics model to evaluate the water resources carrying capacity of Changchun; Wu et al., (2020) established a water resources carrying capacity evaluation model based on the multi-dimensional cloud model and risk matrix coupling; Cui et al. (2018) used the improved entropy method to determine the index weight and established the water resources carrying capacity evaluation model by Set Pair Analysis (SPA) method. All these evaluation problems involve an important problem, which is the determination of index weights.
Weight refers to the relative importance of a certain factor or indicator. The value of the index weight represents the importance of the index relative to the evaluation object. Scientific and reasonable determination of the weight value is the key to obtaining reasonably and credible evaluation results. According to the definition of weight in Weiss dictionary, the weight has the properties of randomness and uncertainty (Wang and Zhang, 1993). With the different influences of the system, different weights should be assigned to the index. In the existing water resources carrying capacity evaluation research, the most commonly used method to determine the weight is the Analytic Hierarchy Process (AHP) method (Zhou et al., 2017). For the traditional AHP method, once the judgment matrix which reflects the relative importance of index is determined, the weights calculated by AHP are consistent regardless of the actual values of each index. In other words, the traditional AHP method does not consider the impact of the changing index values on the index weights, which is bound to affect the accuracy of the evaluation results (Li et al., 2009). It is necessary to study the effect of the index value on the index weight. This paper, therefore, attempts to revise the index weight determined by AHP according to the data information provided by the index value, hoping that the weights can reflect both the importance to the index and the dynamic characteristics of the data.
In addition, on the summary of the current research results, it is found that due to the uneven spatial distribution of water resources in China, the water resources carrying capacity also varies in different regions. The mismatch between the distribution of water resources and the layout of human life and productivity has become an important restriction factor troubling the sustainable development of regional social and economic (Jiang and Fu, 2010). The ecological civilization construction proposes that the spatial distribution of water resources should be regulated following the principle of a balanced economy, society, resources, and environment. Thus, a new water control policy called “spatial equilibrium” was put forward in China, aiming to promote the coordinated development of the economy, society, resources, and environment through reasonable water resource allocation. This leads to the gradually increasing attention of Chinese scholars in recent years (Hong et al., 2017; Zuo et al., 2018; Jin et al., 2021). Currently, most studies on the spatial balance of water resources are qualitative research, and the Gini coefficient is used to measure the spatial balance of water resources in the few quantitative studies (Fan et al., 2020; Xia et al., 2020; Jin et al., 2021). However, as a comprehensive index, the Gini coefficients can only reflect the overall equilibrium of the whole region. It is difficult to quantitatively characterize the equilibrium of the subregions and identify the source of regional differences. To find the weak points of regional water resources spatial balance and formulate targeted water resources control policies, this paper introduces the Gini coefficient decomposition method proposed by Dagum, which can quantitatively identify the difference between and within subregions, to identify the main source of spatial differences in regional water resources carrying capacity.
To sum up, the existing studies have the following limitations: 1) the impact of the changing index values on the index weights is often ignored; 2) the quantitative research on the spatial equilibrium of water resources carrying capacity is rare; 3) the existing methods for spatial equilibrium analysis of water resources are difficult to quantitatively identify the sources of regional differences. Therefore, this paper aims to propose a new weight determination method that takes the impact of index value on index weight into account and to introduce a new approach to the decomposition of the Gini coefficient so as to analyze the spatial difference of water resources carrying capacity and recognize the source of difference. This study is expected to provide data reference for analyzing the dynamic distribution characteristics of regional water resources carrying capacity and provide a theoretical basis for the formulation of water resources control policies.
Methodology
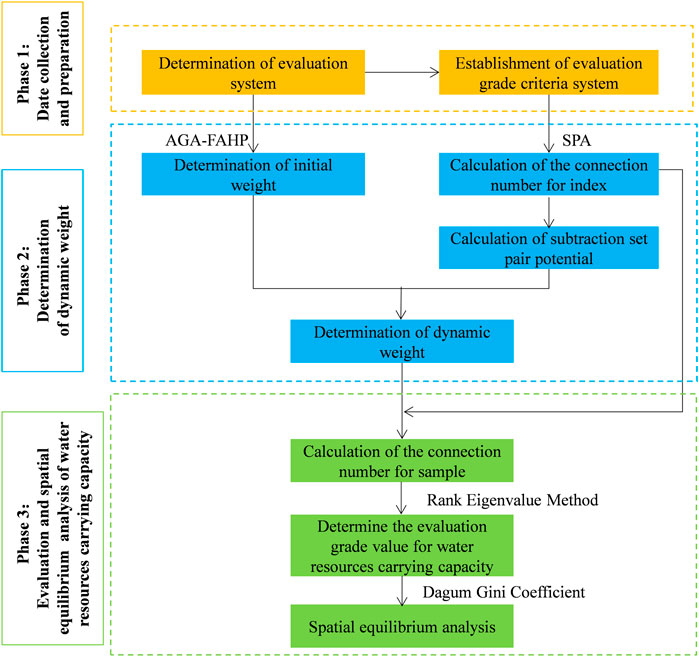
The research framework is shown in Figure 1. Overall, the research process consists of three phases: data collection and preparation, determination of dynamic weight, evaluation, and spatial equilibrium analysis of water resources carrying capacity. In phase 1, the regional water resources carrying capacity evaluation index system was established through the mechanism analysis of the carrying capacity. Then the required data was collected from the water resources bulletin and statistical Yearbook. And the evaluation grade criteria system was established by the combination of the regional characteristics and expert opinions. In phase 2, the initial weight was determined by The Accelerating Genetic Algorithm based Fuzzy Analytic Hierarchy Process (AGA-FAHP) firstly. Then, the Set Pair Analysis (SPA) method was used to calculate the connection number and Subtraction Set Pair Potential (SSPP) for each index. The initial weight was corrected by the SSPP so as to obtain the dynamic weight. In phase 3, the connection number for index was integrated into the connection number for sample by the dynamic weight. Then the rank eigenvalue method was used to evaluate the water resources carrying capacity. On this basis, the Dagum Gini coefficient decomposition method was applied to analyze and evaluate the spatial equilibrium status of the study region.
Determination of Dynamic Weight
Determination of Initial Weight
The Accelerating Genetic Algorithm based Fuzzy Analytic Hierarchy Process (AGA-FAHP) (Jin et al., 2004; Zhou et al., 2017) is used to determine the initial weight of index {wj | j = 1, 2, …, n}, where n is the number of indices. By comparing the relative importance of the index in the evaluation index system, the fuzzy complementary judgment matrix P= (pij) n×n can be established. It should meet the following conditions: 0 ≤ pij ≤ 1, pij +pji = 1. pij is the relative importance between index i and index j. If pij > 0.5, it means that index i is more important than index j. The larger pij is, the more important index i is. If pij = 0.5, it means that index i is as important as index j. If pij < 0.5, it means that index j is more important than index i (Zhou et al., 2017; Chen et al., 2019). If P can meet the Equation 1, it is considered to be satisfactory consistency. Otherwise, P needs to be revised (Jin et al., 2004).
where wi is the initial weight of index i; wj is the initial weight of index j.
The revised judgment matrix is denoted as Q=(qij)n×n, and the weights of elements in Q are still recorded as {wj | j = 1, 2, …, n}. In addition, Q meets the Eq. 2 (Jin et al., 2004).
where CIC(n) is the consistency index coefficient; d is a non-negative parameter and can be selected from 0 to 0.5 for guaranteeing the important relationship between two indices (Jin et al., 2004; Cui et al., 2018). The initial weight {wj | j = 1, 2,…, n} can be obtained by solving the Eq. 2 using the Accelerating Genetic Algorithm (AGA) (Jin et al., 2008a).
Calculation of Subtraction Set Pair Potential
Contact number is a structural function proposed by Zhao Keqin to describe the uncertainty of the study subject (Zhao, 1994). Subtraction set pair potential (SSPP), as an adjoint function of connection number, was put forward by Jin et al. (2018) to indicate the development trend of the research object. For a three-element connection number u = a+bI+cJ, the corresponding SSPP is as follows (Jin et al., 2018):
where S(u) is the three-element SSPP; a, b and c represent the similar degree, different degree, and opposite degree, respectively, all ranging from 0 to 1 and a+b + c = 1; I is the different degree coefficient; J is the opposite degree coefficient. According to the principle of mean division, the SSPP can be divided into five potential levels (Jin et al., 2018):
When a specific evaluation index is in inverse potential or partial inverse potential, it is considered that the index is the main reason for a poor evaluation grade result, which can be diagnosed and identified as the vulnerability indicator of the evaluation object. The aspect reflected by this index should be the focus of regulation and control in the future (Jin et al., 2018).
Assuming that the sample data X = {xij| i = 1, 2,…,m; j = 1, 2,…, n } and its evaluation standard s = {skj| k = 0,1,2,3; j = 1, 2,…, n }(where m is the number of samples and n is the number of indices), the connection number uij of the sample value xij can be calculated by Eqs 5–10 (Zhao, 1994; Jin et al., 2008b; Jin et al., 2018).
where i = 1, 2, …, m, m is the number of samples; j = 1, 2, …, n, n is the number of indices; k = 1, 2, …, l, l is the number of grades; aij, bij, and cij represent the similar degree, different degree and opposite degree of uij; I is the different degree coefficient; J is the opposite degree coefficient; uijk represents the extend of xij belongs to the grade k, uijk∈[−1,1]; vijk is the linear transformation result of uijk. When l = 3, uijk can be calculated by the Eqs 5–10 (Jin et al., 2008b; Jin et al., 2018). If the evaluation index’s value increases with the evaluation grade k, it is called Positive Index (PI); on the contrary, it is called Negative Index (NI).
where s0j∼s3j are the critical values of evaluation grades (Figure 2.); xij is the value of sample i index j; uijk refers to the degree that xij belongs to grade k. The closer the uijk is to 1, the higher the degree that xij belongs to grade k.
Calculation of Dynamic Weight
When Sij < −0.2, it is considered that the index j is one of the main reasons for a poor evaluation grade result of sample i. To highlight its importance to the evaluation results, its weight should be revised. For the evaluation of water resources carrying capacity, the revised weights are conducive to the detection of overload conditions as soon as possible to timely early warning and control. To this end, the method for a revision to the weights is proposed. When Sij < −0.2, put the index j into set A. Otherwise, put the index j into set B. The Eq. 11 is used to revise the initial weights (Xu et al., 2015). The revised weights are called the dynamic weights.
where Sij refers to the SSPP of sample i index j; w′ij refers to the dynamic weight of sample i index j; wj refers to the initial weight of index j calculated by AGA-FAHP. It can be proven that w′ij∈[0, 1] and
When j∈B,
For any i, there is
Determination of Evaluation Grade Value for Water Resources Carrying Capacity
The connection number of sample i is calculated by the Eq. 13 (Jin et al., 2008b; Jin et al., 2018).
where uij is the connection number of sample i; aij, bij and cij represent the similar degree, different degree, and opposite degree of uij, whose calculation method are shown in Eq. 6; I is the different degree coefficient; J is the opposite degree coefficient; w′ij is the dynamic weight of sample i index j;
The rank eigenvalue method (Chen et al., 2019) is used to calculate the evaluation grade value of sample i.
where hi refers to the evaluation grade value of sample i, hi∈[1, 3]. It can be seen by calculation that for any i, when xij = s0j, hi = 1; when xij = s1j, hi = 1.5; when xij = s2j, hi = 2.5; when xij = s3j, hi = 3. Accordingly, the grading standard is determined: when hi∈[1, 1.5), the sample i belongs to grade I (Loadable); when hi∈[1.5, 2.5], the sample i belongs to grade II (Critical); when hi∈(2.5, 3], the sample i belongs to grade III (Overloaded).
Spatial Equilibrium Analysis for Water Resources Carrying Capacity
The Gini coefficient is a commonly used indicator to measure the income gap of a country or region. It is also used for equilibrium measures in other aspects such as resources allocation with the development of the method. However, the Gini coefficient can only reflect the overall equilibrium of the whole region. It is difficult to quantitatively characterize the equilibrium of the subregions and identify the source of regional differences. To solve this problem, Dagum (1997) put forward a new method to decompose the Gini coefficient into three components: the Gini inequality within the subregions, the net extended Gini inequality between the subregions, and the intensity of transvariation between subregions. The Gini inequality within the subregions reflects the equilibrium of subregions, and the source of regional differences can be identified by comparing the contribution of the three components. At present, this method has been applied to measure regional economic differences (Wang and Xu, 2020), carbon dioxide emissions differences (Li and Jiang, 2017), etc. The source of regional differences can be identified according to the results calculated by this method. Therefore, this paper introduces the Dagum Gini coefficient method to measure the spatial difference within subregions and between subregions in water resources carrying capacity.
Assuming that there are M cities within the study region. The study region is divided into K subregions, and the number of cities within the a-th subregion was recorded as ma (a = 1, 2, …, K,
where G refers to the total Gini coefficient of the study region; the smaller the G values are, the better the spatial equilibrium of the water resources in this region is; M is the number of cities in the study region; K is the number of subregions; ma is the number of cities in a-th subregion; mc is the number of cities in c-th subregion;
According to the Dagum Gini coefficient decomposition method (Dagum, 1997), the total Gini coefficient can be decomposed into three components: the Gini inequality within the subregions (Gw), the net extended Gini inequality between the subregions (Gnb), and the intensity of transvariation between subregions (Gt) (Dagum, 1997).
To decompose the total Gini coefficient, the average value of water resources carrying capacity in each sub-region is needed to be calculated and sorted from small to large. Make sure that
where Gaa refers to the Gini ratio within the a-th subregion; Gac refers to the extended Gini ratio between the a-th subregion and c-th subregion; pa refers to the a-th subregion share; sa refers to the a-th subregion water resources carrying capacity evaluation grade value share;
Case Study
Study Area
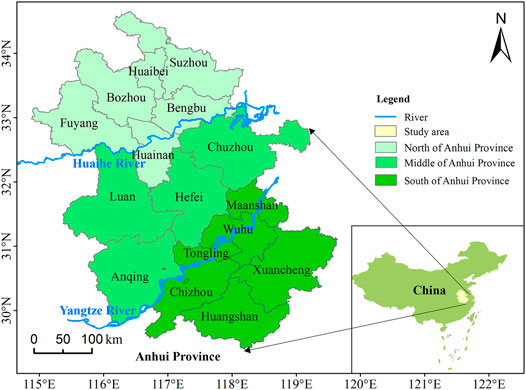
Anhui Province is located in the east of China. With the Yangtze River and Huaihe River crossing the province, Anhui Province is divided into three regions: the north of Anhui Province, the middle of Anhui Province, and the south of Anhui Province (Figure 3). Anhui Province belongs to a transition zone between the warm temperate and subtropical zones in terms of climate. The Huaihe River is the north-south geographical boundary of China. Therefore, the geographical and climatic differences between the north and south of Anhui Province are significant. For example, the precipitation in the south of Anhui Province is significantly more than that in the north of Anhui Province. On the contrary, the population in the north of Anhui Province is significantly more than that in the south of Anhui Province. Taking 2018 as an example, the annual precipitation was 45.07 billion m3 in the north of Anhui Province and 64.98 billion m3 in the south of Anhui Province, while the permanent population was 28.26 million in the north of Anhui Province and 13.24 million in the south of Anhui Province. Obviously, the north of Anhui Province has raised a larger population with fewer water resources. The regional difference between water supply and demand is obvious. Therefore, Anhui Province is selected as a typical study area to analyze the dynamic evolution and spatial differences of water resources carrying capacity. The research results are hoped to provide a theoretical basis for the scientific and reasonable determination of social and economic layout and the formulation of water resources control policies.
Determination of Evaluation Indicator System and Grade Criteria
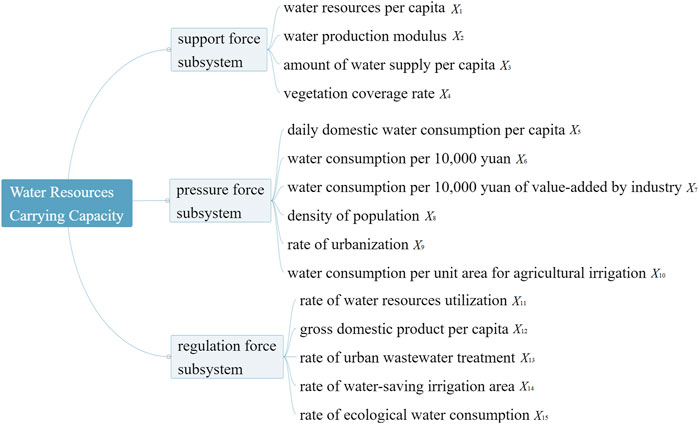
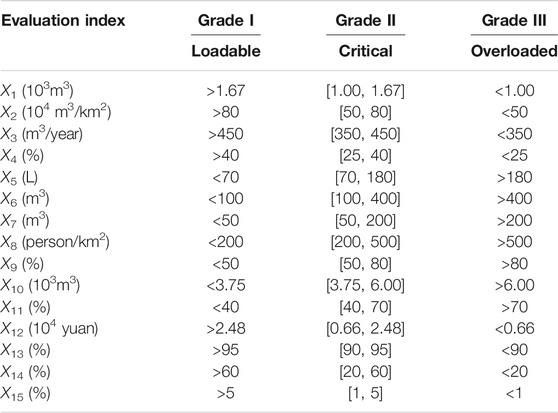
Through system mechanism analysis, the water resources carrying capacity evaluation system is divided into three subsystems: water resources carrying support force subsystem, water resources carrying pressure force subsystem, and water resources carrying regulation force subsystem (Li et al., 2018). On this basis, through the system analysis, expert consultation, and the current research results (Cui et al., 2018; Wu et al., 2020), the index system of water resources carrying capacity in Anhui Province (Figure 4) was established, and the classification standards corresponding to each index (Table 1) were determined. In the support force subsystem, water resources per capita and water production modulus reflect the amount of regional water resources; the amount of water supply per capita reflects the water supply capacity; the vegetation coverage rate reflects water conservation capacity. In the pressure force subsystem, daily domestic water consumption per capita, water consumption per 10,000 yuan, water consumption per 10,000 yuan of value-added industry, and water consumption per unit area for agricultural irrigation reflect regional water use efficiency; density of population and rate of urbanization reflect the size of water supply. In the regulation force subsystem, the rate of water resources utilization reflects the proportion of regional water resources being used to maintain human economic and life; gross domestic product per capita reflects regional economic development level, which is related to the level of water-saving and investment in pollution control; rate of urban wastewater treatment reflects the level of sewage treatment; rate of water-saving irrigation area reflects the level of water-saving in agriculture; rate of ecological water consumption refers to the proportion of the ecological water supplied by artificial measures in total water consumption. Meanwhile, according to the statistics of the Anhui Province Statistical Yearbook (2012–2019) and the Anhui Province Water Resources Bulletin (2011–2018), the evaluation samples were obtained.
Results and Discussion
Calculation of the Weights
The fuzzy complementary judgment matrix P was obtained by comparing the importance of three subsystems.
Similarly, the fuzzy complementary judgment matrix P1, P2, P3 of the three subsystems was obtained by comparing the importance of indices.
The initial weights were determined by the AGA-FAHP method introduced in 2.1.1. The weights of the three subsystems are 0.4, 0.4, 0.2. The weights of indices X1–X4 in the support force subsystem are 0.365, 0.246, 0.254, 0.136. The weights of indices X5–X10 in pressure force subsystem are 0.077, 0.195, 0.190, 0.211, 0.129, 0.198. The weights of indices X11–X15 in regulation force subsystem are 0.290, 0.211, 0.090, 0.241, 0.169.
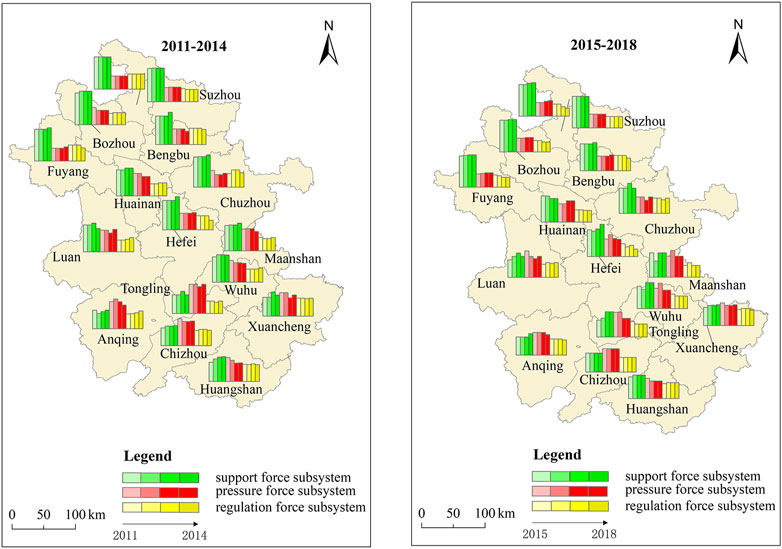
According to the method described in 2.1.2 and 2.1.3, the corresponding SSPP and dynamic weights can be calculated. Due to the large number of data, the data is not listed here. Only the dynamic weights of the three subsystems are plotted in Figure 5 to compare the importance of the three subsystems in different time and space.
As shown in Figure 5, in terms of time, the weight of each subsystem in the north of Anhui Province varies very little, while the middle of Anhui Province and the south of Anhui Province change slightly. In terms of space, the subsystems’ weights of different cities vary greatly: 1) The weights of support subsystems in the north of Anhui Province are significantly greater than those of the other two subsystems. This shows that the support force subsystem affects the water resources carrying capacity greater. This is mainly due to the relative lack of water resources in the north of Anhui Province. Water resources support force is the main restriction factor of water resources carrying capacity. 2) Compared with the north of Anhui Province, the weights of different cities are quite different in the middle and south of Anhui Province. For example, Hefei and Chuzhou in the middle of Anhui Province are greatly influenced by the support subsystem, while Lu’an and Anqing are relative evenly affected by the support force and pressure force; Tongling and Chizhou in the south of Anhui Province are more affected by pressure force subsystems, while Wuhu and Ma’anshan are more affected by the support force subsystem.
The Results of Water Resources Carrying Capacity Evaluation
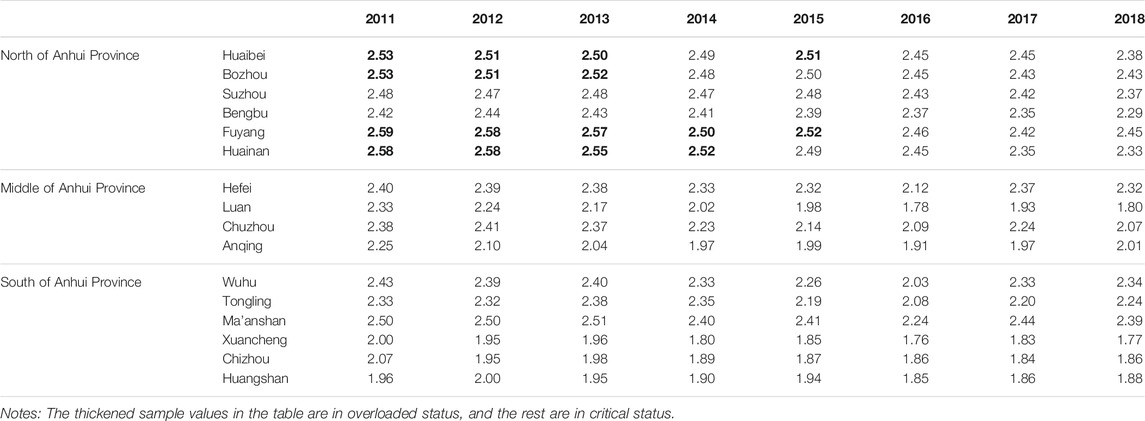
The evaluation grade values of water resources carrying capacity for 16 cities in Anhui Province from 2011–2018 were evaluated by Eq. 14, as shown in Table 2.
According to Table 2, in 2011–2018, except for Huaibei, Bozhou, Fuyang, and Huainan, most cities in Anhui Province were in critical status. This result is consistent with the conclusion of Document (Li et al., 2018) that the comprehensive evaluation grade of water resources carrying capacity in Anhui Province from 2005 to 2015 was near Grade 2.
In order to study the impact of dynamic weight on the evaluation results, the evaluation results of water resources carrying capacity determined by dynamic weight were compared with the evaluation results determined by the initial weight. Due to the space limitation, only the comparison of 16 cities in 2018 and the comparison of capital city Hefei from 2011 to 2018 (see Figure 6) are listed here. It is found that the evaluation grade values obtained by the dynamic weights are larger than those obtained by the initial weights. That is, the water resources carrying capacity status evaluated by the dynamic weights are worse, which is conducive to the early identification of adverse situations. Obviously, this is better for taking measures as early as possible to prevent further deterioration of the water resources carrying capacity.

FIGURE 6. Comparison of the evaluation results by dynamic weights and initial weights. (A) Comparison of water resources carrying capacity evaluation results in 2018 under different weights. (B) Comparison of water resources carrying capacity evaluation results in Hefei from 2011 to 2018 under different weights.
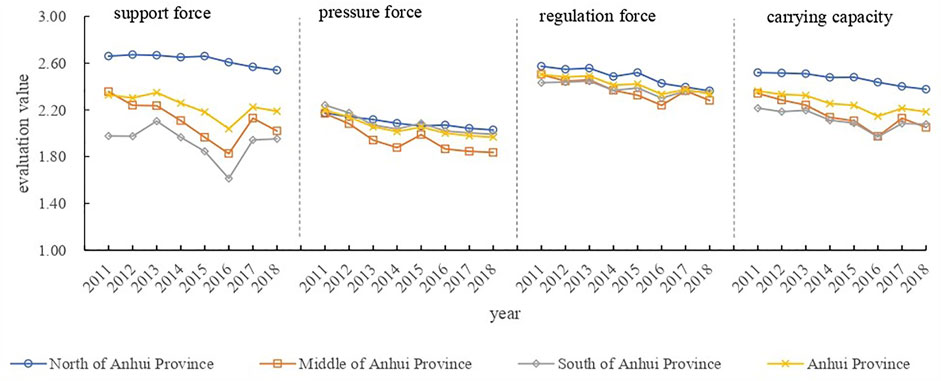
To further explore the temporal and spatial changes of the water resources carrying capacity in Anhui Province, the mean evaluation values of the water resources carrying capacity system and its subsystems in Anhui Province and its subregions from 2011 to 2018 are drawn in Figure 7. According to the principle of mean division, the water resources carrying capacity evaluation results of 16 cities in Anhui Province from 2011 to 2018 are drawn in Figure 8.
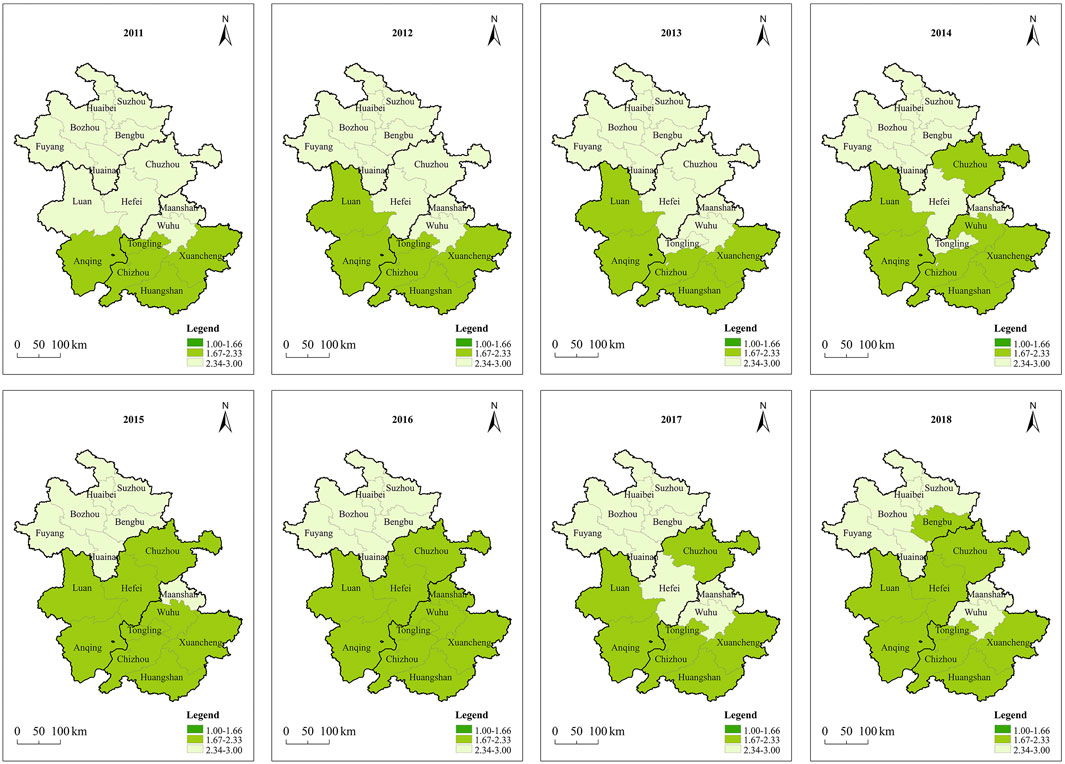
FIGURE 8. Temporal and spatial changes of the water resources carrying capacity in Anhui Province from 2011 to 2018.
From Figure 7, we can see that: 1) From a spatial perspective, the overall spatial trend of water resources carrying capacity in Anhui Province from 2011 to 2018 is as follows: south > middle > north. The evaluation results of the three subsystems show that the results of three subregions in Anhui Province differed significantly in the support force, while the pressure and regulation force differences were relatively slight. The evaluation results in the north of Anhui Province were the worst both the water resources carrying capacity system and the three subsystems. 2) In terms of time, the water carrying capacity in the north of Anhui Province has improved year by year. The change trends of the middle and south of Anhui Province were roughly the same as the whole province. From 2011 to 2018, the water resources carrying capacity of Anhui province in 2016 was the largest. 3) Through the Anhui Province Water Resources Bulletin (2016), it is found that the amount of water resources in Anhui Province in 2016 were 73.9% more than that of the annual average. At the same time, due to the uneven spatial distribution of water resources in Anhui Province, compared with the annual average, the increased water resources in 2016 was concentrated in the middle and south of Anhui Province, while the amount of water resources in the north of Anhui Province changed little compared with the annual average. This is consistent with the calculation results that the water resources carrying capacity in the middle and south of Anhui Province in 2016 were significantly better than in other years, while the water resources carrying capacity in the north of Anhui Province was not significantly improved in 2016. Therefore, the evaluation results of this paper are in line with the actual situation.
Combined with Table 2 and Figure 8, it is found that in the north of Anhui Province, the water carrying capacity evaluation results vary little, in which the city with the best water resources carrying capacity is Bengbu. In the middle of Anhui Province, the water resources carrying capacity of Lu’an and Anqing is obviously better than that of Hefei and Chuzhou. In the south of Anhui Province, Chizhou, Xuancheng, and Huangshan are significantly better than the other three cities. Compared with the middle and south of Anhui Province, although the water resources carrying capacity in the north of Anhui Province was poor, the water resources space equilibrium was relatively good.
Spatial Equilibrium of Water Resources Carrying Capacity Analysis
To further analyze the spatial balance of water resources in Anhui Province and explore the source of regional difference in water resources carrying capacity, the Gini coefficients of water resources carrying capacity in 3 subsystems from 2011 to 2018 were calculated by the method of Dagum Gini coefficient and its decomposition. The results are shown in Figure 9 for facilitated observation and analysis. The total Gini coefficients in Figure 9A were calculated by the Eq. 15. The contribution rate of Gw, Gnb, and Gt in Figure 9B represent the proportions of the three components Gw, Gnb, and Gt in the total Gini coefficient. The Gini coefficients within subregions in Figure 9C and the extended Gini coefficients between subregions in Figure 9D were calculated by the Eqs 20, 21.
(1) The overall differences of water resources carrying capacity in Anhui Province. As can be seen from Figure 9A, the total Gini coefficient of water resources carrying capacity in Anhui Province shows an increasing trend from 2011 to 2016, which means the overall difference of water resources carrying capacity in Anhui Province was growing from 2011 to 2016. Then, the overall difference of water resources carrying capacity in Anhui Province was reduced from 2017 to 2018. In addition, it can be seen from Figure 9B that although the contribution rate fluctuated with time, the contribution rate of Gnb is significantly greater than the other two, which means that the spatial differences of water resources carrying capacity in Anhui Province mainly came from the differences between subregions. Therefore, in order to reduce the spatial differences of water resources carrying capacity in Anhui Province, effective measures must be formulated to reduce the differences in water resources carrying capacity between subregions. The Gini coefficients of three subsystems were calculated to further analyze the internal reasons for the uneven spatial distribution of water resources carrying capacity in Anhui Province (Figure 9A). The calculation results show that the spatial differences of the three subsystems are ranked as follows: support force subsystem > the average of three subsystems > pressure force subsystem > regulation force subsystem. This is also consistent with the intuitive results presented in Figure 7. According to this, it can be inferred that the uneven distribution of water resources support force is the main reason for the uneven distribution of water resources carrying capacity in Anhui Province. To improve the spatial equilibrium of water resources carrying capacity in Anhui Province, it is urgent to formulate and implement relevant policies and measures to reduce the regional differences of water resources support force. For example, carry out a water diversion project to reduce the difference in water resources between cities.
(2) The differences of water resources carrying capacity within subregions in Anhui Province. Figure 9C reflects the differences and evolution trends of water resources carrying capacity in the three subregions of Anhui Province. In general, the most significant difference within the subregions was in the south of Anhui Province, while the smallest was in the north of Anhui Province. The Gini coefficients of water resources carrying capacity within the middle of Anhui Province, which increased gradually from 2011 to 2018, were between the other two subregions and close to the average Gini coefficients of three subregions. Combined with the evaluation results of water resources carrying capacity, we can know that the reason why the difference within the subregions was the largest in the south of Anhui Province was that the water resources carrying capacity of Huangshan, Xuancheng, and Chizhou were obviously better than Wuhu, Tongling and Ma’anshan. In the middle of Anhui Province, the water resources carrying capacity of Lu’an, Chuzhou, and Anqing had improved significantly from 2011 to 2018, while the capital city Hefei changed little, which led to the gradual increase of difference within the middle of Anhui Province. In the north of Anhui Province, the differences within regions were minor, but its water resources carrying capacity was poor. That is, the north of Anhui Province was in a low-level equilibrium state.
(3) The differences of water resources carrying capacity between subregions in Anhui Province. Figure 9D reflects the difference of water resources carrying capacity between the three subregions in Anhui Province over time. The extended Gini coefficients between south and north are always more significant than the average of extended Gini coefficients between subregions. In contrast, the extended Gini coefficients between the south and middle are always smaller. It can be seen from Figure 9D that the differences between the south and north of Anhui Province (the line of South-North in Figure 9D) were the largest. This is consistent with the perception earned by experience. However, for the difference between the middle and north of Anhui Province (the line of Middle-North in Figure 9D) and the difference between the south and middle of Anhui Province (the line of South-Middle in Figure 9D), it is hard to distinguish which one was larger according to experience. It can be known from Figure 9D that from 2011 to 2018, the differences between the south and middle of Anhui Province were more minor during most of the time. In terms of time, the extended Gini coefficients between the south and middle of Anhui Province show a different trend from others. For example, in 2016, the difference between the south and middle of Anhui Province was the smallest during 2011–2018, while the difference between the middle and north of Anhui Province and the difference between the south and north of Anhui Province were the largest. The reason can be found by analyzing the water resources carrying capacity evaluation results. Compared with 2015, the water resources support force in the north of Anhui Province and the middle of Anhui Province increased significantly in 2016, while the support force changed little in the north. Meanwhile, the pressure force in the middle of Anhui Province decreased, while the pressure force changed little in the other two subregions. Therefore, the key point of improving the spatial equilibrium of water resources carrying capacity in Anhui Province is to reduce the differences between the north of Anhui Province and the other two subregions.
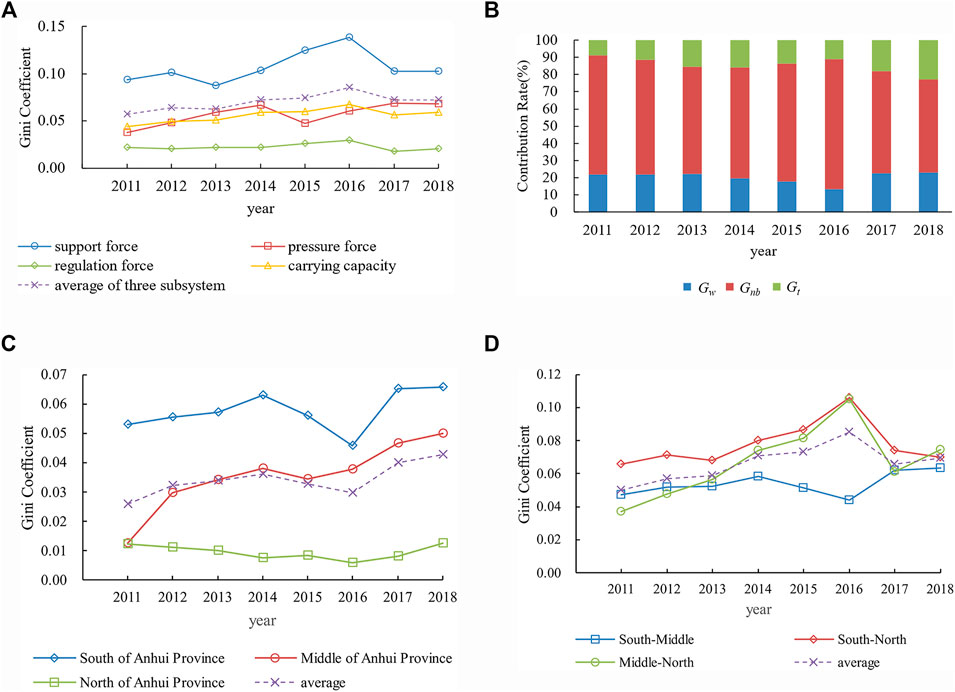
FIGURE 9. The result of Dagum Gini coefficient and its decomposition. (A) The total Gini coefficient of Anhui Province from 2011 to 2018. (B) The contribution rate of Gw, Gnb and Gtin from 2011 to 2018. (C) The Gini coefficient within subregions in Anhui Province from 2011 to 2018. (D) The extended Gini coefficient between subregions in Anhui Province from 2011 to 2018.
Conclusion and Suggestions
Water resources carrying capacity is an important indicator to measure the sustainable development capacity of regional water resources. The study on water resources carrying capacity is significant to ensure the healthy and sustainable development of water resources. Based on the methods of AHP and SSPP, this paper put forward a new method to determine the dynamic weight of the index. On this basis, a dynamic evaluation model of the regional water resources carrying capacity was established. Furthermore, the spatial equilibrium status of water resources carrying capacity in Anhui Province was analyzed according to the Dagum Gini coefficient. This study is helpful for the government to recognize the situation and regional difference of water resources carrying capacity in Anhui Province, and is helpful for the government to find the shortcomings of water resources carrying capacity in Anhui Province and make individualized policies for Anhui Province. On the other hand, this study complements the existing research and provides a relevant theoretical basis for other researchers to explore the improvement of regional water resources carrying capacity. The main conclusions and suggestions are as follows:
(1) Compared with the evaluation results calculated by the initial weights, the evaluation grade values calculated by the dynamic weights were larger. This is conducive to the early identification of adverse situations so that to take countermeasures as soon as possible.
(2) Compared with the traditional Gini coefficient, Dagum Gini coefficient and its decomposition method can not only analyze the spatial equilibrium of the research area but also analyze the main sources of differences, which is conducive to the formulation of targeted policies to improve the overall spatial equilibrium.
(3) Overall, the water resources carrying capacity in Anhui Province showed a trend of improvement from 2011 to 2018. However, the overall situation of water resources carrying capacity in Anhui Province was poor. Most of the cities were in the critical state (Grade II), while four cities (Huaibei, Bozhou, Fuyang, and Huainan) in the north of Anhui Province were in the state of overloaded some years. Therefore, the government must make targeted measures to improve the water resources carrying capacity in Anhui Province. For example, the water resources support force in the north of Anhui Province should be improved by developing unconventional water sources, such as reclaimed water and rainwater; In the south of Anhui Province, water resources pressure force should be reduced by developing water-saving irrigation to reduce the water consumption for irrigation.
(4) There are obvious regional differences in water resources carrying capacity from south to north in Anhui Province. In general, the distribution trend of water resources carrying capacity in Anhui Province is as follows: south>middle>north. However, the distribution trend of the spatial equilibrium of water resources carrying capacity was the opposite: north>middle>south. For the north of Anhui Province, although its spatial equilibrium was better than the others, its water resources carrying capacity was poor, which means that the equilibrium state in the north of Anhui Province was at a low level. The main reason for the regional difference of water resources carrying capacity in Anhui Province is the uneven distribution of water resources support force. To alleviate the regional differences in water resources, the feasibility of the south-to-north water diversion project should be accelerated. This research result confirms the necessity of the Yangtze-to-Huaihe water diversion project, which is under construction in Anhui Province.
(5) The analysis found that from 2011 to 2018, the spatial equilibrium of water resources carrying capacity in Anhui Province showed an increasing trend in general, and the spatial difference of water resources carrying capacity was mainly due to the differences between subregions. The most significant difference between subregions was between the south and north of Anhui Province, while the smallest was between the south and middle of Anhui Province. Therefore, the urgent priority of water resources management in Anhui Province is to improve the water resources carrying capacity in the north of Anhui Province, so as to enhance the overall level of water resources carrying capacity in Anhui Province and narrow the spatial difference of water resources carrying capacity in Anhui Province.
Data Availability Statement
The raw data supporting the conclusion of this article will be made available by the authors, without undue reservation.
Author Contributions
RZ: Methodology, Formal analysis, Writing–original draft. JJ: Methodology, Funding acquisition. YC: Writing–review and editing, Funding acquisition. SN: Writing–review and editing. LZ: Writing–review and editing. LZ: Data curation. CW: Data curation, Validation. YZ: Software.
Funding
This study was financially supported by the National Key Research and Development Program of China (Grant Number 2018YFC0407206), the National Natural Science Foundation of China (Grant Number 52109009), the Natural Science Foundation of Anhui Province (Grant Number 2108085QE254), the Fundamental Research Funds for the Central Universities (Grant Numbers JZ2021HGTA0165, JZ2020HGQA0202, and JZ2021HGQB0281), the Natural Science Research Project of Colleges and Universities in Anhui Province (Grant Numbers KJ2019A0880 and KJ2019A0884). Support Program for Outstanding Young Talents of Colleges and Universities in Anhui Province (Grant numbers gxyq2020055).
Conflict of Interest
The authors declare that the research was conducted in the absence of any commercial or financial relationships that could be construed as a potential conflict of interest.
Publisher’s Note
All claims expressed in this article are solely those of the authors and do not necessarily represent those of their affiliated organizations, or those of the publisher, the editors and the reviewers. Any product that may be evaluated in this article, or claim that may be made by its manufacturer, is not guaranteed or endorsed by the publisher.
Acknowledgments
The authors would like to thank the handling editor and the reviewers for their reviews and valuable comments that significantly improved the quality of this paper.
References
Chen, M., Ning, S., Cui, Y., Jin, J., Zhou, Y., and Wu, C. (2019). Quantitative Assessment and Diagnosis for Regional Agricultural Drought Resilience Based on Set Pair Analysis and Connection Entropy. Entropy 21, 373. doi:10.3390/e21040373
Cui, Y., Feng, P., Jin, J., and Liu, L. (2018). Water Resources Carrying Capacity Evaluation and Diagnosis Based on Set Pair Analysis and Improved the Entropy Weight Method. Entropy 20, 359. doi:10.3390/e20050359
Dagum, C. (1997). A New Approach to the Decomposition of the Gini Income Inequality Ratio. Empirical Econ. 22, 515–531. doi:10.1007/978-3-642-51073-1_410.1007/bf01205777
Fan, J. W., Huang, J. L., Yuan, M. D., Zhang, X. H., and Tan, C. (2020). Analysis of Spatial Equilibrium of Water Consumption Structure in Guangzhou City. Water Resour. Prot. 36, 82–86. doi:10.3880/j.issn.1004-6933.2020.04.013
Hong, S., Song, Z., Cheng, T., and Wang, H. (2017). Spatial Matching Analysis of Water Resources in the Intake Area of South-north Water Transfer Project Based on Gini Coefficient. J. Beijing Normal Univ. (Natural Science) 53 (2), 175–179. doi:10.16360/j.cnki.jbnuns.2017.02.011
Jiang, N., and Fu, Q. (2010). Spatial Matching Analysis of Heilongjiang Province’s Water Resources Based on Gini Coefficient. J. Northeast Agric. Univ. 41, 56–60. doi:10.3969/j.issn.1005-9369.2010.05.013
Jin, J. L., Cheng, J., and Wei, Y.-M. (2008a). Forecasting Flood Disasters Using an Accelerated Genetic Algorithm: Examples of Two Case Studies for China. Nat. Hazards 44, 85–92. doi:10.1007/s11069-007-9143-0
Jin, J.-L., Wei, Y.-M., Zou, L.-L., Liu, L., Zhang, W.-w., and Zhou, Y.-l. (2012). Forewarning of Sustainable Utilization of Regional Water Resources: a Model Based on BP Neural Network and Set Pair Analysis. Nat. Hazards 62, 115–127. doi:10.1007/s11069-011-0037-9
Jin, J. L., Chen, P. F., Chen, M. L., Li, J. Q., Xu, X. Y., and Chang, T. (2019). Bibliometric Analysis of Research Progress on Water Resources Carrying Capacity Based on Knowledge Map. Water Resour. Prot. 35, 14–24. doi:10.3880/j.issn.1004-6933.2019.06.003
Jin, J. L., Shen, S. X., Li, J. Q., Cui, Y., and Wu, C. G. (2018). Assessment and Diagnosis Analysis Method for Regional Water Resources Carrying Capacity Based on Connection Number. J. North China Univ. Water Resour. Electric Power (Natural Sci. Edition) 39, 1–9. doi:10.3969/j.issn.1002-5634.2018.01.001
Jin, J. L., Wei, Y. M., and Ding, J. (2004). Fuzzy Comprehensive Evaluation Model Based on Improved Analytic Hierarchy Process. J. Hydraulic Eng. 3, 65–70. doi:10.3321/j.issn:0559-9350.2004.03.011
Jin, J. L., Wu, K. Y., and Wei, Y. M. (2008b). Connection Number Based Assessment Model for Watershed Water Security. J. Hydraulic Eng. 4, 401–409. doi:10.3321/j.issn:0559-9350.2008.04.003
Jin, J. L., Xu, X. G., Zhou, R. X., Cui, Y., Ning, S. W., Zhou, Y. L., et al. (2021). Water Resources Spatial Balance Evaluation Method Based on Connection Number and Coupling Coordination Degree. Water Resour. Prot. 37, 1–6. doi:10.3880/j.issn.1004-6933.2021.01.001
Li, H., Jin, J. L., Wu, C. G., and Zhang, L. B. (2018). Dynamic Evaluation and Diagnostic Analysis for Water Resources Carrying Capacity in Anhui Province Based on Connection Number. South-to-North Water Transfers Water Sci. Tech. 16, 42–49. doi:10.13476/j.cnki.nsbdqk.20180007
Li, K. G., Hou, K. P., and Li, W. (2009). Research on Influences of Factors Dynamic Weight on Slope Stability. Rock Soil Mech. 30, 492–496. doi:10.3969/j.issn.1000-7598.2009.02.036
Li, R., and Jiang, X.-T. (2017). Inequality of Carbon Intensity: Empirical Analysis of China 2000-2014. Sustainability 9 (5), 711. doi:10.3390/su9050711
Peng, T., Deng, H., Lin, Y., and Jin, Z. (2021). Assessment on Water Resources Carrying Capacity in Karst Areas by Using an Innovative DPESBRM Concept Model and Cloud Model. Sci. Total Environ. 767, 144353. doi:10.1016/j.scitotenv.2020.144353
Wang, F., and Zhang, Y. L. (1993). Investigation about the “Weight” and the Method of its Distribution. Syst. Eng. 5, 11–14.
Wang, G., Xiao, C., Qi, Z., Meng, F., and Liang, X. (2021). Development Tendency Analysis for the Water Resource Carrying Capacity Based on System Dynamics Model and the Improved Fuzzy Comprehensive Evaluation Method in the Changchun City, China. Ecol. Indicators 122, 107232. doi:10.1016/j.ecolind.2020.107232
Wang, X., and Xu, X. H. (2020). Spatial-temporal Evolution and Regional Disparity of Economic High-Quality Development in the Yangtze River Economic belt. Econ. Geogr. 40 (3), 5–15. doi:10.15957/j.cnki.jjdl.2020.03.002
Wu, C., Zhou, L., Jin, J., Ning, S., Zhang, Z., and Bai, L. (2020). Regional Water Resource Carrying Capacity Evaluation Based on Multi-Dimensional Precondition Cloud and Risk Matrix Coupling Model. Sci. Total Environ. 710, 136324. doi:10.1016/j.scitotenv.2019.136324
Xia, F., Chen, Y., Dou, M., and Han, Y. P. (2020). Calculation Method and Application of Spatial Equilibrium Coefficient of Water Resources. Water Resour. Prot. 36, 52–57. doi:10.3880/j.issn.1004-6933.2020.01.008
Xu, P., Yang, S. C., Li, F., Feng, S. H., Wang, K., and Shi, F. (2015). Power Grid Security index Calculation and Display Method Based on AHP and Variable Weight Mechanism. Automation Electric Power Syst. 39, 133–140. doi:10.7500/AEPS20140728014
Zhou, R., Pan, Z., Jin, J., Li, C., and Ning, S. (2017). Forewarning Model of Regional Water Resources Carrying Capacity Based on Combination Weights and Entropy Principles. Entropy 19, 574. doi:10.3390/e19110574
Keywords: water resources carrying capacity, spatial equilibrium, dynamic weight, subtraction set pair potential, Dagum Gini coefficient, Anhui Province
Citation: Zhou R, Jin J, Cui Y, Ning S, Zhou L, Zhang L, Wu C and Zhou Y (2022) Spatial Equilibrium Evaluation of Regional Water Resources Carrying Capacity Based on Dynamic Weight Method and Dagum Gini Coefficient. Front. Earth Sci. 9:790349. doi: 10.3389/feart.2021.790349
Received: 06 October 2021; Accepted: 14 December 2021;
Published: 13 January 2022.
Edited by:
Frédéric Frappart, UMR5566 Laboratoire d'Études en Géophysique et Océanographie Spatiales (LEGOS), FranceReviewed by:
Dengfeng Liu, Xi’an University of Technology, ChinaSai Hu, Jiangsu Ocean Universiity, China
Copyright © 2022 Zhou, Jin, Cui, Ning, Zhou, Zhang, Wu and Zhou. This is an open-access article distributed under the terms of the Creative Commons Attribution License (CC BY). The use, distribution or reproduction in other forums is permitted, provided the original author(s) and the copyright owner(s) are credited and that the original publication in this journal is cited, in accordance with accepted academic practice. No use, distribution or reproduction is permitted which does not comply with these terms.
*Correspondence: Yi Cui, eWN1aUBoZnV0LmVkdS5jbg==
 Rongxing Zhou
 Juliang Jin1,2
 Yi Cui
 Shaowei Ning
 Liangguang Zhou
 Chengguo Wu
 Yuliang Zhou