 Chaoyong Wang1,2
 Zaitian Dong
 Xuehai Fu
- 1Key Laboratory of CBM Resources and Dynamic Accumulation Process, China University of Mining and Technology, Ministry of Education, Xuzhou, China
- 2School of Resources and Earth Science, China University of Mining and Technology, Xuzhou, China
- 3Nanjing Institute of Geology and Paleontology, China Academy of Sciences, Nanjing, China
- 4China Coal Education Association, Beijing, China
Marine redox conditions and their dynamic changes were a major factor that controlled the formation of black shale and caused the late Ordovician marine extinction in the Upper Yangtze Basin (South China). However, the spatiotemporal variation and potential controlling factors of marine redox conditions in this area remain unclear. We analyzed whole-rock geochemistry and pyrite sulfur isotopes (δ34Spy) of 47 shale samples from the Late Katian to Rhuddanian in a shelf-to-slope (Qianjiang Shaba section and Wc-1 well) region of northeastern Upper Yangtze Basin, and reconstructed water column redox conditions during the Late Ordovician–Early Silurian Transition. The geochemical characteristics of shale, including the ratio of elements, discriminant function and ternary diagram location in the study area suggest a passive continental margin sedimentary environment, wherein the terrigenous detritus is mainly derived from felsic igneous rocks in the upper crust, showing characteristics of near-source deposition. The redox indices (Fe speciation, Corg/P, UEF, and MoEF) showed that the development of anoxic water, especially euxinia, has obvious spatiotemporal heterogeneity. Under conditions of high availability of active organic carbon and limited sulfate supply, high active Fe input and strong biological irrigation in the shallow water area may effectively remove H2S produced by microbial sulfate reduction, conducive to the prevalence of ferruginous water columns. However, for this deep water area, the rapid accumulation rate of organic matter, decrease in dissolved Fe (caused by upwelling in the open sea), and seawater stratification (caused by the rising of sea level) promoted the development of a euxinic water column. This inference is supported by the covariant relationship between organic carbon accumulation rate, chemical index of alteration, Co × Mn, and δ34Spy. Our study highlights the potential control effects of sea level change, continental weathering and upwelling on the development of euxinic water columns.
Introduction
The paleo-ocean during the transition from the Late Ordovician to the Early Silurian (O–S) in the Upper Yangtze Basin, South China, has been widely studied with respect to the sedimentary environment (Wang et al., 2016; Li et al., 2017; Liang et al., 2017; Wu et al., 2019; Wang et al., 2021), redox conditions (Li et al., 2019; Liu et al., 2019; Wang et al., 2019), and sea level change (Wang et al., 2017; Jin et al., 2020). During this period, a set of organic-rich black shale was deposited, including the Wufeng Formation (WF, Katian—Hirnantian) and Longmaxi Formation (LMX, Hirnantian—Rhuddanian), which have become the main targets for shale gas exploration in China (Zou et al., 2016; Zou et al., 2019). Simultaneously, this period showed a series of environmental and evolutionary events, including the Gondwana glacier expansion, volcanic eruption, bio-extinction, and bio-recovery (Jablonski, 1991; Sutcliffe et al., 2000; Delabroye and Vecoli, 2010; Algeo et al., 2016), particularly the Late Ordovician bio-extinction, resulting in the disappearance of approximately 26% of families and 85% of marine life (Jablonski, 1991; Harper et al., 2014). An in-depth study of the redox conditions of black shale formation and bio-extinction confirmed that both of these may have been related to large—scale anoxic events in the ancient oceans (Liu et al., 2016; Zou et al., 2018).
The latest research on marine redox conditions in this area indicates that the source weathering intensity and effectiveness of sulfate may be the main controlling factors for the development of anoxic water columns, especially euxinia (Zou et al., 2018; Li et al., 2019; Li et al., 2021). However, because of the lack of high-resolution geochemical records, especially the lack of research evidence on paleo-ocean topography and external ocean current communication in the continental margin area, the controlling factors of redox conditions in the Upper Yangtze Basin water column need to be explored further.
In this study, the marine redox conditions, pyrite sulfur isotope (δ34Spy), and chemical weathering of the source regions of the WF—LMX Formation from Qianjiang Shaba section and Wc-1 well in the northeastern Upper Yangtze Basin were comprehensively analyzed. Combined with previously published data, including Datianba section of Xiushan County, and X3 well of Sangzhi County, our results provide new insights into the spatiotemporal evolution of euxinia in the Upper Yangtze Basin. These insights are of great significance for understanding the relationship between continental weathering, marine chemistry, and early biological evolution.
Geological Setting
Paleogeography and Lithostratigraphy
The South China Plate was formed by the Yangtze and Cathaysia Block during the O–S (Figure 1A). Palaeomagnetic data indicated that during this period, the South China Plate was located in a low-latitude area near the equator and was dominated by intraplate deformation (Figure 1A). A series of uplifts and depressions were developed (Figure 1A). The Upper Yangtze Basin was formed in the northwest part of the Yangtze Block. During the early Ordovician, this part was a craton basin extending from the northeast to the southwest. At the end of the Silurian period, it gradually transformed into a foreland basin controlled by continuous flexural subsidence (Huang et al., 2018; Huang et al., 2020). The sedimentary center is mainly located in the Yibin—Fuling—Wanzhou area in the eastern part of the Upper Yangtze Basin, surrounded by three main uplift belts: The Chuanzhong uplift to the west, Qianzhong uplift to the south, and Xuefeng uplift to the east, forming a semi—closed shallow sea connected to the South Qinling Ocean in the north (Chen et al., 2004) (Figure 1B). Further, under the influence of continuous tectonic compression, submarine highlands, such as Xiang’e, Huayinshan, and Neijiang—Zigong have developed in the basin, which indicates that the distribution of strata in this area is heterogeneous (Xi et al., 2021) (Figure 1B).
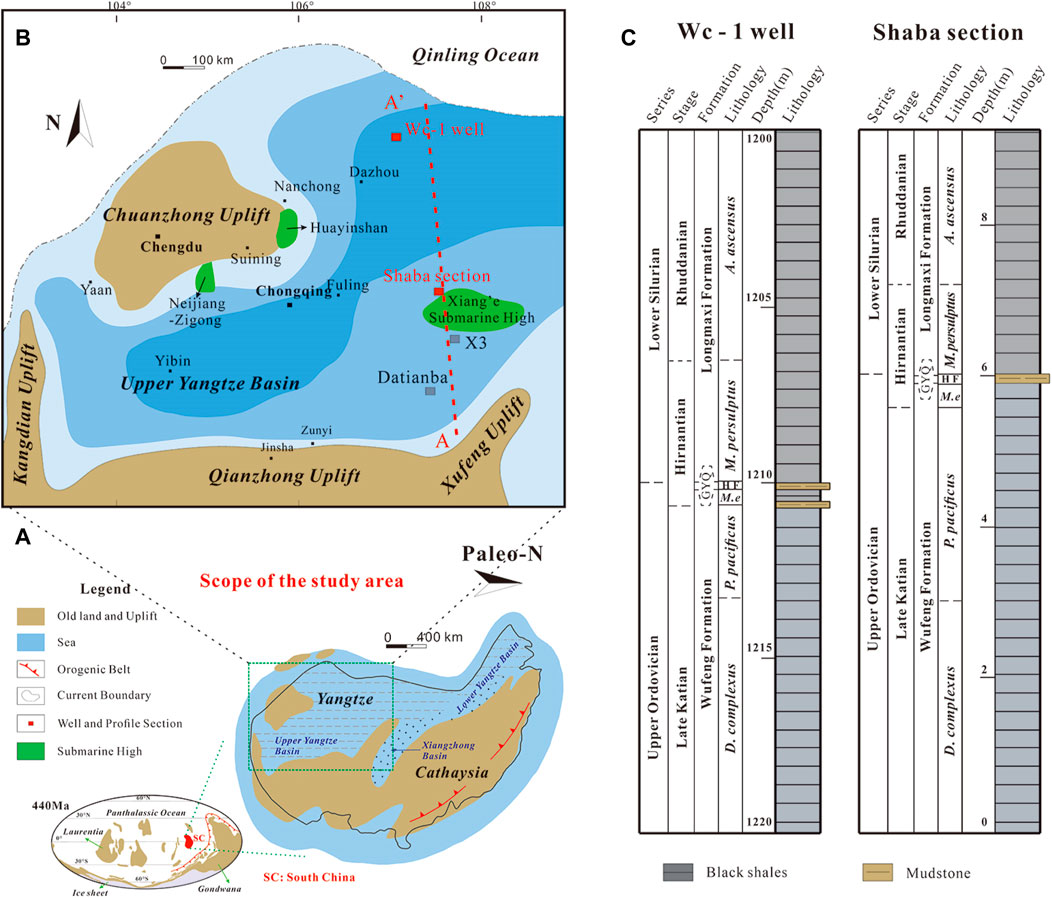
FIGURE 1. Ancient geographical location of the study well and sections. (A) Geographical location of the Upper Yangtze Basin in South China in the Late Ordovician and distribution of main orogenic belts and oceans (Zhang et al., 2015); (B) Locations of the well and sections of the Yangtze Basin in the Early Silurian (Chen et al., 2004). (C) Biostratigraphic division of Wc-1 well and Shaba section (Chen et al., 2004).
Located in the northeast of the Upper Yangtze Basin, Wc-1 well, Qianjiang Shaba section, and two correlation sections, X3 well and Datianba section, were the targets of this study. Based on paleogeographic reconstruction, the four study areas were concluded to be deposited in different water depth environments. The Datianba section, X3 well, and Shaba section (Qianjiang County, Chongqing Municipality, 29°20′32.72″N, 108° 51′20.93″E) are located on the flank of the submarine highland of the Xiang’e or the structural saddle connecting it with the Qianzhong uplift, belonging to the shallow sea area, Wc-1 well (located in Chengkou City, Chongqing Municipality, 31°54′26.67″N, 108°32′58.21″E; Wang et al., 2021) is situated near the Qinling Ocean, and the water depth gradually deepens in this section (Figure 1B; Liu et al., 2016; Xi et al., 2021).
All four study areas contain the Upper Ordovician WF formation and Lower Silurian LMX formation, which are black shale containing graptolites intercalated with siliceous shale and mudstone. Under the influence of the local uplift caused by the Late Ordovician Kwangsian Orogeny, the Guanyinqiao Formation (GYQ) is unevenly distributed in the study area. Except for the thicker GYQ deposited in the Datianba section, in the other areas, this formation is thin or missing (Chen et al., 2004; Chen et al., 2014; Figure 1C). In this study, the middle-upper interval of the WF formation (approximately 4–10 m thick) and the GYQ and lower part of the LMX formations (approximately 2–10 m thick) were analyzed to determine the characteristics of marine redox conditions during this period. According to previous research which performed, vitrine reflectance measurement and clay mineral analysis, the four sections experienced a similar thermal evolution history, and the maximum burial temperature was approximately 210–250°C (Su et al., 2007: Nie et al., 2018; Wang et al., 2021; Xi et al., 2021).
Biostratigraphic Framework
The graptolite biostratigraphy of the Upper Ordovician–Llandoverian Series in South China has been established in previous studies, and provides a high-resolution framework for regional or global identification and correlation of related strata (Chen et al., 2000). In the research sections, five graptolite biozones were determined according to ascending order: the Dicellograptus complexus (D. complexus), Paraorthograptus pacificus (P. pacificus), Metabolograptus extraordinarius (M. extraordinarius), Metabolograptus persculptus (M. persulptus), and Akidograptus ascensus (A. ascensus) zones (Figure 1C). These biozones are consistent with the regional and global framework for the biostratigraphy of graptolites. The first appearance of M. extraordinarius and A. ascensus in the research section was considered to be the dividing line between the Katian–Hirnantian and Hirnantian–Rhuddanian stages. This dividing line has been used to determine the estimated duration of a single graptolite zone (Melchin, 2008; Cooper et al., 2012): D. complexus (0.6 Myr), P. pacificus (1.86 Myr), M. extraordinarius (0.73 Myr), M. persulptus (0.60 Myr), and A. ascensus (0.43 Myr). These data have been used to calculate the linear sedimentation rate (LSR) of each graptolite zone (Li et al., 2019).
Samples and Methods
Samples
In total, 47 shale samples were collected from the Wc-1 well and Shaba section (23 from Wc-1 well and 24 from Shaba section). All samples were carefully processed to remove weathered surfaces and visible pyrite. Then, all samples were ground to 200 mesh size in a tungsten carbide crusher for geochemical analysis.
Methods
Analytical Methods
The total organic carbon (TOC) determination method applied in our study was as follows: Samples of approximately 100 mg were placed into the infiltration crucible, and 1:1 hydrochloric acid was dripped to remove carbonate minerals. After the reactions were complete, the samples were cleaned with deionized water and then, placed in an oven (80°C) until completely dried. Finally, the samples were placed in a LECO CS230 carbon sulfur analyzer, and the TOC contents were calculated according to the peak of carbon dioxide produced.
Whole-rock major element analysis was performed using a BRUKER S8 TIGER X-ray fluorescence spectrometer (XRF, AXS Corporation, Germany) at the China University of Mining and Technology Advanced Analysis and Computation Center. The analytical procedures for the major elements were performed according to the Chinese national standard GB/T14506.28-2010. Trace and rare earth elements (REEs) were analyzed using a PE Elan6000 standard inductively coupled plasma mass spectrometer (ICP-MS) at the Jiangsu Geological and Mineral Resources Design and Research Institute, with an accuracy of 95%. Analytical procedures for trace and REEs were performed according to the Chinese national standards GB/T14506.30-2010 and GB/T14506.29-2010, respectively.
Determination of Fecarb, FeOX, and Femag by a sequential extraction method was described after Poulton and Canfield (2005). Briefly, 1) 100 mg of dry sediment samples was dissolved in 10 ml of 1 M sodium acetate (pH 4.5). The solution was placed in a 50°C water bath shaker for 48 h and then, centrifuged to extract the supernatant for determining Fecarb. 2) The solid substance obtained by centrifugation in the above step was added to a mixture of 50 g/L sodium dithionite and 0.2 M sodium citrate (pH = 4.8), and oscillated in a water bath shaker at room temperature for 2 h. The supernatant was centrifuged to extract FeOX. 3) The solid substance after centrifugation was then, reacted with a mixture of 0.17 M oxalic acid and 0.2 M ammonium oxalate at room temperature for 6 h. The supernatant obtained was centrifuged to extract Femag. Inductively coupled plasma optical emission spectrometry (ICP-OES) was used to detect the iron content in the extraction solution, and the error accuracy was better than 5%.
Iron pyrite (Fepy) was determined using the Cr reduction method proposed by Canfield et al. (1986). Specifically, under conditions of full nitrogen, 1 M CrCl2, 0.5 M HCl solution and 20 ml of concentrated HCl were reacted with 100 mg of the sample at 240°C for 2 h, and the generated H2S was treated with AgNO3 in the collection tube to form Ag2S precipitate. After filtration, the FeS2 content was determined using stoichiometry. The obtained Ag2S precipitate and excess V2O5 were wrapped in a tin boat and placed in a high-temperature thermal conversion element analysis isotope ratio mass spectrometer (TC/EA-IRMS) to obtain δ34Spy. The instrument was calibrated using the autonomous international organization within the United Nations system (IAEA) international standards: IAEA-S1 (−0.3‰), IAEA-S2 (22.65‰), and IAEA-S3 (−32.5‰), and the analysis accuracy was ±0.2‰.
Proxies Used in This Study
The component variability index (ICV) was used to evaluate whether the sedimentary material in the source area includes cyclic deposition (Cox et al., 1995), and was calculated as:
The oxide concentration was calculated in moles. A value of ICV > 1 indicates that shale or mudstone contains a large number of non-clay silicate minerals, which belong to the first deposition (in the context of tectonic activity) (Van de Kamp and Leake, 1985). A value of ICV < 1 indicates that cyclic deposition or strong weathering may have occurred after the first deposition.
The chemical index of alteration (CIA) was determined, since it is an important index for the quantitative analysis of weathering degree and paleoclimate conditions in the source area (Nesbitt and Young, 1982). The CIA was calculated as follows:
Notably, CaO∗ in the formula refers only to CaO in the silicate minerals. McLennan (2001) proposed an indirect calculation formula for CaO∗ as follows: CaOresidual = mole CaO - 10/3 × mole P2O5. If CaOresidual < Na2O, then CaO∗ = CaOresdual, otherwise CaO∗ = Na2O.
When diagenesis occurs, potassium metasomatism increases the potassium content; therefore, the calculated value of CIA is low and needs to be corrected. Panahi et al. (2000) proposed the use of the CIAcorr formula for correction to calculate the CIA value of rock samples without potassium metasomatism. The corresponding calculation formula is as follows:
where K2Ocorr = [mAl2O3 + m (CaO∗ + Na2O)]/(1−m), and m = K2O/(Al2O3 + CaO*+Na2O + K2O). The corresponding oxides are in mole fractions. K2Ocorr refers to the K2O content in rock samples without potassium metasomatism, and m represents the proportion of K2O in the original parent rock.
To describe the enrichment degree of elements in sediments, the enrichment factor (EF) was used to minimize the variable dilution effect of carbonate or biogenic silica (Tribovillard et al., 2006; Algeo and Tribovillard, 2009). The calculation formula of EF is as follows:
where XEF represents the enrichment coefficient of element X normalized using the post-Archean average shale (PAAS) standard (Taylor and McClcnnan, 1985). A value of XEF > 1 represents the enrichment of elements, and vice versa.
The organic carbon accumulation rate (OCAR) was used to evaluate the changes in primary productivity and was calculated as follows: OCAR = TOC × LSR × ρ, where LSR is the linear deposition rate of the biostratigraphic described in section 2.2 (Myr−1). ρ is the rock density of black shale, with its value being 2.5 g cm−1 (Stanley, 2010).
Results
All geochemical data of the Wc-1 well and Shaba section are included in the supplementary material (Tables 1, 2; Supplementary Table S1), and the stratigraphic models of the key results are shown in Figures 2–4. The test data of Datianba section, and X3 well can be found in Liu et al. (2016), and Xi et al. (2021), respectively.
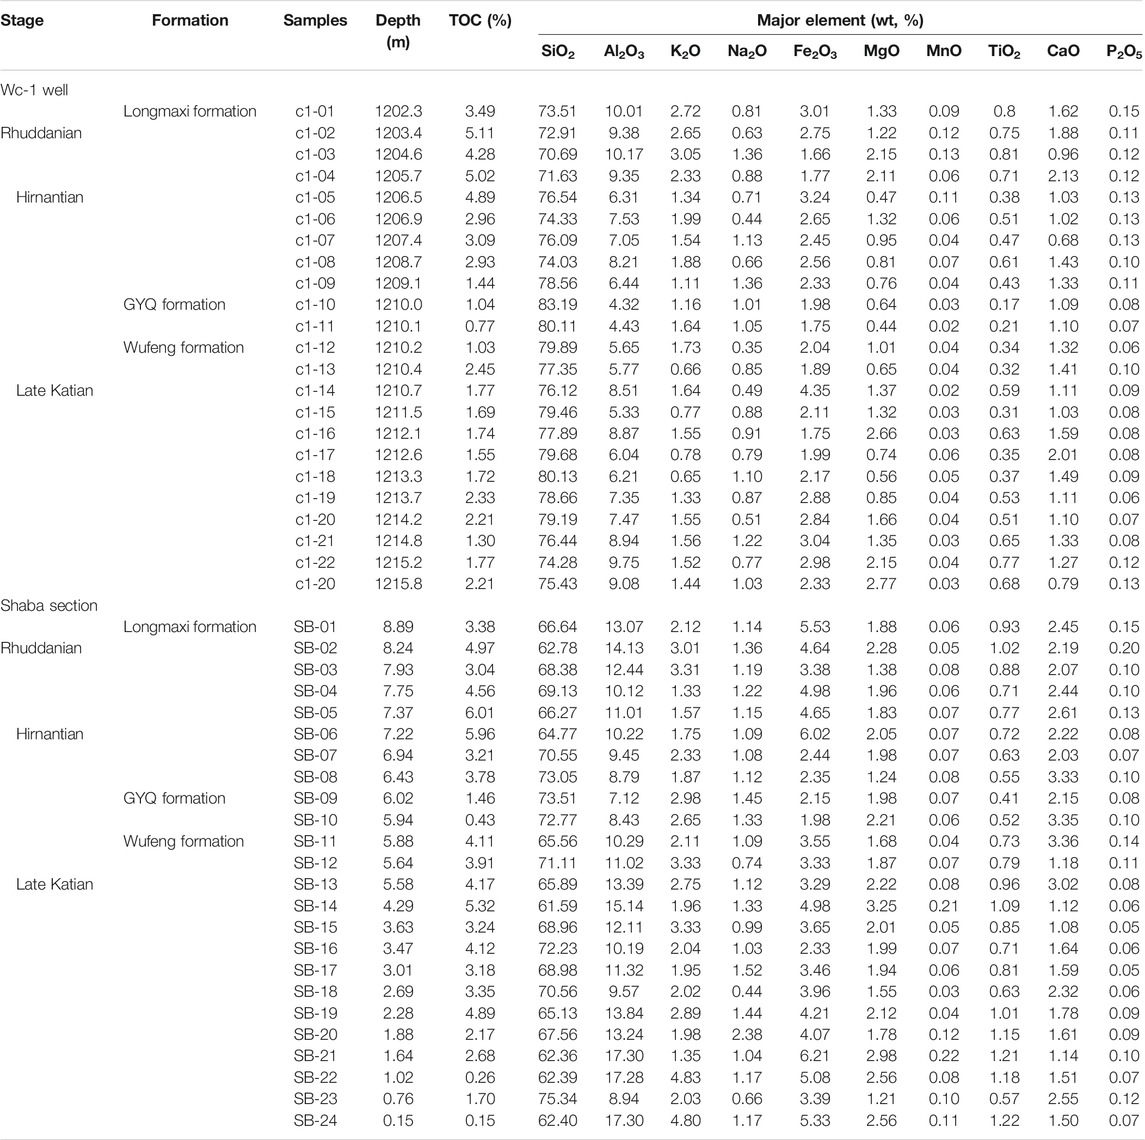
TABLE 1. Test results of TOC and major elements in Wc-1 well and Shaba section.
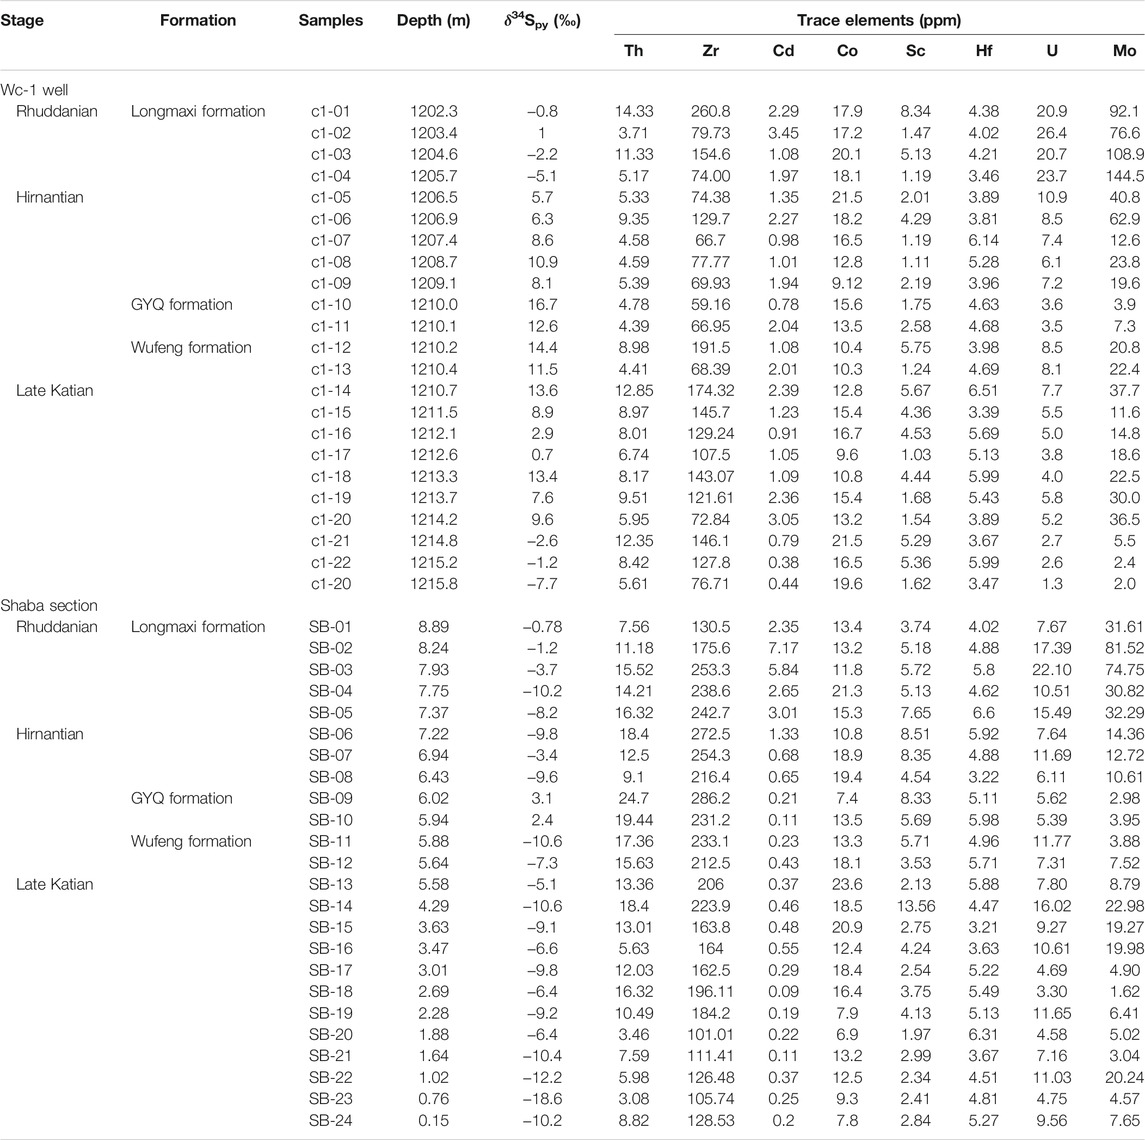
TABLE 2. Test results of δ34Spy and trace elements in Wc-1 well and Shaba section.

FIGURE 2. Chemostratigraphic profiles of (A) total organic carbon (TOC) and organic carbon accumulation rate (OCAR), (B) FeT and Corg/P, (C) FeHR/FeT and Fepy/FeHR, (D) MoEF and UEF, (E) CIAcorr and δ34Spy and (F) Co×Mn for Wc-1 well. The value of 106 for Corg/P was used to distinguish suboxic–anoxic conditions (Algeo and Ingall, 2007). The values between 0.22 and 0.38 (for FeHR/FeT) were used to distinguish oxic–suboxic and suboxic–anoxic conditions. And values of 0.7–0.8 (for Fepy/FeHR) represent ferruginous–euxinic redox thresholds (Poulton and Raiswell, 2002).
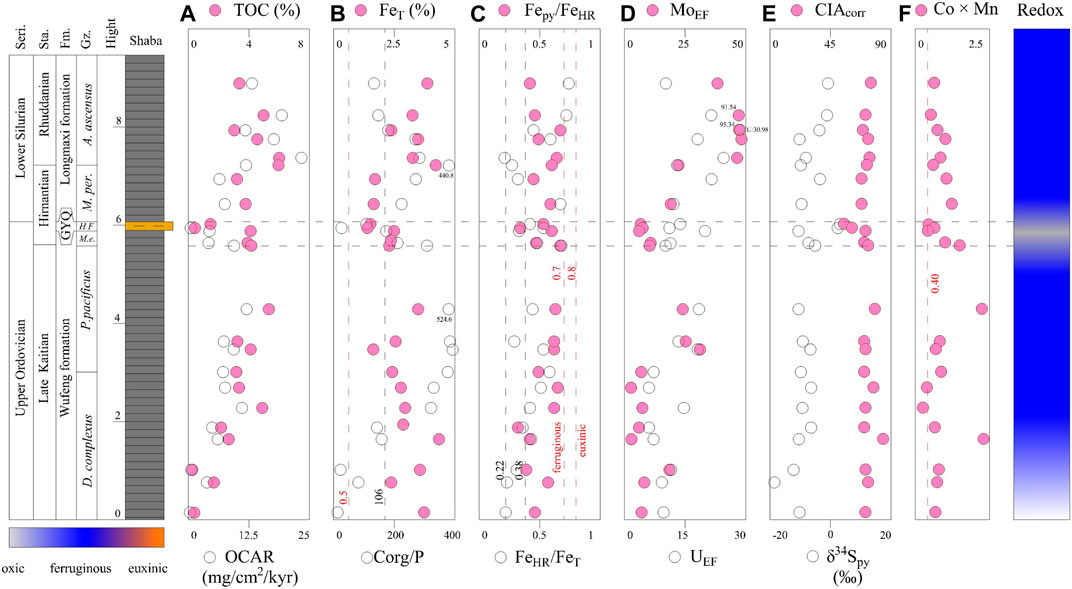
FIGURE 3. Chemostratigraphic profiles of (A) total organic carbon (TOC) and organic carbon accumulation rate (OCAR), (B) FeT and Corg/P, (C) FeHR/FeT and Fepy/FeHR, (D) MoEF and UEF, (E) CIAcorr and δ34Spy and (F) Co×Mn for Shaba section. The meaning of the virtual lines and numbers in the graph is consistent with Figure 2.

FIGURE 4. (A) Source of shales in Wc-1 well and Shaba section analyzed by Al–Fe–Mn triangulation (Wedepohl, 1971; Adachi et al., 1986). (B) Al/(Al + Fe)–Fe/Ti diagram of Wc-1 well and Shaba section (Zhang et al., 2017). (C) Enrichment of trace element in Wc-1 well and (D) Shaba section. (E) PAAS-normalized REE patterns of Wc-1 well and Shaba section samples. (F) Chondrite-normalized REE patterns of Wc-1 well, Shaba section, PAAS, and UCC (Rudnick and Gao, 2003).
Variations of TOC and Major Elements
The TOC content and major elements in Wc-1 well and Shaba section are shown in Figures 2A, 3A; Table 1. In detail, from the Late Katian to the Rhuddanian period, the average value of TOC and OCAR for Wc-1 well increased from 1.83% to 10.06 mg/cm2/kyr to 4.48% and 109.31 mg/cm2/kyr, respectively (Figure 2A). In Shaba section, the average value of TOC increased from 2.94 to 4.39%, while the value of OCAR decreased from Late Katian (16.66 mg/cm2/kyr) to Hirnantian (13.04 mg/cm2/kyr), and then increased in Rhuddanian (42.60 mg/cm2/kyr) (Figure 3A).
The predominant constituents of the samples were SiO2, Al2O3, CaO, Fe2O3T, MgO, and K2O are, with averages of 76.79, 7.49, 1.30, 2.46, 1.27, and 1.59 wt% for Wc-1 well, and 67.83, 11.90, 2.09, 3.96, 2.02, and 2.51 wt% for Shaba section, respectively. The average contents of other major elements, such as Na2O, MnO, TiO2, and P2O5, were below 1% (Table 1).
The value of Al/(Al + Fe + Mn) is often used to determine the genesis types of siliceous rocks. Values from 0.01 to 0.60 represent the endpoint values of hydrothermal origin and biological origin respectively (Adachi et al., 1986; Yamamoto, 1987). The samples of Wc-1 well and Shaba section had high Al/(Al + Fe + Mn) values (0.56–0.81, mean = 0.69), indicating that the genesis of the siliceous rocks was mainly biological, without any hydrothermal effect. Additionally, the Al–Fe–Mn triangulation method was also used to determine whether siliceous minerals were hydrothermal or biogenic (Adachi et al., 1986; Yamamoto, 1987). In this study, the values of the samples were within the biogenic range of the triangle diagram (Figure 4A), indicating a non–hydrothermal origin. Further, considering the diagenetic fluidity of Mn (Murray, 1994), the association diagram of Al/(Al + Fe) and Fe/Ti without Mn was further used to determine the genesis of siliceous rocks (Zhang et al., 2017). The values of our samples were not in the range of hydrothermal genesis (Figure 4B), which further confirmed the biogenic influence.
Variations of Trace and Rare Earth Elements
The concentrations of trace and REEs elements are shown in Table 1; Supplementary Table S1; Figures 4C–F. In detail, for trace elements, samples were enriched in Cd, U, and Mo and slightly enriched in Th, Zr, Co, and Hf in Wc-1 well and Shaba section. There were obvious differences for the different stages. The average contents of U and Mo in the Rhuddanian were higher than those in the Late Katian and the Hirnantian. The measured average values of Sc were in a loss state compared with PAAS (Figures 4C,D).
The total REE (∑REE) content in Shaba section was higher than that in Wc-1 well, ranging from 159.13 to 248.88 ppm (mean 211.99 ppm) and 93.34–262.47 ppm (mean 158.94 ppm), respectively, suggesting that shales in this section were more sub statically affected by terrestrial clasts, compared to those in Wc-1 well. The PAAS normalized and chondrite normalized REE patterns of shales from the study areas are almost similar, with light REE (LREE) enrichment and relatively flat heavy REE (HREE) distribution (Figures 4E,F). Otherwise, all samples have slightly negative Ce anomalies (0.69–1.14, mean 0.88, and 0.80–0.99, mean 0.92, respectively) and obvious negative Eu anomalies (0.50–0.82, mean 0.68, and 0.47–0.65, mean 0.55, respectively). The cerium and europium anomalies were calculated from: Ce/Ce* = 2 × CeN/(LaN + PrN), and Eu/Eu* = EuN/(SmN × GdN)1/2, respectively, where N was a PAAS-normalized value (Taylor and McClcnnan, 1985).
δ34Spy
For Wc-1 well samples, the values of δ34Spy increased from the range of −7.7–14.4‰ (mean = 5.93‰) in the WF Formation to 12.6–16.7‰ (mean = 14.65‰) in the GYQ Formation, and then decreased to the range of −5.1–10.9‰ (mean = 3.61‰) in the LMX Formation (Figure 2E; Table 2). Showing a similar trend, the values of δ34Spy for Shaba section samples increased from a range of −18.6‰ to −5.1‰ (mean = −9.46‰) in the WF Formation to a range of 2.4–3.1‰ (mean = 2.75‰) in the GYQ Formation, and then decreased to a range of −10.28 to −0.78‰ (mean = −5.86‰) in the LMX Formation (Figure 3E; Table 2).
Discussion
Sediment Provenance and Paleoweathering
Sediment Provenance and Tectonic Settings
Trace elements and REEs, such as Sc, Th, and Zr, are widely used to distinguish sedimentary provenance because of their stability during weathering, transportation, diagenesis, and metamorphism (Cullers and Podkovyrov, 2000). In igneous rocks, Th, Sc and Zr are generally found in felsic minerals, mafic minerals, and zircon, respectively, and the correlation ratio of these elements can be used to determine sedimentary provenance (Hayashi et al., 1997). In general, the value of Zr/Sc increases obviously due to the enrichment of zircon during sedimentary recycling, but the value of Th/Sc is not affected; therefore, the Th/Sc versus Zr/Sc plot can be used to determine the variation in sediment provenance (McLennan et al., 1993). Most samples from the study area could be shown on the composition evolution curve and were close to the end members of felsic igneous rocks, indicating that the black shale samples did not experience sedimentary recycling, and may have been sourced from felsic igneous rocks (Figure 5A). The plot of La/Th versus Hf can also provide information on sedimentary provenance (Floyd and Leveridge, 1987). In this study, the values of La/Th and Hf contents varied from 2.68 to 11.40 (mean = 5.64) and 1.55–12.23 ppm (mean = 4.52 ppm) for Wc-1 well, and 3.39–6.51 (mean = 4.62) and 3.21–6.60 ppm (mean = 4.97 ppm) for Shaba section, respectively. Most samples plotted near the field of felsic source (Figure 5B), suggesting the samples were mainly from felsic igneous rocks. The REE distribution pattern standardized by chondrite-normalization was similar to that of UCC and PAAS, suggesting that the sedimentary component of black shale was controlled by upper crustal source rock and showed near-source deposits (Figure 4D). Notably, the test results of Wc-1 well samples show a tendency toward the tholeiitic oceanic arc source, which may be related to tectonic change and upwelling in the northern Qinling orogenic belt (see section 5.2.2).
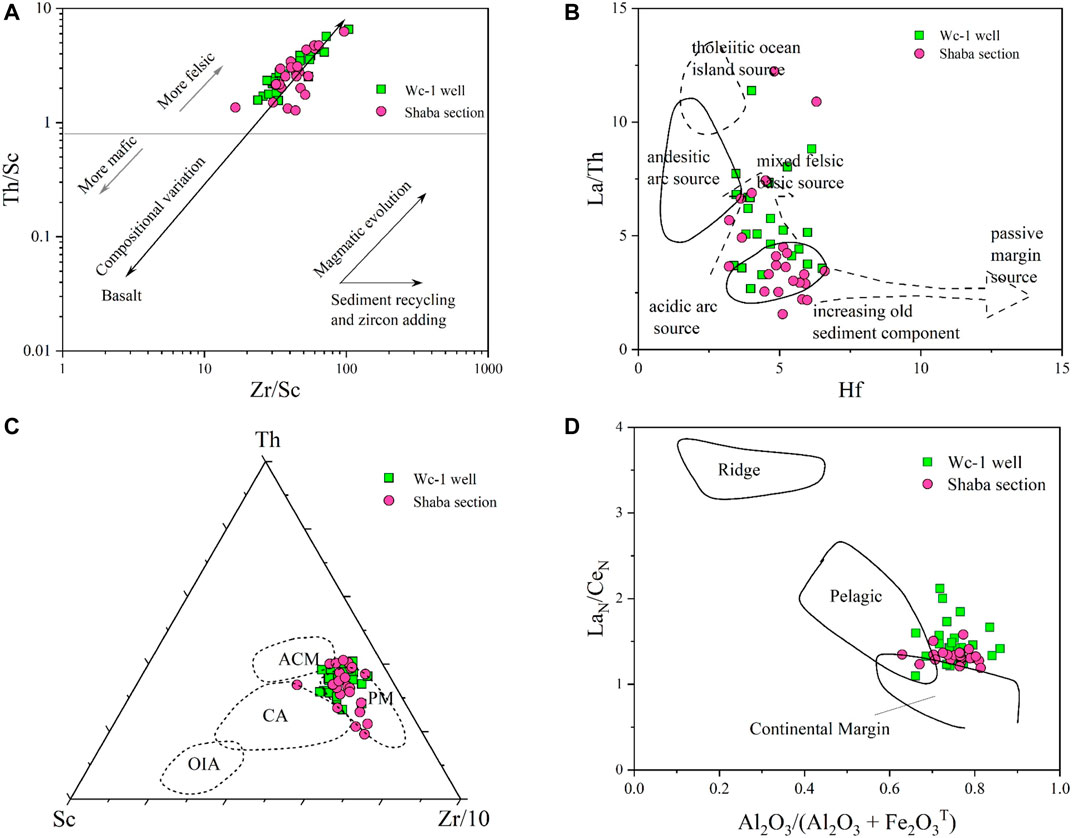
FIGURE 5. Sedimentary provenance and tectonic setting discrimination diagrams for Wc-1 well and Shaba section samples. (A) Zr/Sc—Th/Sc, (B) Hf—La/Th, (C) Th—Sc—Zr/10 ternary diagram, and (D) Al2O3/(Al2O3 + Fe2O3T)—LaN/CeN. ACM: active continental margin. CA, continental island arc; PM, passive margin; And OIA, oceanic island arc.
Based on the different geochemical composition characteristics of clastic sedimentary rocks, the tectonic setting of sedimentary basins can generally be divided into: active continental margin (ACM), passive continental margin (PM), continental island arc (CA), and oceanic island arc (OIA) (Bhatia and Crook, 1986). In this study, according to the Th–Sc–Zr/10 ternary diagram, most samples in the study area plotted in or near the PM field, and only one sample of Shaba section was close to the CA margin (Figure 5C). Thus, it can be speculated that Shaba section may reflect the inheritance characteristics of clastic deposits with an older provenance, rather than being source entirely from the corresponding sedimentary environment (Xiong et al., 2019). In the diagram of Al2O3/(Al2O3+Fe2O3T)–LaN/CeN, almost all samples plotted in or near the continental margin field (Figure 5D). Therefore, combining this with the relatively stable tectonic movement in the Upper Yangtze Basin and the continuous clastic input of the paleo continent in the Qianzhong uplift (Huang et al., 2020), we suggest that the sedimentary system of the continental margin should be the main tectonic background of the study area.
In addition, REEs are known to reflect tectonic background information accurately. In this study, the key REE indices of samples from Shaba section were similar to those of the PM field, but different from those of the CA, OIA, and ACM settings (Table 3), which is consistent with the conclusion drawn from the previous diagram. However, this similarity in Wc-1 well seems to be weak, especially for the Late Katian and Rhuddanian periods (Table 3). The reason for this phenomenon may be related to the higher biogenic silica content in the region. In different sediment types, the content of REEs is affected by the dilution of biogenic silica, with the content of REES being lowest in mudstone with more biogenic silica (Lu and Jiang, 1999; Wang et al., 2021).
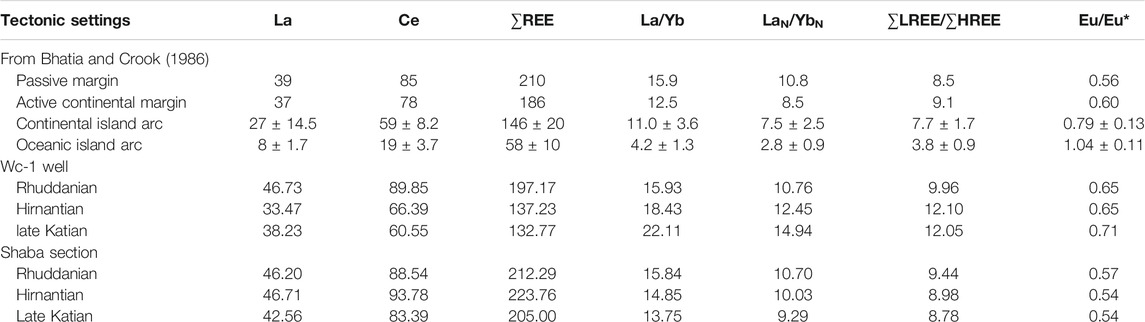
TABLE 3. Comparison of the key rare earth element (REE) indices between this study and published literature.
Paleoweathering and Detrital Influx
To eliminate the influence of sedimentary recycling on the evaluation of the weathering degree in the source area, the ICV values of Wc-1 well and Shaba section were calculated. Our results showed that most samples had values greater than 1, with only a few samples being less than or close to 1, suggesting that the effect of sedimentary recycling was limited, and that the degree of weathering in the source area can be suitably discussed and evaluated (Supplementary Table S1; van de Kamp and leake, 1985; Huang et al., 2020). Furthermore, the CIAcorr formula was used to correct the influence of K-metasomatism in the diagenetic stage to better reflect the weathering conditions experienced by the source rock. It is known that the loss rates of Ca, Na, K, and other elements is faster than those of Al and Ti in warm and humid climates, which increases the CIAcorr calculation results and represents strong weathering. In contrast, lower CIAcorr values are thought to represent weaker weathering in cold and dry climates (Selvaraj and Chen, 2006). Specifically, the CIAcorr values of Wc-1 well and Shaba section were higher during the Late Katian (69–76, mean 73, and 70–84, mean 73, respectively), lowest in the Hirnantian (55–72, mean 67, and 55–72, mean 66, respectively), and gradually increased in the Rhuddanian (67–71, mean 70, and 69–75, mean 72, respectively), suggesting that the source area experienced a similar weathering intensity from strong to weak and then to strong (Figures 2E, 3E).
The contents of Al and Ti have been found to vary among different types of source rocks, but due to their strong weathering resistance, ultimately show a consistent trend in sediments (Young and Nesbitt, 1998). The contents of Al and Ti in the study area samples had a high positive correlation (r = 0.99 for Wc-1 well, and r = 0.97 for Shaba section. Table 1), suggesting that the source rocks experienced a strong degree of weathering. Notably, Al and Ti are important indicators for evaluating terrigenous debris input, because both are derived from the weathering of source rocks; Al is mainly related to the dissolution of clay minerals, whereas Ti is usually related to clay and heavy minerals (such as ilmenite and rutile) (Murphy et al., 2000). The overall trend of Al and Ti contents in Wc-1 well and Shaba section were similar to those in CIAcorr, suggesting that the input of terrigenous debris from latest Katian to Rhuddanian also showed a trend wherein the contents first decreased and then, increased. However, compared with Wc-1 well, the contents of Al and Ti in Shaba section were much higher, indicating that Shaba section was greatly affected by terrestrial clastic input.
Water Restriction and Upwelling
Water Restriction
The sedimentary environment and biogeochemical cycle are affected by the degree of water column restriction in the basin, which plays an important role in the enrichment and preservation of organic matter (OM) in sediments (Rowe et al., 2008; Algeo and Rowe, 2012). In general, the geochemical properties and enrichment of Mo and U are used to study the retention of modern and ancient water columns. This is because in the suboxic open ocean system, the UEF in sediment is higher than that of MoEF, owing to the fact that U accumulation begins at the redox boundary of Fe(II)–Fe(III), resulting in a sediment MoEF/UEF value less than that of seawater. As the reduction degree of bottom water gradually increases, and the euxinia environment appears, the enrichment rate of Mo increases, and the MoEF/UEF value in the sediment becomes equal to or greater than that of seawater. However, when the basin is experiencing a strong restrictive environment, the MoEF/UEF value is very small due to the lack of Mo and U supply, even when the reduction degree in the bottom sedimentary environment of sea water is very high. Simultaneously, the strong reduction conditions result in Mo fixation (occurring prior to that of U). Therefore, the MoEF/UEF value decreases with an increase in its enrichment coefficient (Algeo and Tribovillard, 2009).
The contents of Mo and U in the samples of the study area gradually increased from the Late Katian to the Rhuddanian (Figures 2D, 3D), and the contents of Wc-1 well were higher than those in Shaba section, indicating that Wc-1 well received more Mo and U elements from the ocean compare to Shaba section. Specifically, for Wc-1 well samples from the late Katian period, under suboxic and anoxic conditions, the value of MoEF/UEF were plotted in the range of 0.3–1.0 SW, which representing an unrestricted marine environment. Similarly, for Shaba section, although the values of MoEF/UEF plotted in a lower range of 0.1–0.3 SW, with the increase of TOC, the degree of water reduction became stronger, thus the enrichment of Mo and U still increased, therefor, the Mo and U concentrations were also consistent with the water environment of modern unrestricted basins (Figures 6A,B).
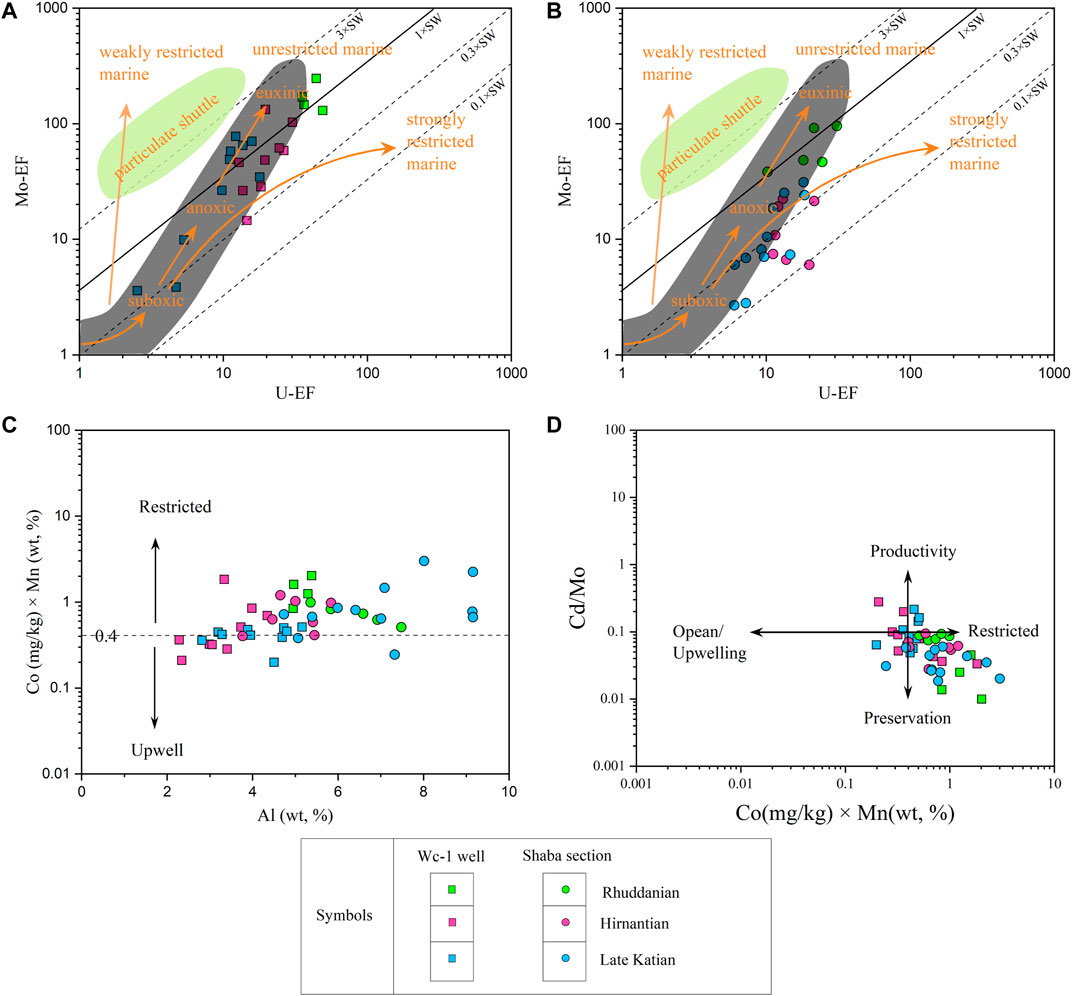
FIGURE 6. Crossplots of (A) Al versus Co × Mn and (B) Co × Mn versus Cd/Mo for Wc-1 well and Shaba section. Enrichment factors (EF) of Mo versus U in (C) Wc-1 well and (D) Shaba section. The solid line shows the Mo/U molar ratios of 1 × seawater value (SW) and dotted lines indicate 0.1 × SW, 0.3 × SW, and 3 × SW (Algeo and Tribovillard, 2009).
During the Hirnantian period, the enrichment degree of U and Mo in Shaba section increased gradually, but the MoEF/UEF value consistently plotted in the range of 0.1–0.3 SW, indicating that this area was in a restricted marine environment (Figure 6B). For Wc-1 well, the unrestricted marine environment remained unchanged (Figure 6A). In the Rhuddanian period, the enrichment degree of Mo and U reached the maximum, and the values of MoEF/UEF from Wc-1 well and Shaba section were also ∼1.0 SW, which represented an unrestricted marine environment.
In summary, Wc-1 well represents an unrestricted marine environment during the O–S period. Shaba section represents an unrestricted marine environment during the Late Katian and Rhuddanian periods, but for other periods, represents a restricted marine environment.
Upwelling
It is known that upwelling from bottom water with more nutrients depletes oxygen in the water column and plays an important role in preserving OM in sediments (Gupta et al., 2016). The concentrations of Mn, Cd, Mo, and Co are used to identify the development of upwelling, because under the influence of upwelling, sediments in the deep water shelf environment are usually rich in Mn, Cd, and Mo, and depleted in Co (Boening et al., 2009). A value of Co (ppm) × Mn (%) < 0.4 is often used to indicate the existence of upwelling, and the smaller its value, the stronger is the upwelling (Sweere et al., 2016). For Wc-1 well, the values of Co × Mn were 0.20–0.51 × 10⁻⁸ (mean 0.42 × 10⁻⁸), 0.21—1.83 × 10⁻⁸ (mean 0.60 × 10⁻⁸), and 0.84—2.02 × 10⁻⁸ (mean 1.43 × 10⁻⁸) in the Late Katian, Hirnantian, and Rhuddanian, respectively (Figure 2F). For Shaba section, the values of Co × Mn were 0.24—3.01 × 10⁻⁸ (mean 1.04 × 10⁻⁸), 0.40—1.20 × 10⁻⁸ (mean 0.75 × 10⁻⁸), and 0.51—0.99 × 10⁻⁸ (mean 0.74 × 10⁻⁸) in the Late Katian, Hirnantian, and Rhuddanian, respectively (Figure 3F). This indicates that the development degree of upwelling in the study area gradually weakened from the bottom to the top. Compared with Shaba section, the development degree of upwelling in Wc-1 well was higher, reaching the highest level in the latest Katian (Figure 6C). In other words, restriction of the water column in Shaba section was stronger than that in Wc-1 well. Studies have indicated that large temperature differences between the poles and equator are the main cause of upwelling during glaciation (Alsenz et al., 2013). Notably, the climate change deduced in the study area during the O—S period was found to be accordance with this characteristic.
Further, it is understood that different adsorption degrees of Mo and Cd in the biological growth process result in corresponding changes in the value of Cd/Mo in the sediment: in restricted systems, this value is less than 0.1, whereas in the upwelling system, it is more than 0.1 (Little et al., 2015; Sweere et al., 2016). In this way, the covariant relationship with Co × Mn can further determine existence of upwelling (Sweere et al., 2016). In this study, only five samples from Wc-1 well had Cd/Mo values greater than 0.1 (three samples from the latest Katian, and two samples from the Hirnantian, Table 2), suggesting that Wc-1 well was affected by upwelling, especially during the latest Katian (Figure 6D). The other samples plotted in the restricted area suggest that the preservation model is the main reason for the enrichment of sedimentary OM in the study area.
Reconstruction of Redox Conditions in the Study Sections
Numerous studies have shown that, compared with the EF values of trace elements, the response of the bimetal ratio to the redox conditions of the water column is not reliable (Algeo and Tribovillard, 2009; Little et al., 2015; Algeo and Li, 2020). In this study, the Fe speciation (Poulton and Canfield, 2005), EFs Mo and U (Little et al., 2015), and Corg/P ratios (Algeo and Ingall, 2007) were selected to discuss the redox state of the water column. The total iron (FeT) content of the samples in the study area were all greater than 0.5%, which can be further used for Fe speciation analysis (Clarkson et al., 2014; Supplementary Table S1). Corg/P was calculated using Corg/P = (TOC/12)/(P/30.97), where 12 and 30.97 represent the molar weights of the TOC and P contents, respectively. A value of 106 for Corg/P was used to distinguish suboxic and anoxic water columns (Algeo and Ingall, 2007).
At Wc-1 well, the Late Katian period exhibits low FeHR/FeT (0.26—0.84, mean 0.51; Figure 2C), Fepy/FeHR (0.24—0.90, mean 0.73; Figure 2C), Mo contents (2.0—37.7 ppm, mean 18.2; Table 2), and variable Corg/P values (87.3—229.8, mean 129.8, Figure 2B). The above values were the lowest at the bottom of the D. complexus, and gradually increased in the P. pacificus, suggesting that the water redox conditions changed from suboxic to ferruginous and then to euxinia (Figure 2). These inferences are supported by the covariant relationship between MoEF and UEF (Figure 6A). The Hirnantian period exhibited variable FeHR/FeT (0.34—0.81, mean 0.57; Figure 2C), Fepy/FeHR (0.54—0.94, mean 0.76; Figure 2C), Mo contents (3.9—62.9 ppm, mean 23.8; Table 2), and lower Corg/P values (65.1—222.6, mean 126.4, Figure 2B), suggesting a ferruginous condition. The Rhuddanian period potrayed high FeHR/FeT (0.60—0.72, mean 0.67; Figure 2C), Fepy/FeHR (0.76—0.86, mean 0.83; Figure 2C), Mo contents (76.6—144.5 ppm, mean 105.5; Table 2), and Corg/p values (137.7—274.9, mean 217.8, Figure 2B), indicating the prevalence of euxinic conditions.
At Shaba section, the Late Katian period exhibited variable FeHR/FeT (0.22—0.68, mean 0.42; Figure 3C), Fepy/FeHR (0.32—0.67, mean 0.54; Figure 3C), Mo contents (1.62—22.98 ppm, mean 10.37; Table 2), and Corg/P values (12.7—524.6, mean 255.7, Figure 3B). The above values were almost plot in the suboxic to anoxic areas from the D. complexus to P. pacificus, suggesting that the water redox conditions changed from suboxic to ferruginous (Figure 3). This is consistent with the covariant relationship between MoEF and UEF (Figure 6A). The Hirnantian period exhibited low FeHR/FeT (0.27—0.67, mean 0.43; Figure 3C), Fepy/FeHR (0.34—0.60, mean 0.51; Figure 3C), Mo contents (2.98—14.36 ppm, mean 8.00; Table 2), and Corg/p values (25.4—440.8, mean 207.6, Figure 3B), and the minimum value appeared in the GYQ Formation, suggesting intermittent suboxic conditions in ferruginous stages. The Rhuddanian period exhibits high FeHR/FeT (0.21—0.74, mean 0.54; Figure 3C), Fepy/FeHR (0.42—0.67, mean 0.54; Figure 3C), Mo contents (30.82—81.52 ppm, mean 50.20; Table 2), and Corg/p values (133.3—283.2, mean 202.6, Figure 3B), indicating the prevalence of ferruginous conditions.
Further, by comparing the data of Wc-1 well and Shaba section samples, we could deduce that the hypoxia degree of Wc-1 well redox conditions was stronger than that of Shaba section, and there was no obvious euxinic condition in the Shaba section.
Redox Heterogeneity in Study Area During the O—S Preiod
To restore the change in redox conditions of the water column in the northeastern Upper Yangtze Basin during the O—S period, the redox condition data of Datianba section and X3 well in the same basin during this period were compared with those of the study samples (Figure 7; Liu et al., 2016; Wang et al., 2021; Xi et al., 2021). The Datianba section was located close to the Qianzhong uplift, and the X3 well and Shaba section were located on the northern and southern sides of the Xiang’e Submarine High (the paleomagnetic regions were on the east and west sides), respectively, and Wc-1 well was close to the Qinling Ocean (Figure 1B). The ancient water depth was the deepest in Wc-1 well, followed by the Datianba section, and gradually became shallow in Shaba and X3 well sections (Liu et al., 2016; Wang et al., 2021; Xi et al., 2021). Datianba section was dominated by anoxic ferruginous conditions during the Late Katian, accompanied by intermittent euxinia. Euxinia conditions were present during the Hirnantian period, but the conditions turned ferruginous in the GYQ Formation. By the Rhuddanian period, the water column was dominated by intermittent euxinia conditions (Liu et al., 2016). In contrast, X3 well was dominated by oxic–suboxic conditions during the O—S period, and anoxic water was almost undeveloped (Xi et al., 2021).

FIGURE 7. Variations in Fepy/FeHR, FeHR/FeT, δ34Spy, and TOC/Spy in the Katian to Rhuddanian shales of Shaba section and Wc-1 well in the study area, Datianba section (Liu et al., 2016), and X3 well (Xi et al., 2021). The meaning of virtual lines and numbers in graph is consistent with Figure 2.
Therefore, the redox conditions of the water column at different water depth during the same period showed obvious differences. During the Late Katian period, the water column in the northeastern Yangtze basin was in anoxic ferruginous conditions, whereas oxic—suboxic conditions were developed in the shallow area (Figure 7). With continuous advancement of the Hirnantian glacial period, euxinic water gradually disappeared from the basin, and the reduction in water decreased. From the late Hirnantian to the Rhuddanian period, anoxic water gradually expanded from deep to shallow depth in the basin.
Controls on the Development of Euxinia in Yangtze Basin
As mentioned above, the redox conditions of the water column in the study area during the O—S period, especially the distribution of euxinia, showed obvious spatiotemporal heterogeneity. Liu et al. (2016) and Li et al. (2019), Li et al. (2021) explained this phenomenon in terms of tectonic movement, CIA intensity, and sulfate availability. On this basis, our study further explored the control mechanism of euxinia development using detailed geochemical data.
In general, the transformation of anoxic water between ferruginous and euxinic conditions is mainly controlled by the input of OM, Fe and sulfate in the sedimentary system (Johnston et al., 2010; Raiswell and Canfield, 2012). Moreover, paleoproductivity is a direct factor in evaluating sedimentary OM, and OCAR is considered to be one of the most effective indicators for evaluating paleoproductivity (Shen et al., 2015; Bao et al., 2020). During the O—S period, the average values of OCAR were higher in Wc-1 well (1.85—124.80 mg/cm2/kyr, mean 32.81 mg/cm2/kyr) than those in Shaba section (0.85—58.10 mg/cm2/kyr, mean 21.01 mg/cm2/kyr) (Supplementary Table S1), consistent with the change in redox conditions, suggesting that the productivity level may be one of the main factors causing the change of redox conditions in the water column. A higher level of productivity is conducive to the generation of an anoxic water column, which was also reflected in the OCAR and Fepy/FeHR correlation diagram (Figure 8A). Notably, the Wc-1 well portrayed characteristics of an euxinic condition in the latest Katian, but the value of OCAR did not increase significantly, suggesting that other factors also play a role in controlling the development of euxinia in the basin (Figure 2).
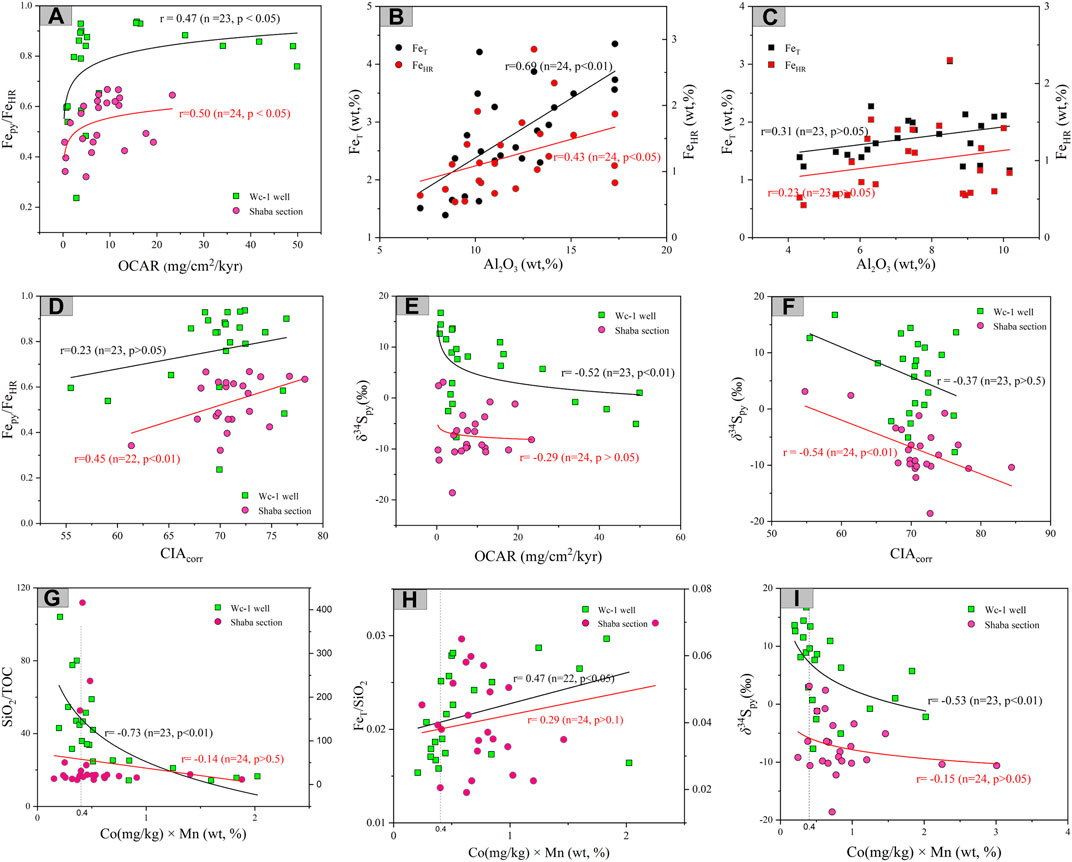
FIGURE 8. Relationship between research area elements. (A) Logarithmic relationships between OCAR with Fepy/FeHR. (B) Al2O3 verses FeT for Shaba section. (C) Al2O3 verses FeT for Wc-1 well. (D) CIAcorr verses Fepy/FeHR. (E) Logarithmic relationship between OCAR with δ34Spy. (F) CIAcorr verses δ34Spy. (G) Cross plots of Co × Mn versus SiO2/TOC. (H) Cross plots of Co × Mn versus FeT/SiO2. (I) Logarithmic relationships between Co×Mn with δ34Spy.
In the middle water column (below the metamorphic layer), the presence of euxinia resulting from high productivity must meet the following two conditions 1) low FeHR flux and 2) adequate sulfate (Raiswell and Canfield, 2012). The positive correlation between FeT, FeHR, and Al2O3 in Shaba section indicated that active iron mainly comes from the input of terrigenous debris, rather than hydrothermal solution and the other source (Figure 8B; Raiswell and Canfield, 2012). However, there was no such positive correlation in Wc-1 well, and the content of FeHR was lower than that in Shaba section, suggesting that the sources of active iron at different water depths may be different (Figure 8C). Combined with the REE data of Wc-1 well, we speculated that the source of active iron in the sedimentary system of this area may be related to the re-release of iron oxides in the sediments, in addition to the terrigenous clastic input (Section 5.1.1; Raiswell and Canfield, 2012). The significant and non–significant positive relationship between CIAcorr and Fepy/FeHR in Shaba section and Wc-1 well, respectively, also supports the above conjecture (Figure 8D). However, the redox conditions of the water column in Wc-1 well did not seem to change significantly with an increase in FeHR, and even euxinia expansion occurred during the latest Katian (Figure 2C), suggesting that a higher FeHR value is not a definitive reason for the decrease in euxinia, and that other influencing factors need to be considered.
The δ34S of pyrite formed in the water column can be used to determine the availability of sulfate in sedimentary systems (Poulton et al., 2015). Moreover, in the process of microbial sulfate reduction (MSR), sulfate and OM in the system will act as the first electron acceptors to control the reaction rate, thus affecting the value of δ34Spy (Bao et al., 2021). In the conditions of high productivity, the reduction rate of OM increases, and the corresponding sulfate differentiation coefficient εMSR (εMSR = δ34SSO4 - δ34Spy) decreases, resulting in high δ34Spy values (Leavitt et al., 2013). In Wc-1 well, the significant negative correlation between OCAR and δ34Spy (r = −0.52, p < 0.01, n = 23; Figure 8E) indicated that the availability of OM was not the main factor affecting the change in the δ34Spy value. However, in Shaba section, this negative correlation was not significant (r = −0.29, p > 0.05, n = 24; Figure 8E), suggesting that the mixed effect of OM and sulfate availability may have benn the reason for the change in the δ34Spy value in this area.
Sulfate inputs to the marine environment are mainly affected by continental weathering, hydrothermal activity, and volcanic activity (Poulton and Canfield, 2011). There was a significant negative correlation between CIAcorr and δ34Spy in Shaba section (r = −0.54, p < 0.01, n = 24; Figure 8F)shows that the input of terrigenous debris was the main factor affecting the change in δ34Spy, and also explaining the reason for the increase in δ34Spy value in the glacial period, that is, an insufficient supply of sulfate and the resulting low εMSR (Li et al., 2021). The lower CIAcorr during the glacial period reduced the sulfate input, thereby limiting the fractionation of sulfur isotopes in the MSR (Algeo et al., 2015), then by being coupled with a decrease in OM flux, resulted in an increase in the δ34Spy value. However, for Wc-1 well, this negative correlation was not significant (r = −0.37, p > 0.05, n = 23; Figure 8F), suggesting that the effectiveness of sulfate in this area may have been restricted by other factors.
During the O–S period, upwelling was widely developed in the relatively deep waters of the Upper Yangtze Basin due to glacial–influenced temperature differences and longshore trade winds, especially during the latest Katian to the Hirnantian period (Yang et al., 2021). Nutrient-rich upwelling not only improves productivity, but also plays an important role in the circulation of marine elements, such as Fe, C, P, and N cycling (Pope and Steffen, 2003; Wittke et al., 2010; Arevalo-Martinez et al., 2019). Generally, in the upwelling development area, the concentration of dissolved Fe in the water column is lower than the biological requirement with an increase in productivity, which promotes high absorption of unsaturated Si(OH)4 in water by diatoms (relative to C and other major nutrients), leading to an increase in the Si/C value in diatoms (Takeda, 1998; Pichevin et al., 2014). In Wc-1 well samples, there was a significant negative correlation between the SiO2/TOC and Co × Mn, and a significant positive relationship between the FeT/SiO2 and Co × Mn (Figures 8G,H). This shows that the area was affected by strong upwelling and intermittent volcanic activities in the O—S period, which might have formed an Fe deficiency scenario similar to that of the lower Yangtze platform (Shen et al., 2019; Yang et al., 2021). In the latest Katian, Fe deficiency caused by upwelling resulting in H2S (generated by MSR) accumulation in the water column, thereby resulting in the expansion of euxinia. This conclusion is also supported by the significant negative correlation between δ34Spy and Co × Mn (Figure 8I).
In summary, based on the high availability of sedimentary OM, the redox conditions of shallow water were mainly affected by terrigenous clastic inputs before and after the glacial period, and higher FeHR input was beneficial to the prevalence of ferruginous conditions in water (Figure 9). Under the influence of upwelling and sea level fluctuation in deep-water areas, the shortage of soluble Fe caused by high productivity resulted in the development of euxinia conditions, even at low sulfate concentrations (Figure 9). During the glacial period, the input of terrigenous debris gradually decreased, and with the decrease in the sea level, marine ventilation was strengthened, and the euxinia water gradually narrowed in the basin (Figures 7, 9).
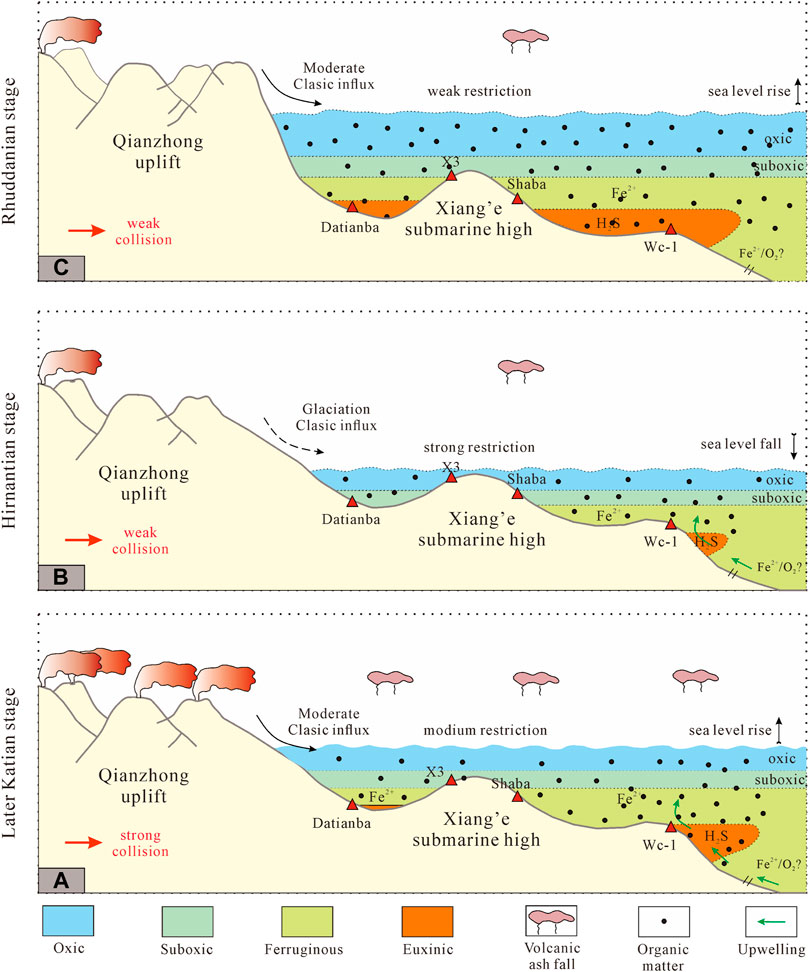
FIGURE 9. Depositional model of A—A’ (Figure 1C) during the O—S period: (A) Late Katian. Ferruginous conditions associated with terrigenous clastic inputs develop in shallow water, and euxinia associated with upwelling and higher organic matter fluxes develop in deep water. (B) Hirnantian. Affected by the decline of sea level, euxinia water gradually fades away in the basin. (C) Rhuddanian. Affected by sea level rise and high organic matter flux, euxinia water expands from deep water to shallow water.
Conclusion
Based on a high-resolution geochemical analysis of Shaba Section and Wc-1 well, combined with published data from two other sections, our study explored the redox conditions of water in the northeastern part of the Upper Yangtze Basin during the O–S transition period. In particular, we analyzed the evolution and control mechanism of euxinia. Notably, under the influence of tectonic movement and climate change, the water restriction and productivity of the basin have changed unevenly. Combined with the analysis of Fe-S-C flux and its mechanism, our results indicate that before and after the glacial period, the more restricted shallow water area counteracted the H2S produced by MSR under the influence of increased FeHR, which was caused by terrestrial debris input, resulting in the transformation of the water column from suboxic to anoxic ferruginous conditions. However, in deep-water areas having weak hydrological constraints, the content of terrestrial input soluble Fe in the water body gradually decreased due to the influence of high productivity and upwelling and H2S was accumulated, resulting in increased euxinia and aggravation of anoxic water. During the glacial period, with a decrease in sea level and terrigenous debris input, the reducibility of the water column weakened and the anoxic area gradually decreased. The sulfur isotope of pyrite (δ34Spy) showed that there were some differences in the sulfate input in different waters and climatic conditions, and that it played a significant role in controlling euxinia development in the basin. Thus, our results highlight the complex control and key role of terrigenous clastic inputs and upwelling in euxinic changes of oceans in semi-restrictive basins during the O—S period.
Data Availability Statement
The original contributions presented in the study are included in the article/Supplementary Material, further inquiries can be directed to the corresponding author.
Author Contributions
Investigation, CW and ZD; methodology, QC and XL; data curation, MT and ZW, writing original draft, CW; review and editing, XF; funding acquisition, CW.
Funding
This study was funded by the National Nature Science Foundation of China (Grant 41772129).
Conflict of Interest
The authors declare that the research was conducted in the absence of any commercial or financial relationships that could be construed as a potential conflict of interest.
Publisher’s Note
All claims expressed in this article are solely those of the authors and do not necessarily represent those of their affiliated organizations, or those of the publisher, the editors and the reviewers. Any product that may be evaluated in this article, or claim that may be made by its manufacturer, is not guaranteed or endorsed by the publisher.
Acknowledgments
We thank Dr. Zihu Zhang for his help in the sulfur isotope analysis. We also thank researcher QC and his team for their help in graptolite identification.
Supplementary Material
The Supplementary Material for this article can be found online at: https://www.frontiersin.org/articles/10.3389/feart.2021.788349/full#supplementary-material
References
Adachi, M., Yamamoto, K., and Sugisaki, R. (1986). Hydrothermal Chert and Associated Siliceous Rocks from the Northern Pacific Their Geological Significance as Indication Od Ocean ridge Activity. Sediment. Geology. 47, 125–148. doi:10.1016/0037-0738(86)90075-8
Algeo, T. J., and Ingall, E. (2007). Sedimentary Corg:P Ratios, Paleocean Ventilation, and Phanerozoic Atmospheric pO2. Palaeogeogr. Palaeoclimatol. Palaeoecol. 256, 130–155. doi:10.1016/j.palaeo.2007.02.029
Algeo, T. J., and Li, C. (2020). Redox Classification and Calibration of Redox Thresholds in Sedimentary Systems. Geochimica et Cosmochimica Acta 287, 8–26. doi:10.1016/j.gca.2020.01.055
Algeo, T. J., Luo, G. M., Song, H. Y., Lyons, T. W., and Canfield, D. E. (2015). Reconstruction of Secular Variation in Seawater Sulfate Concentrations. Biogeosciences 12, 2131–2151. doi:10.5194/bg-12-2131-2015
Algeo, T. J., Marenco, P. J., and Saltzman, M. R. (2016). Co-Evolution of Oceans, Climate, and the Biosphere during the 'Ordovician Revolution': A Review. Palaeogeogr. Palaeoclimatol. Palaeoecol. 458, 1–11. doi:10.1016/j.palaeo.2016.05.015
Algeo, T. J., and Rowe, H. (2012). Paleoceanographic Applications of Trace-Metal Concentration Data. Chem. Geology. 324-325, 6–18. doi:10.1016/j.chemgeo.2011.09.002
Algeo, T. J., and Tribovillard, N. (2009). Environmental Analysis of Paleoceanographic Systems Based on Molybdenum-Uranium Covariation. Chem. Geology. 268, 211–225. doi:10.1016/j.chemgeo.2009.09.001
Alsenz, H., Regnery, J., Ashckenazi-Polivoda, S., Meilijson, A., Ron-Yankovich, L., Abramovich, S., et al. (2013). Sea Surface Temperature Record of a Late Cretaceous Tropical Southern Tethys Upwelling System. Palaeogeogr. Palaeoclimatol. Palaeoecol. 392, 350–358. doi:10.1016/j.palaeo.2013.09.013
Arevalo-Martinez, D. L., Steinhoff, T., Brandt, P., Koertzinger, A., Lamont, T., Rehder, G., et al. (2019). N2O Emissions from the Northern Benguela Upwelling System. Geophys. Res. Lett. 46, 3317–3326. doi:10.1029/2018GL081648
Bao, Y., Ju, Y., Yin, Z., Xiong, J., Wang, G., and Qi, Y. (2020). Influence of Reservoir Properties on the Methane Adsorption Capacity and Fractal Features of Coal and Shale in the Upper Permian Coal Measures of the South Sichuan coalfield, China. Energy Exploration & Exploitation 38 (1), 57–78. doi:10.1177/0144598719877527
Bao, Y., Li, D., and Ju, Y. (20212021). Constraints of Biomethane Generation Yield and Carbon Isotope Fractionation Effect in the Pathway of Acetotrophic with Different Coal-Rank Coals. Fuel 305, 121493. doi:10.1016/j.fuel.2021.121493
Bhatia, M. R., and Crook, K. A. W. (1986). Trace Element Characteristics of Graywackes and Tectonic Setting Discrimination of Sedimentary Basins. Contr. Mineral. Petrol. 92, 181–193. doi:10.1007/bf00375292
Boening, P., Brumsack, H., Schnetger, B., and Grunwald, M. (2009). Trace Element Signatures of Chilean Upwelling Sediments at Similar to 36 Degrees S. Mar. Geol. 259, 112–121. doi:10.1016/j.margeo.2009.01.004
Canfield, D. E., Raiswell, R., Westrich, J. T., Reaves, C. M., and Berner, R. A. (1986). The Use of Chromium Reduction in the Analysis of Reduced Inorganic Sulfur in Sediments and Shales. Chem. Geol. 54 (1), 149–155. doi:10.1016/0009-2541(86)90078-1
Chen, X., Fan, J., Chen, Q., Tang, L., and Hou, X. (2014). Toward a Stepwise Kwangsian Orogeny. Sci. China Earth Sci. 57, 379–387. doi:10.1007/s11430-013-4815-y
Chen, X., Rong, J., Li, Y., and Boucot, A. J. (2004). Facies Patterns and Geography of the Yangtze Region, South China, through the Ordovician and Silurian Transition. Palaeogeogr. Palaeocl 204, 353–372. doi:10.1016/S0031-0182(03)00736-3
Chen, X., Rong, J., Mitchell, C. E., Happer, D. A. T., Fan, J., Zhan, R., et al. (2000). Late Ordovician to Earliest Silurian Graptolite and Brachiopod Biozonation from the Yangtze Region, South China, with a Global Correlation. Geol. Mag. 137, 623–650. doi:10.1017/S0016756800004702
Clarkson, M. O., Poulton, S. W., Guilbaud, R., and Wood, R. A. (2014). Assessing the Utility of Fe/Al and Fe-Speciation to Record Water Column Redox Conditions in Carbonate-Rich Sediments. Chem. Geology. 382, 111–122. doi:10.1016/j.chemgeo.2014.05.031
Cooper, R. A., Rigby, S., Loydell, D. K., and Bates, D. E. B. (2012). Palaeoecology of the Graptoloidea. Earth-Science Rev. 112, 23–41. doi:10.1016/j.earscirev.2012.01.001
Cox, R., Lowe, D. R., and Cullers, R. L. (1995). The Influence of Sediment Recycling and Basement Composition on Evolution of Mudrock Chemistry in the Southwestern United States. Geochimica et Cosmochimica Acta 59 (14), 2919–2940. doi:10.1016/0016-7037(95)00185-9
Cullers, R., and Podkovyrov, V. N. (2000). Geochemistry of the Mesoproterozoic Lakhanda Shales in southeastern Yakutia, Russia: Implications for Mineralogical and Provenance Control, and Recycling. Precambrian Res. 104, 77–93. doi:10.1016/S0301-9268(00)00090-5
Delabroye, A., and Vecoli, M. (2010). The End-Ordovician Glaciation and the Hirnantian Stage: A Global Review and Questions about Late Ordovician Event Stratigraphy. Earth-Science Rev. 98, 269–282. doi:10.1016/j.earscirev.2009.10.010
Floyd, P. A., and Leveridge, B. E. (1987). Tectonic Environment of the Devonian Gramscatho Basin, South Cornwall: Framework Mode and Geochemical Evidence from Turbiditic Sandstones. J. Geol. Soc. 144, 531–542. doi:10.1144/gsjgs.144.4.0531
Gupta, G. V. M., Sudheesh, V., Sudharma, K. V., Saravanane, N., Dhanya, V., Dhanya, K. R., et al. (2016). Evolution to Decay of Upwelling and Associated Biogeochemistry over the southeastern Arabian Sea Shelf. J. Geophys. Res. Biogeosci. 121, 159–175. doi:10.1002/2015jg003163
Harper, D. A. T., Hammarlund, E. U., and Rasmussen, C. M. Ø. (2014). End Ordovician Extinctions: A Coincidence of Causes. Gondwana Res. 25, 1294–1307. doi:10.1016/j.gr.2012.12.021
Hayashi, K.-I., Fujisawa, H., Holland, H. D., and Ohmoto, H. (1997). Geochemistry of ∼1.9 Ga Sedimentary Rocks from Northeastern Labrador, Canada. Geochimica et Cosmochimica Acta 61, 4115–4137. doi:10.1016/s0016-7037(97)00214-7
Huang, H., He, D., Li, D., Li, Y., Zhang, W., and Chen, J. (2020). Geochemical Characteristics of Organic-Rich Shale, Upper Yangtze Basin: Implications for the Late Ordovician-Early Silurian Orogeny in South China. Palaeogeogr. Palaeoclimatol. Palaeoecol. 554, 109822. doi:10.1016/j.palaeo.2020.109822
Huang, H., He, D., Li, Y., Li, J., and Zhang, L. (2018). Silurian Tectonic-Sedimentary Setting and basin Evolution in the Sichuan Area, Southwest China: Implications for Palaeogeographic Reconstructions. Mar. Pet. Geology. 92, 403–423. doi:10.1016/j.marpetgeo.2017.11.006
Jablonski, D. (1991). Extinctions: A Paleontological Perspective. Science 253, 754–757. doi:10.1126/science.253.5021.754
Jin, C., Liao, Z., and Tang, Y. (2020). Sea-Level Changes Control Organic Matter Accumulation in the Longmaxi Shales of southeastern Chongqing, China. Mar. Petrol. Geol. 119, 104478. doi:10.1016/j.marpetgeo.2020.104478
Johnston, D. T., Poulton, S. W., Dehler, C., Porter, S., Husson, J., Canfield, D. E., et al. (2010). An Emerging Picture of Neoproterozoic Ocean Chemistry: Insights from the Chuar Group, Grand Canyon, USA. Earth Planet. Sci. Lett. 290, 64–73. doi:10.1016/j.epsl.2009.11.059
Leavitt, W. D., Halevy, I., Bradley, A. S., and Johnston, D. T. (2013). Influence of Sulfate Reduction Rates on the Phanerozoic Sulfur Isotope Record. Proc. Natl. Acad. Sci. 110, 11244–11249. doi:10.1073/pnas.1218874110
Li, N., Li, C., Algeo, T. J., Cheng, M., Jin, C., Zhu, G., et al. (2021). Redox Changes in the Outer Yangtze Sea (South China) through the Hirnantian Glaciation and Their Implications for the End-Ordovician Biocrisis. Earth-Science Rev. 212, 103443. doi:10.1016/j.earscirev.2020.103443
Li, N., Li, C., Fan, J., Algeo, T. J., Yan, D., Zhu, G., et al. (2019). Sulfate-Controlled marine Euxinia in the Semi-restricted Inner Yangtze Sea (South China) during the Ordovician-Silurian Transition. Palaeogeogr. Palaeoclimatol. Palaeoecol. 534, 109281. doi:10.1016/j.palaeo.2019.109281
Li, Y., Zhang, T., Ellis, G. S., and Shao, D. (2017). Depositional Environment and Organic Matter Accumulation of Upper Ordovician-Lower Silurian marine Shale in the Upper Yangtze Platform, South China. Palaeogeogr. Palaeoclimatol. Palaeoecol. 466, 252–264. doi:10.1016/j.palaeo.2016.11.037
Liang, C., Jiang, Z., Cao, Y., Zhang, J., and Guo, L. (2017). Sedimentary Characteristics and Paleoenvironment of Shale in the Wufeng-Longmaxi Formation, North Guizhou Province, and its Shale Gas Potential. J. Earth Sci. 28, 1020–1031. doi:10.1007/s12583-016-0932-x
Little, S. H., Vance, D., Lyons, T. W., and McManus, J. (2015). Controls on Trace Metal Authigenic Enrichment in Reducing Sediments: Insights from Modern Oxygen-Deficient Settings. Am. J. Sci. 315, 77–119. doi:10.2475/02.2015.01
Liu, Y., Li, C., Algeo, T. J., Fan, J., and Peng, P. A. (2016). Global and Regional Controls on marine Redox Changes across the Ordovician-Silurian Boundary in South China. Palaeogeogr. Palaeoclimatol. Palaeoecol. 463, 180–191. doi:10.1016/j.palaeo.2016.10.006
Liu, Y., Wu, B., Gong, Q., and Cao, H. (2019). Geochemical Characteristics of the Lower Silurian Longmaxi Formation on the Yangtze Platform, South China: Implications for Depositional Environment and Accumulation of Organic Matters. J. Asian Earth Sci. 184, 104003. doi:10.1016/j.jseaes.2019.104003
Lu, H., and Jiang, Z. (1999). Application of Geochemical Analysis of Rare Earth Elements in the Study of Lithofacies Paleogeography. J. Univ. Pet. China 23 (1), 6–8. doi:10.3321/j.issn:1000-5870.1999.01.002
McLennan, S. M., Hemming, S., McDaniel, D. K., and Hanson, G. N. (1993). Geochemical Approaches to Sedimentation, Provenance, and Tectonics. Spec. Pap. Geol. Soc. America 284, 21–40. doi:10.1130/spe284-p21
McLennan, S. M. (2001). Relationships between the Trace Element Composition of Sedimentary Rocks and Upper continental Crust. Geochem. Geophys. Geosystems 2, n/a. doi:10.1029/2000gc000109
Melchin, M. J. (2008). Restudy of Some Ordovician-Silurian Boundary Graptolites from Anticosti Island, Canada, and Their Biostratigraphic Significance. Lethaia 41, 155–162. doi:10.1111/j.1502-3931.2007.00045.x
Murphy, A. E., Sageman, B. B., Hollander, D. J., Lyons, T. W., and Brett, C. E. (2000). Black Shale Deposition and Faunal Overturn in the Devonian Appalachian Basin: Clastic Starvation, Seasonal Water-Column Mixing, and Efficient Biolimiting Nutrient Recycling. Paleoceanography 15, 280–291. doi:10.1029/1999PA000445
Murray, R. W. (1994). Chemical Criteria to Identify the Depositional Environment of Chert: General Principles and Applications. Sediment. Geology. 90, 213–232. doi:10.1016/0037-0738(94)90039-6
Nesbitt, H. W., and Young, G. M. (1982). Early Proterozoic Climates and Plate Motions Inferred from Major Element Chemistry of Lutites. Nature 299, 715–717. doi:10.1038/299715a0
Nie, H., Jin, Z., and Zhang, J. (2018). Characteristics of Three Organic Matter Pore Types in the Wufeng-Longmaxi Shale of the Sichuan Basin, Southwest China. Sci. Rep. 8, 7014. doi:10.1038/s41598-018-25104-5
Panahi, A., Young, G. M., and Rainbird, R. H. (2000). Behavior of Major and Trace Elements (Including REE) during Paleoproterozoic Pedogenesis and Diagenetic Alteration of an Archean Granite Near Ville Marie, Québec, Canada. Geochimica et Cosmochimica Acta 64, 2199–2220. doi:10.1016/S0016-7037(99)00420-2
Pichevin, L. E., Ganeshram, R. S., Geibert, W., Thunell, R., and Hinton, R. (2014). Silica Burial Enhanced by Iron Limitation in Oceanic Upwelling Margins. Nat. Geosci 7, 541–546. doi:10.1038/ngeo2181
Pope, M. C., and Steffen, J. B. (2003). Widespread, Prolonged Late Middle to Late Ordovician Upwelling in North America: A Proxy Record of Glaciation? Geology 31, 63–66. doi:10.1130/0091-7613(2003)031<0063:wplmtl>2.0.co;2
Poulton, S. W., and Canfield, D. E. (2005). Development of a Sequential Extraction Procedure for Iron: Implications for Iron Partitioning in Continentally Derived Particulates. Chem. Geology. 214, 209–221. doi:10.1016/j.chemgeo.2004.09.003
Poulton, S. W., and Canfield, D. E. (2011). Ferruginous Conditions: A Dominant Feature of the Ocean through Earth's History. Elements 7, 107–112. doi:10.2113/gselements.7.2.107
Poulton, S. W., Henkel, S., März, C., Urquhart, H., Flögel, S., Kasten, S., et al. (2015). A continental-Weathering Control on Orbitally Driven Redox-Nutrient Cycling during Cretaceous Oceanic Anoxic Event 2. Geology 43, 963–966. doi:10.1130/g36837.1
Poulton, S. W., and Raiswell, R. (2002). The Low-Temperature Geochemical Cycle of Iron: From Continental Fluxes to Marine Sediment Deposition. Am. J. Sci. 302, 774–805. doi:10.2475/ajs.302.9.774
Raiswell, R., and Canfield, D. E. (2012). The Iron Biogeochemical Cycle Past and Present. GeochemPersp 1, 1–220. doi:10.7185/geochempersp.1.1
Rowe, H. D., Loucks, R. G., Ruppel, S. C., and Rimmer, S. M. (2008). Mississippian Barnett Formation, Fort Worth Basin, Texas: Bulk Geochemical Inferences and Mo-TOC Constraints on the Severity of Hydrographic Restriction. Chem. Geology. 257, 16–25. doi:10.1016/j.chemgeo.2008.08.006
Rudnick, R. L., and Gao, S. (2003). “Composition of the Continental Crust,” in The Crust, Treatise on Geochemistry. Editor R.L. Rudnick (Oxford, UK: The crust, Elsevier-Pergamon), 1–64. doi:10.1016/b0-08-043751-6/03016-4
Selvaraj, K., and Chen, C. T. A. (2006). Moderate Chemical Weathering of Subtropical Taiwan: Constraints from Solid‐Phase Geochemistry of Sediments and Sedimentary Rocks. J. Geology. 114, 101–116. doi:10.1086/498102
Shen, J., Algeo, T. J., Chen, J., Planavsky, N. J., Feng, Q., Yu, J., et al. (2019). Mercury in marine Ordovician/Silurian Boundary Sections of South China Is Sulfide-Hosted and Non-Volcanic in Origin. Earth Planet. Sci. Lett. 511, 130–140. doi:10.1016/j.epsl.2019.01.028
Shen, J., Schoepfer, S. D., Feng, Q., Zhou, L., Yu, J., Song, H., et al. (2015). Marine Productivity Changes during the End-Permian Crisis and Early Triassic Recovery. Earth-Science Rev. 149, 136–162. doi:10.1016/j.earscirev.2014.11.002
Stanley, S. M. (2010). Thermal Barriers and the Fate of Perched Faunas. Geology 38, 31–34. doi:10.1130/g30295.1
Su, W. B., Li, Z. M., Ettensohm, F. R., and Johnson, M. E. (2007). Distribution of Black Shale in the Wufeng-Longmaxi Formations (Ordovician-Silurian), South China: Major Controlling Factors and Implications. Earth Sci. J. China Univ. Geosci. 32 (6), 819–827. (in Chinese with English abstract). doi:10.3321/j.issn:1000-2383.2007.06.013
Sutcliffe, O. E., Dowdeswell, J. A., Whittington, R. J., Theron, J. N., and Craig, J. (2000). Calibrating the Late Ordovician Glaciation and Mass Extinction by the Eccentricity Cycles of Earthʼs Orbit. Geology 28, 967–970. doi:10.1130/0091-7613(2000)028<0967:ctloga>2.3.co;2
Sweere, T., van den Boorn, S., Dickson, A. J., and Reichart, G.-J. (2016). Definition of New Trace-Metal Proxies for the Controls on Organic Matter Enrichment in marine Sediments Based on Mn, Co, Mo and Cd Concentrations. Chem. Geology. 441, 235–245. doi:10.1016/j.chemgeo.2016.08.028
Takeda, S. (1998). Influence of Iron Availability on Nutrient Consumption Ratio of Diatoms in Oceanic Waters. Nature 393, 774–777. Available at: www.nature.com/articles/31674. doi:10.1038/31674
Taylor, S. R., and McClcnnan, S. M. (1985). The continental Crust: Its Composition and Evolution. Oxford, UK: Blackwell Scientific Publications.
Tribovillard, N., Algeo, T. J., Lyons, T., and Riboulleau, A. (2006). Trace Metals as Paleoredox and Paleoproductivity Proxies: An Update. Chem. Geology. 232, 12–32. doi:10.1016/j.chemgeo.2006.02.012
van de Kamp, P. C., and Leake, B. E. (1985). Petrography and Geochemistry of Feldspathic and Mafic Sediments of the Northeastern Pacific Margin. Trans. R. Soc. Edinb. Earth Sci. 76 (4), 411–449. doi:10.1017/s0263593300010646
Wang, C., Dong, Z., Fu, X., Hu, X., and Li, Z. (2021). Origin and Paleoenvironment of Organic Matter in the Wufeng-Longmaxi Shales in the Northeastern Sichuan basin. Energy Exploration & Exploitation 39, 134–155. doi:10.1177/0144598720978007
Wang, S., Dong, D., Wang, Y., Li, X., Huang, J., and Guan, Q. (2016). Sedimentary Geochemical Proxies for Paleoenvironment Interpretation of Organic-Rich Shale: A Case Study of the Lower Silurian Longmaxi Formation, Southern Sichuan Basin, China. J. Nat. Gas Sci. Eng. 28, 691–699. doi:10.1016/j.jngse.2015.11.045
Wang, X., Zhu, Y., Lash, G. G., and Wang, Y. (2019). Multi-proxy Analysis of Organic Matter Accumulation in the Upper Ordovician-Lower Silurian Black Shale on the Upper Yangtze Platform, south China. Mar. Pet. Geology. 103, 473–484. doi:10.1016/j.marpetgeo.2019.03.013
Wang, Y., Li, X., Dong, D., Zhang, C., and Wang, S. (2017). Major Controlling Factors for the High-Quality Shale of Wufeng-Longmaxi Formation, Sichuan Basin. Energy Exploration & Exploitation 35, 444–462. doi:10.1177/0144598717698080
Wedepohl, K. H. (1971). Environmental Influences on the Chemical Composition of Shales and Clays. Phys. Chem. Earth 8, 307–333. doi:10.1016/0079-1946(71)90020-6
Wittke, F., Kock, A., and Bange, H. W. (2010). Nitrous Oxide Emissions from the Upwelling Area off Mauritania (NW Africa). Geophys. Res. Lett. 37, 2–6. doi:10.1029/2010gl042442
Wu, J., Liang, C., Hu, Z., Yang, R., Xie, J., Wang, R., et al. (2019). Sedimentation Mechanisms and Enrichment of Organic Matter in the Ordovician Wufeng Formation-Silurian Longmaxi Formation in the Sichuan Basin. Mar. Pet. Geology. 101, 556–565. doi:10.1016/j.marpetgeo.2018.11.025
Xi, Z., Tang, S., Lash, G. G., Zhang, B., and Lin, D. (2021). Geochemical Characteristics of Organic Carbon and Pyrite Sulfur in Ordovician-Silurian Transition Shales in the Yangtze Platform, South China: Implications for the Depositional Environment. Palaeogeogr. Palaeoclimatol. Palaeoecol. 563, 110173. doi:10.1016/j.palaeo.2020.110173
Xiong, F., Jiang, Z., Huang, H., Wen, M., and Moortgat, J. (2019). Mineralogy and Gas Content of Upper Paleozoic Shanxi and Benxi Shale Formations in the Ordos Basin. Energy Fuels 33, 1061–1068. doi:10.1021/acs.energyfuels.8b04059
Yamamoto, K. (1987). Geochemical Characteristics and Depositional Environments of Cherts and Associated Rocks in the Franciscan and Shimanto Terranes. Sediment. Geology. 52, 65–108. doi:10.1016/0037-0738(87)90017-0
Yang, S., Hu, W., and Wang, X. (2021). Mechanism and Implications of Upwelling from the Late Ordovician to Early Silurian in the Yangtze Region, South China. Chem. Geology. 565, 120074. doi:10.1016/j.chemgeo.2021.120074
Young, G. M., and Nesbitt, H. W. (1998). Processes Controlling the Distribution of Ti and Al in Weathering Profiles, Siliciclastic Sediments and Sedimentary Rocks. J. Sediment. Res. 68 (3), 448–455. doi:10.2110/jsr.68.448
Zhang, C.-L., Santosh, M., Zhu, Q.-B., Chen, X.-Y., and Huang, W.-C. (2015). The Gondwana Connection of South China: Evidence from Monazite and Zircon Geochronology in the Cathaysia Block. Gondwana Res. 28, 1137–1151. doi:10.1016/j.gr.2014.09.007
Zhang, C., Huang, H., and Hou, M. C. (2017). Progress and Problems in the Geochemical Study on Chert Genesis for Interpretation of Tectonic Background. J. Chengdu Univers. Technol. (Sci. Technol. Edition) 44 (3), 293–304. (in Chinese with English abstract). doi:10.3969/j.issn.1671-9727.2017.03.03
Zou, C., Dong, D., Wang, Y., Li, X., Huang, J., Wang, S., et al. (2016). Shale Gas in China: Characteristics, Challenges and Prospects (II). Pet. Exploration Develop. 43, 182–196. doi:10.1016/s1876-3804(16)30022-2
Zou, C., Qiu, Z., Wei, H., Dong, D., and Lu, B. (2018). Euxinia Caused the Late Ordovician Extinction: Evidence from Pyrite Morphology and Pyritic Sulfur Isotopic Composition in the Yangtze Area, South China. Palaeogeogr. Palaeoclimatol. Palaeoecol. 511, 1–11. doi:10.1016/j.palaeo.2017.11.033
Keywords: redox conditions, δ34Spy isotope, chemical index of alteration, upper yangtze basin, late ordovician—early silurian
Citation: Wang C, Dong Z, Fu X, Chen Q, Liu X, Tang M and Wang Z (2021) Spatiotemporal Evolution and Genesis of the Late Ordovician—Early Silurian Marine Euxinia in Northeastern Upper Yangtze Basin, South China. Front. Earth Sci. 9:788349. doi: 10.3389/feart.2021.788349
Received: 02 October 2021; Accepted: 08 November 2021;
Published: 08 December 2021.
Edited by:
Jienan Pan, Henan Polytechnic University, ChinaReviewed by:
Yuan Bao, Xi’an University of Science and Technology, ChinaJiang-Hai Wang, Sun Yat-sen University, China
Weiqing Liu, Henan Polytechnic University, China
Copyright © 2021 Wang, Dong, Fu, Chen, Liu, Tang and Wang. This is an open-access article distributed under the terms of the Creative Commons Attribution License (CC BY). The use, distribution or reproduction in other forums is permitted, provided the original author(s) and the copyright owner(s) are credited and that the original publication in this journal is cited, in accordance with accepted academic practice. No use, distribution or reproduction is permitted which does not comply with these terms.
*Correspondence: Zaitian Dong, dongzt@cumt.edu.cn