
95% of researchers rate our articles as excellent or good
Learn more about the work of our research integrity team to safeguard the quality of each article we publish.
Find out more
ORIGINAL RESEARCH article
Front. Earth Sci. , 24 November 2021
Sec. Structural Geology and Tectonics
Volume 9 - 2021 | https://doi.org/10.3389/feart.2021.787736
This article is part of the Research Topic Advances in the Study of Natural Fractures in Deep and Unconventional Reservoirs View all 29 articles
 Dezhi Qiu1,2*
 Jun Zhang3*Yinhe Lin1Jinchuan Liu1Minou Rabiei2Vamegh Rasouli2Branko Damjanac4Rui Huang5
Accurate prediction of the fracture geometry before the operation of a hydraulic fracture (HF) job is important for the treatment design. Simplified planar fracture models, which may be applicable to predict the fracture geometry in homogeneous and continuous formations, fail in case of fractured reservoirs and laminated formations such as shales. To gain a better understanding of the fracture propagation mechanism in laminated formations and their vertical geometry to be specific, a series of numerical models were run using XSite, a lattice-based simulator. The results were studied to understand the impact of the mechanical properties of caprock and injection parameters on HF propagation. The tensile and shear stimulated areas were used to determine the ability of HF to propagate vertically and horizontally. The results indicated that larger caprock Young’s modulus increases the stimulated area (SA) in both vertical and horizontal directions, whereas it reduces the fracture aperture. Also, larger vertical stress anisotropy and tensile strength of caprock and natural interfaces inhibit the horizontal fracture propagation with an inconsiderable effect in vertical propagation, which collectively reduces the total SA. It was also observed that an increased fluid injection rate suppresses vertical fracture propagation with an insignificant effect on horizontal propagation. The dimensionless parameters defined in this study were used to characterize the transition of HF propagation behavior between horizontal and vertical HFs.
Hydraulic fracturing is a widely used stimulation technology in unconventional reservoirs. Due to the sedimentation process, the reservoirs and the over- and underlying formations are formed in a laminated form, which is known as the transverse isotropic medium. In general, sediments are horizontal layers, with the axis of symmetry perpendicular to the lamination; therefore, they are referred to as a vertical transversely isotropic medium (VTI or TIV). Figure 1A shows an example of fracture propagation from a stiff layer to another one, penetrating through a soft layer in between. Based on several published studies, it is well known that the fracture geometry in laminated formations is a function of stress anisotropy, the contrast between the mechanical properties of the reservoir formation and caprocks, and, to some extent, the operational aspects, such as the injection rate and fluid properties (Zhou et al., 2016; Li et al., 2017; Zeng et al., 2018; Aimene et al., 2019; Dou et al., 2019). Understanding hydraulic fracture (HF) propagation in laminated reservoirs is important to accurately predict the fracture geometry for the treatment design.
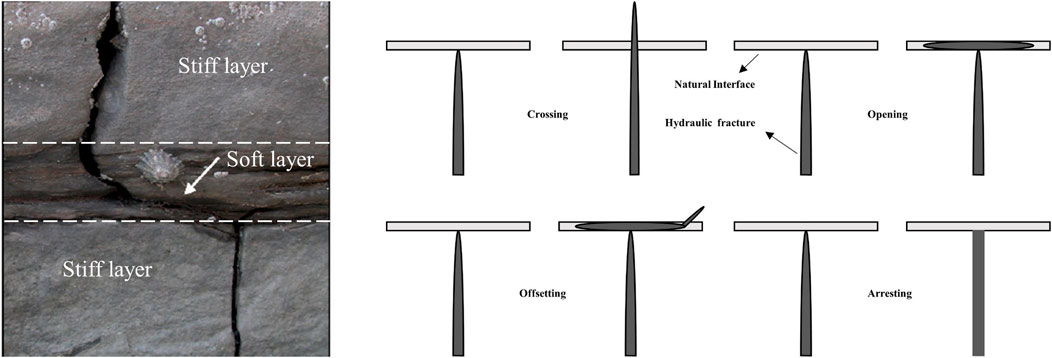
FIGURE 1. (A) Hydraulic fracture propagation in the alternation of stiff and soft layers (Afsar, 2014). (B) Interaction modes between the hydraulic fracture and a natural interface (Sarmadivaleh, 2012).
Figure 1B presents the four observed interaction mechanisms (modes) when an HF intersects a natural interface (e.g., natural fracture or lamination). These are crossing, opening (HF only propagates along the interface), offsetting (HF reinitiate on the other side of the interface after a short propagation along the interface), and arresting (HF cannot cross or open the interface) mechanisms (Guo et al., 2017). Bakhshi et al. (2019) performed hydraulic fracture simulations based on a lattice-based method to investigate the interaction modes between the hydraulic fracture and natural interfaces considering the variable shear strength of interfaces. All simulation results are consistent with the laboratory experiment results(Sarmadivaleh and Rasouli, 2015) and proved the applicability and accuracy of the lattice-based method, which will be used in this article.
Based on the laboratory experimental and field data, some researchers concluded that the contrast in the mechanical properties of adjacent layers primarily determines the fracture height growth (Simonson et al., 1978). They outlined that HF would be contained if the stiffness of the pay zone was less than that of the adjacent caprock layers; otherwise, fracture penetration would occur. However, some scholars claimed that the fracture containment was ascribed not only to stiffness between layers but also to interface properties and interlayer stress differences (Warpinski et al., 1982; Teufel and Clark, 1984; Smith et al., 2001; Gu and Siebrits, 2005; Daneshy, 2007; Zhou et al., 2017). In addition, the interfacial shear strength and the angle of approach between the HF and natural interface may play an important role in HF containment. Essentially, the effect of the angle of the approach is also realized by affecting the shear strength of the interface. Some laboratory experiments performed to study the influence of the interfacial shear strength effect on HF interactions with natural fractures showed that a strong interface reduces the possibility of interfacial slippage but benefits HF penetration (Sarmadivaleh, 2012; Sarmadivaleh and Rasouli, 2015).
In recent decades, with the rapid development of computer science, numerical techniques have been developed to simulate HF based on different methods such as the boundary element method (BEM), finite element method (FEM), extended finite element method (XFEM), finite difference method (FDM), displacement discontinuity method (DDM), discrete element method (DEM), and some hybrid methods (Wu and Olson, 2015; Khoei et al., 2018; Vahab et al., 2019; Xie et al., 2020). Some fluid–solid models, based on the DEM, were conducted to demonstrate that the vertical heterogeneity can influence HF extension (Chen et al., 2015; Haddad et al., 2017; Wang et al., 2017; Zhang et al., 2017; Liu et al., 2019; Liu et al.,2020). The interaction modes between the HF and discontinuities were modeled to predict the possible fracture extension path (Zhang and Jeffrey, 2012; Weng et al., 2018).
In this article, XSite, a DEM-based software with high computational efficiency, was used to simulate HF propagation and its geometry in laminated formations (Damjanac et al., 2013). The tension and shear damaged zones, which are known as stimulated reservoir areas (SRAs), and the potential slippage of HF and the natural interface were determined. The impact of mechanical properties of the reservoir formation and caprocks, the stress anisotropy, natural interface properties, and injecting fluid properties was investigated. The results are presented in the following sections.
The lattice simulation used in this study consists of a series of quasi-randomly distributed, non-linear spring-connected nodes as a representation of the nodal and rock matrices. Fluid flow throughout the node network, including pre-existing joints and newly developed fractures as well as the rock matrix, and the resulting pressures are used to calculate the effective stresses (i.e., conditions that cause deformation and affect damage). To better simulate non-linear behaviors, such as fracture, sliding, and fracture opening/closing, all codes use display solutions. The discrete fracture network (DFN) is overlaid on a lattice spring network, assigning elasticity and strength parameters of the crack to the spring. If two nodes of a spring are placed on opposite sides of a joint plane, the spring will obey the smooth joint model (SJM) approach. During the analysis, only the direction of the discontinuity plane is considered, rather than the direction of the individual springs along the joint plane. The angle of the plane becomes the dominant direction when the joint plane cuts the spring (instead of the direction of the spring) (Damjanac and Cundall, 2016).
The following central difference formulas of linear momentum equilibrium and displacement–velocity relation are used for each node to simulate the translational motion of each node (Damjanac et al., 2016):
where,
where,
Flow in a crack, either pre-existing (specified as model input) or newly created (by breaking lattice springs), is solved in a network of fluid nodes connected by pipes (one-dimensional flow cells). Fluid pressure is present in fluid nodes that act as microcracks located on broken springs or springs crossed by pre-existing joints. The crossed cracks are connected by pipes that allow the fluid to flow between the fluid nodes. Specifically, fluid nodes are connected to all fluid nodes within a distance equal to the lattice resolution multiplied by the fluid resolution, which is a user-specified dimensionless parameter between 0.6 and 1.2 (default value is 0.8). The flow velocity is calculated for each flow pipe. The geometry of the flow model is a function of the crack geometry in the solid model and is automatically generated and updated according to the evolution of the solid model (i.e., new cracks are generated). Initially, at the beginning of the simulation, the flow network is generated in a specified pre-existing joint (i.e., DFN). Due to the forces in the joints, the joints’ springs break, resulting in microcracks, so the code automatically creates new fluid nodes and connects them using flow pipes based on the spatial relationship with the existing flow network (Damjanac and Cundall, 2016).
In this study, a two-caprock layer model with laminations in a horizontal direction was established for simulation purposes. The model, as shown in Figure 2A, has a length (along the X-axis), width (along the Z-axis), and height (along the Y-axis) of 10, 8, and 8 m, respectively. The reservoir layer of 2 m height is located in the middle of the model. The caprocks are homogenous materials with 1 m thickness placed above and below the reservoir formation. The six zero-thickness interfaces 1 m apart from each other, as labeled from 1 to 6 in Figure 2B, were used to characterize the cemented natural interface between layers. The principal stresses were considered as σh = 5 MPa, σv = 10 MPa, and σH = 8 MPa in X, Y, and Z directions, respectively. It is important to note that in order to speed up the simulations, the stress differences were applied to the model, rather than the total stresses. This will have no impact on the fracture geometry but only fracture pressures. The fracture is initiated from a cluster in the middle of a horizontal wellbore, which is placed along the X-axis (or σh) direction. The spherical cluster is the point of fracturing fluid injection, and a small starter crack (notch) is placed perpendicular to σh in order to facilitate fracture initiation.
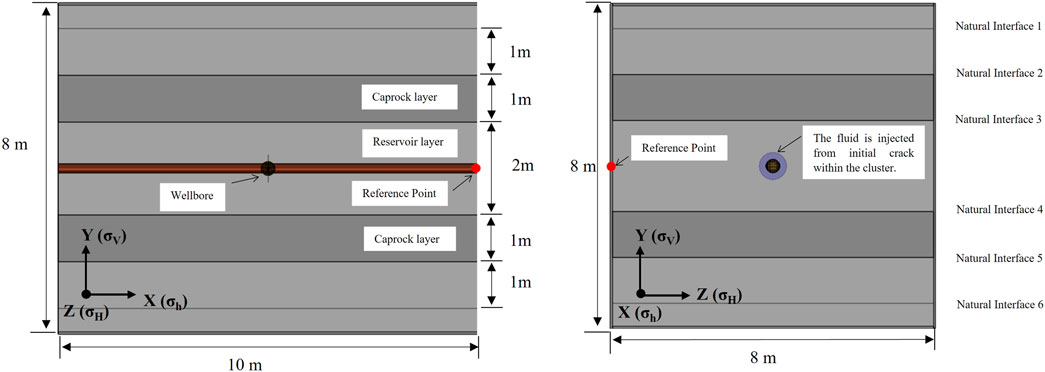
FIGURE 2. Sketch of the numerical model: (A) front view (X-Y plane), (B) side view (Y-Z plane).
The mechanical properties of this model, which are typical values of a tight unconventional formation, are listed in Table 1. The injection fluid is slick water with a viscosity of 0.002 Pa.s. The simulation was run in a mechanical step for 0.1 s to achieve an initial model equilibrium and continued in the fluid–solid coupling mode after starting the fluid step.
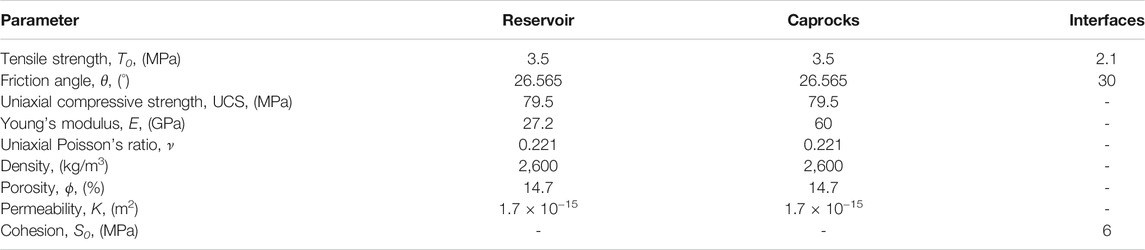
TABLE 1. Input parameters of the simulation models.
Complex fracture geometries consist of tensile and shear fractures (Settgast et al., 2017). To quantify the simulation results of HF propagation in a laminated reservoir, the concept of the stimulated area (SA) is proposed to evaluate the fracture area generated by HF. The shear stimulated area (SSA) is defined as the region containing natural discontinuities that are subjected to shear slippage. By contrast, the tensile stimulated area (TSA) refers to the area where tension fractures form. These two parameters are used to describe the HF extensional patterns in laminated formations. The SSA may represent the area along the natural interface that is stimulated by HF. A higher SSA along an interface means larger fracture connectivity. On the other hand, the TSA may be more representative of the vertical extension of HF (i.e., fracture height). The greater the TSA in the vertical direction, the larger will be the fracture penetration. In the following sections, the effect of caprock Young’s modulus, stress anisotropy, interface properties, and injecting fluid rate on SSA and STA, and hence, fracture geometry will be modeled and the results discussed.
The effect of Young’s modulus on HF geometry is presented here. The caprock Young’s modulus varied from 20 MPa to 27.7, 40, 50, and 60 MPa, while reservoir formation Young’s modulus remained unchanged at 27.7 MPa. The front view (X-Y plane) and side view (Y-Z plane) of the simulation results are shown in Figures 3A,B. As shown in Figure 3A, the yellow wellbore is oriented horizontally, two dark gray layers serve as the caprock of the model, HF is shown in blue propagating vertically, and some fluid flows into the natural fracture along the interface. The results illustrate that the caprock inhibits HF vertical propagation but promotes its extension along the interfaces between adjacent layers, particularly the inner interfaces near the injection point. In order to examine the effect of the angle of the approach, the models were run at inclinations of 0°, 10°, and 20°. The results show the greater the inclination, the larger will be the slippage area. This is in agreement with previously published results (Goldstein and Osipenko, 2015).
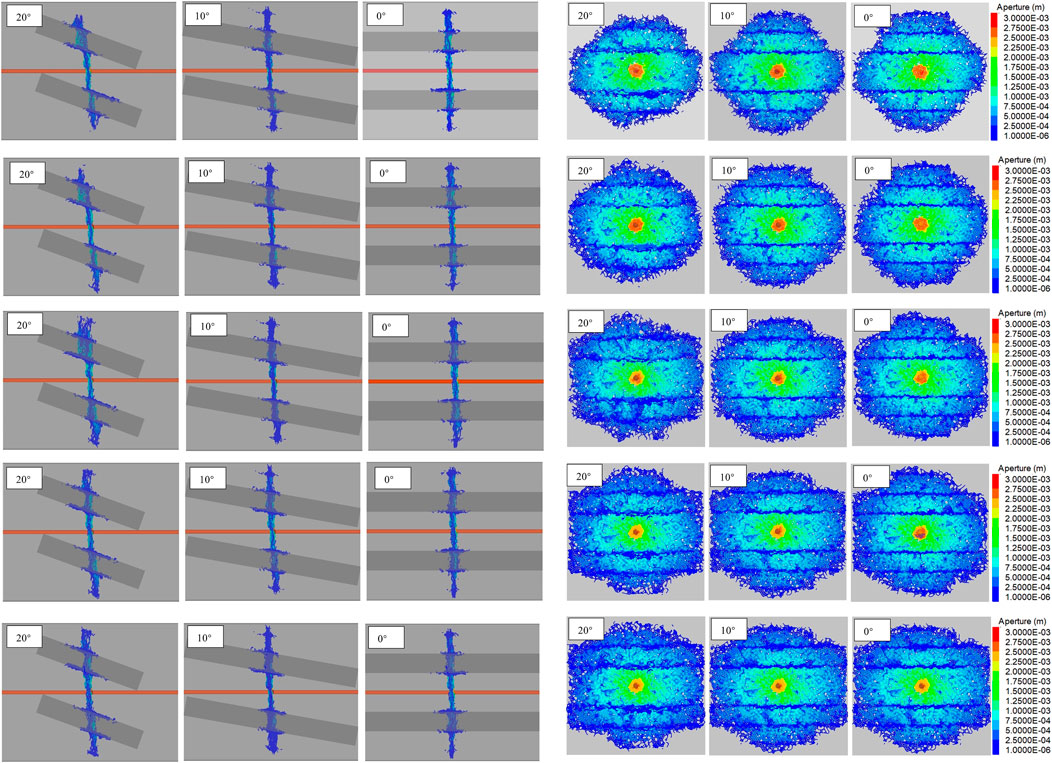
FIGURE 3. Effects of caprock’s inclination and Young’s modulus on fracture propagation in a laminated reservoir. The images show the model (A) front view and (B) side view with Young’s modulus of 20 MPa, 27.7 MPa, 40 MPa, 50 MPa, and 60 MPa.
Figure 4 presents the TSA and SSA corresponding to the results of Figure 3. The total SA is the sum of the TSA and SSA. The results of this figure show that TSA and SSA values are increasing in lockstep as the caprock Young’s modulus increases. However, the change in inclination for TSA and SSA shows the opposite trend. Larger inclinations correspond to higher SSAs but lower TSAs. This is due to the fact that when the HF intersects the natural interface orthogonally (i.e., the layers’ inclination is 0°), as opposed to the lower angle of approaches, the crossing interaction mode is more favorable to occur. This finding agrees with previous research works (Gu and Weng, 2010).
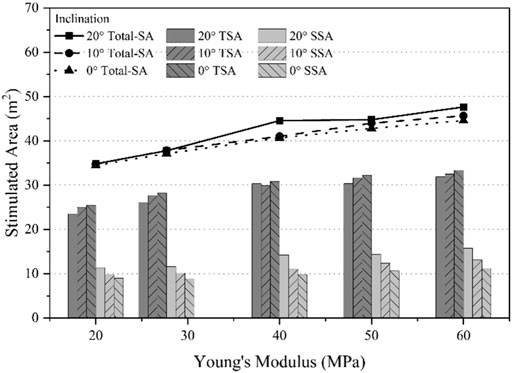
FIGURE 4. Effect of caprock Young’s modulus and inclination on tension and shear stimulated areas (TSA and SSA).
When the caprock’s stiffness is increased, an increase in the TSA and SSA is observed. To elucidate this conclusion further, a detailed analysis of the HF aperture was performed, and the corresponding results are shown in Figures 5A,B. The aperture profiles in the Y-Z plane for cases involving caprocks with a Young’s modulus of 20 and 60 MPa are shown in this figure. Figure 5A shows a smooth decline of the aperture along the Y axis, whereas an obvious drop occurs at the interface between the reservoir and caprock layer. This is because Young’s modulus is a mechanical property that quantifies the relationship between tensile stress and axial strain; thus, when a fracturing fluid with uniform fluid pressure transits from a high– to low–Young’s modulus layer, the high-modulus rock will exhibit a relatively small strain. Additionally, to illustrate an increase in the SSA, or the natural interface slippage area, profiles of natural fractures aperture are shown in Figures 5C, D for Young’s modulus values of 20 and 60 MPa in the Y-Z plane. When natural interfaces in the same position are compared, the lower stiffness case exhibits a larger aperture value. Additionally, for a single case, one can observe that the interfaces between the reservoir and caprock layer exhibit a greater aperture than those farther from the injection point, particularly in the area contacted by HF interfaces.
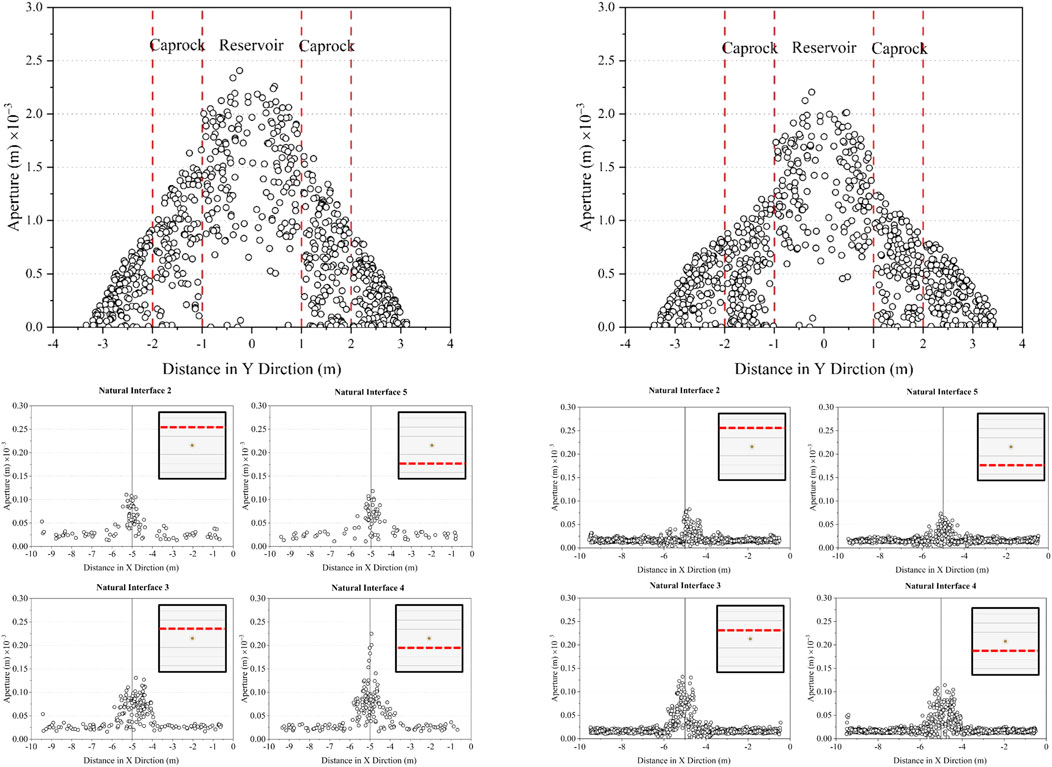
FIGURE 5. Profiles of the HF aperture in the YZ plane at X = −5 m for caprock Young’s modulus of (A) 20 MPa and (B) 60 MPa. The wellbore injection point is at Y = 0 m. Profiles of the natural interface aperture in the XZ plane at Z = 4 m for caprock Young’s modulus of (C) 20 MPa and (D) 60 MPa. The HF cross section appears at X = −5 m. The diagram in the upper right shows the position of the corresponding natural fracture in the model.
To investigate the effect of vertical stress anisotropy (or differential stresses), the vertical stress (σv) was changed from 8 MPa to 10 MPa, 12 MPa, and 14 MPa, while the minimum horizontal stress remained constant at σh = 5 MPa. The front (X-Y plane) and side view (Y-Z plane) of the simulation results are shown in Figure 6.
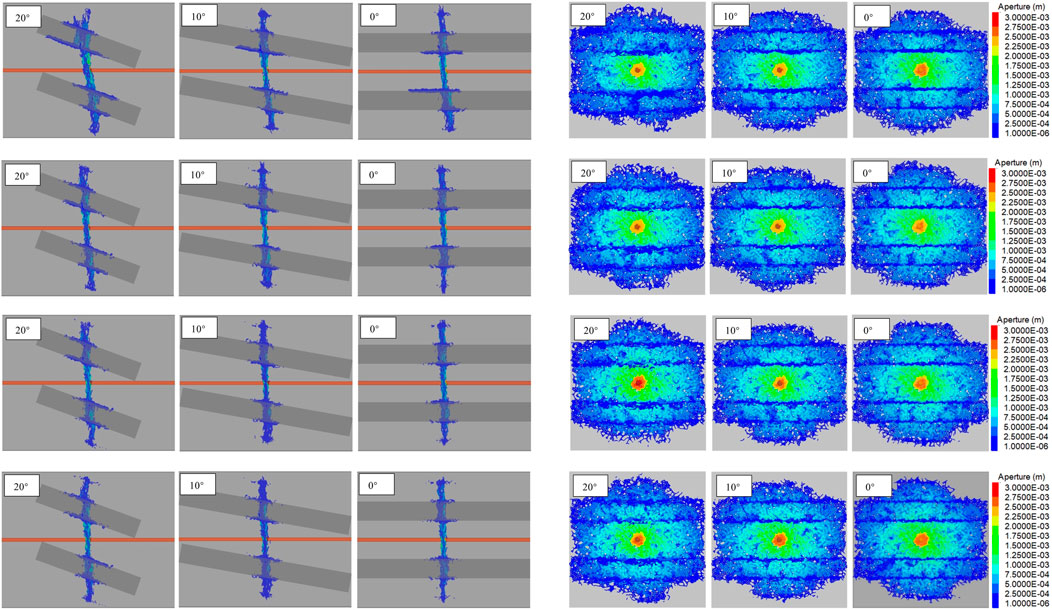
FIGURE 6. Effects of caprock’s inclination and stress anisotropy on fracture propagation for vertical stresses of 8 MPa, 10 MPa, 12 MPa, and 14 MPa. (A) The model front view and (B) the model side view.
Figure 7 presents the TSA and SSA corresponding to Figure 6. From these figures, it is seen that as σv increases, the total-SA decreases. Specifically, the SSA has the largest proportion of the contribution to the total SA decline compared to the TSA, implying that high-stress anisotropy results in less stimulation of the interface during HF operation. This finding is also reported by previous research, which claimed a higher differential stress causing a shorter offset in the interfaces (Chuprakov et al., 2010).
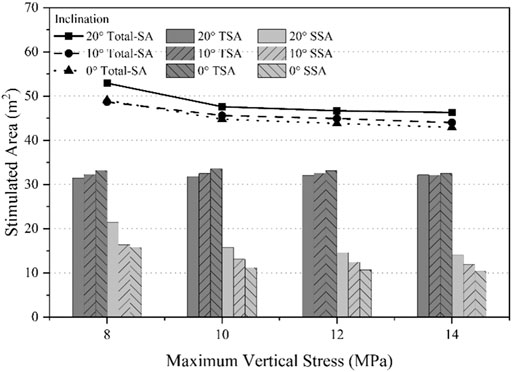
FIGURE 7. Effect of caprock vertical differential stress and inclination on tension and shear stimulated areas.
In this section, the impact of the tensile strength (T) of both caprocks and interfaces on HF propagation is studied by changes in the T values from 0.5 MPa to 3.5 MPA and 5.0 MPa. The front and side views of the models are depicted in Figures 8A,B.
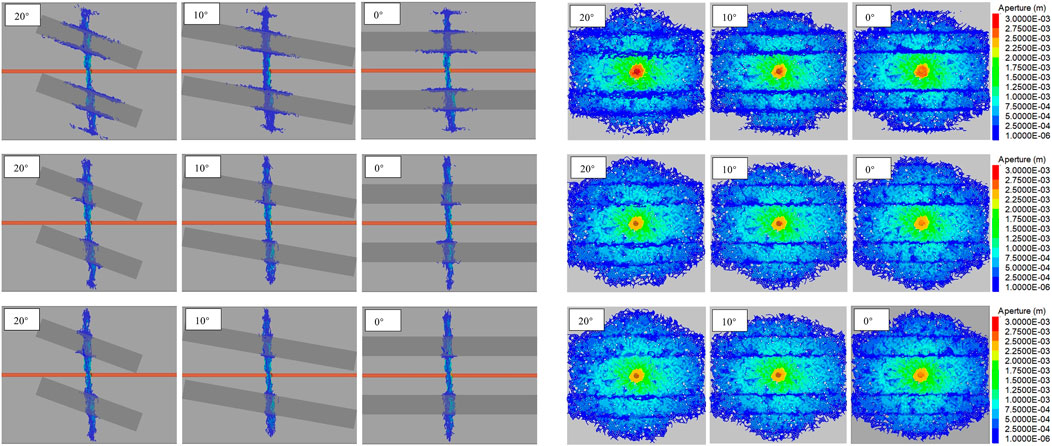
FIGURE 8. Effects of caprock’s inclination and tensile strength on fracture propagation for tensile strengths of 0.5, 3.5, and 5.0 MPa. (A) The model front view and (B) the model side view.
Figure 9 presents the TSA and SSA corresponding to Figure 8. A noticeable reduction in the total SA is observed when the tensile strength increases from 0.5 MPa to 5.0 MPa. This is contributed largely by reduction of the SSA from approximately 25 to 5 m2, while a little change is observed in the TSA. The induced stress of the fractures in the reservoir and the weak cementation of the natural fractures make the natural fracture faces susceptible to shear slip, thus creating the so-called hydraulic aperture to facilitate fluid leakage into the natural interfaces. Therefore, the magnitude of natural interface tensile strength is lower than that of the main formation; tensile normal stress on the natural fracture may cause its opening and activation in preference to local growth along its original path (Daneshy, 2019).
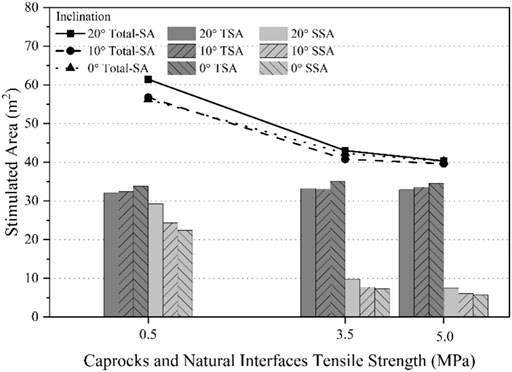
FIGURE 9. Effect of tensile strength and inclination on tension and shear stimulated areas (TSA and SSA).
The injection rate (Q) is one of the controllable operational parameters during the HF operation; therefore, it is important to understand its impact on fracture propagation. Five different models with variable injection rates of 0.02 m3/s, 0.04 m3/s, 0.06 m3/s, 0.08 m3/s, and 0.1 m3/s were considered while keeping other parameters the same for simulation purposes. Figures 10A,B show the results of the aperture as a function of the injection rate. It is seen that as the injection rate increases, the HF aperture in the reservoir increases, but the TSA decreases.
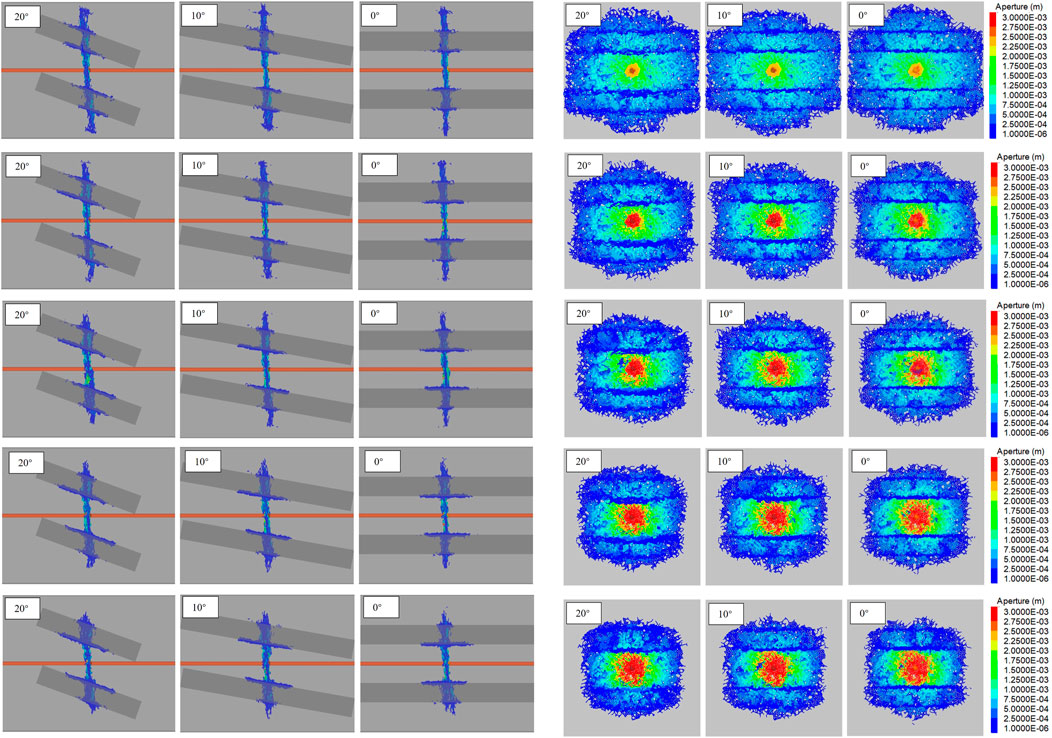
FIGURE 10. Effects of caprock’s inclination and the fluid injection rate for injection rates of 0.02 m3/s, 0.04 m3/s, 0.06 m3/s, 0.08 m3/s, and 0.1 m3/s. (A) The model front view, (B) the model side view.
The results in Figure 11 indicate that the total SA decreases as the fluid injection rate increases, and it is seen that this reduction is more contributed by the TSA and a little impact by the SSA. However, the general consensus regarding the effect of the injection rate is that an increase in the injection rate contributes to the tensile failure and results in more tensile fracture, whereas a low injection rate favors the formation of natural interface shear failure and act as a lubricant to reduce friction and accommodate shearing (Beugelsdijk et al., 2000; Zou et al., 2016; Yu et al., 2019). This can be explained by Figures 12A,B, which illustrate that a high–injection rate case forms a high-pressure zone, with a breakdown pressure of 87.6 MPa, compared to 27.5 MPa, in a short time around the injection point and has a larger aperture in the reservoir layer, resulting in less fluid energy available to pressurize and extend the fracture in the vertical direction. Also, from the results of Figures 12C,D, one can observe that a high injection rate results in a greater interfacial extension and wider fractures than the case of lower injection rates. This is because the high–flow rate HF has higher hydraulic pressure at the intersection point (x = −5 m in Figures 12C,D) when it contacts with natural interfaces than the low-rate case; hence, the HF prefers to propagate along the interface.
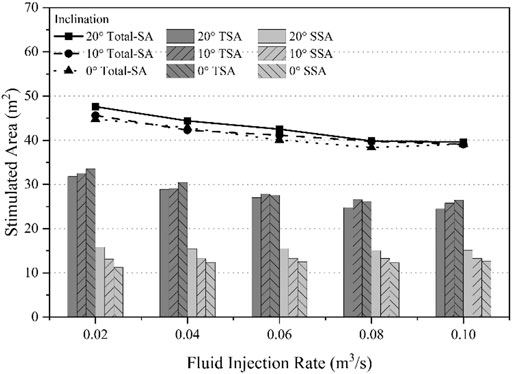
FIGURE 11. Effect of the fluid injection rate and inclination on tension and shear stimulated areas (TSA and SSA).
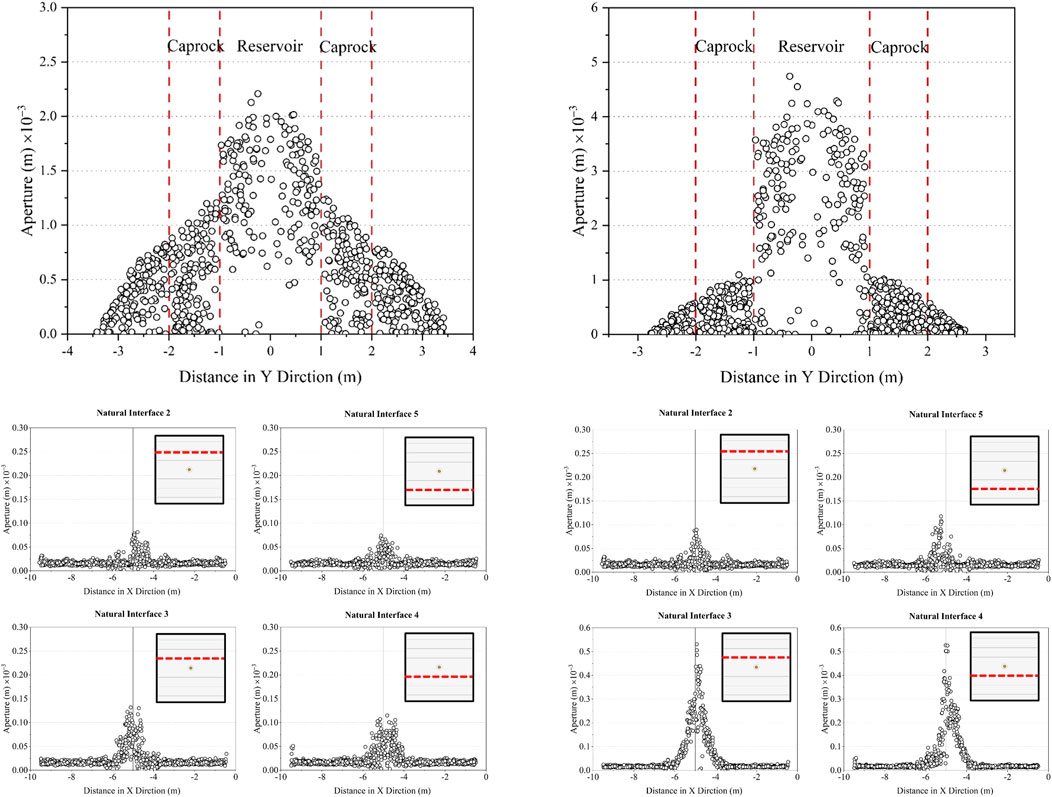
FIGURE 12. Profiles of the HF aperture in the YZ plane at X = −5 m for injection rates of (A) 0.02 m3/s and (B) 0.1 m3/s. The wellbore injection point is at Y = 0 m. And profiles of the natural interface aperture in the XZ plane at Z = 4 m for injection rates of (C) 0.02 m3/s and (D) 0.1 m3/s. HF in this plane is at X = −5 m. The diagram in the upper right shows the position of the corresponding natural fracture in the model.
To assess that the previous results hold true universally, the considered parameters are transformed into a dimensionless space. The elastic modulus was defined as the ratio of the modulus in the caprock layer to the modulus of the reservoir, denoted as effective Young’s modulus (EE); the ratio of the tensile strength of the natural interface and caprock layer (which was assumed the same in this study) to the tensile strength of the reservoir formation was denoted as effective tensile strength (TE); the effective stress anisotropy (SE) was defined as the ratio of the vertical to the minimum horizontal principal stresses; and the effective injection rate (QE) was defined as the ratio of the injection rate to the minimum value used in each case. All of these dimensionless parameters were calculated to see if they present a meaningful trend for the quantitative analysis of HF propagation and its geometry.
The stimulated area ratio (SAR), defined as the ratio of the TSA to the SSA, was also used here. These larger SARs indicate more penetrability of the fracture versus connectivity or larger height (vertical extension) as opposed to horizontal extension. The relationship between effective Young’s modulus and the SAR is presented in Figure 13A, which shows minor changes to the SAR as the stiffness of the caprock increases. This may be explained that fluid pressure restricted by the stiff caprock boosted both the TSA and SSA. Figure 13B shows the change in the SAR as a function of the effective stress anisotropy. It is seen that the SAR increases as stress anisotropy increases, a result which is consistent with the previous findings of this study which showed that high maximum horizontal stress reduces the SSA along the natural interfaces. The relationship between the SAR and the effective tensile strength is presented in Figure 13C. The results of this figure show a significant increase in the SAR when tensile strength increases. This is due to the fact that high tensile strength prevents further opening of the fractures formed by the interfacial slip. Figure 13D illustrates the effect of the injection rate on the SAR, indicating that there is a general tendency for the SAR to decrease as the injection rate increases, with slight variations due to changes in inclinations. In a nutshell, the previous results suggest that the larger Young’s modulus and injection rate favor horizontal propagation of HF (Figure 14B), whereas larger stress anisotropy and tensile strength favor vertical propagation of HF (Figure 14A).
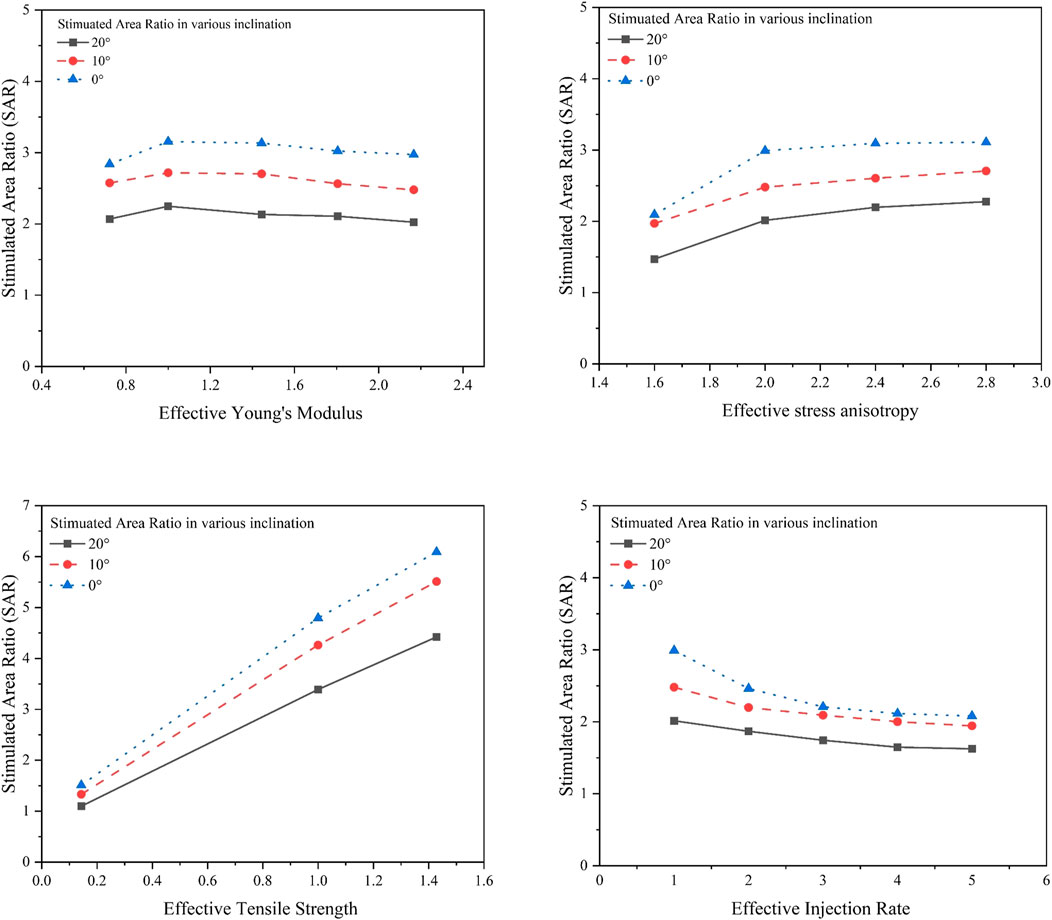
FIGURE 13. Effect of (A) Young’s modulus, (B) stress anisotropy, (C) tensile strength, and (D) injection rate on stimulated area ratio (SAR).
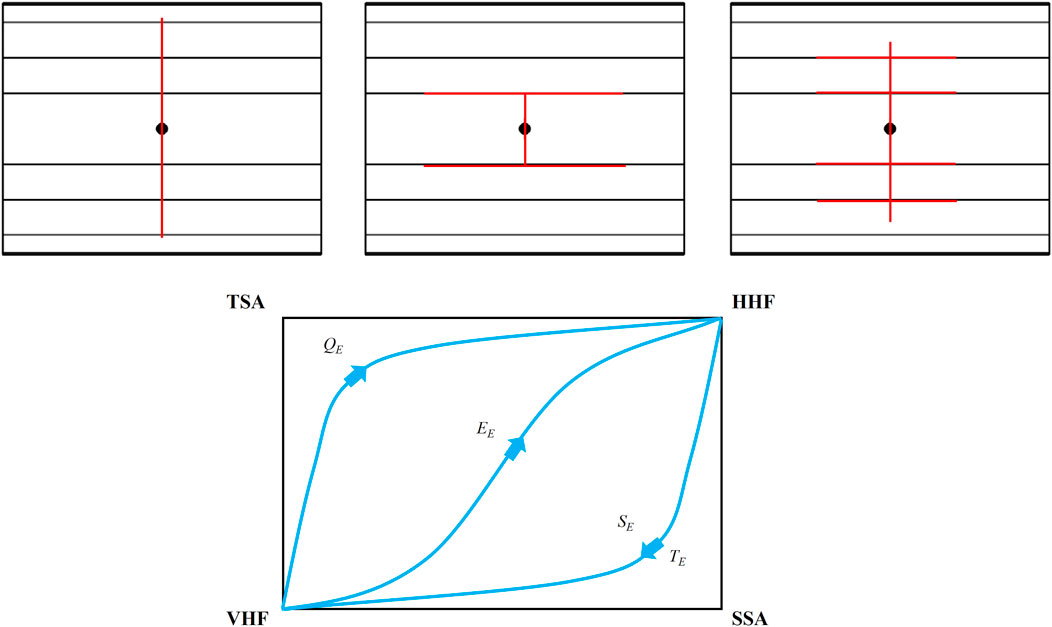
FIGURE 14. Illustration of the three HF geometries: (A) a vertical HF, (B) a horizontal HF, and (C) HF network. (D) Schematic evolution of HF propagation modes in dimensionless space.
The evolution of HF from vertical to horizontal propagation modes can be visualized schematically in Figure 14D, where the bottom left and top right vertexes represent the vertical hydraulic fracture (VHF) and horizontal hydraulic fracture (HHF) propagation, respectively. In this figure, the bottom right and top left vertices represent the tension and shear stimulated areas, respectively. The transition between VHF and HHF propagation regimes is determined by the SAR. This means that the tensile strength and stress anisotropy enable HF to evolve from HHF to VHF via the path close to the SSA, whereas the injection rate evolves from the VHF to HHF via the path along the TSA. Furthermore, Young’s modulus has an effect on the propagation mode through the TSA and SSA, causing it to follow a nearly diagonal path along the rectangle. Further investigation is needed to better understand the relationships between the SAR, the total stimulated area, and the HF network (HFN).
Based on the lattice-based numerical simulation of HF propagation in a laminated model presented in this work, the following conclusions were drawn:
1) Higher caprock Young’s modulus promotes HF vertical and horizontal extensions. Higher vertical stress anisotropy inhibits HF horizontal extension. The higher tensile strength of the interface and caprock prevents HF horizontal propagation. A higher injection rate promotes HF width growth in the reservoir.
2) The tension stimulated area (TSA) and shear stimulated area (SSA) were used to determine the vertical and horizontal extendibility of HF. The TSA shows HF’s ability to penetrate the interface and propagate vertically, whereas the SSA represents the ability of HF to form interface slippage or horizontal propagation of the fracture. These two parameters can quantitatively describe the behavior of HF propagation when it interacts with natural interfaces.
3) The ratio of the TSA to SSA, known as the stimulated area ratio (SAR), was used as a parameter to show how HF propagation transition occurs between vertical and horizontal directions. The greater the SAR, the greater will be the HF penetrability. A dimensionless space was used to demonstrate how mechanical and operational factors affect the propagation of HFs along different pathways in a laminated formation.
The original contributions presented in the study are included in the article/Supplementary Material; further inquiries can be directed to the corresponding authors.
DQ contributed to writing–original draft–and Methodology. JZ assisted with project administration and writing–review and editing. YL contributed to writing–review and editing. JL contributed to writing–review and editing. MR contributed to writing–review and editing. VR helped with supervision and writing–review and editing. BD contributed to resources, software, and writing–review and editing. RH helped with writing–review and editing.
The research was supported by the National Natural Science Foundation of China (U1960101), the National Natural Science Foundation of China Youth Foud (52004065), the Research start project of Northeast Petroleum University (NO. 1305021857), and the Northeast Petroleum University Youth Talent Training Project (15041260501).
BD was employed by the company Itasca Consulting Group.
The remaining authors declare that the research was conducted in the absence of any commercial or financial relationships that could be construed as a potential conflict of interest.
All claims expressed in this article are solely those of the authors and do not necessarily represent those of their affiliated organizations, or those of the publisher, the editors, and the reviewers. Any product that may be evaluated in this article, or claim that may be made by its manufacturer, is not guaranteed or endorsed by the publisher.
We thank the provision of the XSite license by the Itasca Group.
Afsar, F. (2014). Fracture Propagation and Reservoir Permeability in limestone-marl Alternations of the Jurassic Blue Lias Formation. eDiss. Bristol Channel Basin , UK ).
Aimene, Y., Hammerquist, C., and Ouenes, A. (2019). Anisotropic Damage Mechanics for Asymmetric Hydraulic Fracture Height Propagation in a Layered Unconventional Gas Reservoir. J. Nat. Gas Sci. Eng. 67 (April), 1–13. doi:10.1016/j.jngse.2019.04.013
Bakhshi, E., Rasouli, V., Ghorbani, A., Fatehi Marji, M., Damjanac, B., and Wan, X. (2019). Lattice Numerical Simulations of Lab-Scale Hydraulic Fracture and Natural Interface Interaction. Rock Mech. Rock Eng. 52 (5), 1315–1337. doi:10.1007/s00603-018-1671-2
Beugelsdijk, L. J. L., De Pater, C. J., and Sato, K. (2000). “Experimental Hydraulic Fracture Propagation in a Multi-Fractured Medium,” in Proceedings of the SPE Asia Pacific Conference on Integrated Modelling for Asset Management, April 2000. Yokohama Japan. 177–184. doi:10.2523/59419-ms10.2118/59419-ms
Chen, Z., Jeffrey, R. G., Zhang, X., Kear, J., Operations, S. C. T., Zhang, X., and Kear, J. (2015). “Finite Element Simulation of a Hydraulic Fracture Interacting with a Natural Fracture,” in Proceedings of the Society of Petroleum Engineers - SPE Asia Pacific Unconventional Resources Conference and Exhibition. Noveber 2015. Brisbane Australia. doi:10.2118/176970-ms
Chuprakov, D. A., Akulich, A. V., Siebrits, E., and Thiercelin, M. (2010). Hydraulic Fracture Propagation in a Naturally Fractured Reservoir. J. Nat. gas Sci. Eng. 68. doi:10.2118/128715-ms
Damjanac, B., and Cundall, P. (2016). Application of Distinct Element Methods to Simulation of Hydraulic Fracturing in Naturally Fractured Reservoirs. Comput. Geotechnics 71, 283–294. doi:10.1016/j.compgeo.2015.06.007
Damjanac, B., Detournay, C., and Cundall, P. A. (2016). Application of Particle and Lattice Codes to Simulation of Hydraulic Fracturing. Comp. Part. Mech. 3 (2), 249–261. doi:10.1007/s40571-015-0085-0
Damjanac, B., Detournay, C., Cundall, P. A., and Varun, (2013). Three-dimensional Numerical Model of Hydraulic Fracturing in Fractured Rock Masses. ISRM Int. Conf. Eff. Sust. Hydraulic Fracturing, 819–830. doi:10.5772/56313
Daneshy, A. A. (1978). Hydraulic Fracture Propagation in Layered Formations. Soc. Pet. Eng. J. 18 (01), 33–41. doi:10.2118/6088-pa
Daneshy, A. (2019). “Three-dimensional Analysis of Interactions between Hydraulic and Natural Fractures,” in Proceedings of the Society of Petroleum Engineers - SPE Hydraulic Fracturing Technology Conference and Exhibition. February 2019. Texas USA. doi:10.2118/194335-ms
Dou, F., Wang, J. G., Wang, H., Hu, B., and Li, C. (2019). Discrete Element Analysis for Hydraulic Fracture Propagations in Laminated Reservoirs with Complex Initial Joint Properties. Geofluids 2019, 1–23. doi:10.1155/2019/3958583
Goldstein, R. V., and Osipenko, N. M. (2015). Initiation of a Secondary Crack across a Frictional Interface. Eng. Fracture Mech. 140, 92–105. doi:10.1016/j.engfracmech.2015.03.036
Gu, H., and Siebrits, E. (2008). Effect of Formation Modulus Contrast on Hydraulic Fracture Height Containment. SPE Prod. Operations 23 (2), 170–176. doi:10.2118/103822-pa
Gu, H., and Weng, X. (2010). “Criterion for Fractures Crossing Frictional Interfaces at Non-orthogonal Angles,” in Proceedings of the 44th US Rock Mechanics Symposium and 5th U.S. -Canada Rock Mechanics Symposium, June 30 2010. Utah USA. 1–6.
Guo, J., Luo, B., Lu, C., Lai, J., and Ren, J. (2017). Numerical Investigation of Hydraulic Fracture Propagation in a Layered Reservoir Using the Cohesive Zone Method. Eng. Fracture Mech. 186, 195–207. doi:10.1016/j.engfracmech.2017.10.013
Haddad, M., Du, J., and Vidal-Gilbert, S. (2017). Integration of Dynamic Microseismic Data with a True 3D Modeling of Hydraulic-Fracture Propagation in the Vaca Muerta Shale. SPE J. 22 (6), 1714–1738. doi:10.2118/179164-pa
Khoei, A. R., Vahab, M., and Hirmand, M. (2018). An Enriched-FEM Technique for Numerical Simulation of Interacting Discontinuities in Naturally Fractured Porous media. Comp. Methods Appl. Mech. Eng. 331, 197–231. doi:10.1016/j.cma.2017.11.016
Li, H., Zou, Y., Liu, S., and Valko, P. P. (2017). “Numerical Investigation of Multi-Well, Multi-Stage Hydraulic Fracture Height Growth in Laminated Shale Reservoirs Using Finite-Discrete Element Method,” in Proceedings of the 51st US Rock Mechanics/Geomechanics Symposium, San Francisco, California, June 2017, 3.
Liu, X., Qu, Z., Guo, T., Sun, Y., Wang, Z., and Bakhshi, E. (2019). Numerical Simulation of Non-planar Fracture Propagation in Multi-Cluster Fracturing with Natural Fractures Based on Lattice Methods. Eng. Fracture Mech. 220 (March), 106625. doi:10.1016/j.engfracmech.2019.106625
Liu, X., Rasouli, V., Guo, T., Qu, Z., Sun, Y., and Damjanac, B. (2020). Numerical Simulation of Stress Shadow in Multiple Cluster Hydraulic Fracturing in Horizontal wells Based on Lattice Modelling. Eng. Fracture Mech. 238 (June), 107278. doi:10.1016/j.engfracmech.2020.107278
Sarmadivaleh, M. (2012). Experimental and Numerical Study of Interaction of a Pre-existing Natural Interface and an Induced Hydraulic Fracture. Curtin University. Australia. doi:10.13140/RG.2.1.1286.2882
Sarmadivaleh, M., and Rasouli, V. (2015). Test Design and Sample Preparation Procedure for Experimental Investigation of Hydraulic Fracturing Interaction Modes. Rock Mech. Rock Eng. 48 (1), 93–105. doi:10.1007/s00603-013-0543-z
Settgast, R. R., Fu, P., Walsh, S. D. C., White, J. A., Annavarapu, C., and Ryerson, F. J. (2017). A Fully Coupled Method for Massively Parallel Simulation of Hydraulically Driven Fractures in 3-dimensions. Int. J. Numer. Anal. Meth. Geomech. 41 (5), 627–653. doi:10.1002/nag.2557
Simonson, E. R., Abou-Sayed, A. S., and Clifton, R. J. (1978). Containment of Massive Hydraulic Fractures. Soc. Pet. Eng. J. 18 (1), 27–32. doi:10.2118/6089-pa
Smith, M. B., Bale, A. B., Britt, L. K., Klein, H. H., Siebrits, E., and Dang, X. (2001). Layered Modulus Effects on Fracture Propagation, Proppant Placement, and Fracture Modeling. SPE Annu. Tech. Conf. Exhibition, 2919–2932. doi:10.2118/71654-ms
Teufel, L. W., and Clark, J. A. (1984). Hydraulic Fracture Propagation in Layered Rock: Experimental Studies of Fracture Containment. Soc. Pet. Eng. J. 24 (1), 19–32. doi:10.2118/9878-PA
Vahab, M., Khoei, A. R., and Khalili, N. (2019). An X-FEM Technique in Modeling Hydro-Fracture Interaction with Naturally-Cemented Faults. Eng. Fracture Mech. 212 (December 2018), 269–290. doi:10.1016/j.engfracmech.2019.03.020
Wang, T., Hu, W., Elsworth, D., Zhou, W., Zhou, W., Zhao, X., et al. (2017). The Effect of Natural Fractures on Hydraulic Fracturing Propagation in Coal Seams. J. Pet. Sci. Eng. 150 (June), 180–190. doi:10.1016/j.petrol.2016.12.009
Warpinski, N. R., Schmidt, R. A., and Northrop, D. A. (1982). In-Situ Stresses: the Predominant Influence on Hydraulic Fracture Containment. J. Pet. Tech. 34 (3), 653–664. doi:10.2118/8932-PA
Weng, X., Chuprakov, D., Kresse, O., Prioul, R., and Wang, H. (2018). Hydraulic Fracture-Height Containment by Permeable Weak Bedding Interfaces. Geophysics 83 (3), MR137–MR152. doi:10.1190/geo2017-0048.1
Wu, K., and Olson, J. E. (2015). A Simplified Three-Dimensional Displacement Discontinuity Method for Multiple Fracture Simulations. Int. J. Fract 193 (2), 191–204. doi:10.1007/s10704-015-0023-4
Xie, J., Tang, J., Yong, R., Fan, Y., Zuo, L., Chen, X., et al. (2020). A 3-D Hydraulic Fracture Propagation Model Applied for Shale Gas Reservoirs with Multiple Bedding Planes. Eng. Fracture Mech. 228 (January), 106872. doi:10.1016/j.engfracmech.2020.106872
Yu, H., Dahi Taleghani, A., and Lian, Z. (2019). On How Pumping Hesitations May Improve Complexity of Hydraulic Fractures, a Simulation Study. Fuel 249 (February), 294–308. doi:10.1016/j.fuel.2019.02.105
Zeng, Q., Liu, W., and Yao, J. (2018). Numerical Modeling of Multiple Fractures Propagation in Anisotropic Formation. J. Nat. Gas Sci. Eng. 53 (March), 337–346. doi:10.1016/j.jngse.2018.02.035
Zhang, F., Zhu, H., Zhou, H., Guo, J., and Huang, B. (2017). Discrete-element-method/computational-fluid-dynamics Coupling Simulation of Proppant Embedment and Fracture Conductivity after Hydraulic Fracturing. SPE J. 22 (2), 632–644. doi:10.2118/185172-PA
Zhang, X., and Jeffrey, R. G. (2012). Fluid-driven Multiple Fracture Growth from a Permeable Bedding Plane Intersected by an Ascending Hydraulic Fracture. J. Geophys. Res. 117 (12), a–n. doi:10.1029/2012JB009609
Zhou, J., Zhang, L., Pan, Z., and Han, Z. (2016). Numerical Investigation of Fluid-Driven Near-Borehole Fracture Propagation in Laminated Reservoir Rock Using PFC 2D. J. Nat. Gas Sci. Eng. 36, 719–733. doi:10.1016/j.jngse.2016.11.010
Zhou, J., Zhang, L., Pan, Z., and Han, Z. (2017). Numerical Studies of Interactions between Hydraulic and Natural Fractures by Smooth Joint Model. J. Nat. Gas Sci. Eng. 46, 592–602. doi:10.1016/j.jngse.2017.07.030
Keywords: hydraulic fracture, laminated formations, stimulated reservoir area, stress anisotropy, fracture propagation, fracture geometry, XSite, lattice numerical simulation
Citation: Qiu D, Zhang J, Lin Y, Liu J, Rabiei M, Rasouli V, Damjanac B and Huang R (2021) Lattice Numerical Simulations of Hydraulic Fracture Propagation and Their Geometry Evolution in Transversely Isotropic Formations. Front. Earth Sci. 9:787736. doi: 10.3389/feart.2021.787736
Received: 01 October 2021; Accepted: 26 October 2021;
Published: 24 November 2021.
Edited by:
Kouqi Liu, Central Michigan University, United StatesReviewed by:
Xiaoqiang Liu, China University of Petroleum (Huadong), ChinaCopyright © 2021 Qiu, Zhang, Lin, Liu, Rabiei, Rasouli, Damjanac and Huang. This is an open-access article distributed under the terms of the Creative Commons Attribution License (CC BY). The use, distribution or reproduction in other forums is permitted, provided the original author(s) and the copyright owner(s) are credited and that the original publication in this journal is cited, in accordance with accepted academic practice. No use, distribution or reproduction is permitted which does not comply with these terms.
*Correspondence: Dezhi Qiu, ZGV6aGkucWl1QG5kdXMuZWR1; Jun Zhang, emhhbmdqdW40MTA0MTBAbmVwdS5lZHUuY24=
Disclaimer: All claims expressed in this article are solely those of the authors and do not necessarily represent those of their affiliated organizations, or those of the publisher, the editors and the reviewers. Any product that may be evaluated in this article or claim that may be made by its manufacturer is not guaranteed or endorsed by the publisher.
Research integrity at Frontiers
Learn more about the work of our research integrity team to safeguard the quality of each article we publish.