 Wenzhen Yuan1Dailei Zhang1
 Yi Zhang1Jun Gao1Tongzhe Liu2,3
 Haizhen Zhai4*
 Guangrong Jin4*Guiling Wang1,5*
 Baojian Zhang1
- 1Chinese Academy of Geological Sciences, Beijing, China
- 2801 Institute of Hydrogeology and Engineering Geology, Shandong Provincial Bureau of Geology and Mineral Resources, Jinan, China
- 3Shandong Engineering Research Center for Environmental Protection and Remediation on Groundwater, Jinan, China
- 4CAS Key Laboratory of Gas Hydrate, Guangzhou Institute of Energy Conversion, Chinese Academy of Sciences, Guangzhou, China
- 5Institute of Hydrogeology and Environmental Geology, Chinese Academy of Geological Sciences, Shijiazhuang, China
The sustainable development of a shallow aquifer geothermal reservoir is strongly affected by the reinjection–production strategy. However, the reinjection–production strategy optimization of a small-scale exploitation unit with tens of meters of well spacing is site specific and has not yet been fulfilled. This study numerically investigates sustainable heat extraction based on various reinjection–production strategies which were conducted in a single-phase aquitard–aquifer geothermal system in Huailai County, Hebei Province, China. The response of the water level and production temperature is mainly discussed. The numerical results show that production without reinjection induces the highest production temperature and also the water level drawdown. Although reinjection in a single doublet well system is conducive to the control of water level drawdown, the introduction of the thermal breakthrough problem causes a decrease in the production temperature. The thermal breakthrough and sustainability of geothermal reservoirs highly depend on the well spacing between the production and reinjection wells, especially for the small-scale field. Therefore, a large well spacing is suggested. A multi-well system facilitates the control of water level drawdown while bringing intensive well interference and thermal breakthrough. Large spacing between the production and reinjection wells is also the basic principle for the design of the multi-well system. A decrease in openhole length leads to an increase in the production temperature and output thermal power. An increase in the production rate affects the thermal breakthrough highly and shortens the lifetime of the geothermal system. Furthermore, the extracted thermal energy is highly affected by the reduction in the reinjection temperature. The results in this study can provide references to achieve sustainable geothermal exploitation in small-scale geothermal reservoirs.
1 Introduction
The emission of anthropogenic greenhouse gases (GHGs) from the combustion of fossil fuels causes global climate change (Yang et al., 2018; Mallapaty, 2020), which is bad for human survival. To reduce carbon emission and dependency on fossil fuels (Cui et al., 2021), low-carbon and renewable energies are attracting extensive attention worldwide (Hu et al., 2020). Geothermal energy, which utilizes energy buried in the earth’s interior, is a kind of clean and sustainable energy (Hu et al., 2020). Geothermal energy could be developed for power generation, space heating, and thermal spring, depending on the production temperature (Su et al., 2018). However, due to the intensive withdrawal of fluid or heat from the geothermal field, energy recovered naturally may not support the energy output (Rivera Diaz et al., 2016). Thus, decreases in pressure, temperature, and extracted heat are generally encountered, which runs counter to the sustainable development of a geothermal reservoir. Reinjection is generally compulsive in most of the geothermal field, and reinjection–production strategy should be carefully designed (Kamila et al., 2021).
Doublet well is widely employed to extract geothermal energy (Su et al., 2018; Markó et al., 2021) by injecting cold water in to one well while extracting hot water from another. The reinjection is expected to maintain reservoir pressure and avoid subsidence (Markó et al., 2021); however, the distance of the wells should be appropriately placed to avert thermal breakthrough (Kamila et al., 2021). Thermal breakthrough will cause the temperature to decline because the injected water may be underheated when flowing through the reservoir. Driven by the purpose of gaining the highest thermal output, a numerical simulation, based on the characterization of geological condition, fluid flow, and heat transfer, is the important tool to optimize well placement and the corresponding reinjection–production strategy (Zhang et al., 2021). The well spacing for homogenous and heterogenous reservoirs has been optimized (Willems and Nick, 2019; Liu et al., 2020). For a doublet well with lateral recharge, the reinjection well located downstream is better than it being located upstream (Kong, 2017). Anisotropic heterogeneity could lengthen or shorten the lifetime of the geothermal reservoir (Babaei and Nick, 2019), and the well spacing should be adjusted accordingly. The effect of faults (Zhang et al., 2019a), depth of production interval (Yuan et al., 2021), and permeability (Crooijmans et al., 2016; Le Lous et al., 2018) on heat production have also been discussed. Therefore, the reinjection–production strategy is affected by the characteristics of the geothermal system. Two doublet well systems (Babaei and Nick, 2019) and a well system with one production well and multiple injection wells (Zhang et al., 2019b) have also been investigated for maximum heat production.
Recently, the interest in multiple well systems in regional-scale fields has increased because of the increasing demand for low-carbon energy (Kong et al., 2020; Zhang et al., 2021). A masterplan was proposed by arranging double wells in a limited number of exploitation units (Willems and Nick, 2019; Zhang et al., 2021), which was different from previous random arrangements of doublet wells. Similar to the common practice approach in the hydrocarbon industry, the masterplan of geothermal wells focuses on optimizing heat recovery of the entire field (Willems and Nick, 2019). The distance between individual doublet wells and spacing of the injection–production wells are the main optimized options. The heat recovery efficiency was evaluated to increase by tens of percentages by the so-called “checkboard” well placements (Willems and Nick, 2019). The well configurations of the “checkboard,” “lane zonation,” and cluster layout (by separating the injection and production wells in to distinct injection and production zones) in a heterogenous geothermal reservoir were compared, and it was found that the heat recovery of the cluster layout was higher than the other two (Liu et al., 2020). The flow channels develop along the direction of high permeability. Geothermal production affects the regional-scale temperature and groundwater flow. Therefore, regarding the importance of natural hydrothermal flow status, Zhang et al. (2021) proposed a new method for well placement optimization. Based on the method, an intensive heat production mode using a lane pattern locally will lead to a more stable production temperature and high recoverability of the groundwater levels (Zhang et al., 2021). Therefore, the response of the natural hydrothermal process to the artificial operation affects the sustainable development of the geothermal field (Franco and Vaccaro, 2014). The reinjection–production strategy should be investigated according to the characteristics of individual reservoirs. The above studies have managed to increase heat recovery for doublet and multiple double wells in small- and regional-scale reservoirs through well spacing in an order higher than hundreds of meters, by changing the distance of the wells. However, the reinjection–production strategy optimization of a small-scale exploitation unit with tens of meters of spacing is not yet fulfilled. Changes in production–reinjection relationships between wells may induce different responses of temperature and water levels. The water transport and heat transfer under various production scenarios (well configurations) are highly related to the sustainable heat development of the geothermal reservoir. To gain a large and sustainable heat production, thermal breakthrough should be avoided as much as possible. The occurrence of thermal breakthrough may lead to the shutdown of the hydrothermal energy installation. Therefore, the reinjection–production strategy should be optimized.
This study numerically investigates the sustainability of heat production of a small-scale geothermal field based on the wells that have been drilled. The scenarios with production-only and basic doublet well systems are investigated first, and the heat production is enhanced by designing different union operations between the wells. The heat production and the response of temperature and water levels are mainly discussed. Thermal breakthrough is managed to a minimum to increase the sustainability of the geothermal site.
2 Materials
2.1 Hydrogeological Setting
The research area is located in the courtyard of Aolin Spring Town, Houhaoyao Village, Huailai County, Zhangjiakou City, Hebei Province, China (Figure 1). Huailai County is situated in the north of the Yanshan Mountains and the upper reaches of Yongding River and is at a distance of 120 km from Beijing. The county has an average elevation of 792 m, average annual precipitation of 413 mm, and average temperature of 10.5°C. Because of the cold weather in winters in Houhaoyao, geothermal energy is mainly exploited for heating in winter and bathing all year around.
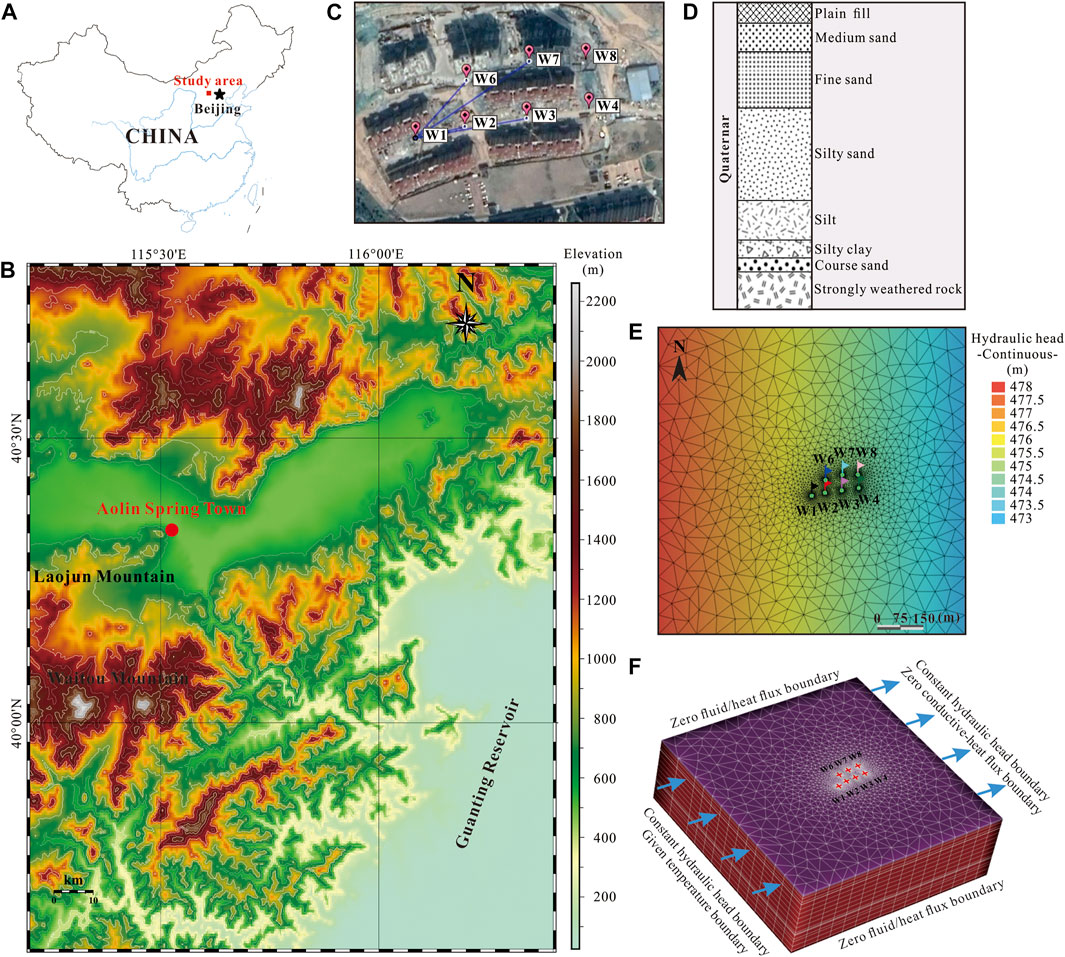
FIGURE 1. (A) Location map of the Huailai geothermal field in northern China, (B) topography map of the geothermal field, (C) geothermal well location in Aolin Spring Town, Huailai County, (D) typical lithofacies revealed in W2, (E) domain discretization and spatial distribution of hydraulic head in the Quaternary aquifer under natural conditions without artificial heat production, and (F) domain discretization and boundary conditions.
Houhaoyao geothermal field is located in the central and southern parts of the Zhuolu–Huailai Cenozoic fault basin, the core of Laojun mountain anticline, and near the intersection of the Dahenan-Chicheng deep fault and Yuxian-Yanqing fault. The basement of the Huailai County consists of pre-Sinian schist and Archean gneiss (Wang, 2010). The Quaternary sedimentary stratum is mainly exposed in Huailai County, and its thickness can reach 2 km. The regionally developed aquifers (Fanwen et al., 2021) include 1) the Tertiary fractured pore-confined aquifer in bedrock, 2) the Quaternary pore confined aquifer of loose sediment composed of coarse sand and gravel above the bedrock, and 3) the Quaternary pore shallow phreatic aquifer composed of medium–fine sand, silt, and clay. Based on the heat transfer mode, the geothermal system in the Huailai area is classified as convective (Fanwen et al., 2021). The water temperature ranges from 40°C to 80°C and is inferred to reach 120°C in bedrock (Fanwen et al., 2021).
2.2 Well Placement
A total of seven geothermal wells had been drilled in the northwest of the Houhaoyao geothermal field. The wells were drilled in two northern–southern rows from the west to the east (Figure 1), and the wells in the southern row were designated as wells W1, W2, W3, and W4, while the wells in the northern row were wells W6, W7, and W8. The drilled depth of the geothermal wells ranged from −160 to −189 m (the surface height was zero, and locations below the surface result in a negative depth). The utilization section (openhole) was −30 to −189 m (Table 1). All wells had a diameter of 0.46 m. Among these wells, four production wells and three reinjection wells were initially planned, while at present, the actual strategy involved one production well of W1 and two reinjection wells of W4 and W8. All geothermal wells belonged to shallow Quaternary heat reservoirs. The buried depth of the water level ranged from −16.6 to −21.56 m, and the outlet water temperature was 40.7–77.5°C (Table 1). This geothermal heating system was launched in 2017 and operated for 4 years with a heating area of 80,000 m3.
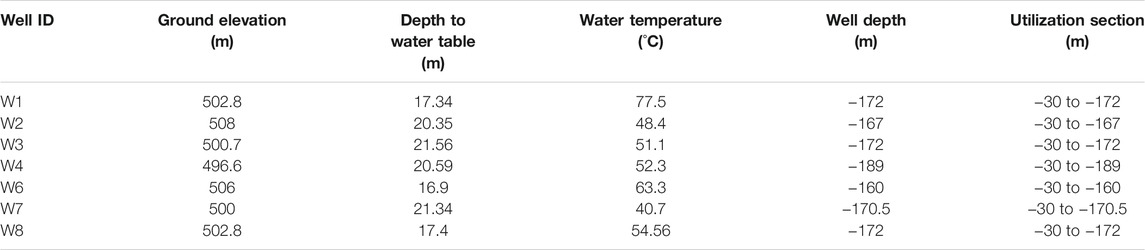
TABLE 1. Basic information of geothermal wells.
3 Model Setup
3.1 Conceptual Model
The modeled sedimentary stratum was assumed to be horizontal layers. This is because the lithology changes little within a well spacing of tens of meters for drilled wells. To characterize the variation of the water table in a large domain, the modeled domain horizontally extends 1,000 m from the west to the east and 1,000 m from the north to the south. The model's top corresponds to the surface, and the model extends downward 250 m from the surface. The wells were assumed to be located at the center of the modeled domain.
The entire aquifer is mainly composed of medium sand, fine sand, and silty sand, with strongly weathered rock at the bottom. The lithologies under −5.7 m are primarily fine, medium, silty, and coarse sand, which is considered as an unconsolidated aquifer. By contrast, the surface sediment consists of a plain fill. That is, the rocks above −5.7 m could be considered as an aquitard. Therefore, two layers were characterized in the vertical direction: the aquitard with depths from 0 to −5.7 m and the shallow confined aquifer that ranged from −5.7 to −250 m. In addition, since the well screen (openhole) of the drilled wells was placed only in shallow confined aquifers beneath −30 m, the simulations mainly involved the hydraulic distribution of the confined aquifer.
3.2 Domain Discretization and Simulation Tool
The geometrical model consists of a square parallelepiped domain, with dimensions 1,000 m × 1,000 m × 250 m. The model was discretized vertically into 19 slices, with vertical grid sizes ranging from 1.5 to 20 m. The modeled plane domain was first discretized by two-dimensional triangulation, and discretizations around all wells were refined to characterizing the hydrothermal process around the wells. Therefore, discretization in-plane domain generated 2,913 nodes. Finally, with 19 slices and 2,913 nodes of each layer, the modeled domain was discretized into a total of 55,347 nodes and corresponding 103,734 grids.
The model of shallow geothermal exploitation and reinjection was performed using the FEFLOW code. FEFLOW is a popular three-dimensional finite-element groundwater flow, mass, and heat transport modeling software (Diersch, 2014), which has been widely used to simulate the hydrothermal behavior of the geothermal system. The detailed governing equations of water and heat transports can be found in the software manual (Diersch, 2014; Le Lous et al., 2018; Huo et al., 2019; Zhang et al., 2021). The relative error of tolerance of solutions was 0.001. The time step was auto-adjusted according to convergence.
3.3 Hydrothermal Parameters
The porosity of aquifer and aquitard were uniform 0.3. The hydraulic conductivity inferred from the pumping test was given in Table 2. The ratio of the vertical to the horizontal hydraulic conductivity was assumed to be 0.1. The storage coefficient was given according to the model validation against the pumping test. Other parameters such as thermal conductivity, heat capacity, and the production/reinjection rates are also listed in Table 2.
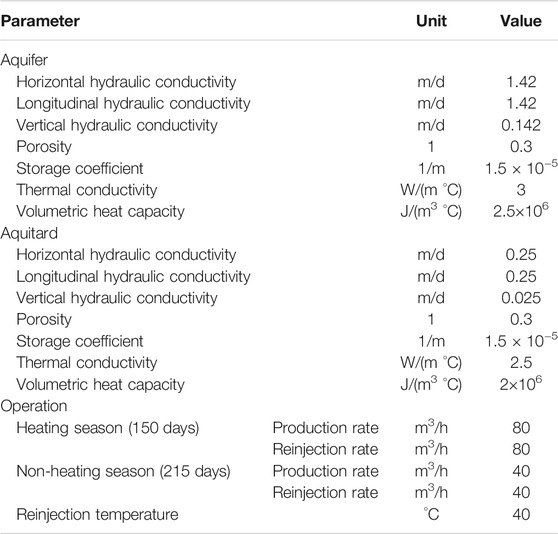
TABLE 2. Hydrogeological and operation parameters used in the model.
3.4 Initial and Boundary Conditions
Referring to the distribution of regional underground water flow field with an overall direction from the west to the east, fixed hydraulic heads of 478 and 473 m were set, respectively, to the western and eastern boundaries. The initial hydraulic head linearly decreases in the western to the eastern direction by a steady-state simulation of the natural boundary conditions based on the fixed hydraulic heads.
The initial temperature distribution was inferred using an average geothermal gradient of 0.308°C/m. The average geothermal gradient was calculated based on the measured temperature from 40 m to 120 m of well W8. The constant temperature boundary conditions of 10.5°C, equivalent to the annual mean air temperature in Huailai County, and 118.6°C were applied, respectively, to the uppermost and lowermost slices.
Geothermal water is produced, utilized, and subsequently reinjected at a specified temperature. The full reinjection of the produced water was compulsive in the geothermal site. Therefore, a constant discharge rate of water was applied at the production wells, while at the reinjection wells, cold water with constant temperature was injected at a constant reinjection rate. The production and reinjection rates differed in the heating (150 days) and non-heating (215 days) seasons. For the reference scenario, the production rate in the heating season was 80 m3/h, while the reinjection rate was 80 m3/h and the water temperature was 40°C. The flow and heat processes within the wellbore were not considered in the model.
3.5 Simulation Cases
To optimize heat extraction in a small-scale exploitation field, the simulation cases designed in this study are listed in Table 3. The simulation scenarios include a single production well without reinjection, a single doublet well system, and the multi-well system. The production-only scenario was designed to investigate the basic response of the water level and heat production capability. The scenarios of the doublet well system were designed to investigate the effect of well distance in small-scale exploitation fields on production performance. The scenarios of the multi-well system were designed for the existing seven wells to investigate the water level drawdown and heat production. Case 5 used all seven wells to extract heat, and the production and reinjection wells were arranged in a crossway. Cases 6 and 7 were designed to alleviate the thermal breakthrough effect caused by the small distance between production and reinjection wells, by separating the production wells from the reinjection wells. Case 8 corresponded to the actual running scheme at present. Sensitivity analyses were further discussed based on the best-performed Case 7.
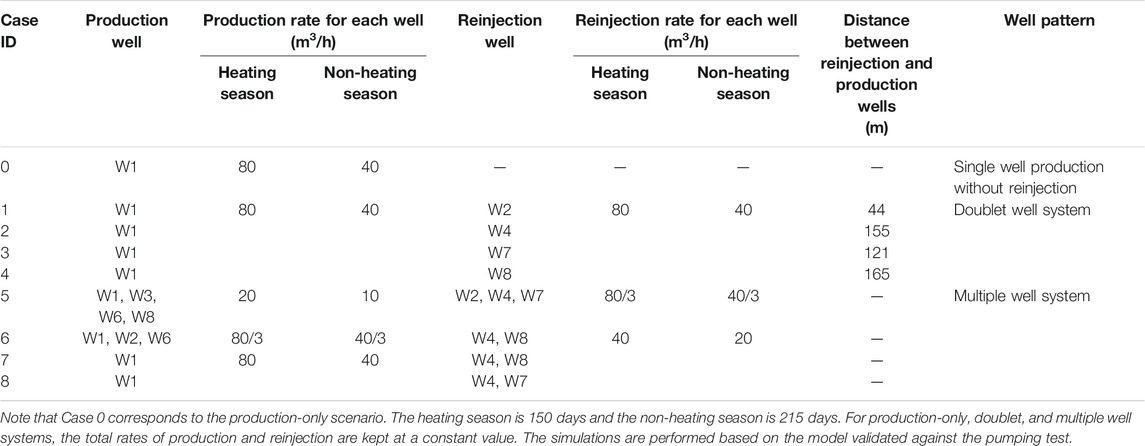
TABLE 3. Simulation cases.
To facilitate the analyses and discussions, three parameters, namely, water level drawdown, production temperature, and output thermal power, are defined to characterize the heat performance of different production and reinjection well systems.
The water level drawdown (
where Hini (m) is the initial water level and Hfin (m) is the final stable water level during the heating and non-heating seasons.
The production temperature (Tpro) of all the production wells is given by
where Qi (m3/s) denotes the volumetric flow rate for production well i; Ti (°C) is the water temperature for production well i; and Q (m3/s) is the volumetric flow rate of the working fluid.
The output thermal power (P) represents the heat extraction rate of the production and reinjection well system and is calculated by
where
3.6 Model Validation
To test and verify the rationality of the model, the simulated water head and production temperature were validated with the water level and production temperature observed in the pumping test conducted in well W1 (Table 4). Figure 2 shows the comparison between the simulated and measured water levels and production temperatures. By applying the pumping rates of 45.9, 81.3, and 107.1 m3/h at the three pumping stages, the variations in the water levels of the production and reinjection wells were reproduced by the model. The drawdown of the third pumping stage of W1 was selected as the primary fitted indicator. The measured and simulated drawdowns of W1 fit well, while deviations occurred for the observation well. The relative error between the simulated and measured values of W3 was less than 0.84. For the monitoring well, the differences between the measured and simulated water levels were probably caused by the blocking around the reinjection well during the past 4 years. In the late third pumping stage, the measured and simulated production temperature of W1 fit well, while deviations occurred for the early two pumping stages. The differences between the measured and simulated production temperatures were probably caused by the difference between the original temperature field setting and the real temperature field after continuous production of the past 4 years. Because of the complex underground conditions in the field, the validated model was believed to be acceptable and could be a basis to learn the long-term heat production of the geothermal reservoir.
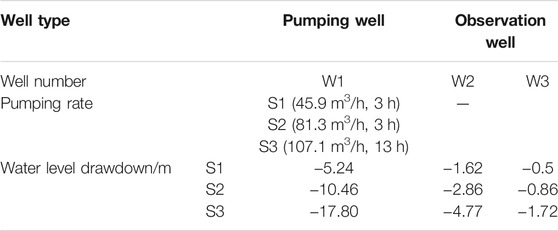
TABLE 4. Pumping test.
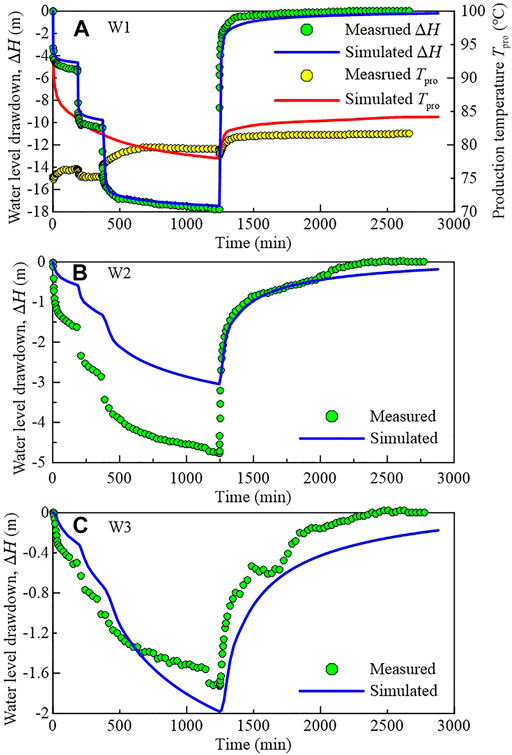
FIGURE 2. A comparison of the measured and simulated water levels and production temperatures of the pumping test for (A) W1, (B) W2, and (C) W3.
4 Results and Discussion
4.1 Single Production Without Reinjection
In this section, the heat production behavior of the scenario of W1 production-only without reinjection (Case 0) is investigated first. As shown in Figure 3A, in the heating season, the water level drawdown reached −9.85 m under a production rate of 80 m3/h, while in the non-heating season, the water level drawdown was restored to −4.93 m, owing to the halved production rate. The periodic variations of water level drawdown occurred during the next heating season. Under the control of the water level drawdown, reinjection was conducted to find the optimized strategy to reduce the water level drawdown.
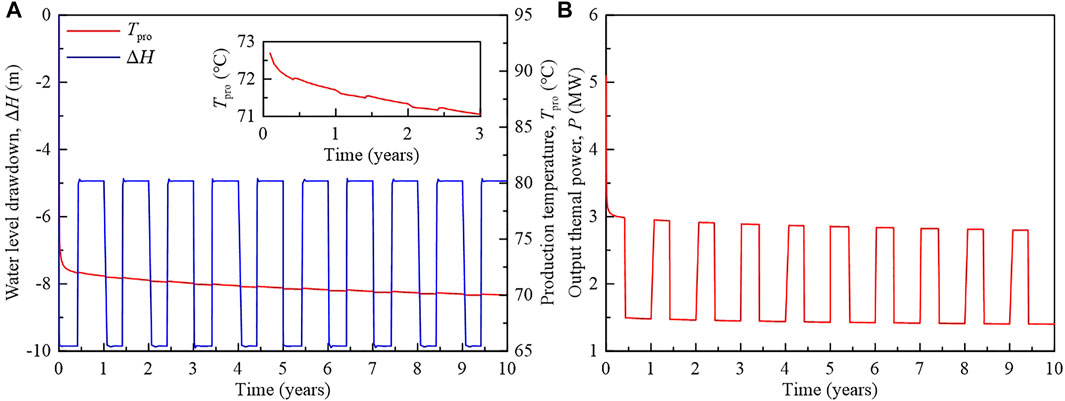
FIGURE 3. The production performance of W1 production-only without reinjection.
The production temperature rapidly decreased from 94.6°C to 73.1°C in the initial 20 days of the first heating season (Figure 3A). The initial rapid decrease in the production temperature is attributed to the mix of hot water from different depths around the production well. The production temperature then decreased gradually for the rest of the production period. The production temperature recovered slightly when entering the non-heating season and decreased slightly when entering the heating season. After 10 years of heat extraction, the production temperature decreased to 70°C.
The output thermal power of W1 decreased rapidly in the first 20 days of the first heating season (Figure 3B) from 5.1 to 3.1 MW and decreased gradually for the rest of the heating season. In the first non-heating season, the output thermal power dropped to 1.5 MW due to the halved production rate. After 10 years of heat extraction, the output thermal power dropped to 2.8 and 1.4 MW, respectively, for the heating and non-heating seasons.
4.2 Single Doublet Well System
By employing 100% reinjection, the heat production in a single doublet well system caused both a decrease in the water level in the production well and an increase in the water level in the reinjection well (Figure 4A). Furthermore, as supported by Figure 4A and Figure 3, the water level drawdowns of the production well for the single doublet well system were less than that for the single depressurization without reinjection. Therefore, reinjection is conducive for controlling water level drawdown due to a part of the reinjected water flowing toward the production well (Figure 5A) and the increased hydraulic communication between wells. Water level drawdown of production well W1 was inversely proportional to the distance of the reinjection well (Figure 4A). While the draw up of the water level of the reinjection well was not only related to the well distance but also to the length of the openhole. An increase in the well distance lead to a decrease in hydraulic communication; the same recharge rate in a farther reinjection well will cause a larger increment in the water level. By contrast, an increase in the openhole length meant an increase in the section area for water transport and lead to a reduction of the draw up (Case 2 in Figure 4A). The 100% reinjection helped counteract 10–20% water level drawdown compared with the production-only.
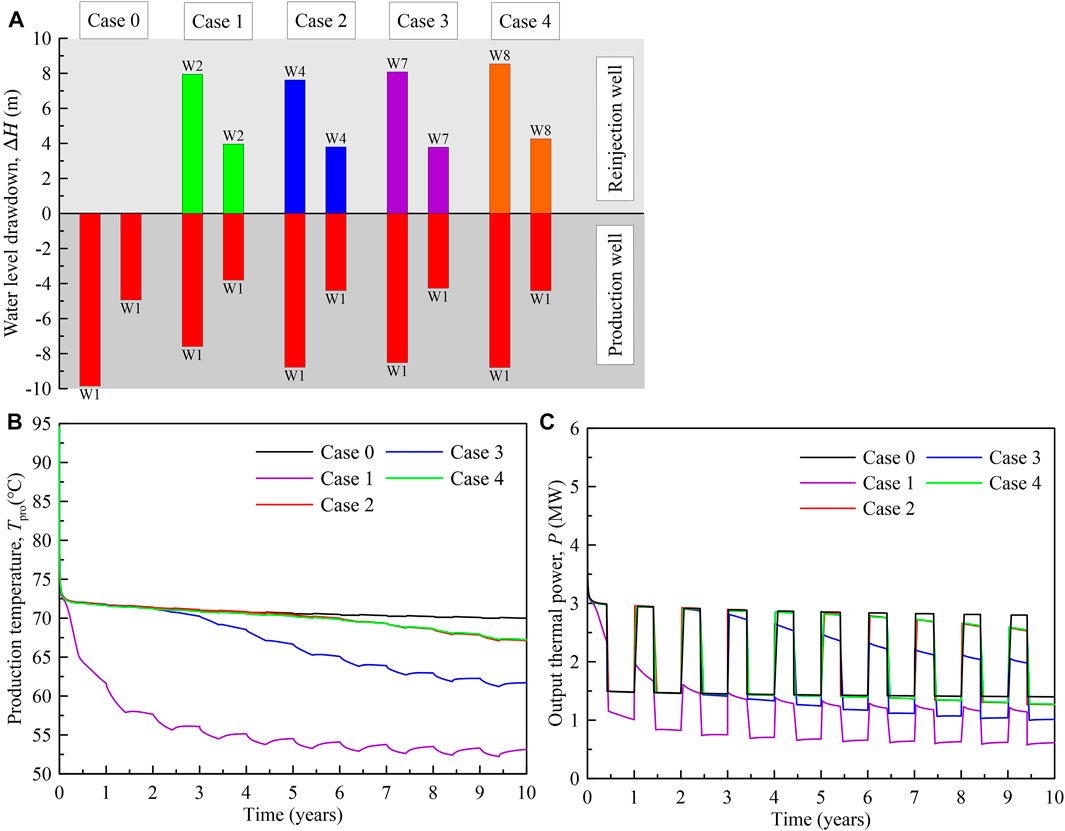
FIGURE 4. (A) Water level drawdown of the production and reinjection wells, (B) the production temperature, and (C) the output thermal power for different well distances of the single doublet well system. The Case 0 (production-only) was added for comparison.
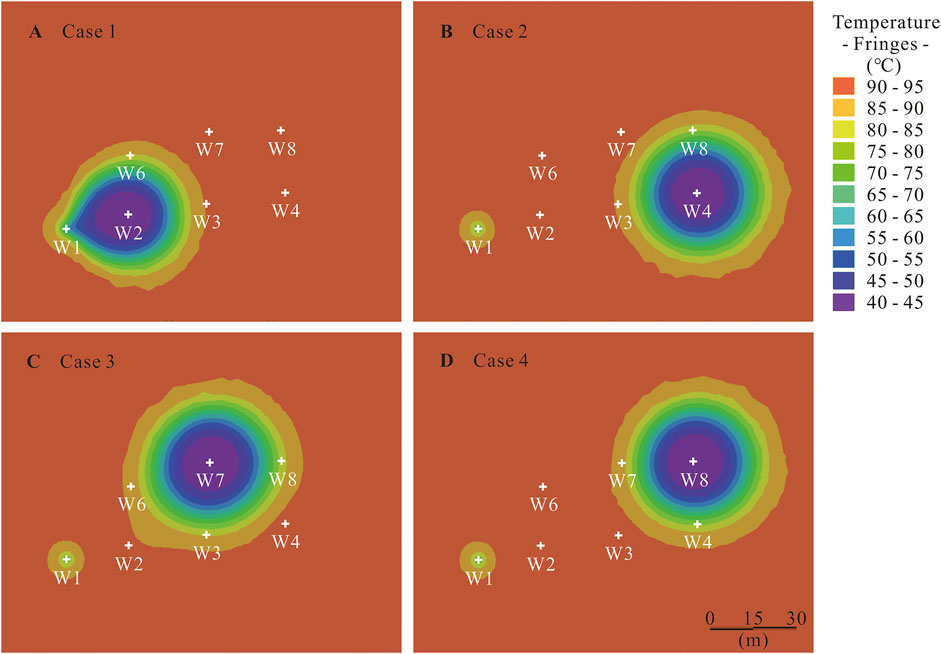
FIGURE 5. Effect of the well distance on temperature distribution (at a depth of 160 m) for the single doublet well systems after 1 year of production. (A) Case 1, (B) Case 2, (C) Case 3, and (D) Case 4.
As shown in Figure 4B, the variation of the production temperature indicated that the reinjection of cold water by a single doublet well system caused the thermal breakthrough, i.e., a decrease in the production temperature (Figure 5A). The reinjection well location plays a significant role in controlling the critical time and the degree of thermal breakthrough at the production wells. A larger well distance significantly inhibits early thermal breakthrough at the production well, and vice versa. This is mainly affected by the heating of water flowing through the reservoir and the mixing of cold and hot water at the production well. For Case 2, with a small well distance, cold water was quickly transported to the production well and had insufficient heating time. As a result, the production temperature highly decreased during the first heating season. Although the decrease in the production temperature was mitigated during the non-heating season, the production temperature quickly decreased again in the next heating season. The thermal breakthrough after 1 year is clearly shown in Figure 5A. However, 1-year reinjection with a larger well distance did not cause thermal breakthrough (Figures 5B–D). The production temperature of Case 2 gradually became stable as production proceeded and decreased to about 53°C (Figure 4B), indicating a stable hydraulic communication between wells and a mix of cold and hot water at the production well. The thermal breakthrough for Cases 2–4 occurred subsequently. The production temperature for the scenarios with similar well distances exhibited concordance. With a more significant well distance, continued reinjection would result in a longer lifetime of the geothermal reservoir but have a smaller influence on the water level. The water level drawdown and production temperature should be balanced.
The output thermal power is shown in Figure 4C. The output thermal power before thermal breakthrough exhibited a stable state. Once thermal breakthrough occurred, however, the thermal power generally decreased during the heating season and stabilized during the non-heating season. For the doublet well system, the performance of Case 4 was the best. After 10 years, the output thermal power of Case 4 dropped to 2.54 and 1.27 MW, respectively, for the heating and non-heating seasons (Figure 4C). In current drilled wells, a doublet well system with a larger well distance is favorable for sustainable heat production.
4.3 Multi-Well System
The water level drawdown of the multi-well system is shown in Figure 6A. Under the same total production rate, the increase in the number of production and reinjection wells, respectively, means the decrease in the individual production and reinjection rates. Therefore, the absolute water level drawdown for production and reinjection wells decreased. The differences in the absolute water level drawdown were attributed to the combined effect of well distance, length of openhole section, and interference between the wells. For a multi-well system with one production well (Cases 7 and 8), the water level drawdown of the production well was similar to that of Cases 3 and 4 (Figure 4A). Therefore, the decrease in the production rate in the production well is the main factor controlling its water level drawdown. From the viewpoint of controlling water level drawdown, the employment of a multi-well system, by employing more production and reinjection wells, actually facilitates the control of the water level. However, the investment increases with the number of wells. The heat production performance is also needed to be evaluated.
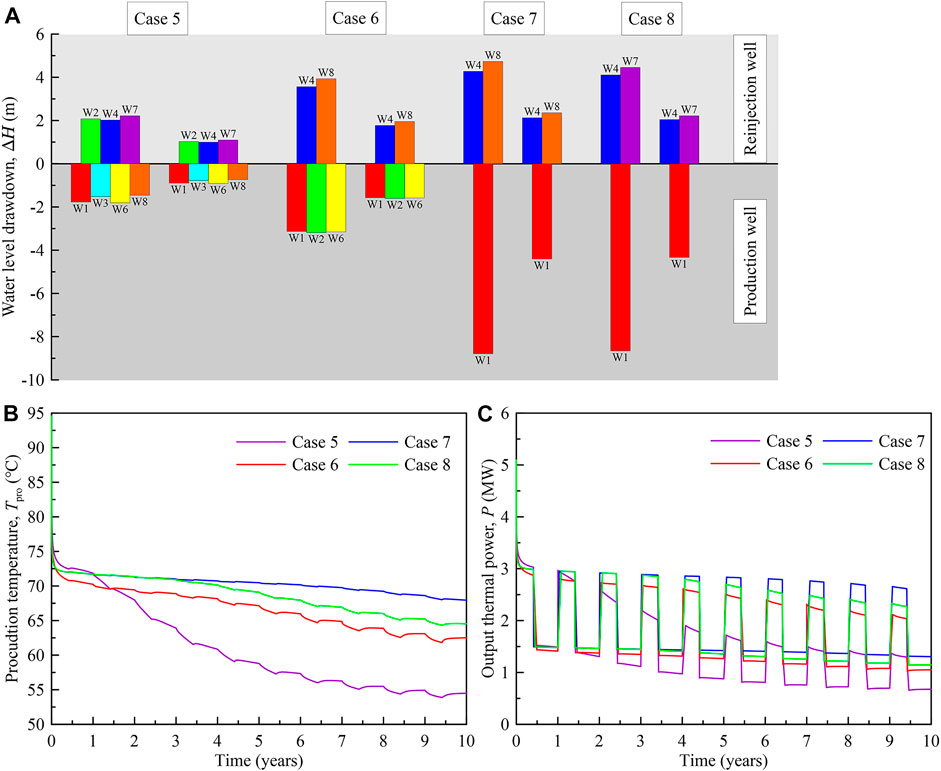
FIGURE 6. (A) Water level drawdown, (B) production temperature, and (C) output thermal power of different multi-well systems in the heating and non-heating seasons.
As shown in Figure 6B, in the first year, the production temperature and output thermal power of Case 5 were the highest, while they began to decline rapidly in the second year. This is because the four production and three reinjection wells of Case 5 were arranged in a crossway. The bottom of the openhole section of production well W3 had a deep depth, the production of high-temperature water induced the increase in the production temperature. However, due to the narrow spacing between production and reinjection wells, a thermal breakthrough occurred early in all production and reinjection wells (Figure 7A), resulting in unsustainable production of high-temperature water. The output thermal power of the heating season decreased over time, as a response to the decreased production temperature. The output thermal power of the early non-heating season decreased and gradually stabilized in the later non-heating season. The output thermal power decreased to half of its initial value.
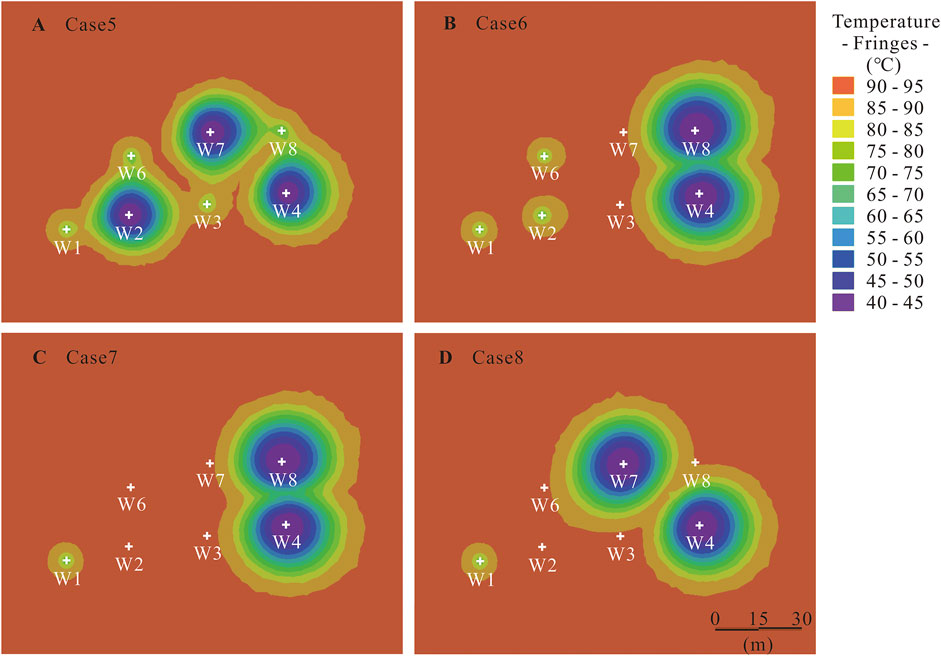
FIGURE 7. Temperature distribution of different multi-well systems after 1 year of production (at a depth of 160 m). (A) Case 5, (B) Case 6, (C) Case 7, and (D) Case 8.
During the first year of production, the production temperature of Case 6 was lower than that of the other cases. This is due to the production of low-temperature water of production well W6, which had a shallow well depth of 160 m. The mix of low-temperature water resulted in a low overall production temperature. The output thermal power was shown a decreased state in the heating season and remained stable in the non-heating season. Therefore, W6 as a production well was unsuitable for heat production.
Case 8 represents the actual operation scenario. In the first 4 years, the production temperature and output thermal power were basically stable. However, after 5 years, the production temperature and output thermal power began to decrease rapidly. The output thermal power decreased when the thermal breakthrough occurred, whereas this was constant during the non-heating season.
Among the four scenarios of a multi-well system, the performance of Case 7 was the best. The production temperature after 10 years decreased to 67.95°C, and the output thermal power dropped to 2.6 and 1.3 MW, respectively, for the heating and non-heating seasons (Figure 6C).
Figure 7 shows the temperature distribution after 1 year for the multi-well system. The temperature distribution in Figure 7A indicated clearly that some injected cold water had been transported into the production well. The injected water in W2 tended to flow into W1, W3, and W6. The injected water in W7 tended to flow into W3 and W8. The injected water in W4 tended to flow into W8. However, for a multi-well system (Cases 6–8) with a more considerable distance between the production and reinjection wells, the temperature after 1 year indicated that there was no thermal breakthrough. A more considerable distance between the production and reinjection wells was also conducive for sustainable heat production. Furthermore, some interferences occurred between the reinjection wells; this jointly drove the cold water flow toward the production well. With continuous reinjection of cold water for Case 7, as shown in Figure 8, the injected cold water flowed toward both sides. A front of injected cold water began to form after 3 years. The front increased over time, and the heating effect was significant where it was close to the production well.
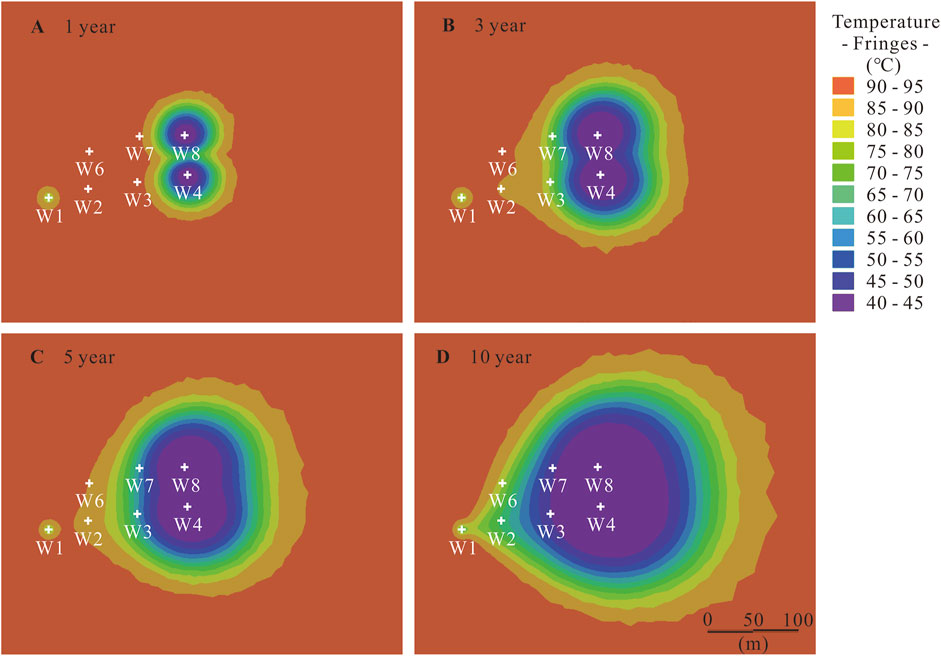
FIGURE 8. Temperature distribution evolution of Case 7 during 10 years (at a depth of 160 m). (A) 1 year, (B) 3 years, (C) 5 years, and (D) 10 years.
4.4 Sensitivity to Different Operation Strategies
The sensitivity of heat production performance to different operation strategies was further discussed based on the scenario of Case 7. The detailed parameters were openhole length, production rate, and reinjection temperature.
4.4.1 Openhole Length
The effect of the openhole length was investigated by changing the starting depth of the openhole of W1 of the reference scenario (Case 7, with openhole starting depth of −30 m). The investigated openhole lengths were 142, 132, 112, and 92 m, which corresponds, respectively, to the starting depth of −30, −40, −60, and −80 m. As shown in Figure 9A, the decrease in openhole length led to a decrease in the discharge area between the well and reservoir. Therefore, the pressure gradient increased in order to afford the same discharge rate. As a result, the water level dropped more with respect to the initial water level. Water level drawdown for the short openhole increased (Figure 9A) in both the heating and non-heating seasons.
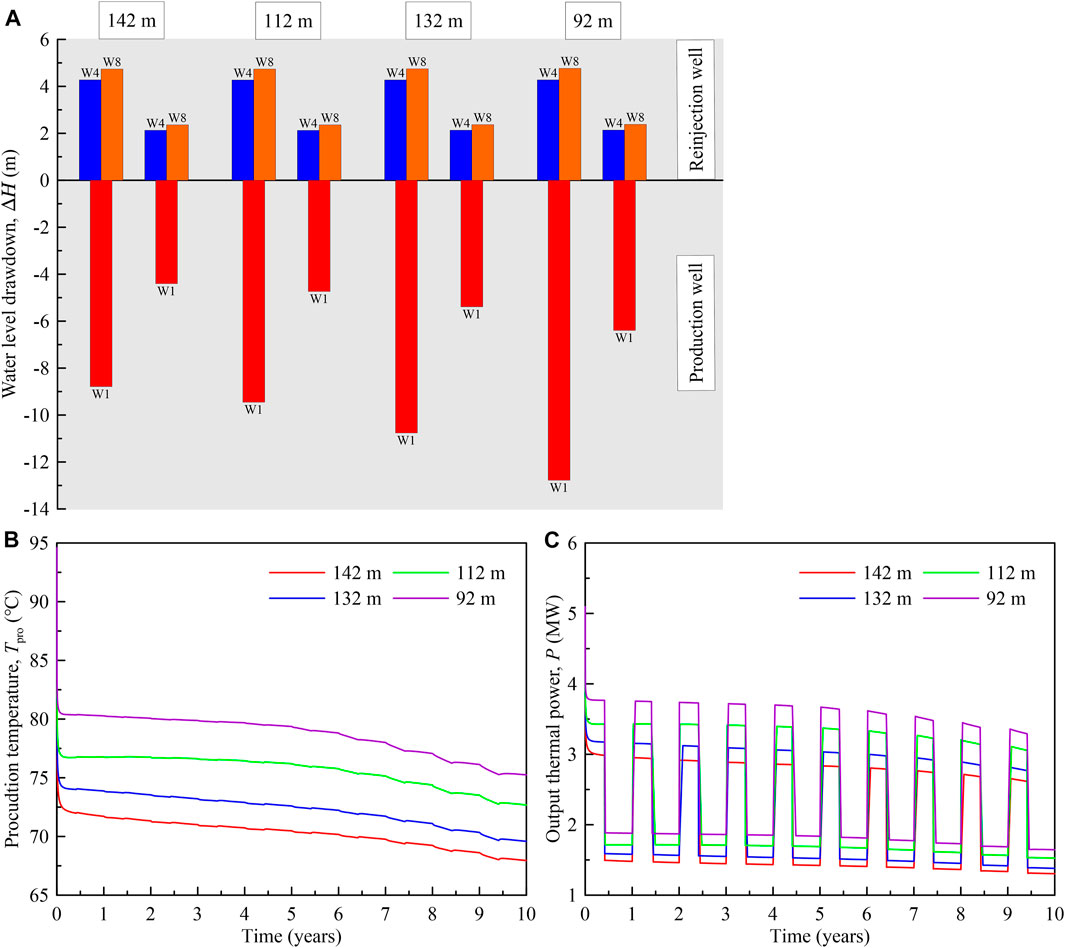
FIGURE 9. Effect of openhole length of the production well on (A) water level drawdown, (B) the production temperature, and (C) the output thermal power.
The production temperature increased with a decrease in the openhole length of the production well (Figure 9B). This was because of a decrease in the openhole length in the study, meaning the starting depth of the openhole was deep. Therefore, water with high temperature easily discharged from the deep parts of the geothermal reservoir. The openhole length highly affects the production temperature, while affecting the critical time of thermal breakthrough less. A short openhole allocated in the deep parts of the reservoir facilitates the production temperature, while inducing unfavorable water level drawdown. Thus, the openhole length appears to be a key parameter in the hydraulic and thermal behaviors of the geothermal well system. The output thermal power for different openhole lengths changed similarly in both the heating and non-heating seasons. When the openhole length decreased from 142 to 92 m, the output thermal power was evaluated to increase by 23% (Figure 9C).
4.4.2 Production Rate
Under constant reinjection temperature, the increase in production/reinjection rates directly stimulates a more significant hydraulic gradient, which causes a decrease in the water level of the production well and an increase in the water level of the reinjection well (Figure 10A). By increasing the production rate from 80 to 160 m3/h, the water level drawdown of production well W1 increased twofold from −8.8 to −17.6 m. Similar increments were also observed for the water level draw up of the reinjection wells (Figure 10A).
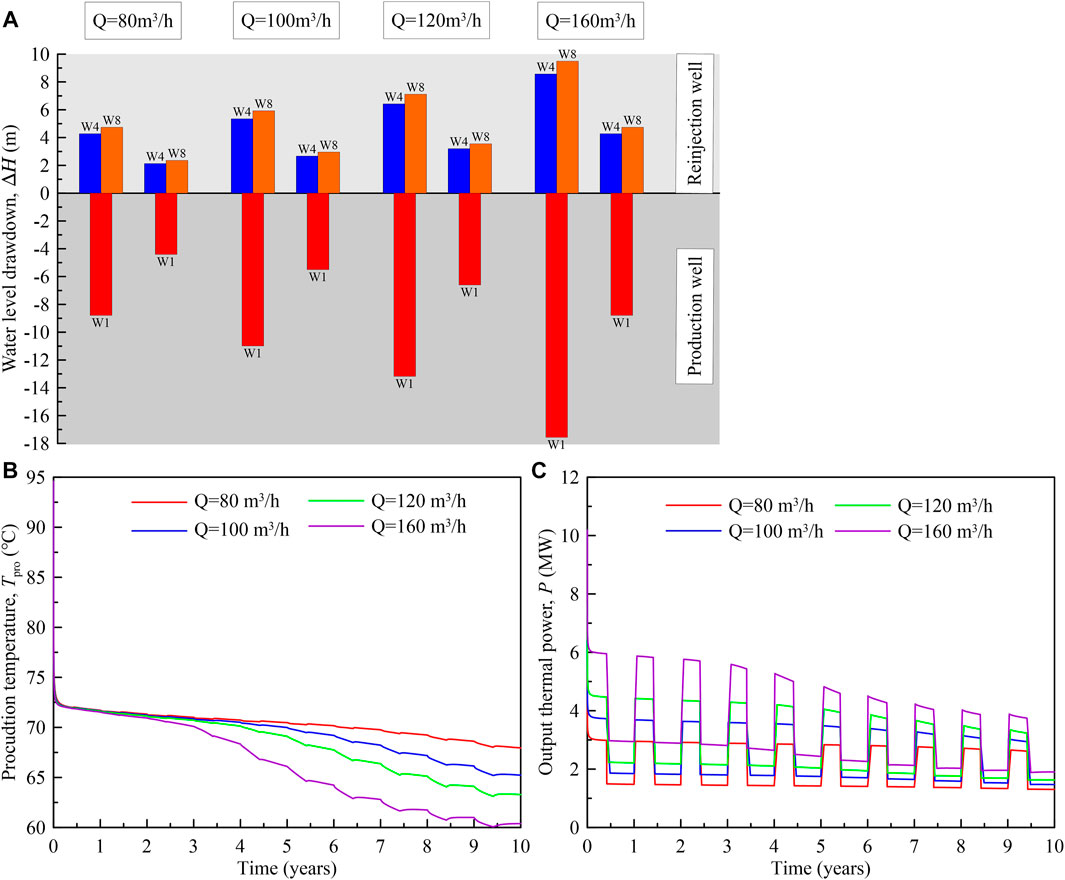
FIGURE 10. Effect of the production rate on (A) water level drawdown, (B) the production temperature, and (C) the output thermal power.
The production temperature changed similarly before the thermal breakthrough (Figure 10B). Naturally, the flowing time for water particles from the reinjection well to the production well is inversely proportional to the production/reinjection rates. A high production rate induced an advanced occurrence of thermal breakthrough, which is due to the increased hydraulic gradient driving a high flow rate of cold water. After thermal breakthrough, the mix of large amounts of insufficiently heating water induced a decrease in the production temperature. The increase in the production rate shortened the lifetime of a geothermal operation by causing early thermal breakthrough at the production well. Therefore, production temperatures after 10 years decreased with an increase in the production rate.
An increase in the production rates directly induced a high increase in output thermal power (Figure 10C) in the early stage. After thermal breakthrough, however, the output thermal power in the heating season decreased. The difference in output thermal power between the different production rates decreased over time, for both the heating and non-heating seasons.
4.4.3 Reinjection Temperature
By decreasing the reinjection temperature, the production temperature changed little in the early stage, while a minor difference between the different scenarios occurred in a later stage (Figure 11). Water level drawdowns were similar because of the unchanged production and reinjection rates and are not plotted here. Under a constant production rate, the change in reinjection temperature implied a variation of the output thermal power. The reduction in reinjection temperature from 40°C to 25°C was equivalent to the increasing line source thermal injection by 37.5%. Although a difference (<0.95°C) in the production temperatures after 10 years was observed for Treinj = 40°C and 25°C, and the output thermal power in the heating season significantly increased from 3.1 MW for Treinj = 40°C to 4.3 MW for Treinj = 25°C.
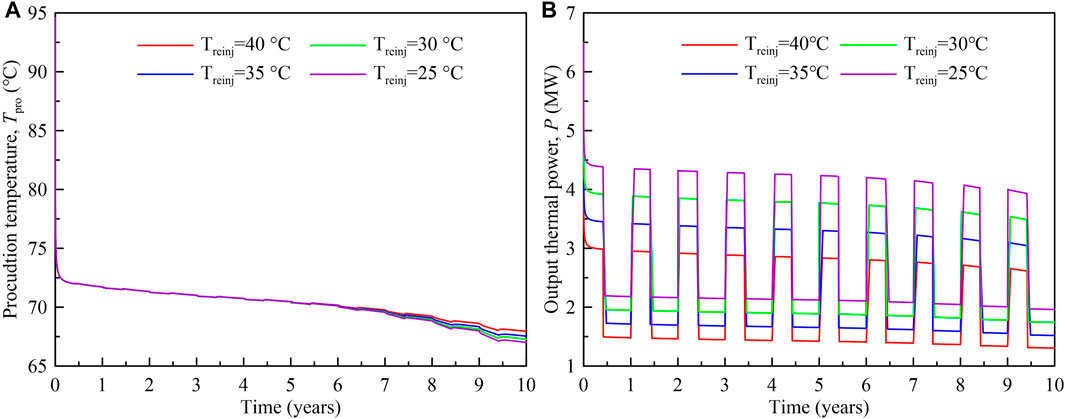
FIGURE 11. Effect of reinjection temperature on (A) production temperature and (B) output thermal power.
The influence of different reinjection temperatures on the model was acceptable; the reinjection can be carried out after geothermal cascade utilization. In order to maintain sustainability of heat production and make full use of the geothermal reservoir, the reinjection can be carried out with a water temperature between 40°C and 25°C.
5 Conclusion
The performance of multi-well production and reinjection strategies in a small-scale shallow geothermal reservoir was studied numerically based on the available data from the Houhaoyao geothermal field. By characterizing well placement and validating against pumping test, scenarios including single production, the single doublet system, and the multi-well system were compared. The response of the water level and production temperature was mainly discussed. The following conclusions can be drawn from this study:
1. Production without reinjection induces the highest production temperature and also the water level drawdown. The production temperature slightly decreases except for the first heating season. After 10 years, the production temperature of production-only decreased to 70°C.
2. Reinjection through the single doublet well system can alleviate drawdown of the water level while inducing a decrease of the production temperature to some extent. Well spacing significantly affects thermal breakthrough, especially for small-scale fields. Increasing the spacing between the production and reinjection wells can delay the critical time of thermal breakthrough and lengthen the lifetime of the geothermal field.
3. The employment of a multi-well system is conducive to controlling water level drawdown by designating a low rate to individual production/reinjection wells. However, interference and thermal breakthrough in the small-scale site occur quickly. Large spacing between the production and reinjection wells is also the basic principle for designing of multi-well systems.
4. A decrease in the openhole length leads to an increase in the production temperature and output thermal power. An increase in the production rate affects the thermal breakthrough highly and shortens the lifetime of the geothermal system. A reduction in the reinjection temperature affects the production temperature less, while affecting the output thermal power significantly. Reinjection can be carried out after geothermal cascade utilization at a temperature between 40°C and 25°C.
Here, we mainly discuss the possibility of the enhancement of heat exploitation by production–reinjection strategy. The feasibility of injectivity and possible land subsidence caused by water level drawdown is beyond the scope of this study. In future works, the numerical simulation will be refined by the long-term production–reinjection operation data. Meanwhile, land subsidence is needed further to analyze the effect of heat production on the stability of surface building.
Data Availability Statement
The original contributions presented in the study are included in the article/Supplementary Material; further inquiries can be directed to the corresponding authors.
Author Contributions
WY: conceptualization, methodology, data curation, and writing—original draft. DZ: investigation, resources, and formal analysis. YZ: investigation and validation. JG: investigation, data curation, and visualization. TL: investigation and validation. HZ: conceptualization, methodology, visualization, and writing—review and editing. GJ: conceptualization, supervision, and writing—review and editing. GW: supervision, investigation, and validation. BZ: investigation and validation. All authors have read and agreed to the published version of the manuscript.
Funding
This work was jointly supported by the National Geological Survey Project (Grant Numbers: DD20190129 and DD20190234), the National Natural Science Foundation of China (Grant Numbers: 42102289 and 42102302), the Open Foundation of Key Laboratory of Natural Gas Hydrate, CAS (Grant Number: E0290206), the Guangdong Basic and Applied Basic Research Foundation (Grant Number: 2020A1515110244), and the PetroChina Innovation Foundation (Grant Number: 2020D-5007-0212).
Conflict of Interest
The authors declare that the research was conducted in the absence of any commercial or financial relationships that could be construed as a potential conflict of interest.
Publisher’s Note
All claims expressed in this article are solely those of the authors and do not necessarily represent those of their affiliated organizations, or those of the publisher, the editors, and the reviewers. Any product that may be evaluated in this article, or claim that may be made by its manufacturer, is not guaranteed or endorsed by the publisher.
Acknowledgments
We thank Jiwei Hou, the engineer of Aolin Spring Town, for offering the system operation information of the geothermal system.
References
Babaei, M., and Nick, H. M. (2019). Performance of Low-Enthalpy Geothermal Systems: Interplay of Spatially Correlated Heterogeneity and Well-Doublet Spacings. Appl. Energ. 253, 113569. doi:10.1016/j.apenergy.2019.113569
Crooijmans, R. A., Willems, C. J. L., Nick, H. M., and Bruhn, D. F. (2016). The Influence of Facies Heterogeneity on the Doublet Performance in Low-Enthalpy Geothermal Sedimentary Reservoirs. Geothermics 64, 209–219. doi:10.1016/j.geothermics.2016.06.004
Cui, R. Y., Hultman, N., Cui, D., Mcjeon, H., Yu, S., Edwards, M. R., et al. (2021). A Plant-By-Plant Strategy for High-Ambition Coal Power Phaseout in China. Nat. Commun. 12, 1468. doi:10.1038/s41467-021-21786-0
Diersch, H.-J. (2014). FEFLOW: Finite Element Modeling of Flow, Mass and Heat Transport in Porous and Fractured Media. Berlin Heidelberg: Springer-Verlag.
Fanwen, M., Jiangtao, H., Wenyu, L., and Lijia, L. (2021). Magmatic Geothermal Genesis Model in the Huailai Area Based on the Constraints of the Crust-Mantle-Scale Geoelectric Structure. Appl. Sci. 11, 2086. doi:10.3390/app11052086
Franco, A., and Vaccaro, M. (2014). Numerical Simulation of Geothermal Reservoirs for the Sustainable Design of Energy Plants: A Review. Renew. Sust. Energ. Rev. 30, 987–1002. doi:10.1016/j.rser.2013.11.041
Hu, Z., Xu, T., Feng, B., Yuan, Y., Li, F., Feng, G., et al. (2020). Thermal and Fluid Processes in a Closed-Loop Geothermal System Using CO2 as a Working Fluid. Renew. Energ. 154, 351–367. doi:10.1016/j.renene.2020.02.096
Huo, A., Wang, X., Lyu, Y., Cheng, Y., Zheng, C., and Song, J. (2019). Simulation Research on the Reinjection Temperature fields of Deep Geothermal wells Based on Real-Scale experiment. Energy Exploration & Exploitation 37, 646–662. doi:10.1177/0144598718807556
Kamila, Z., Kaya, E., and Zarrouk, S. J. (2021). Reinjection in Geothermal fields: An Updated Worldwide Review 2020. Geothermics 89, 101970. doi:10.1016/j.geothermics.2020.101970
Kong, Y. (2017). Optimization of Well-Doublet Placement in Geothermal Reservoirs Using Numerical Simulation and Economic Analysis. Environ. Earth Sci. 7. doi:10.1007/s12665-017-6404-4
Kong, Y., Pang, Z., Pang, J., Li, J., Lyu, M., and Pan, S. (2020). Fault-Affected Fluid Circulation Revealed by Hydrochemistry and Isotopes in a Large-Scale Utilized Geothermal Reservoir. Geofluids 2020, 1–13. doi:10.1155/2020/2604025
Le Lous, M., Larroque, F., Dupuy, A., Moignard, A., and Damy, P.-C. (2018). Performance of an Open-Loop Well-Doublet Scheme Located in a Deep Aquitard-Aquifer System: Insights from a Synthetic Coupled Heat and Flow Model. Geothermics 74, 74–91. doi:10.1016/j.geothermics.2018.02.008
Liu, G., Wang, G., Zhao, Z., and Ma, F. (2020). A New Well Pattern of Cluster-Layout for Deep Geothermal Reservoirs: Case Study from the Dezhou Geothermal Field, China. Renew. Energ. 155, 484–499. doi:10.1016/j.renene.2020.03.156
Mallapaty, S. (2020). How China Could Be Carbon Neutral by Mid-century. Nature 586, 482–483. doi:10.1038/d41586-020-02927-9
Markó, Á., Mádl-Szőnyi, J., and Brehme, M. (2021). Injection Related Issues of a Doublet System in a sandstone Aquifer - A Generalized Concept to Understand and Avoid Problem Sources in Geothermal Systems. Geothermics 97, 102234.
Rivera Diaz, A., Kaya, E., and Zarrouk, S. J. (2016). Reinjection in Geothermal fields − A Worldwide Review Update. Renew. Sust. Energ. Rev. 53, 105–162. doi:10.1016/j.rser.2015.07.151
Su, Y., Yang, F., Wang, B., Jia, Z., and Duan, Z. (2018). Reinjection of Cooled Water into sandstone Geothermal Reservoirs in China: a Review. Geosci. J. 22, 199–207. doi:10.1007/s12303-017-0019-3
Wang, Y. (2010). A Study of Characteristics and Models for Spring Discharge and Temperature of Low-To-Moderate Thermal Springs in Beijing and Northern Hebei. Beijing: China University of Geoscience.
Willems, C. J. L., and Nick, H. M. (2019). Towards Optimisation of Geothermal Heat Recovery: An Example from the West Netherlands Basin. Appl. Energ. 247, 582–593. doi:10.1016/j.apenergy.2019.04.083
Yang, Z., Xu, T., Wang, F., Yang, Y., Li, X., and Zhao, N. (2018). Impact of Inner Reservoir Faults on Migration and Storage of Injected CO2. Int. J. Greenhouse Gas Control. 72, 14–25. doi:10.1016/j.ijggc.2018.03.006
Yuan, Y., Xu, T., Jiang, Z., and Feng, B. (2021). Prospects of Power Generation from the Deep Fractured Geothermal Reservoir Using a Novel Vertical Well System in the Yangbajing Geothermal Field, China. Energ. Rep. 7, 4733–4746. doi:10.1016/j.egyr.2021.07.069
Zhang, C., Jiang, G., Jia, X., Li, S., Zhang, S., Hu, D., et al. (2019a). Parametric Study of the Production Performance of an Enhanced Geothermal System: A Case Study at the Qiabuqia Geothermal Area, Northeast Tibetan Plateau. Renew. Energ. 132, 959–978. doi:10.1016/j.renene.2018.08.061
Zhang, S., Jiang, Z., Zhang, S., Zhang, Q., and Feng, G. (2021). Well Placement Optimization for Large-Scale Geothermal Energy Exploitation Considering Nature Hydro-thermal Processes in the Gonghe Basin, China. J. Clean. Prod. 317, 128391. doi:10.1016/j.jclepro.2021.128391
Keywords: geothermal energy, reinjection, production strategy, water level drawdown, sustainable development, Huailai County
Citation: Yuan W, Zhang D, Zhang Y, Gao J, Liu T, Zhai H, Jin G, Wang G and Zhang B (2021) Performance of Multi-Well Exploitation and Reinjection in a Small-Scale Shallow Geothermal Reservoir in Huailai County. Front. Earth Sci. 9:786389. doi: 10.3389/feart.2021.786389
Received: 30 September 2021; Accepted: 15 November 2021;
Published: 22 December 2021.
Edited by:
Yanlong Kong, Institute of Geology and Geophysics (CAS), ChinaReviewed by:
Yuanzheng Zhai, Beijing Normal University, ChinaYonghui Huang, Institute of Geology and Geophysics (CAS), China
Zhongfeng Duan, China University of Petroleum(Huadong), China
Copyright © 2021 Yuan, Zhang, Zhang, Gao, Liu, Zhai, Jin, Wang and Zhang. This is an open-access article distributed under the terms of the Creative Commons Attribution License (CC BY). The use, distribution or reproduction in other forums is permitted, provided the original author(s) and the copyright owner(s) are credited and that the original publication in this journal is cited, in accordance with accepted academic practice. No use, distribution or reproduction is permitted which does not comply with these terms.
*Correspondence: Haizhen Zhai, emhhaWh6QG1zLmdpZWMuYWMuY24=; Guangrong Jin, amluZ3JAbXMuZ2llYy5hYy5jbg==; Guiling Wang, Z3VpbGluZ3dAMTYzLmNvbQ==