 Purevdagva Khalzan1,2
 Akiko Sakai
 Koji Fujita
- 1Information and Research Institute of Meteorology Hydrology and Environment, Ulaanbaatar, Mongolia
- 2Graduate School of Environmental Studies, Nagoya University, Nagoya, Japan
This study describes the in situ observed and modeled mass balances of four representative glaciers in the Mongolian Altai Mountains. Mass-balance stakes and automatic weather stations (AWS) were installed along each glacier to obtain the in situ mass balances and meteorological variables. We calibrate the ERA5 meteorological variables using the observed values, then estimate the precipitation parameters to obtain the observed point mass balances using an energy- and mass-balance model. We evaluate the mass-balance profile and glacier-wide mass balance via a mass-balance model using the calibrated ERA5 data and estimated precipitation parameters to fill in the spatial and temporal gaps in the stake networks and AWS measurements. We demonstrate that almost all of the observed mass balances have been in a negative state since 2003. We also reconstruct the long-term mass balances for the 1980–2018 period, which range from −760 to −160 mm water equivalent under the different climatic conditions (annual precipitation varies from 190 to 860 mm). We further evaluate the mass-balance sensitivities to temperature and precipitation changes. We confirm that both sensitivities correlate significantly with the annual precipitation; increased precipitation yields more negative sensitivity to temperature changes and less positive sensitivity to precipitation changes.
1 Introduction
Mongolia is a land-locked arid country in Northeast Asia (inset map of Figure 1A) whose isolated location has resulted in limited moisture flux from the ocean (Sato et al., 2007; Antokhina et al., 2019). However, the regional climate, especially within the glacierized zone, remains equivocal. Furthermore, the impact of climate change on the high-mountain landscape, including glaciers, is poorly understood (Ganyushkin et al., 2017). Mongolian glaciers form within two major mountain ranges, the Altai and Khangai mountains, both of which extend from northwest to southeast. Mongolia generally receives limited precipitation because of its arid to semi-arid climate, with 300–400 mm of mean annual precipitation in the Khangai Mountains and 250–300 mm in the Altai Mountains (Dagvadorj et al., 2009). Approximately 10% of the freshwater volume in Mongolia is estimated to be stored as glacier ice (Dashdeleg et al., 1983; Baast, 1998; Myagmarjav and Davaa, 1999), with many of the river basins already experiencing water stress (Walther et al., 2017). Pan et al. (2019) estimated that about 10% of river runoff in the Ulgii catchment was attributed to glacier meltwater. The spatial glacier distribution is sporadic and decreases from northwest to southeast (Figure 1A). They are categorized as summer-accumulation-type glaciers (Supplementary Figure S1), which indicates that the glacier mass balances are particularly sensitive to temperature changes (Fujita and Ageta, 2000; Fujita, 2008). Most of the glaciers have been retreating recently, which raises the concern that glacier meltwater will not continue to make a sustainable contribution to the regional water supply in the future (Davaa et al., 2006; Kadota and Davaa, 2007; Kadota et al., 2011).
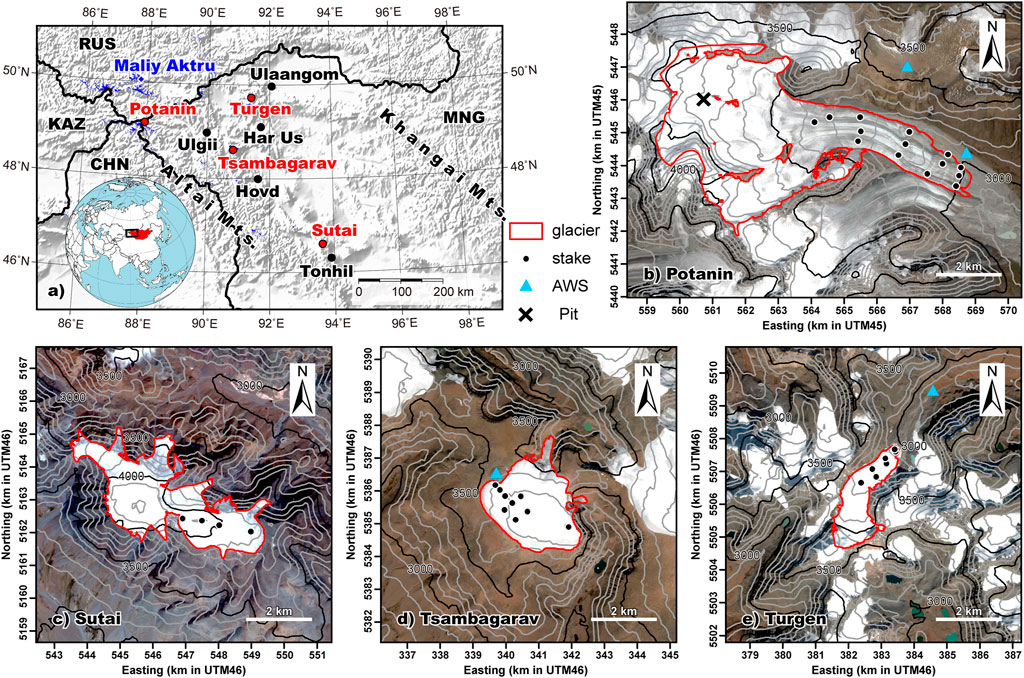
FIGURE 1. Maps of (A) of the four glacier locations (red circles) in western Mongolia, and (B) Potanin, (C) Sutai, (D) Tsambagarav and (E) Turgen glaciers. The inset map in (A) highlights Mongolia and the domain of panel (A). MNG, RUS, CHN, and KAZ in panel (A) denote country names of Mongolia, Russia, China and Kazakhstan, respectively. The blue shadings in (A) denote the glacier outlines from the GAMDAM Glacier Inventory (Nuimura et al., 2015; Sakai, 2019). Black circles and blue rhombus in (A) denote the meteorological stations, whose climate data were used in Supplementary Figure S1, and Maliy Aktru Glacier, whose observed mass balance was compared with the estimation of this study (Figure 8C and Supplementary Table S6), respectively. Red polygons denote the glacier outlines, which have been delineated from the Sentinel-2A images (Table 1). Black dots and blue triangles denote the glacier mass-balance stakes and automatic weather stations (AWSs), respectively. Black cross on Potanin Glacier denotes a pit site at which accumulation was analyzed by pollen analysis (Nakazawa et al., 2015).
The first evidence of changes on Mongolian glaciers was reported by Potanin (1883) after his expeditions to the Mongolian Altai (1877–1879) and a subsequent Polish geological expedition in 1966 (Rutkowski and Slowanski, 1970). In 1910, a Royal Geographical Society expedition conducted an extensive survey of the mountains, produced a detailed topographic map, and documented the glacier extents based on photographs from the Turgen Mountains (Carruthers, 1912). A United States–Mongolian expedition retraced portions of the 1910 expedition in summer 2010, and analyzed repeat field observations and photographs that were acquired in 1910 and 2010 (Kamp et al., 2013). The lower portions of the glaciers typically underwent significant retreat, whereas the ice volumes in the glacier heads appeared to be stable. For example, West Turgen Glacier retreated by ∼600 m and downwasted by ∼70 m during the 1910–2010 period (Kamp et al., 2013). Landsat-based regional glacier inventories have been created from the 1990, 2000, and 2010 imagery (Kamp and Pan, 2015), and glacier recession has been analyzed in detail (Pan et al., 2018). However, repeated in situ observations were limited until the 2000s.
The Tsambagarav and Potanin glaciers have been monitored continuously since 2003 as part of a collaboration between the Institute of Meteorology and Hydrology, Mongolia, and the Japan Agency for Marine-Earth Science and Technology (JAMSTEC; Kadota et al., 2011). The mass balance of Potanin Glacier has been determined using glaciological and meteorological observations (Konya et al., 2010), with similar mass-balance fluctuations to those observed along Maliy Aktru Glacier in the Russian Altai Mountains (Konya et al., 2013). Nakazawa et al. (2015) analyzed the pollen concentrations and oxygen stable isotopes in a snow pit on Potanin Glacier and estimated the snow-accumulation and melt-intensity histories during the 2007–2011 period. The Mongolian Government’s Information and Research Institute of Meteorology, Hydrology, and Environment has continued these glacier-monitoring studies and expanded their efforts to acquire glaciological observations on other Mongolian glaciers since JAMSTEC reduced its involvement in 2013. Although a growing wealth of in situ glaciological observations have been acquired and satellite-based aerial changes revealed (Pan et al., 2018), relatively little is known about the fluctuations in glacier mass across the continental climates of Mongolia. This study aims to summarize the glaciological observations since 2003 by estimating the precipitation regimes of four Mongolian glaciers using an energy- and mass-balance model, reconstruct their long-term mass balances (1980–2018), and reveal their mass-balance sensitivities.
2. Sites, Observations, and Methods
2.1 Glaciers
Four Mongolian glaciers were selected for this mass-balance study (Figure 1). Potanin and Turgen are valley-type glaciers, whereas Tsambagarav and Sutai are ice-cap-like glaciers; the location, elevation range, area and first year of observations for each glacier are summarized in Table 1. We determined the glacier hypsometry at 50-m elevation intervals using the manually delineated glacier outlines from 2017 satellite images (Figure 1) and ASTER-GDEM2 (Tachikawa et al., 2011). Four automatic weather stations (AWSs) were installed near the glaciers in 2005 (Tsambagarav), 2012 and 2014 (Potanin), and 2013 (Turgen) to monitor local meteorological parameters (Table 2).
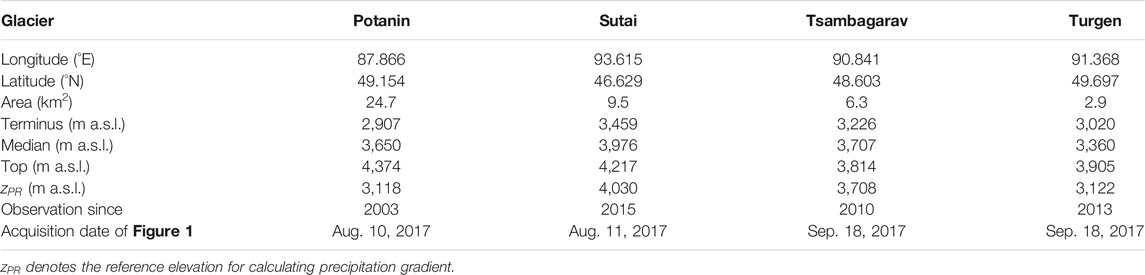
TABLE 1. Specification of four studied glaciers in Mongolia.
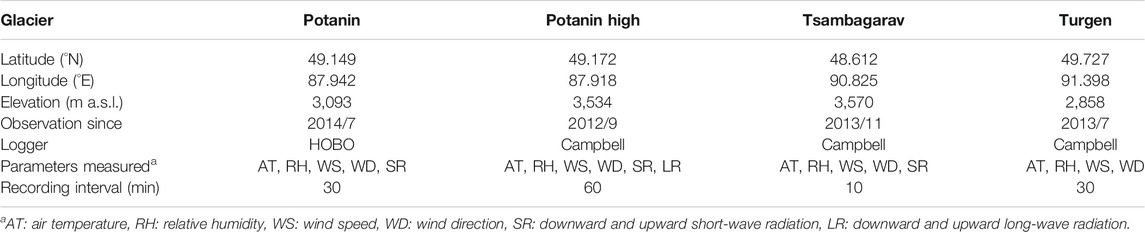
TABLE 2. Automatic weather stations (AWSs) for three glaciers in this study. AWS for Sutai Glacier was out of work after a short period. Sensor specifications are listed in Supplementary Table S1.
Potanin Glacier is located in the Tavan Bogd region, which is along the border between Mongolia, Russia, and China (Figure 1A). The Tavan Bogd region is designated as a national park, thereby protecting it from residential development and making it a popular tourist destination. Potanin Glacier flows from the summit of Mt. Khuiten (4,374 m above sea level (a.s.l.)), which is the highest peak in the Altai Mountains, toward the east, extending 10.4 km along a valley and terminating at 2,907 m a.s.l. (Figure 1B). The glacier area is estimated to be 24.7 km2.
Sutai Glacier is located on Sutai Mountain (4,217 m a.s.l.), the highest peak in the Gobi-Altai Mountains. The mountain range stretches 60 km along the border between the Khovd and Govi–Altai provinces (Figure 1A). The glacier flows from the summit of Sutai Mountain to 3,459 m a.s.l, and possesses an estimated glacier area of 6.2 km2 (Figure 1C). Although the glacier is identified as multiple (14) glaciers in the GAMDAM glacier inventory (Sakai, 2019), we deal with this as a single glacier.
Tsambagarav Glacier is located in the Tsambagarav Mountains, which are part of the Altai Mountains and lie along the border between the Khovd and Bayan–Ulgii provinces in western Mongolia (Figure 1A). The glacier flows 3.6 km, from 3,814 to 3,226 m a.s.l, and possesses an estimated glacier area of 6.3 km2 (Figure 1D). Although the glacier is identified as multiple (4) glaciers in the GAMDAM glacier inventory (Sakai, 2019), we deal with this as a single glacier.
Turgen Glacier is located in the Turgen Mountains, which are in northwestern Mongolia, ∼80 km south of the Russian border (Figure 1A). The mountains are heavily glacierized on their northern slopes and feed several rivers that flow northeast toward the regional capital of Ulaangom and into the Lake Uvs Nuur Basin. The glacier flows from south (3,905 m a.s.l.) to north (3,020 m a.s.l.), extending for 3.6 km, and possesses an estimated glacier area of 3.3 km2.
2.2 Mass-Balance Observations
We installed mass-balance stakes at 50–100-m elevation intervals on the Potanin (14 stakes), Tsambagarav (5 stakes), Turgen (7 stakes), and Sutai (4 stakes) glaciers, and acquired almost annual measurements since 2003, 2010, 2013, and 2015, respectively (Figure 1). We measured the stake height from the ice surface and reinstalled the stakes when necessary. The stake positions were measured intermittently using a differential global positioning system to obtain the flow velocity (not shown in this study). The stakes were sometimes moved up-glacier to compensate for the glacier flow. The stake height were converted into water equivalent (w.e.) with an ice density of 870 kg m−3. In the most measurements, snow thickness above the ice surface was zero or a few centimeter so that we ignored snow in the mass balance estimation.
2.3 Mass-Balance Model
The stakes that were installed for the mass-balance measurements did not cover the entire glacier. The stakes on Potanin and Turgen glaciers primarily covered the lower portions of the glaciers, whereas those on Sutai and Tsambagarav glaciers primarily covered the upper portions (Figure 1). We calibrated the precipitation parameters using an energy- and mass-balance model, which has been used in previous mass-balance studies of various Asian glaciers (e.g., Fujita and Ageta, 2000; Sakai et al., 2009; Sunako et al., 2019), to evaluate the glacier-wide mass balances from these limited observations. We also reconstructed their long-term mass balances (1980–2018) to understand how these glaciers have responded to recent climate change.
The model used in this study calculated the daily energy balance as:
where
where
where
where
where
2.4 Reanalysis Data
We used the ERA5 reanalysis dataset (0.25° × 0.25°), which is produced by the European Centre for Medium-Range Weather Forecasts (Hersbach et al., 2020), as the input meteorological variables for the mass-balance model to estimate the glacier-wide mass balance, reconstruct the long-term mass balance, and evaluate the glacier mass-balance sensitivity for each of the studied glaciers. We tested three methods for the air temperature extraction from the reanalysis data. We extracted the daily air temperature at each AWS site (
where
where
We used these estimated air temperatures to compare the daily parameters (solar radiation, wind speed, and relative humidity) of the ERA5 products with the observational data at the Potanin, Tsambagarav, and Turgen AWSs. We adopted the pressure-level-based temperature (
2.5 Precipitation Calibration
A tipping bucket rain gauge, which is commonly installed at AWSs, cannot capture the precipitation amount precisely because snow is the dominant precipitation type, even during the summer melt season. Therefore, we calibrated the precipitation parameter in this study by applying a multiplier to the ERA5 daily precipitation (
where
2.6 Mass-Balance Reconstruction, Climate Regime, and Sensitivity
We reconstructed the long-term annual mass balances for the 1980–2018 period using the determined precipitation parameter for each glacier to better understand how air temperature and precipitation variations can affect glacier mass balance.
We also determined the climatic regime for the present-day glacier geometry to demonstrate how the current climatic conditions affect the glacier mass balance by varying the air temperature and precipitation amount (Fujita et al., 2011; Sunako et al., 2019). The daily air temperature (
where
We performed a sensitivity analysis of the glacier mass balance to understand how the four glaciers would respond to temperature (±0.5°C) and precipitation (±5%) changes. We also evaluated the uncertainties in the estimated glacier-wide mass balances using the precipitation parameter (±1σ) and precipitation gradient (±45% km−1) uncertainties.
3. Results
3.1 Meteorological Data
We first compared the daily ERA5 air temperatures that were calibrated via the three above-mentioned methods (Section 2.4) with the in situ AWS temperatures at the Potanin, Tsambagarav, and Turgen glaciers (Supplementary Figure S3). The ERA5 temperatures that were calibrated via methods 1 (
We also compared the solar radiation, wind speed, and relative humidity in the reanalysis dataset with the in situ observations to further examine the performance of the ERA5 dataset for each glacier (Supplementary Figures S4–S6). Strong correlations are observed for the daily solar radiation (R2 = 0.77–0.88). However, only very weak to moderate correlations are observed for the wind speed and relative humidity (R2 = 0.10–0.55 for wind speed, and R2 = 0.03–0.59 for relative humidity), even though the p-values indicate a degree of significance owing to the large sample numbers. The strong air temperature and solar radiation correlations are due to their obvious seasonality, such that they do not guarantee the reliability of the reanalysis data; however, the small RMSE values support the representativeness of the reanalysis variables. Therefore, we adopted the linear regression equations for air temperature and solar radiation to calibrate the ERA5 data for the mass-balance calculations. We used the uncalibrated ERA5 data when a regression was unavailable (air temperature and solar radiation at Sutai Glacier and solar radiation at Turgen Glacier). The ERA5 data clearly underestimated the wind speed (Supplementary Figures S4C–S6C). Therefore, we simply assumed the wind speed as
We checked the performances of both the ERA5 air temperature lapse rate and modeled long-wave radiation against the Potanin Glacier observations (Supplementary Figure S7). The temporal changes in the air temperature lapse rate exhibit similar seasonal patterns, with less negative changes during winter and more negative changes during summer. (Supplementary Figure S7A). The less negative lapse rate during winter is likely due to strong inversion conditions, as indicated by the calibrated ERA5 temperatures. Conversely, although the temperature lapse rate along the glacier surface tends to be small (less negative) due to the katabatic-wind-driven cooling effect (Shea and Moore, 2010; Radić et al., 2014), the temperature lapse rate at Potanin Glacier is rather large (more negative) during summer, which is likely due to adiabatic dry conditions. The long-wave radiation, which was estimated from the air temperature, relative humidity, and solar radiation as a proxy for cloud cover (Kondo, 1994; Fujita and Ageta, 2000), also exhibited similar temporal fluctuations to the in situ observations (Supplementary Figure S7C). Scatter and temporal plots of the temperature lapse rate and long-wave radiation results across Potanin Glacier suggest that the linearly calibrated variables (LAPcalib and LRDcalib) are good representatives of the observed values. We therefore adopted this linear regression approach to obtain the air temperature lapse rate and long-wave radiation values for the other glaciers in this study.
3.2 Determining the Precipitation Parameters
We used the calibrated ERA5 data to determine the precipitation parameter that minimized the misfit between the modeled and observed mass balances via iterative calculations at each stake measurement (Figure 2). Histograms of the precipitation parameter indicate that there are reasonable distributions for the Potanin, Tsambagarav, and Turgen glaciers (Figures 2A,C,D), whereas that for Sutai Glacier is rather flat (Figure 2B); this high degree of variability is likely due to the small number of samples compared with those for the other three glaciers (vertical width of the box plot corresponds to the sample number).
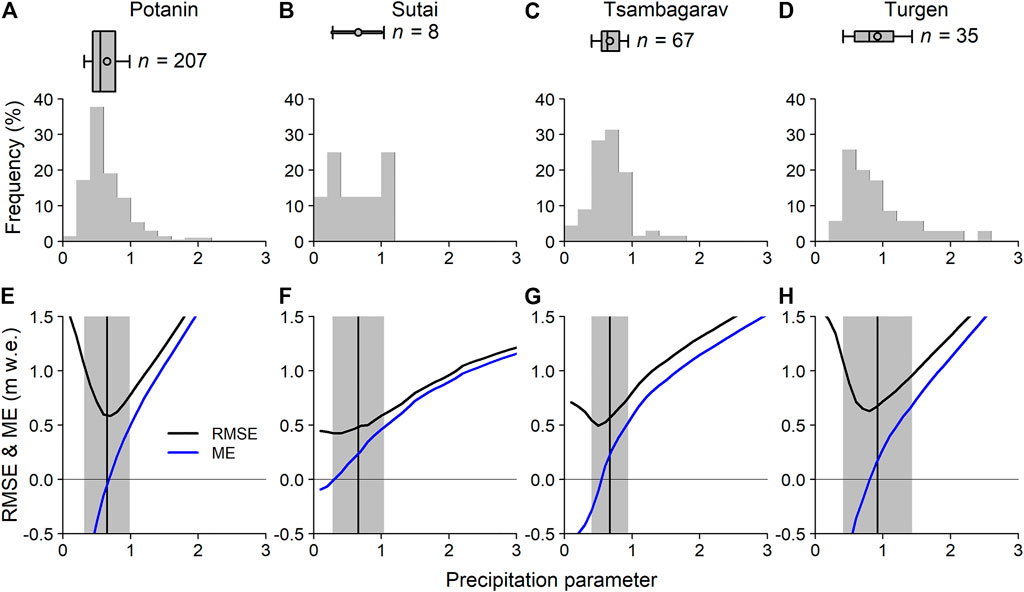
FIGURE 2. Histogram and box plot (upper panels), and root mean square error (RMSE) and mean error (ME) (lower panels) of the precipitation parameter for Potanin (A, E), Sutai (B, F), Tsambagarav (C, G) and Turgen (D, H) glaciers. The horizontal box width, line, circle and whiskers denote the interquartile, median, mean and standard deviations, respectively. The vertical width of the box indicates the number of mass balance measurements used to determine the precipitation parameter (n). The vertical line and grey shaded region in the lower panels denote the mean and standard deviations of the precipitation parameter, respectively.
We estimated the precipitation gradient to calculate the mass balance at the unmeasured elevations (Supplementary Figure S8) using pollen-based accumulation rates (Nakazawa et al., 2015). The slope of regression line suggests that the precipitation increased by 44% per kilometer of elevation; we therefore assumed a precipitation gradient (
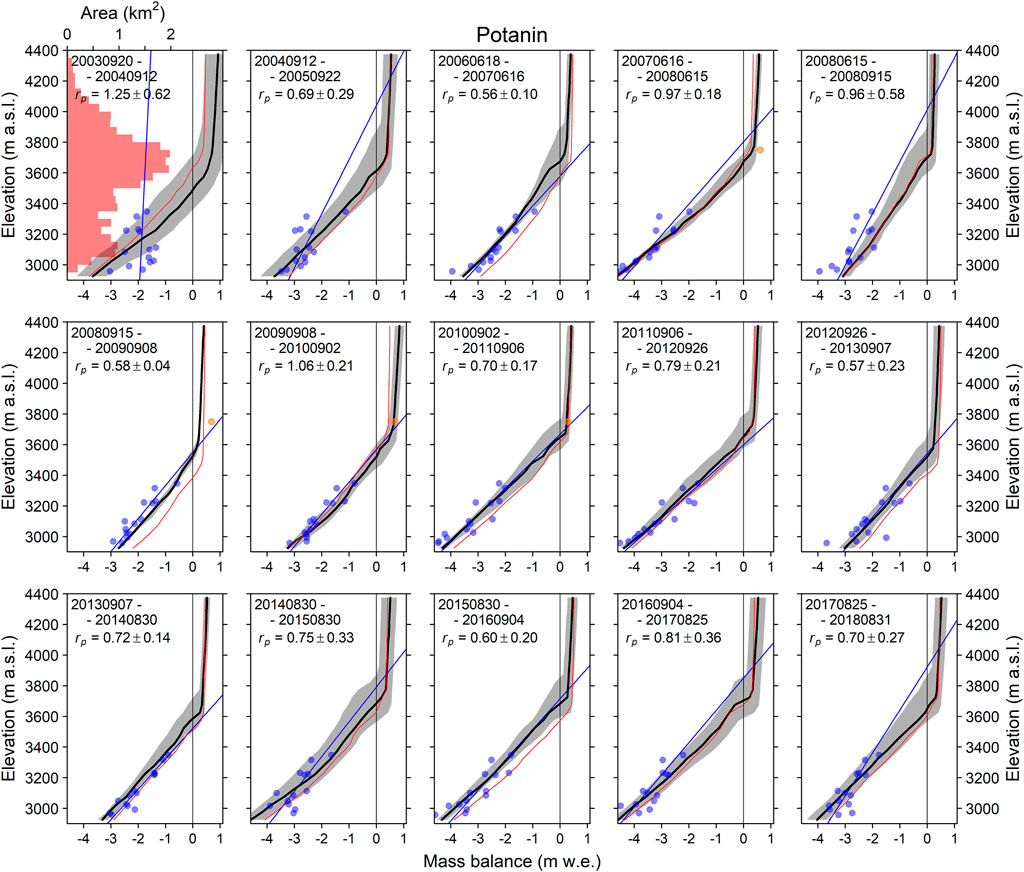
FIGURE 3. Observed and modelled mass balances of Potanin Glacier. The observation period for each panel (starting and ending dates in year month day format: YYYYMMDD) is listed at the top. Red shading in the upper left panel denotes the hypsometry of the glacier at 50-m elevation bands (upper axis). The blue dots denote the observed mass balance, and the blue line denotes a linear regression obtained for band-mean specific mass balances, which were averaged at a 50-m elevation band, respectively. The black line and grey shaded region denote the modelled mass-balance profile and its variability due to the precipitation parameter (
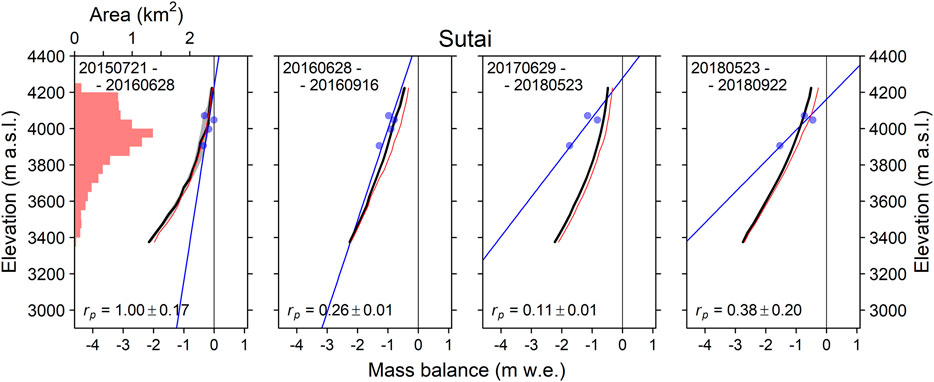
FIGURE 4. As Figure 3, but for Sutai Glacier.
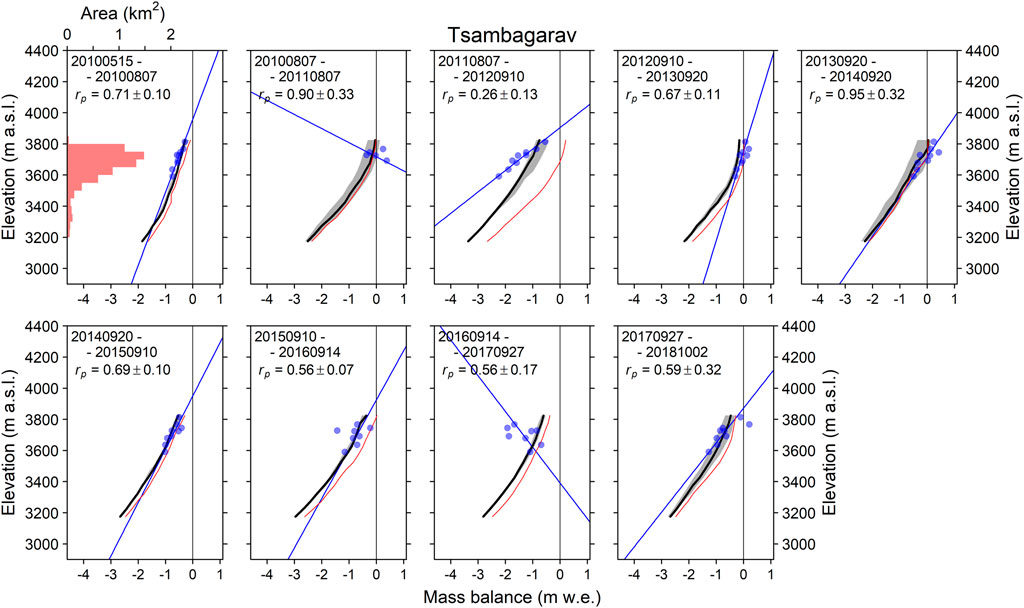
FIGURE 5. As Figure 3, but for Tsambagarav Glacier.
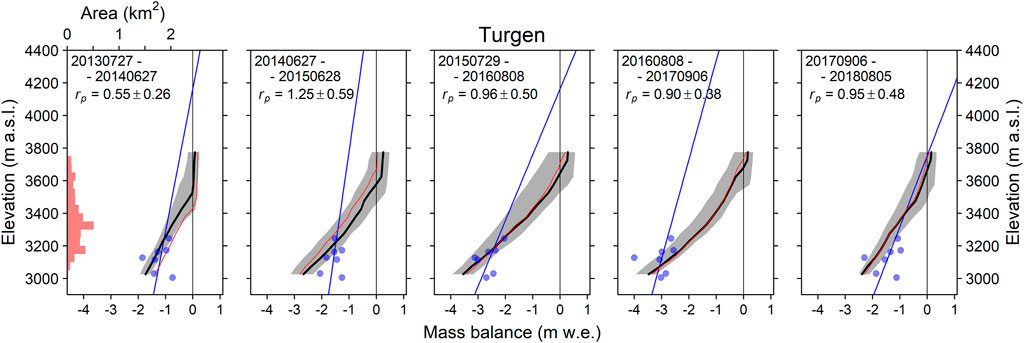
FIGURE 6. As Figure 3, but for Turgen Glacier.
The estimated precipitation parameters for each stake measurement were averaged to determine a single long-term parameter value for each glacier (Figure 2 and Table 3). The determined precipitation parameter (
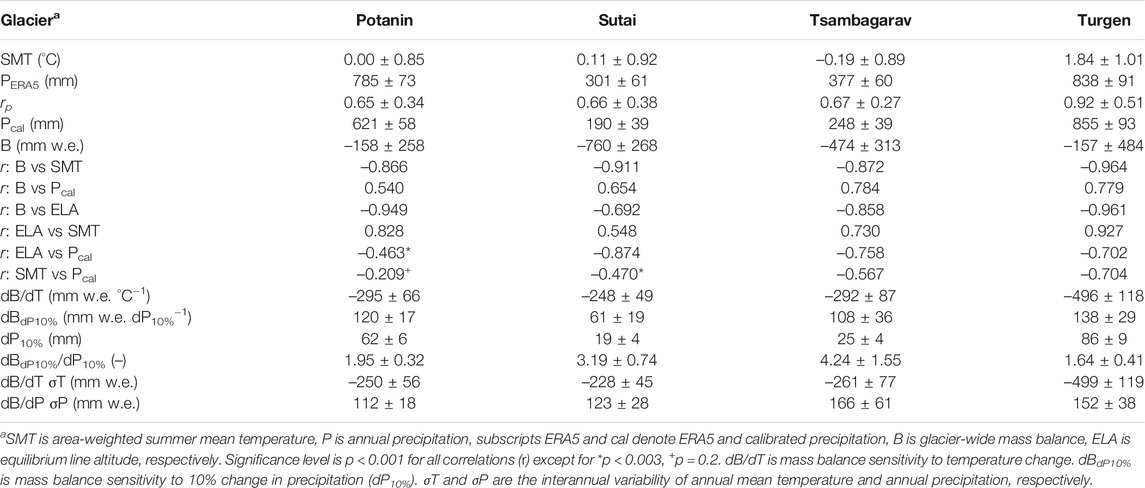
TABLE 3. Climate, parameter, correlation, and sensitivity of the long-term (1980–2018) reconstructed mass balance of four studied glaciers in Mongolia.
3.3 Long-Term Reconstruction
The determined precipitation parameters have been used to calculate the long-term mass-balance profiles averaged for the 1980–2018 period. Figure 7 shows the hypsometries (50-m elevation bands) and mass-balance profiles for the four studied glaciers. The Sutai and Tsambagarav glaciers, which are ice-cap-like, have top-heavy hypsometries, and their mass-balance profiles show that their equilibrium line altitudes (ELAs) are situated along the uppermost portions of the glaciers, suggesting glacier-wide negative mass balances. Conversely, the ELAs of the Potanin and Turgen glaciers, which are valley-type, are situated within the current glacier geometry, and at lower elevations than those of the two ice-cap-like glaciers. The shaded regions along the thick solid lines denote the uncertainty due to the estimated precipitation parameters, and the dotted and dashed lines denote the mass-balance profiles with zero (dotted lines) and doubled (90% km−1) precipitation gradients.
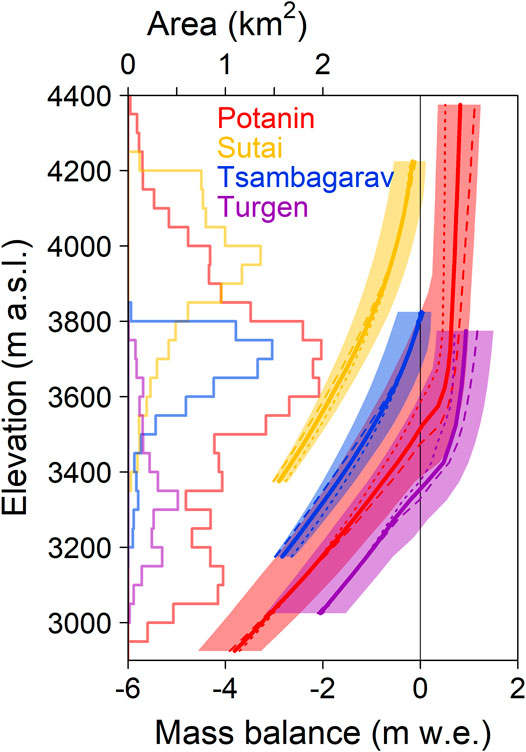
FIGURE 7. Hypsometry and long-term mass balance profiles for Potanin (red), Sutai (yellow), Tsambagarav (blue) and Turgen (purple) glaciers. The stepwise lines denote the hypsometry at 50-m elevation bands. The thick solid lines denote the mean long-term profiles (1980–2018), and the associated shaded regions represent the ranges for each profile based on the tested precipitation parameters. The dashed lines denote the mass balance profiles resulted from precipitation gradients changing between 0 and 90% km−1.
The time series of the summer (June, July, and August) mean temperature anomaly (dSMT), calibrated annual precipitation, mass balance, and ELA for the four studied glaciers is shown in Figure 8. The summer mean temperatures (SMTs), which should strongly affect the ablation, are obtained by weighting the temperatures with the hypsometry (Table 3). The SMT anomalies fluctuate in a similar manner among the glaciers and show a significant warming trend from the mid-1990s (Figure 8A). However, there is no significant trend in precipitation among the four glaciers, with contrasting fluctuations observed. Very arid conditions and similar fluctuations are observed for the Sutai and Tsambagarav glaciers, two ice-cap-like glaciers that are situated in the southeastern region, a moderate amount of precipitation is observed for Potanin Glacier, and a large amount of precipitation is observed for Turgen Glacier (Figure 8B). The glacier-wide mass balances of the four glaciers are summarized as follows: Sutai Glacier has been in a negative balance for the entire analysis period (1980–2018, yellow), whereas the other three glaciers have been in a negative mass balance since the mid-1990s (Figure 8C). The interannual variabilities in the mass balances are similar among the four glaciers (r = 0.70–0.93, p < 0.001, Supplementary Table S6). However, there are more complicated fluctuations among the glacier ELAs. The Sutai ELA exhibits a large degree of variability and different fluctuations compared with the Potanin and Turgen ELAs (r = 0.238, p = 0.145 and r = 0.478, p = 0.002, respectively, Supplementary Table S6), the Tsambagarav ELA exhibits an ascending trend, with a moderately similar fluctuation to those of the other glaciers (r = 0.63–0.82, p < 0.001, Supplementary Table S6), and the Potanin and Turgen ELAs exhibit similar fluctuations at similar elevations (r = 0.842, p < 0.001, Supplementary Table S6; Figure 8D).
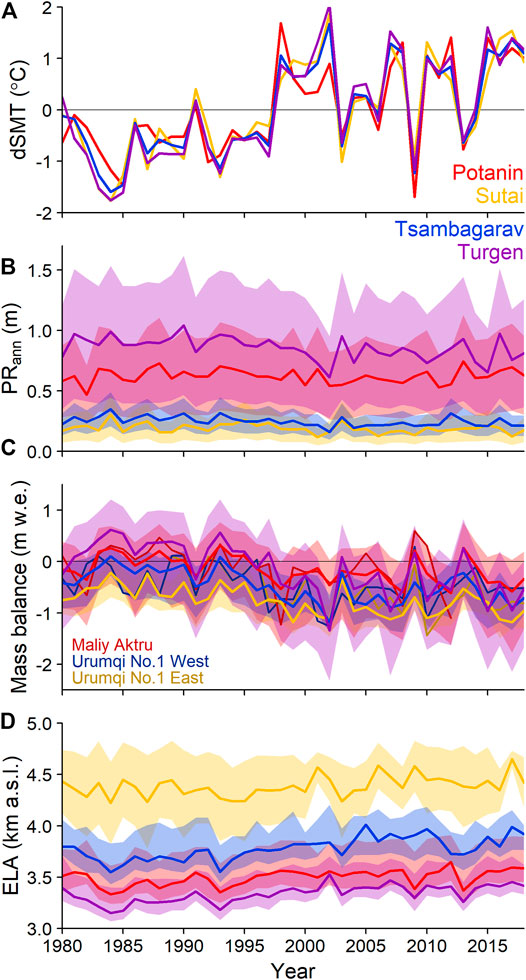
FIGURE 8. Time series of the (A) summer mean temperature anomaly (dSMT) relative to the long-term mean, (B) annual precipitation (PRann), (C) calculated glacier-wide mass balance, and (D) equilibrium line altitude (ELA) of Potanin (red), Sutai (yellow), Tsambagarav (blue) and Turgen (purple) glaciers. The shaded regions denote the ranges of the calculated values for the tested precipitation parameters. In-situ observational mass balances of Maliy Aktru in Russian Altai (dark red line) and of Urumqi No. 1 Glacier in Tienshan (West and East branches, dark blue and dark yellow) are also depicted in (C).
In Figure 8C, the in-situ observational mass balances of Maliy Aktru Glacier in Russian Altai (location shown in Figure 1A) and of Urumqi No. 1 Glacier in Tienshan (location not shown) are also depicted (WGMS, 2021). Interannual variabilities and long-term trends of the estimated and observed mass balances seem moderately consistent. The mass balance of Maliy Aktru Glacier highly correlates with that of Potanin Glacier (r = 0.84, p < 0.001, Supplementary Table S6) while those of Urumuqi No. 1 Glacier (two branches) moderately correlate to those of all four Mongolian Glaciers (r = 0.53–0.68, p < 0.001, Supplementary Table S6).
The correlation coefficients among the glacier-wide mass balance (B), area-weighted SMT, Pcal, and ELA are summarized in Table 3. There are significant correlations among each of the variables (p < 0.001), with the SMTs showing stronger correlations than Pcal. The weak to moderate negative correlations between SMT and Pcal suggest that warm conditions tend to coincide with more arid conditions (Table 3; Figures 8A,B).
3.4 Climatic Regime and Sensitivity
The climatic regimes for the present-day geometries of the four glaciers as a function of the area-weighted SMT and annual precipitation are shown in Figure 9. The calibrated SMT and annual precipitation values yield a negative mass balance for the Sutai and Tsambagarav glaciers (Figures 9B,C), whereas there is a large degree of scatter among the variables, which yield a positive mass balance for part of the Potanin and Turgen glaciers (Figures 9A,D).
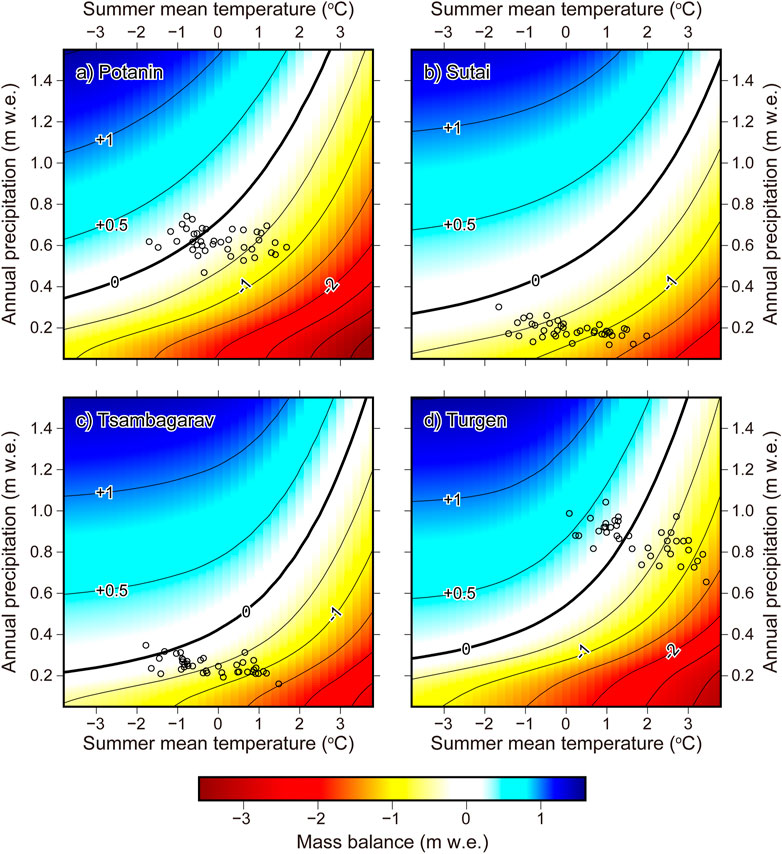
FIGURE 9. Climatic regime for the present-day geometry of (A) Potanin, (B) Sutai, (C) Tsambagarav and (D) Turgen glaciers for different summer mean air temperature (horizontal axes) and annual precipitation (vertical axes) combinations. Black open circles denote the long-term regime that was derived from the calibrated ERA5 data for the 1980–2018 period (39 years). Contour lines denote the glacier-wide mass balances in 0.5 m w. e. increments.
We further tested the mass-balance sensitivity by varying the air temperature (±0.5°C) and precipitation (±5%) during the simulations (Table 3). The sensitivity to temperature changes is summarized by determining the resultant negative mass balance due to 1°C warming, which ranges between −500 and −250 mm w. e. (dB/dT). However, the sensitivity to precipitation changes (dBdP10%) cannot be compared in such a simplistic manner because the degree of the precipitation change differs among both the glaciers and the years in the analysis period (dP10%). Therefore, we calculated the ratio between the mass-balance variations and increased precipitation (dBdP10%/dP10%) as an alternative sensitivity that indicates how much increased precipitation can enhance glacier mass gain. This ratio shows that a glacier receiving a moderate amount of precipitation (620–860 mm, Potanin and Turgen) will gain 1.6 to 2.0 times greater mass than that due to the increased precipitation. On the other hand, glaciers in arid environments (190–250 mm of annual precipitation, Sutai and Tsambagarav) have a much more sensitive response; 3.2 to 4.2 times greater mass gain than that due to the increased precipitation. The excess mass gain is caused by decreasing ablation with high albedo, which is kept by additional precipitation (Oerlemans and Fortuin, 1992; Fujita and Ageta, 2000). The contrasting responses suggest that the impact via albedo is highly affected by the wet or arid environments.
4. Discussion
4.1 Estimating the Mass Balance With Calibrated Precipitation
The precipitation calibration performed in this study is inevitably required owing to the limited observational coverage. However, it is likely that this calibration would still be necessary if there was a high degree of observational coverage, as the reanalysis product is unlikely to accurately represent accumulation-relevant processes, such as avalanching and wind scour/deposition. This is particularly evident across the Potanin and Turgen glaciers, where the stake locations were limited to the lower ablation zone, which led to the precipitation calibration largely affecting the glacier-wide mass-balance estimation by altering the degree of accumulation at the higher elevations. Nakazawa et al. (2015) analyzed the pollen concentrations and oxygen stable isotopes in a snow pit on Potanin Glacier and determined the annual accumulation during the 2007–2011 period. The pollen-derived annual accumulations fit the linear regression lines of the stake-derived mass balance well, even though the timing of the mass balance measurements (June 2007–June 2008) was not consistent (Figure 3). However, a simple extrapolation of the linear regression would yield an unrealistically large amount of accumulation at the higher elevations. Herren et al. (2013) drilled an ice core at the top of an ice-cap-like glacier (4,130 m a.s.l.) adjacent to Tsambagarav Glacier and estimated the long-term accumulation rates to be 335 mm w. e. (1999–2009) and 329 mm w. e. (1815–2009). Both amounts are larger than the calibrated annual accumulation values in this study (Table 3).
We examined the water balances among the four glaciers (Supplementary Figure S9, annual mean glacier-wide values averaged for the 1980–2018 period). In contrast to the largely different water input (rain and snow, ∼600 mm w. e.), the difference of outgoing components (discharge and evaporation) falls within 300 mm w.e., which suggests that the contrasting glacier-wide mass balances are attributed to the amount of precipitation. On the other hand, the evaporations of Sutai and Tsambagarav Glaciers significantly contribute to the mass loss from the glaciers. This suggests that the sublimation estimation could be important for estimating mass balance and precipitation parameter of the glaciers under the fairly arid climate.
We validated the estimated mass balances with the remotely sensed surface elevation change rate (dh/dt, m a−1) provided by Hugonnet et al. (2021). The in-situ observed mass balances from Russian Altai and Tienshan were also compared (Supplementary Figure S10). We find that the decadal mean mass balances are not perfect but moderately consistent with the remotely sensed dh/dt if the density uncertainties (600–900 kg m−3) are taken into account. However, the data for Sutai are not consistent. We think that both data, our simulation and the dh/dt, could have large uncertainties. The short observation period (3 years) for estimating precipitation parameter of Sutai Glacier could cause an uncertainty. On the other hand, the mismatch for the west branch of Urumuqi No. 1 Glacier should be due to the uncertainty in the remotely sensed dh/dt, which would be mainly caused by weak surface contrast hampering generation of digital elevation models. Different definitions and/or inconsistencies in the glacier outlines used in these studies could also affect the discrepancy. Supplementary Table S7 lists the water equivalent values of the estimated (Bcal) and observed (Bobs) mass balances against the remotely geodetic mass balance (Bgeo). For converting the dh/dt value to water equivalent, we used the density of 850 kg m−3 which was assumed in Hugonnet et al. (2021). The biases (Bgeo—Bcal or Bobs) suggest that the mass balance calculated in this study are estimated less negative than the geodetic mass balance (negative bias in Bgeo—Bcal) while the observed mass balance are more negative than the geodetic mass balance (positive bias in Bgeo—Bobs). Cross correlations support a plausibility of the reconstructed mass balance in this study (Supplementary Table S6). They also suggest that Maliy Aktru and Potanin Glaciers belong to the same climate (r = 0.84, p < 0.001, Supplementary Table S6) while the correlations between Maliy Aktru Glacier and those of other glaciers (except for Potanin) are less significant (r = 0.34–0.51, p < 0.05, Supplementary Table S6). Moderate correlations among the glaciers suggest that the climatic conditions are similar but gradually vary among these glaciers in Mongolia and Tieanshan (r = 0.53–0.68, p < 0.001, Supplementary Table S6).
We estimated the glacier-wide mass balances via linear regression (Breg; blue lines in Figures 3–6), simulations using the uncalibrated ERA5 precipitation (BERA5; red lines in Figures 3–6), and simulations using the calibrated precipitation (Bcal; black lines in Figures 3–6), and provided temporal change (Supplementary Figure S11) and scatter plots (Supplementary Figure S12) for comparison. The estimated annual mass balance with a single precipitation parameter determined for each glacier is also depicted in Supplementary Figure S11 (Bannual). The annual mass balance is not always consistent with the calibrated mass balance (Bcal) because the precipitation parameter varies (Figures 3–6). The glacier-wide mass balances of the four glaciers with the calibrated precipitation exhibit negative mass balances throughout the in situ observation period (since 2004; thick lines in Supplementary Figure S11), whereas those based on a linear regression occasionally exhibit a positive mass balance (dashed lines). The scatter plots of glacier-wide mass balance show that somewhat linear relationships approximately follow a 1:1 trend between the uncalibrated and calibrated precipitation results (orange circles in Supplementary Figure S12), whereas the linear-regression-based mass-balance results yielded rather scattered relationships (blue circles in Supplementary Figure S12). The comparison of these mass balances highlights inconsistencies in both the biases and trends of the calculated mass balances, which suggest that the glacier-wide mass balances of these four glaciers cannot be estimated without applying the calibrations performed in this study.
We assumed a precipitation gradient of 45% km−1 based on the elevation distribution of the precipitation parameter (Supplementary Figure S8), which is similar to a recently reported value for a Himalayan glacier (40 km−1, Sunako et al., 2019) but much larger than those used for global simulations (Marzeion et al., 2012; Huss and Hock, 2015). On the other hand, precipitation could decrease with elevation where the vapor was not supplied (Putkonen, 2004). Therefore, the uncertainty in the precipitation gradient was tested by varying it over the 0–90% km−1 range (Figure 7). The reference elevation (
4.2 Interannual Mass-Balance Variability
Significant correlations among the glacier-wide mass balance, SMT, and annual precipitation suggest that both parameters play key roles in the observed glacier mass-balance fluctuations. We multiplied the mass-balance sensitivity and interannual variabilities (standard deviation, σ) in SMT and annual precipitation to quantify the contributions of these two variables (Sunako et al., 2019). The variability in SMT exerts a greater effect on glacier mass balance than the variability in annual precipitation (dB/dT σT and dB/dP σP in Table 3, respectively), which range from 30 to 60% of the SMT influence. This difference could be attributed to the annual amount and/or interannual variability in precipitation. Furthermore, the temperature change could alter the melt amount in the ablation zone, while the precipitation change could alter the snow input in the accumulation zone. The bias induced by the changed variable could be further altered by the glacier hypsometry, which may vary considerably for top-heavy ice-cap and middle-heavy valley glaciers and would also alter the influence of these variables on the glacier-wide mass balance.
4.3 Equilibrium Conditions for the Glaciers
The zero isolines for the climate regimes and present-day hypsometries of the four glaciers (thick lines in Figure 9) indicate that the annual precipitation required to maintain equilibrium increases non-linearly with SMT, which is weighted by the hypsometry. The long-term means of the glacier-wide mass balances are negative for all of the glaciers (Table 3 and Figure 10A).
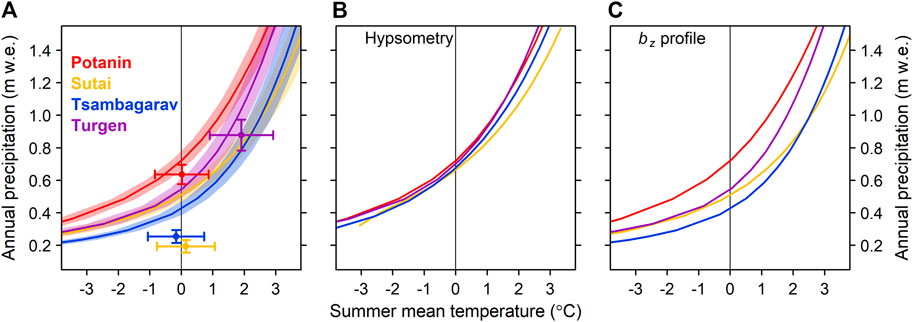
FIGURE 10. Balanced glacier-wide mass balances for Potanin (red), Sutai (yellow), Tsambagarav (blue) and Turgen (purple) glaciers. (A) Summary of Figure 9. Shaded regions denote the interannual variability of each zero-balance profile. Each point and its associated error bars represent the long-term mean and standard deviations of the calibrated ERA5 data shown in Figure 9, respectively. (B) Zero-balance isolines for the Potanin Glacier mass-balance profile with different hypsometries. (C) Zero-balance isolines for the individual mass balance profiles with the Potanin Glacier hypsometry.
The zero isolines appear along different sections of the four glaciers based on a range of SMT and annual precipitation conditions (Figure 10A). We tested the zero-isoline sensitivity by exchanging the hypsometry and mass-balance profile to reveal the potential causes of these differences. The zero isolines of the valley-type glaciers occur close to each other when different glacier hypsometries are used with the Potanin Glacier mass-balance profile (Figure 10B). The hypsometry of the valley-type Turgen Glacier yields almost the same zero isoline, while the ice-cap-like Sutai and Tsambagarav glaciers yield slightly different curves. Significantly different zero isolines are obtained when different mass-balance profiles are applied to the Potanin Glacier hypsometry (Figure 10C). These responses suggest that the climatic condition required for a given glacier to achieve steady state is not affected by the glacier geometry but rather significantly affected by the climatic condition itself.
4.4 Properties of the Mass-Balance Sensitivities
The gradient of the zero isoline is an indicator of glacier mass-balance sensitivity (Ohmura et al., 1992; Braithwaite, 2008; Sakai and Fujita, 2017). Glaciers in cold, arid climates are generally less sensitive to temperature changes than those in warm, wet climates based on this gradient (Figure 10A). The mass-balance sensitivity to temperature changes follows this trend for the four studied glaciers (Pcal and dB/dT in Table 3), whereby increased annual precipitation (Pcal) could result in a more negative mass balance for 1°C of warming (dB/dT). A comparison with similar numerical experiments (Oerlemans and Fortuin, 1992; Oerlemans, 2001) indicates that the mass balances of the four studied Mongolian glaciers are more sensitive to temperature changes than other glaciers worldwide. This can be attributed to seasonal precipitation variations, as summer accumulation is observed for the Mongolian glaciers while winter accumulation has been observed in previous studies (Fujita, 2008).
The mass-balance sensitivity to precipitation changes is more complicated than dB/dT (Table 3). The abovementioned ratio (dBdP10%/dP10%) suggests that an increase in precipitation results in a more positive balance than the increased accumulation, especially in arid conditions (Pcal and dBdP10%/dP10% in Table 3). This increased precipitation could increase accumulation and cover the glacier surface with high-albedo snow that would suppress snowmelt. This process seems effective in cold, arid conditions. However, the increased precipitation in warm, wet conditions, such as those observed across Turgen Glacier, does not appear to induce an enhanced albedo effect; this is due to rainfall in a warmer environment. A comparison of these results with previous studies (Oerlemans and Fortuin, 1992; Oerlemans, 2001) suggests that the impact of precipitation changes across Mongolian glaciers is greater than those for glaciers in other regions; this could be also due to summer accumulation (Fujita, 2008). Significant precipitation changes occur during the summer, when both albedo and solid/liquid phase changes alter the glacier mass-balance response.
5 Conclusion
This study reported the mass balances of four representative glaciers across the Altai Mountains in Mongolia, where in situ mass-balance observations have been obtained across the Potanin, Tsambagarav, Turgen, and Sutai glaciers since 2003, 2010, 2013, and 2015, respectively. We estimated the precipitation parameters for the ERA5 precipitation values, and then evaluated the glacier-wide mass balances using long-term mass-balance profiles that were calculated for the 1980–2018 period. Similar temporal fluctuations in the summer mean temperature anomaly and mass balance were observed, whereas the annual precipitation and ELA fluctuations were different among the glaciers. A cross-correlation analysis suggested that these variables were strongly correlated with each other. We also tested the mass-balance sensitivity to temperature and precipitation changes. The sensitivities were correlated with the amount of annual precipitation, whereby wetter conditions resulted in a more negative mass balance for the same degree of warming, and an increase in precipitation had a larger impact on the mass balance in arid conditions. Continuous monitoring of both the glacier-wide mass balance and local meteorological variables will contribute to improving our understanding of the state of mountain glaciers and their response to ongoing climate change across Mongolia. Furthermore, because the precipitation parameter and gradient could cause large uncertainty in the mass balance estimation, extending the stake network and precipitation observations via a weighing-type precipitation gauge would yield improved observations that possess lower uncertainties.
Data Availability Statement
The original contributions presented in the study are included in the article/Supplementary Material, further inquiries can be directed to the corresponding author.
Author Contributions
PK designed and conducted the fieldworks. KF and AS designed the analysis of the study. PK and KF conducted mass balance simulations and analyzed the data. All authors contributed to discussion and writing the manuscript.
Funding
This study is supported by JSPS-KAKENHI (Grant No. 20H00196) and the Transnational Doctoral Program for Leading Professionals in Asian Countries in Nagoya University.
Conflict of Interest
The authors declare that the research was conducted in the absence of any commercial or financial relationships that could be construed as a potential conflict of interest.
The handling editor declared a past co-authorship with the authors (KF).
Publisher’s Note
All claims expressed in this article are solely those of the authors and do not necessarily represent those of their affiliated organizations, or those of the publisher, the editors, and the reviewers. Any product that may be evaluated in this article, or claim that may be made by its manufacturer, is not guaranteed or endorsed by the publisher.
Acknowledgments
We express our sincere gratitude to Dr. G. Davaa, Dr. T. Kadota (deceased in 2015), and Dr. K. Konya who initiated and contributed to the development of glacier research in Mongolia. We express our thanks to T. Khash-Erdene, Y. Battsengel, N. Yura, B. Serjuma, Ts. Bulganbaatar, Yu. Amanbai, T. Ozat B. Baatarjav, B. Odkhuu, and D. Oyunbold for their dedicated supports in the field works. We thank Y. Sato and W. Chen for their contribution to the fieldwork in 2019.
Supplementary Material
The Supplementary Material for this article can be found online at: https://www.frontiersin.org/articles/10.3389/feart.2021.785306/full#supplementary-material
References
Antokhina, O. Y., Latysheva, I. V., and Mordvinov, V. I. (2019). A Cases Study of Mongolian Cyclogenesis during the July 2018 Blocking Events. Ges 12, 66–78. doi:10.24057/2071-9388-2019-14
Baast, P. (1998). Modern Glaciers of Mongolia. Ulaanbaatar: Institute of Meteorology and Hydrology. (in Russian).
Braithwaite, R. J. (2008). Temperature and Precipitation Climate at the Equilibrium-Line Altitude of Glaciers Expressed by the Degree-Day Factor for Melting Snow. J. Glaciol. 54, 437–444. doi:10.3189/002214308785836968
Carruthers, D. (1912). Exploration in north-west Mongolia and Dzungaria. Geographical J. 39, 521–551. doi:10.2307/1778190
Dagvadorj, D., Natsagdorj, L., Dorjpurev, J., and Namkhainyam, B. (2009). Mongolia Assessment Report on Climate Change 2009. Ulaanbaatar, Mongolia: Ministry of Nature, Environment and Tourism.
Dashdeleg, N., Evilkhaan, R., and Khishigsuren, P. (1983). Modern Glaciers in the Altai Mountains. Proc. Inst. Meteorol. Hydrol. 8, 121–126. (in Mongolian).
Davaa, G., Oyunbaatar, D., and Sugita, M. (2006). “Water of Mongolia,” in Environment Handbook of Mongolia, Editorial Committee of Environment Handbook of Mongolia (Ulaanbaatar, Mongolia), 42–54.
Fujita, K., and Ageta, Y. (2000). Effect of Summer Accumulation on Glacier Mass Balance on the Tibetan Plateau Revealed by Mass-Balance Model. J. Glaciol. 46, 244–252. doi:10.3189/172756500781832945
Fujita, K. (2008). Effect of Precipitation Seasonality on Climatic Sensitivity of Glacier Mass Balance. Earth Planet. Sci. Lett. 276, 14–19. doi:10.1016/j.epsl.2008.08.028
Fujita, K., and Sakai, A. (2014). Modelling Runoff from a Himalayan Debris-Covered Glacier. Hydrol. Earth Syst. Sci. 18, 2679–2694. doi:10.5194/hess-18-2679-2014
Fujita, K., Takeuchi, N., Nikitin, S. A., Surazakov, A. B., Okamoto, S., Aizen, V. B., et al. (2011). Favorable Climatic Regime for Maintaining the Present-Day Geometry of the Gregoriev Glacier, Inner Tien Shan. The Cryosphere 5, 539–549. doi:10.5194/tc-5-539-2011
Ganyushkin, D., Chistyakov, K., Volkov, I., Bantcev, D., Kunaeva, E., and Terekhov, A. (2017). Present Glaciers and Their Dynamics in the Arid Parts of the Altai Mountains. Geosciences 7, 117. doi:10.3390/geosciences7040117
Herren, P. A., Eichler, A., Machguth, H., Papinae, T., Tobler, L., Zapf, A., et al. (2013). The Onset of Neoglaciation 6000 Years Ago in Western Mongolia Revealed by an Ice Core from the Tsambagarav Mountain Range. Quatern. Sci. Rev. 69, 59–68. doi:10.1016/j.quascirev.2013.02.025
Hersbach, H., Bell, B., Berrisford, P., Hirahara, S., Horányi, A., Muñoz-Sabater, J., et al. (2020). The ERA5 Global Reanalysis. Q. J. Roy. Meteorol. Soc. 146, 1999–2049. doi:10.1002/qj.3803
Hugonnet, R., McNabb, R., Berthier, E., Menounos, B., Nuth, C., Girod, L., et al. (2021). Accelerated Global Glacier Mass Loss in the Early Twenty-First century. Nature 592 (7856), 726–731. doi:10.1038/s41586-021-03436-z
Huss, M., and Hock, R. (2015). A New Model for Global Glacier Change and Sea-Level Rise. Front. Earth Sci. 3, 54. doi:10.3389/feart.2015.00054
Kadota, T., and Davaa, G. (2007). Recent Glacier Variations in Mongolia. Ann. Glaciol. 46, 185–188. doi:10.3189/172756407782871675
Kadota, T., Gombo, D., Kalsan, P., Namgur, D., and Ohata, T. (2011). Glaciological Research in the Mongolian Altai, 2003-2009. Bull. Glacier Res. 29, 41–50. doi:10.5331/bgr.29.41
Kamp, U., McManigal, K. G., Dashtseren, A., and Walther, M. (2013). Documenting Glacial Changes between 1910, 1970, 1992 and 2010 in the Turgen Mountains, Mongolian Altai, Using Repeat Photographs, Topographic Maps, and Satellite Imagery. Geographical J. 179, 248–263. doi:10.1111/j.1475-4959.2012.00486.x
Kamp, U., and Pan, C. G. (2015). Inventory of Glaciers in Mongolia, Derived from Landsat Imagery from 1989 to 2011. Geografiska Annaler: Ser. A, Phys. Geogr. 97, 653–669. doi:10.1111/geoa.12105
Kondo, J. (Editor) (1994). Meteorology of the Water Environment-Water and Heat Balance of the Earth’s Surface (Tokyo: Asakura Shoten Press). (in Japanese).
Kondo, J., and Xu, J. (1997). Seasonal Variations in the Heat and Water Balances for Nonvegetated Surfaces. J. Appl. Meteorol. 36, 1676–1695. doi:10.1175/1520-0450(1997)036<1676:svitha>2.0.co;2
Konya, K., Kadota, T., Davaa, G., Yabuki, H., and Ohata, T. (2010). Meteorological and Ablation Features of Potanin Glacier, Mongolian Altai. Bull. Glacier Res. 28, 7–16. doi:10.5331/bgr.28.7
Konya, K., Kadota, T., Nakazawa, F., Davaa, G., Purevdagva, K., Yabuki, H., et al. (2013). Surface Mass Balance of the Potanin Glacier in the Mongolian Altai Mountains and Comparison with Russian Altai Glaciers in 2005, 2008, and 2009. Bull. Glacier Res. 31, 9–18. doi:10.5331/bgr.31.9
Marzeion, B., Jarosch, A. H., and Hofer, M. (2012). Past and Future Sea-Level Change from the Surface Mass Balance of Glaciers. The Cryosphere 6, 1295–1322. doi:10.5194/tc-6-1295-2012
Myagmarjav, D. B., and Davaa, G. (1999). Surface Water Of Mongolia. Ulaanbaatar, Mongolia: Interpress, Mongolian Academy of Sciences.
Nakazawa, F., Konya, K., Kadota, T., and Ohata, T. (2015). Depositional and Summer Snow Melting Features in 2007-2011 on the Upstream Side of Potanin Glacier, Mongolian Altai, Reconstructed by Pollen and Oxygen Isotope Analysis. Environ. Earth Sci. 74, 1851–1859. doi:10.1007/s12665-015-4436-1
Nuimura, T., Sakai, A., Taniguchi, K., Nagai, H., Lamsal, D., Tsutaki, S., et al. (2015). The GAMDAM Glacier Inventory: A Quality-Controlled Inventory of Asian Glaciers. The Cryosphere 9, 849–864. doi:10.5194/tc-9-849-2015
Oerlemans, J., and Fortuin, J. P. F. (1992). Sensitivity of Glaciers and Small Ice Caps to Greenhouse Warming. Science 258, 115–117. doi:10.1126/science.258.5079.115
Ohmura, A., Kasser, P., and Funk, M. (1992). Climate at the Equilibrium Line of Glaciers. J. Glaciol. 38, 397–411. doi:10.1017/s0022143000002276
Pan, C. G., Kamp, U., Munkhjargal, M., Halvorson, S. J., Dashtseren, A., and Walther, M. (2019). An Estimated Contribution of Glacier Runoff to Mongolia's Upper Khovd River Basin in the Altai Mountains. Mountain Res. Dev. 39, R12–R20. doi:10.1659/MRD-JOURNAL-D-18-00059.1
Pan, C. G., Pope, A., Kamp, U., Dashtseren, A., Walther, M., and Syromyatina, M. V. (2018). Glacier Recession in the Altai Mountains of Mongolia in 1990-2016. Geografiska Annaler: Ser. A, Phys. Geogr. 100, 185–203. doi:10.1080/04353676.2017.1407560
Potanin, G. N. (1883). Results of the 1879–1880 Travels for the Imperial Russian Geographical Society. Sankt Petersburg, Russia: Imperial Russian Geographical Society. (in Russian).
Putkonen, J. K. (2004). Continuous Snow and Rain Data at 500 to 4400 M Altitude Near Annapurna, Nepal, 1999-2001. Arctic, Antarctic, Alpine Res. 36, 244–248. doi:10.1657/1523-0430(2004)036[0244:csarda]2.0.co;2
Radić, V., Bliss, A., Beedlow, A. C., Hock, R., Miles, E., and Cogley, J. G. (2014). Regional and Global Projections of Twenty-First century Glacier Mass Changes in Response to Climate Scenarios from Global Climate Models. Clim. Dyn. 42, 37–58. doi:10.1007/s00382-013-1719-7
Rutkowski, E., and Slowanski, W. (1970). Zlodowacenie I Morfologia Dorzecza Charchira-Gol. Badan Polskich geologow za granica 226, 447–463. (in Polish).
Sakai, A. (2019). Brief Communication: Updated GAMDAM Glacier Inventory over High-Mountain Asia. The Cryosphere 13, 2043–2049. doi:10.5194/tc-13-2043-2019
Sakai, A., and Fujita, K. (2017). Contrasting Glacier Responses to Recent Climate Change in High-Mountain Asia. Sci. Rep. 7, 13717. doi:10.1038/s41598-017-14256-5
Sakai, A., Fujita, K., Nakawo, M., and Yao, T. (2009). Simplification of Heat Balance Calculation and its Application to the Glacier Runoff from the July 1st Glacier in Northwest China since the 1930s. Hydrol. Process. 23, 585–596. doi:10.1002/hyp.7187
Sakai, A., Fujita, K., Narama, C., Kubota, J., Nakawo, M., and Yao, T. (2010). Reconstructions of Annual Discharge and Equilibrium Line Altitude of Glaciers at Qilian Shan, Northwest China, from 1978 to 2002. Hydrol. Process. 24, 2798–2806. doi:10.1002/hyp.7700
Sakai, A., Nuimura, T., Fujita, K., Takenaka, S., Nagai, H., and Lamsal, D. (2015). Climate Regime of Asian Glaciers Revealed by GAMDAM Glacier Inventory. The Cryosphere 9, 865–880. doi:10.5194/tc-9-865-2015
Sato, T., Tsujimura, M., Yamanaka, T., Iwasaki, H., Sugimoto, A., Sugita, M., et al. (2007). Water Sources in Semiarid Northeast Asia as Revealed by Field Observations and Isotope Transport Model. J. Geophys. Res. 112, D17112. doi:10.1029/2006JD008321
Shea, J. M., and Moore, R. D. (2010). Prediction of Spatially Distributed Regional-Scale fields of Air Temperature and Vapor Pressure over Mountain Glaciers. J. Geophys. Res. 115, D23107. doi:10.1029/2010JD014351
Sunako, S., Fujita, K., Sakai, A., and Kayastha, R. B. (2019). Mass Balance of Trambau Glacier, Rolwaling Region, Nepal Himalaya: In-Situ Observations, Long-Term Reconstruction and Mass-Balance Sensitivity. J. Glaciol. 65, 605–616. doi:10.1017/jog.2019.37
Tachikawa, T., Hato, M., Kaku, M., and Iwasaki, A. (2011). “Characteristics of ASTER GDEM Version 2,” in 2011 IEEE International Geoscience and Remote Sensing Symposium (IGARSS), Vancouver, BC, 24–29 July 2011, 3657–3660. doi:10.1109/IGARSS.2011.6050017
Walther, M., Dashtseren, A., Kamp, U., Temujin, K., Meixner, F., Pan, C. G., et al. (2017). Glaciers, Permafrost and lake Levels at the Tsengel Khairkhan Massif, Mongolian Altai, during the Late Pleistocene and Holocene. Geosciences 7, 73. doi:10.3390/geosciences7030073
Keywords: glacier, mass balance, precipitation, in-situ observation, sensitivity
Citation: Khalzan P, Sakai A and Fujita K (2022) Mass Balance of Four Mongolian Glaciers: In-situ Measurements, Long-Term Reconstruction and Sensitivity Analysis. Front. Earth Sci. 9:785306. doi: 10.3389/feart.2021.785306
Received: 29 September 2021; Accepted: 16 December 2021;
Published: 25 January 2022.
Edited by:
Matthias Huss, ETH Zürich, SwitzerlandReviewed by:
James McPhee, University of Chile, ChileQiao Liu, Institute of Mountain Hazards and Environment (CAS), China
Joaquín M. C. Belart, University of Iceland, Iceland
Copyright © 2022 Khalzan, Sakai and Fujita. This is an open-access article distributed under the terms of the Creative Commons Attribution License (CC BY). The use, distribution or reproduction in other forums is permitted, provided the original author(s) and the copyright owner(s) are credited and that the original publication in this journal is cited, in accordance with accepted academic practice. No use, distribution or reproduction is permitted which does not comply with these terms.
*Correspondence: Koji Fujita, Y296eUBuYWdveWEtdS5qcA==