 Qiaomei Su
 Weiheng Tao
 Shiguang Mei1
95% of researchers rate our articles as excellent or good
Learn more about the work of our research integrity team to safeguard the quality of each article we publish.
Find out more
ORIGINAL RESEARCH article
Front. Earth Sci. , 09 December 2021
Sec. Geohazards and Georisks
Volume 9 - 2021 | https://doi.org/10.3389/feart.2021.781472
This article is part of the Research Topic Spatial Modelling and Failure Analysis of Natural and Engineering Disasters through Data-based Methods View all 42 articles
The main purpose of this study is to establish an effective landslide susceptibility zoning model and test whether underground mined areas and ground collapse in coal mine areas seriously affect the occurrence of landslides. Taking the Fenxi Coal Mine Area of Shanxi Province in China as the research area, landslide data has been investigated by the Shanxi Geological Environment Monitoring Center; adopting the 5-fold cross-validation method, and through Geostatistics analysis means the datasets of all non-landslides and landslides were divided into 80:20 proportions randomly for training and validating models. A set of 15 condition factors including terrain, geological, hydrological, land cover, and human engineering activity factors (distance to road, distance to mined area, ground collapse density) were selected as the evaluation indices to construct the susceptibility assessment model. Three machine learning algorithms for landslide susceptibility prediction (LSP) including C5.0 Decision Tree (C5.0), Random Forest (RF), and Support Vector Machine (SVM) have been selected and compared through the Areas under the Receiver Operating Characteristics (ROC) Curves (AUC), and several statistical estimates. The study revealed that for these three models the value range of prediction accuracies vary from 83.49 to 99.29% (in the training stage), and 62.26–73.58% (in the validation stage). In the two stages, AUCs are between 0.92 to 0.99 and 0.71 to 0.80 respectively. Using Jenks Natural Breaks algorithm, three LSPs levels are established as very low, low, medium, high, and very high probability of landslide by dividing the indices of the LSP. Compared with RF and SVM, C5.0 is considered better in five categories according to quantities and distribution of the landslides and their area percentage for different LSP zones. Four factors such as distance to road, lithology, profile curvature, and ground collapse density are the most suitable condition factors for LSP. The distance to mine area factor has a medium contribution and plays an obvious role in the occurrence of landslides in all the models. The result reveals that C5.0 possesses better prediction efficiency than RF and SVM, and underground mined area and ground collapse sifnigicantly affect significantly the occurrence of landslides in the Fenxi Coal Mine Area.
Mine geological hazards are a kind of man-made geological hazard and caused by geological processes and human engineering activities. Shanxi Province is a famous coal-producing area in China. Due to the overexploitation of coal resources in the area and the special topography of the environment, Shanxi Province has become one of the most developed/mined underground areas leading to frequent ground collapse, which often induced landslides. The geological hazards have the characteristics of wide distribution, significant influence, and prominent potential hazards (Uitto and Shaw, 2016; Su et al., 2020). It is very valuable to recognize and map those areas where landslides have a high probability of occurrence for land use plans and hazard controls (Su et al., 2017a; Huang et al., 2020a), and landslide susceptibility prediction (LSP) can efficiently achieve this purpose (Borrelli et al., 2018; Huang et al., 2021b). An LSP involves some important issues including the extraction of landslide-related environmental factors and the selection of the LSP model (Tien et al., 2015).
A lot of models such as types of expert-based models, statistical models, physically-based models, and machine learning models have been proposed for LSP (Guzzetti et al., 1999; Huang et al., 2017; Sezer et al., 2017; Reichenbach et al., 2018; Medina et al., 2021), and it is a crucial step to select an appropriate model (Marjanović et al., 2011; Tien et al., 2015; Huang et al., 2020b). Huang et al. (2020c) have compared these types of models and found that machine learning models can more accurately reflect the nonlinear relationships between landslide susceptibility indices; they ignore the complex physical processes involved in landslide initiation, and have been considered more accurate than other approaches. For the machine learning models, (Niu et al., 2012; Chang et al., 2020; Li et al., 2020) have used Support Vector Machine (SVM) to quantitatively predict landslide susceptibility and revealed SVM possesses better prediction efficiency, Li et al. (2014) has applied Random Forest (RF) to the analysis and evaluation of the susceptibility of regional landslides and believed that the method has a low sensitivity to noise and has good accuracy and stability. Nefeslioglu et al. (2010) have assessed the LSP of the metropolitan area in Istanbul, Turkey, by a decision tree; (Guo et al., 2021) present a C5.0 Decision Tree (C5.0) to generate regional landslide sensitivity map, and found the prediction accuracy of C5.0 is higher than that of traditional models.
Most of the existing studies have selected some condition factors closely related to landslide risk for susceptibility evaluation based on expert experience (Oliveira et al., 2015; Guo et al., 2021). The condition factors can be divided into terrain, geological, hydrological, land cover, and human engineering activity factors (Qin et al., 2013). To human engineering activity factors, Lee S, et al. (Lee et al., 2004; Ayalew and Yamagishi, 2005) have also quantified some human activity factors as distance to road, road network density, residential area, and building density. For geological hazards in coal mine areas, Su et al. (2017) has constructed the distance to mined area factor as a special human engineering activity factor, and compared several other methods in the evaluation of landslide sensitivity in the Huoxi Coal Mine Area, and found that SVM has higher prediction accuracy and the mining disturbance behavior has little contribution to all models (Su et al., 2017a).
It is very important to quantitatively compare the application results of various models for specific test areas and select the optimal model and appropriate factors for landslide sensitivity zoning (Martha et al., 2013; Chen et al., 2019; Huang et al., 2020a). In order to reveal whether the RF and C5.0 is more fit in a coal mine area, and better evaluate the impact of coal mining on landslides, and whether the mining disturbance such as the underground mined area and ground collapses have some contribution to the occurrence of mine geological hazards, this paper takes the Fenxi Coal Mining Area as the research area and uses three machine learning methods: RF, SVM, and C5.0 to model landslide sensitivity. Following this, a landslide sensitivity map of the Fenxi Coal Mine Area was drawn. ROC and AUC are used to evaluate and compare which model is more accurate and reliable for LSP. The study can provide decision support for mine geological hazards monitoring.
The Fenxi Coal Mine Area (36°41′20″–37°17′12″N, 111°22′08″–112°21′26″E) belongs to the Huoxi Coalfield andcovers approximately 2,800 km2 of land, located in the northern area of the Huoxi Coalfield in Shanxi province, China (Figure 1). The Huoxi Coalfield is one of the six large coalfields (Datong, Ningwu, Hedong, Xishan, Huoxi, Qinshui) of Shanxi province (Su et al., 2017a), which includes the Fenxi Coal Mine Area and Huozhou Coal Mine Area. The landform in the Fenxi Coal Mine Area is complex. The western part of Fenxi is a low mountain area on the east wing of Luliang Mountain. The western demarcate boundaries reach Shuangchi and the Nanyang borderline. The eastern part of Fenxi is the foothills of Huoshan Mountain, bounded by the Huoshan fault. The north part is the Jinzhong rift basin, the north boundaries reach the south of Fenyang City, and the southern border is the Shilin fault and the Fenhe River Valley with flat terrain passes through the middle of the research area. The Fenxi Coal Mine Area belongs to a warm temperate semi-arid continental monsoon climate, with an annual average temperature of 8.6°C and about 180 days in the frost-free period (Su et al., 2017a). Because it is located in the central inland area, the continental climate is relatively obvious, and the temperature difference between day and night is larger (Liu, 2015). The average annual precipitation is 634 mm and rainfall is often in July and August. Slope failures are triggered chiefly by intense and prolonged rainfall in this period (Su et al., 2017a).
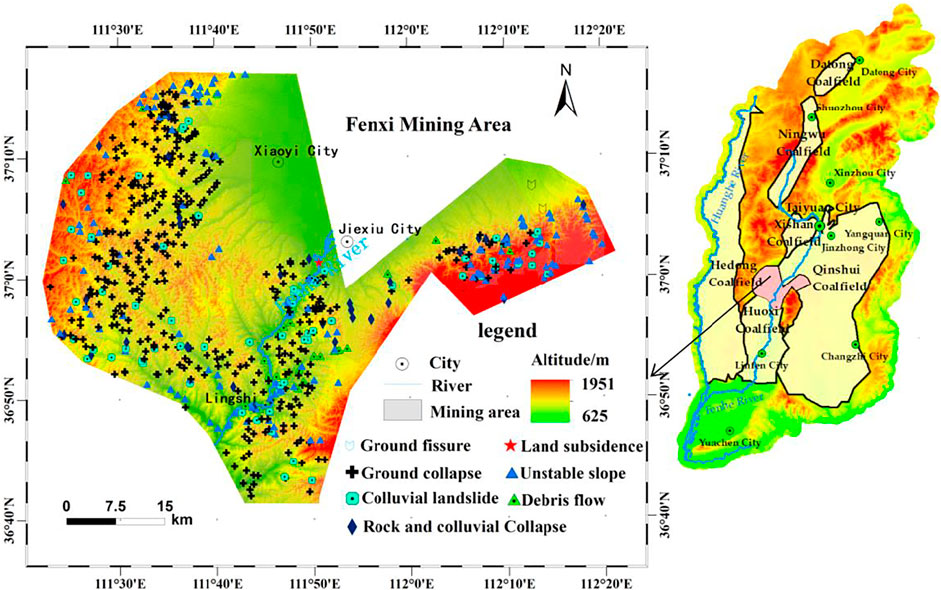
FIGURE 1. Location and geological hazards sites distribution of the study area.
The Fenxi Coal Mine Area is on the east margin of the Qi-Lv-He epsilon-type structure arc-fold and different forms of folds compose coal-bearing strata which belong to the Taiyuan Formation (Upper-Carboniferous System) and the Shanxi formation (Lower-Permian System). The average thicknesses of the Taiyuan and Shanxi Formations are about 90 m and 50 m, respectively, which are 810 m and 760 m below ground, respectively. There are abundant coal resources in the study area. The Fenxi Coal Mine Area is in underground mining regions, with blasting and so on. Due to over-exploitation, underground goaf is formed in the mining area, which can easily cause surface damage and form geological hazards. Mine slag includes coal gangue, waste slag, fly ash, and tailings, which damages the geological environment of the mining area and often induces mine geological hazards.
In the research, the main data materials collected are 1) Digital elevation model (ASTER-GDEM), 2) Remote Sensing (RS) images, 3) Geology hazards inventory, 4) Peak earthquake acceleration, 5) Average annual rainfall, 6) Geology map, 7) Road map, 8) Mine area map. Detailed information about the data materials is listed below in Table 1.
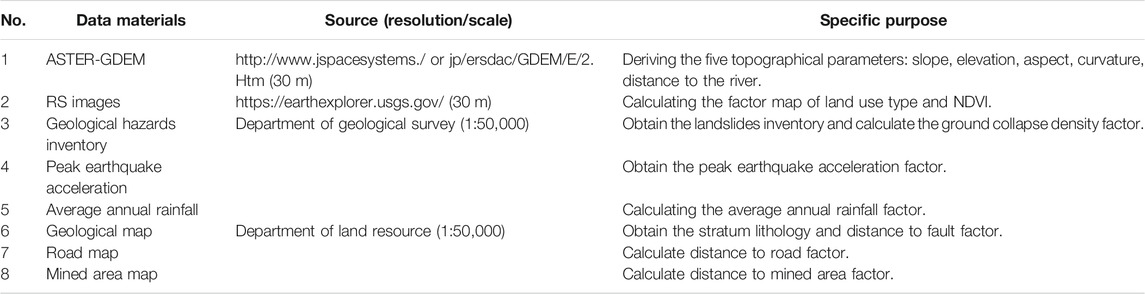
TABLE 1. The source and characteristics of the data materials.
Landslides are the movement of a mass of rock, debris, or Earth (soil) down a slope (Wu et al., 2012). The landslide in its widest sense includes colluvial landslides, rock and colluvial collapse, and debris flow, causing gravity erosion of the slope and valley (Qiu, 2012; Wang, 2012; Wu et al., 2012). The formation conditions, inducing factors and movement mechanisms of generalized landslides are diverse, changeable, and complex (Duan, 2010). These kinds of geological hazards are commonly linked in time and space in an interdependent whole, and have the characteristics of chain generation (Ma, 2011). Therefore, the evaluation of these hazards can be represented by a unified whole, and the generalized landslide concept is adopted in the landslide sensitivity evaluation of this paper.
In the Fenxi Coal Mine Area there are 639 geological hazards which include ground collapse (371), unstable slopes (132), colluvial landslides (69), rock and colluvial collapses (36), debris flows (28), ground fissures 2) and land subsidence 1) respectively, obtained from the Geological Environment Monitoring Center of Shanxi Provincial Natural Resources Department. All seven kinds of geological hazards data are converted into certain data formats and finally generate spatial point site data, and shown In Figure 1. The X, Y coordinates of the central point of the geological hazards represent their sites.
According to the definition of landslides mentioned previously, landslides in this paper are including colluvial landslides, rock and colluvial collapses, and debris flows. Unstable slope is a kind of geological hazard site that is prone to landslides. Thus the spatial distribution of landslides in the Fenxi Coal Mine Area with a total of 265 landslide sites has been mapped by applying the remote sensing (RS), geographic information system (GIS), and spatial data analysis method.
Geological hazards destroy the ecological environment, and their occurrence is affected by various internal and external dynamic forces. According to the geological, topographical and survey data of the Fenxi Coal Mine Area, as well as the existing expert experience (Chau et al., 2004; Peart et al., 2005; Domínguez-Cuesta et al., 2007; Xiang et al., 2010), the condition influence factors of landslide hazards including topography, geology, hydrology, land cover, and human engineering activities (Youssef and Pourghasemi, 2021) were selected to explore the mechanism and characteristics in the Fenxi Coal Mine Area. Topography factors are expressed by terrain factors: elevation, slope, aspect, and curvature (plane and profile curvature). ASTER-GDEM with 30 × 30 m spatial resolution was used to extract terrain factors. Geological structural factors include stratigraphic lithology, distance to fault, and peak earthquake acceleration. Many scholars have analyzed the influence of geological structure on the sensitivity of geological hazards and explored it. They believe that strata and strata lithology play a more significant role in ground hazards, and the distance to the fault also directly or indirectly affects them. Stratum lithology is the basis of geological hazards, and some geological hazards occur directly on the stratum. The Hydrology factors contain average annual rainfall and distance to river factors, while land cover factors involve land use type and NDVI. The three human engineering activities factors include distance to road, distance to mined area, and ground collapse density. In the Fenxi Coal Mine Area, the mining area accounts for 55.57% of the total area of the district, and the average density of ground collapse geological hazards points in the Fenxi Coal Mine Area is 0.07 (place/km2), so it is very necessary to construct distance to mined area and ground collapse density factors for the LSP. Through the condition factors and the comprehensive analysis of ArcGIS software, the relationship between landslide hazards and the geological ecological environment was studied, and its sensitivity was classified and evaluated. In the Fenxi Coal Mine Area the whole landslides condition factors involved are described and mapped below:
The east and west sides of the Fenxi Coal Mine Area are the Huoshan and Luliang Mountain Uplift Belt, and the middle is the Jinzhong rift basin, which is dominated by hills and low mountains. The middle and south sections are relatively flat, while the east and west sides are high mountains, which incline toward the Fenhe River Valley. The overall terrain is low in the middle and high on both sides of the east and west part, with great relief (Liu, 2015). According to ASTER GDEM with the resolution of 30 m, based on ArcGIS platform statistics, the elevation of the Fenxi Coal Mine Area is 625–1951m, with an average value of 987 m, as shown in Figure 2A.
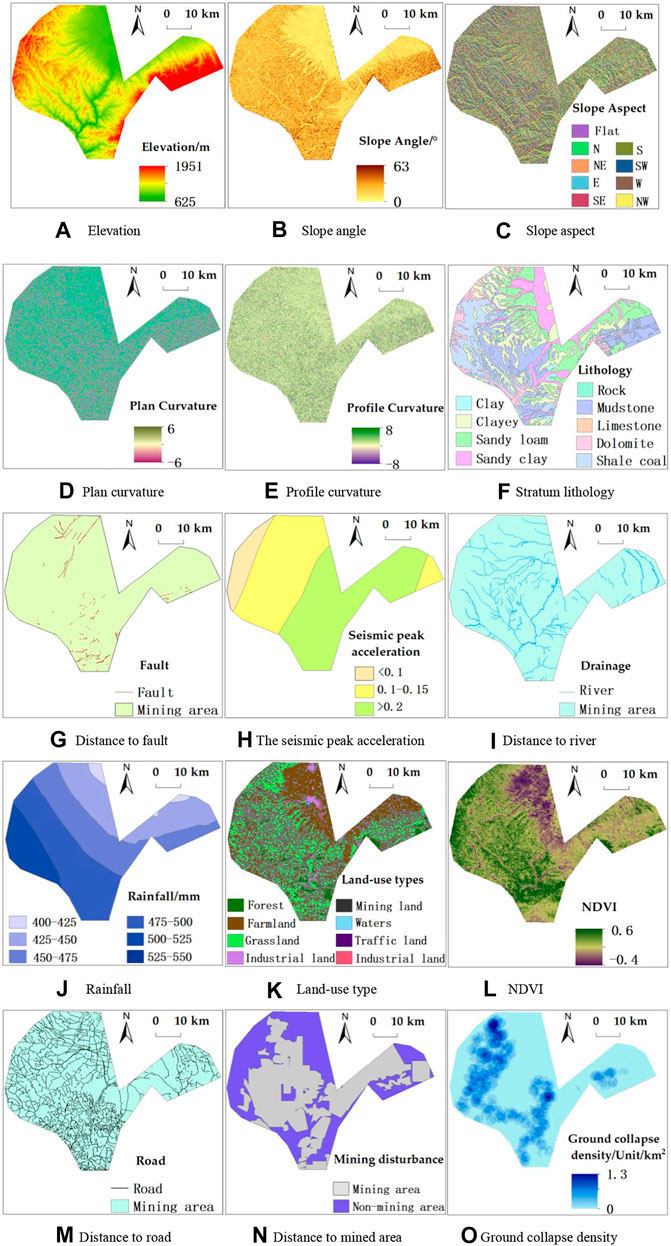
FIGURE 2. Landslide condition factors. (A) Elevation, (B) Slope angle, (C) Slope aspect, (D) Plan curvature, (E) Profile curvature, (F) Stratum lithology, (G) Distance to fault, (H) The seismic peak acceleration, (I) Distance to river, (J) Rainfall, (K) Land-use type, (L) NDVI, (M) Distance to road, (N) Distance to mined area, (O) Ground collapse density.
Slope is an important breeding factor of geological hazards in mining areas, which reflects the degree of slope inclination (Li et al., 2018; Huang et al., 2021a). On the one hand, with the increase of slope, the component force of gravity on the slope also increases. On the other hand, the greater the slope, the stronger the anti-weathering ability of slope rock (Guo, 2014). Using DEM data, extract the slope of the Fenxi Coal Mine Area to generate a slope map, as shown in Figure 2B.
Aspect is an important factor affecting the surface distribution of solar radiation (Alghamdi and Abdel-Mottaleb, 2021). The eastern, southern, southeastern, and southwestern sections in the northern hemisphere are sunny slopes, while the shady slopes are the western, northern, northeastern, and northwestern sections. Slope aspect affects regional surface evaporation, weathering degree of weathering crust, vegetation soil, and slope erosion. Based on the ArcGIS platform, the thematic map of aspect is generated through DEM, and the aspect is divided into nine levels: flat, true east, true west, true north, true south, northeast, southeast, northwest, and southwest, shown in Figure 2C.
The unevenness of the slope is reflected by the curvature of the surface. The greater the unevenness, the more uneven the force of the slope, and the more likely to occur geological hazards. Curvature is the second derivative of the surface. If the curvature is greater than zero, the pixel is convex upward; if the curvature is less than zero, the pixel is concave upward; if the curvature value is zero, the pixel is flat. Surface curvature can be divided into two types: 1) profile curvature, and 2) plane curvature. The former is the slope along the direction of the maximum slope, and the latter is the value perpendicular to the direction of the maximum slope. These two curvature maps of the Fenxi Coal Mine Area are extracted, as shown in Figures 2D,E.
Xiang et al. (2010) believe that the type of rock and the structure of the rock layer are significant factors that determine the Land slope stability. Lithology principally is reflected in the mechanical composition of the land surface weathering layer and sediments. We vectorized the 1:50,000 geological map of Shanxi province by counties, and reclassified it according to stratum age and the mechanical composition of the surface weathering layer, and divide the lithology of the Fenxi Coal Mine Area into 10 categories, respectively: 1) massive rock mass, 2) sandy shale, 3) limestone sandstone, 4) dolomite, 5) coal shale, 6) mudstone, 7) clay, 8) clay, 9) sub-sand, (10) sand. The formation lithology factor of the Fenxi Coal Mine Area is constructed, as shown in Figure 2F.
Faults significantly affect the stability of the surface of the mining area, and fault structures control the distribution, number, and scale of geological hazards. Based on the ArcGIS platform, the geological structure map of the 1:50,000 coal mine area in Shanxi Province is vectorized, and after correction, clipping, and stitching, the fault cites map is obtained. The fault cites map of the Fenxi Coal Mine Area is shown in Figure 2G.
The seismic peak acceleration represents the maximum absolute value of the acceleration of the Earth’s surface particle motion in the process of earthquake shaking. The larger the intensity of seismic peak acceleration, the easier the damage to the land surface. The seismic peak acceleration data is obtained from the Geological Environment Monitoring Center of Shanxi Provincial Natural Resources Department. The seismic peak acceleration factor constructed using ArcGIS is shown in Figure 2H.
Drainage networks were aquired from ASTER-GDEM with 30 × 30 m spatial resolution. The river system also has a great impact on the occurrence of surface hazards, mainly in that different water systems can weaken the resistance of rock fronts and increase the free face, thus affecting the stability of the surface slope. Based on DEM, the river network of the Fenxi Coal Mine Area is extracted, and the 1:50,000 river system map of Shanxi Province is vectorized. After correction, splicing, and cutting, the water system distribution map of Fenxi Coal Mine Area is obtained by combining the two methods, Figure 2I.
The results show that the ground deformation tends to be stable during a certain period of time after completion in the mine area under natural conditions, and the occurrence of landslides is significantly affected by average annual rainfall. According to the precipitation of ground stations in Shanxi Province within the past 30 years, the precipitation distribution map was obtained by using the ArcGIS platform and is shown in Figure 2J.
The area of mining disturbance in the Fenxi Coal Mine Area accounts for 37.31% of the total region. On the one hand, mining disturbance does great damage to the surface, affecting the occurrence of landslide hazards; and on the other hand, single land use modes, or the reuse of land and light maintenance, gradually reduces the land-use rate, accumulates over time, and part of the land is barren and bare, which provides certain conditions for the occurrence of geological hazards. In this paper, according to the second national land survey land classification (with 12 new categories), there were found 12 first class and 56 s class norms. Land-use types were interpreted, based on the Landsat TM images, and shown in Figure 2K.
Land subsidence damages the land cover and the habitat of forest and grassland vegetation. NDVI (normalized vegetation indices) are important indices reflecting the distribution of regional surface vegetation, which reflects the sensitivity of geological hazards. NDVI is calculated by using Landsat remote sensing images. The value of NDVI is distributed in (−1, 1). Zero represents rock or bare soil; negative value means water; a positive value means vegetation, and the larger the NDVI value, the higher the vegetation coverage (Su et al., 2017a; Huang et al., 2020c). The NDVI of the Fenxi Coal Mine Area is shown in Figure 2L.
The construction of road networks destroys surface morphology and stability, which is closely related to geological hazards and ecological environment sensitivity in mining areas. There are many Earth filling and excavation and culvert projects caused by road network construction, which easily leads to geological hazards. The 1:50,000 road traffic map of Shanxi Province is vectored, and the road distribution map is obtained through data processing. The distance from each landslide cites to its nearest road is extracted, and the road network density factor is constructed, as shown in Figure 2M.
Human mining engineering activities cause great disturbance and damage to the land surface. Based on the ArcGIS platform, the distance from the landslide sites to the mining area can be calculated. If the point falls inside the mined area, the distance is zero. The smaller the distance, the more vulnerable it is to mining area disturbance; on the contrary, the greater the distance the less it affected by mining disturbance. It can be shown in Figure 2N.
The density of ground collapse theoretically plays a decisive role in the occurrence of geological hazards. Ground collapse significantly affects the stability of the surface of the mining area. Based on the ArcGIS platform, the ground collapse density factor is obtained and shown in Fig. 2o.
RF is the most commonly used machine learning algorithm. It is a combined model that integrates multiple decision trees. By combining multiple weak classifiers, the final result is voted or averaged, which makes the result an overall model with high accuracy and generalization performance (Maxwell et al., 2020). The working principle of RF is shown in Figure 3. RF involves two concepts: 1) random sampling of data points; 2) Segmentation of nodes based on feature subsets. Random sampling: Each tree is trained on a sample of data points drawn at random. These samples are drawn repeatedly; random subset of features: At each node, the decision tree will consider segmentation based on a part of the feature, and the number of this part of the feature is the square root of all of the elements features. The best conditions for predictors are given by log2 (M+1), where M represents the number of inputs to the algorithm, and the mean square error is given by (Sevgen et al., 2019):
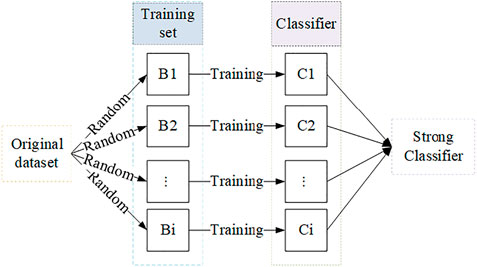
FIGURE 3. The working principle of RF.
Among them,
In the formula, S is any forest prediction value, while K is used to a single tree in RF, V2 is the result variable too. Through this algorithm, on the basis of determining the simple tree set and random predictor variables (Band et al., 2020), edge functions are defined.
C5.0 is a decision tree generation algorithm (Tobi and Duncan, 2019). It divides the sample data in the light of the field that provides the maximum attribute of information gain rate as a critical method to determine the arithmetic performance, at the same time cuts and merges the leaf nodes of the decision tree to raise the classification accuracy, ultimately determine the optimal threshold for every leaf. The core of the C5.0 algorithm is to select the characteristic variables of each branch by using the speed of information entropy reduction (Guo et al., 2021). The calculation formula of information entropy is as follows (Liu et al., 2017):
In the formula, ui (i = 1,2, …r) represents information, and P (ui) represents the probability of occurrence of information ui (i = 1,2, …r). When encountering too much or insufficient sample data, the C5.0 will automatically eliminate and adjust the weights to obtain an optimal decision tree model. C5.0 possess the advantages of high reliability, fast running speed, small memory usage, and high fault tolerance (Tobi and Ducan, 2019; Guo et al., 2021).
On the basis of the structural risk minimization principle and VC dimension theory of statistical learning theory, Vapnik et al. developed another machine learning method: SVM. The SVM model is based on a variety of basic functions to transform linearly inseparable data into high-dimensional space, and find hyperplanes in that high-dimensional space to realize linearly separable data patterns (Chen et al., 2016; Su et al., 2017b; Liu et al., 2017). SVM is able to turn a nonlinear problem into a linear one in a high-dimensional space by nonlinear transformation, and then find the optimal classification surface in the transformed high-dimensional space (Su et al., 2017a). SVM skillfully solves the problem of mapping from low dimensional input space to high dimensional feature space by introducing kernel function (Huang et al., 2018; Guo et al., 2021). In this paper, the kernel function of the Radial basis function (RBF) is used, and the algorithm formula is as below:
Among them, the γ of the kernel function is a parameter, which needs to be optimized when building the model to increase the fitting accuracy.
After determining the landslide inventory map and influencing factor maps (Guo et al., 2021), RF, SVM, and C5.0 algorithms were integrated to generate the final landslide susceptibility map. The Fenxi Coal Mine Area has a total of 265 landslides, which equaled to non-landslide sites that were built, and changed to pixels according to (Su et al., 2017a), for the sake of offering the essential knowledge about stable or unfavorable conditions of landslide occurrence (Guo et al., 2021). Through the Geostatistics analysis means the pixels are separated entirely into two parts in a random manner: 1) The first part contains 80% of the data, participated in the model training stage; 2) The second part is the validation data set, including the remaining 20% of the data adopted to verify these three models and confirm their accuracy.
The three measures of Accuracy, Specificity, and Sensitivity were adopted to evaluate the performance after applying a dataset of 5-fold cross-validation. Also, the Receiver Operating Characteristics (ROC) of each model were plotted, and the Areas Under the ROC Curves (AUC) of every model were obtained. An SLP map has the ability to predict future landslide sites. RF, SVM, and C5.0 are used to model and verify in the two (training and verification) phases, which can be adopted to obtain the landslide sensitivity of all pixels in the Fenxi Coal Mine Area. Jenks Natural Breaks algorithm was used to divide the probability range of landslide into five grades: very low, low, medium, high, and very high, and the three landslide susceptibility maps were obtained. Two aspects are listed below in which the landslide sensitivity zoning performance is able to be illustrated: 1) the surveyed landslide sites mainly scatter in the very high and high LSP zone, and it shows that the performance accuracy of the LSP zone is relatively higher; 2) the sites in the very high and high sensitivity zone in all the surveys ought to account for lower portion correspondingly, which can effectively reduce the redundancy and improve the LSP accuracy (Gokceoglu et al., 2005; Su et al., 2017a).
In this paper, a total of 15 condition factors–slope, elevation, aspect, curvature (plane curvature, profile curvature), lithology, distance to fault, peak earthquake acceleration, land use type, NDVI, distance to river, annual average rainfall, distance to road, distance to mined area and ground collapse density—were selected as the susceptibility evaluation indices. In order to ensure the objectivity and independence of the evaluation indices, we adopted the Pearson correlation analysis method to analyze the correlation among the 15 indicators. The SPSS software was used to import the matrix of 15 indices factors, and the correlation analysis was carried out. The correlation between condition factors is displayed in Table 2, and Table 2 indicates that all indices condition factors meet the requirements of independence. Combined with the actual situation of the Fenxi Coal Mine Area, we use these 15 condition factors as the evaluation indices of LSP in the study area.
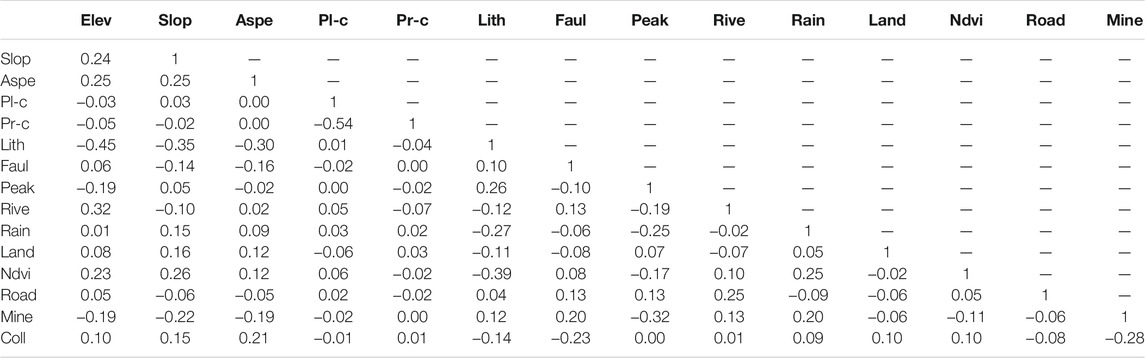
TABLE 2. The correlation between 15 condition factors.
(In Table 2 the 15 Landslide condition factors (elevation, slope, aspect, plan curvature, profile curvature, lithology, distance to fault, peak earthquake acceleration, distance to river, annual average rainfall, land use type, NDVI, distance to road, distance to mined area and ground collapse density) are shorted and represented by Elev, Slop, Aspe, Pl-c, Pr-c, Lith, Faul, Peak, Rive, Rain, Land, Ndvi, Road, Mine and Coll, respectively).
For the use of the three models, the input and output variables, the training and testing data are all determined as shown in Section 2.4. Cross-validation estimation of the predictive performance of a model is a crucial step in predictive modeling, and spatial cross-validation is recommended for spatial data, which may be subject to spatial autocorrelation (Su et al., 2017a), so the 5-fold cross-validation mean is adopted to calculate these LSP indices. In the training process of C5.0, the redundant nodes of the tree are pruned along with the tree growth, and the child nodes are created 10 times (Huang et al., 2020c), and the other model parameters are given as default. During the training process of RF, the maximum number of nodes is selected as 10,000, the maximum tree depth is set to 10, and the Minimum node size is 5. The model will stop building when the accuracy is no longer improved. All the parameters of SVM, Epsilon is 0.1, cost constant is 10, and RBF-γ, γ, and degree is 0.1, 3, respectively. Through cross-validation of the model, the confusion matrix was obtained, and based on this, the fitting accuracy is calculated and shown in Table 3.
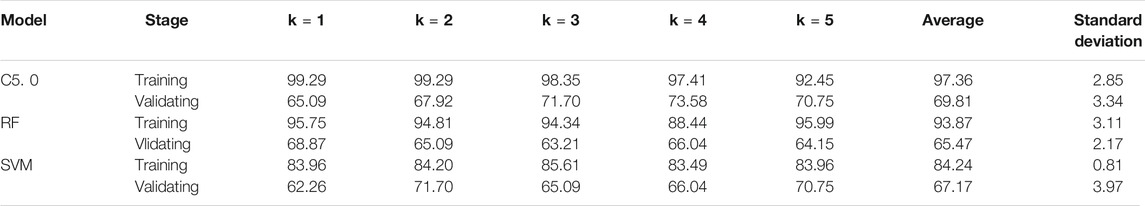
TABLE 3. Accuracy of cross-validation of the three LSP models.
Table 3 indicates that the average accuracy rates of C5.0, RF, and SVM in the training stage are 97.36, 93.87, and 84.24%, respectively. The standard deviation of C5.0, RF, and SVM in the training stage is 2.85, 3.11, and 0.81. C5.0 has the highest accuracy and lowest standard deviation in the training stage, so C5.0 performs better in the training stage. In the validating phase, their average accuracy rates were 69.81, 65.47, and 67.17%, respectively. Therefore, C5.0 has the highest accuracy rate in the verification phase, followed by the SVM accuracy rate, and the RF accuracy rate is the lowest. Their standard deviations in the validating phase are 3.34, 2.17, and 3.97, respectively. Obviously, RF has the lowest standard deviation in the verification phase, the standard deviation of C5.0 is the second, and the standard deviation of SVM is the highest.
Using a 5-fold cross-validation dataset for C5.0, RF, and SVM algorithms the ROC curves and their corresponding AUC values of the LSP are illustrated in Figure 4. The results of AUC in the training stage are shown in Figure 4A. The estimation of the training set is always too optimistic (Brenning, 2005; Su et al., 2017a). In accordance with AUC obtained from the training stage, wholly, the AUC indices values are indeed much higher than 0.9, indicating that C5.0, RF, and SVM algorithms completely obtain a successful performance. C5.0 has much better prediction results (0.99), compared with RF (0.96) and SVM (0.92). Prominently, C5.0 is much more successful than RF and SVM in the training stage. This means that the current three models (C5.0, RF, and SVM) are all capable of solving complex questions.
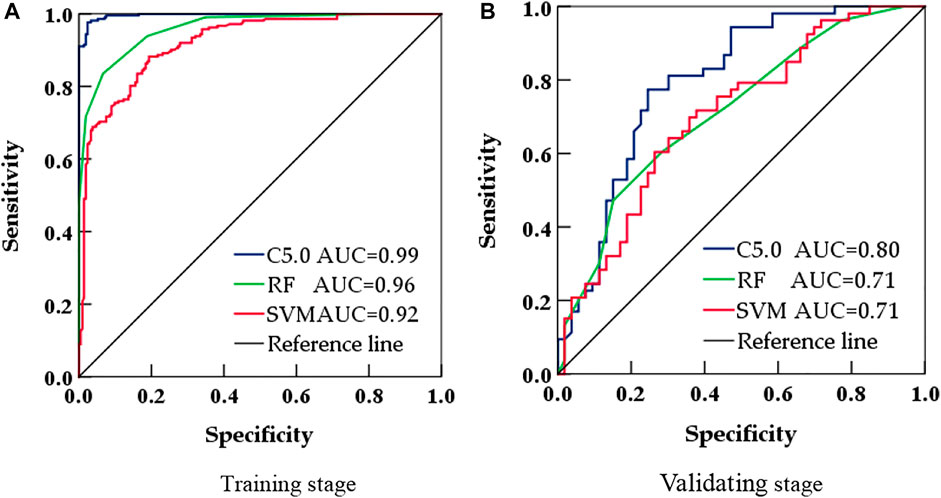
FIGURE 4. ROC and AUC for the three landslide susceptibility models in different models stages. (A) Training stage (B) Validating stage.
In the validating stage, the values of AUC correspondingly are illustrated in Figure 4B. The values of AUC range from 0.71 to 0.80 in the validating stage, the same as in the training stage, C5.0 is the highest one with 0.80, followed by RF, and SVM which both have the performance of 0.71. With an AUC value of more than 0.7, all the three models are capable of modeling the LSP in Fenxi Coal Mine Area in this study. Nonetheless, C5.0 appears to be more accurate and promising than RF and SVM.
The same as the fact that different models have different performances, different condition factors cannot make equal contributions to the evolution of regional landslides (Chen et al., 2018; Guo et al., 2021). The contributions of condition factors in the Fenxi Coal Mine Area are determined through calculating the mean value of relative contributions of each condition factor under all the three different models (Guo et al., 2021), and the contributions of each cross variable condition factors of these fitting algorithms are shown in Figure 5. Figure 5 mainly shows that the median contributions of the condition factors of the variables are classified as distance to road, lithology, profile curvature, ground collapse density, land use type, average annual rainfall, slope, distance to mined area, NDVI, aspect, peak earthquake acceleration, distance to river, and so on in descending contribution order, from highest to lowest. Hence, it is obvious that distance to road, stratum lithology, profile curvature, and ground collapse density are principal condition factors in the Fenxi Coal Mine Area for the evolutions of landslides. The distance to mined area factor has a medium contribution, and the ground collapse density factor plays an obvious role in the occurrence of geological hazards.
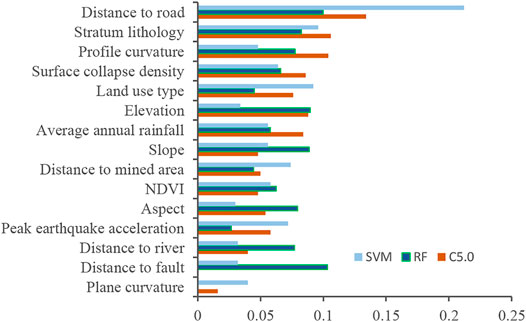
FIGURE 5. Contributions of each condition factors under different models.
The study area contains 3,597,447 pixels, converted into point type and mapped by ArcGIS platform. Using Jenks Natural Breaks algorithm, the three landslide susceptibility indices were reclassified into five susceptibility levels, shown in Table 4.
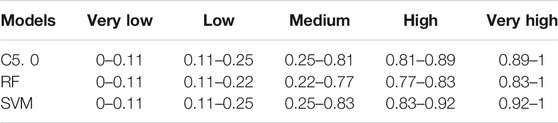
TABLE 4. Landslide susceptibility classification standards in Fenxi Mine Area.
In accordance with the Classification standard for susceptibility of landslides in the Fenxi Coal Mine Area, Three landslide sensitivity maps are obtained and converted into a grid format, and the three LSP maps using the three models are plotted in Figure 6. Figure 6 indicates that the three algorithms consistently have given the northern zone in the Fenxi Coal Mine Area a low or moderate record score of LSP. It is realistic that this zone has a lower elevation, and rarely slope instabilities generate in Jinzhong Basin. On the contrary, areas with the value of ground collapse density increasing was given higher scores in LSP in the Fenxi Coal Mine Area.
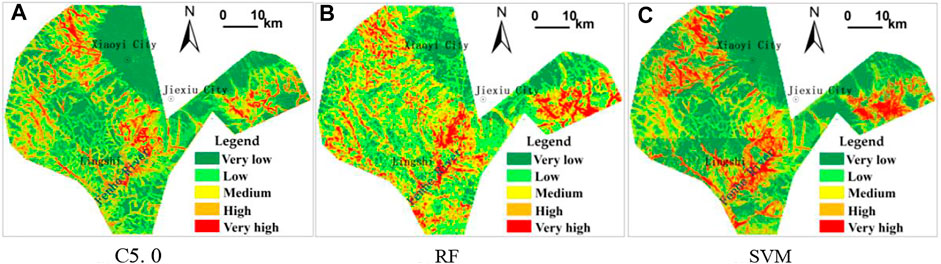
FIGURE 6. Landslide susceptibility maps using the three models. (A) C5. 0 (B) RF (C) SVM.
In order to compare the three spatial LSP indices, the characteristics of landslides distribution and their area percentage under each susceptibility range are shown in Table 5.

TABLE 5. Distributions of landslides and area percentage under different susceptibility standards.
It is obvious from Table 5 that regions with high and very high landslide sensitivity degrees possess 193, 173, and 176 landslide sites, when considering the area percentage, they also possess 17.55, 23.45, and 23.44% for the three models for C5.0, RF and SVM respectively in the Fenxi Coal Mine Area. Because the surveyed landslide hazard sites are mostly distributed in the regions with high landslide sensitivity, and in all the surveys, the sites with high sensitivity grades account for a very low portion (Gokceoglu et al., 2005; Su et al., 2017a). Therefore, C5.0 is the best one of all the models for the LSP algorithms.
The three typical models are widely used in many studies and can well embody the basic features of their corresponding model types (Huang et al., 2020c; Guo et al., 2021). RF has the advantages of fewer restrictions on variables involved in the evaluation, no need to consider the data scale and data distribution, high computational efficiency, high precision, and low debugging cost compared with other deep learning models (Su et al., 2017b; Huang et al., 2018). SVM is capable of solving some matters with nonlinearity, small samples, over-learning, dimensionality curse, and local minima, and has strong generalization ability. But for many types of problems, SVM is not efficient (Wu et al., 2014). C5.0 possesses some superiorities in modeling the SLP (Alkhasawneh et al., 2014; Park and Lee, 2014; Wu et al., 2014). C5.0 is a good model which is easy to understand and explain, training needs less data, and the modeling processes includes tree nodes grown, tree nodes pruning, feature selection, and so on. The other machine learning models usually need the advantages of data normalization, but the results of C5 are easy to overfit. Hence, through the comparison of these algorithms, C5.0 can be understood to have the ability to overcome the shortcomings that the traditional machine learning models possessed. The C5.0 is the best performing model of all machine learning algorithms.
The accuracy of the LSP model is decided by the algorithm selected (Su et al., 2017a; Huang et al., 2020c). The average precision of C5.0, RF, and SVM in the training stage is 97.36, 93.87, and 84.24% respectively, and their accuracy in the validating stage is 69.81, 65.47, and 67.17%. The standard deviation represents the stability of the model, and the higher the accuracy is, the more unstable the algorithm is. The standard deviation of C5.0, RF, and SVM is 2.85, 3.11, and 0.81 in the training stage, and is 3.34, 2.17, and 3.97 in the validating stage respectively. Therefore, C5.0 is more moderate for LSP in this study. The algorithms which have a high AUC value usually possess higher and more successful prediction indices (Huang et al., 2020c). The ROC curves of the three models suggest that in the training stage C5.0 has a much higher prediction index (0.99) than that of RF (0.96) and SVM (0.92), while in the validating stage C5.0 has the highest AUC with 0.80, followed by RF (0.71) and SVM (0.71), the same as the performance in the modeling process. Therefore, considering the fitting accuracy, ROC curve, and AUC value of C5.0, RF, and SVM, C5.0 is more moderate than the other two algorithms.
The attribute data in Fenxi Coal Mine Area is introduced into the C5.0, RF, and SVM to obtain the landslide susceptibility indices. Taking ArcGIS as the sensitivity indices, Jenks Natural Breaks algorithm is adopted to divide the probability indices of landslide into five levels that are very low, low, medium, high, and very high in indices ascending order, and three landslide sensitivity maps are obtained respectively. The results indicated C5.0, RF, and SVM have 193, 173 and 176 landslide sites in the high and very high areas respectively, and the high and very highly prone areas account for 17.55, 23.45, and 23.44% of the study area. Because the surveyed landslide hazard sites are mostly scattered in which the high and very high landslide sensitivity levels are distributed, while in the whole process, the landslide sites with high sensitivity levels account for a low proportion (Su et al., 2017a). Therefore, C5.0 is the best of all the models. These three models also predict that the landslide sensitivity of the Jinzhong basin is low or moderate, and predict that the landslide sensitivity of the mountains lies in the central section, the northeast part, and the east part of the Fenxi Coal Mine Area and increases with the value of ground collapse density.
Generally, the factors such as Topography, Hydrology, Geology, land use type, and so on are extensively accepted as condition factors in many LSP models (Su et al., 2017a). Distance to road and lithology factors are the two important factors. The highest contribution of distance to the road may be that the road constructions have changed the slope, formed an escarpment, and led to slope instability. On the mechanical properties, the lithology factor can affect the slope instability, it has been proved that the hard and dense rock mass hardly has any sensitivity to slope instability (Huang et al., 2020a).
Profile curvature and ground collapse density are relatively important factors too. The curvature factors represent the unevenness of the land surface. The greater the unevenness, the more uneven the force of the slope, and the more likely geological hazards are to occur (Su et al., 2017a). The ground collapse density theoretically plays an obvious role in the occurrence of geological hazards. Ground collapse significantly affects the stability of the surface of the mining area. Abundant ground collapse destroys the surface morphology and stability, which is closely related to geological hazards and ecological environment sensitivity in mining areas.
Then the factor contribution importance of the land use type, average annual rainfall, slope, distance to mined area, NDVI, Aspect, peak earthquake acceleration, and so on are listed in descending order of contribution. It is obvious that the distance to mined area factor has a medium contribution to all the models.
In the Fenxi Coal Mine Area the mining area accounts for 55.57% of the total area of the district, and the average density of ground collapse geological hazards points is 0.07 (place/km2). Mining disturbance has great damage to the surface, and ground collapse density affected the occurrence of geological hazards. Thus the mining disturbance such as the underground mined area and ground collapse have prominently affected the slope instability of the Fenxi Coal Mine Area.
This current research has contributed to comparison and evaluation of three machine learning methods (C5.0, RF, and SVM) for landslide susceptibility zoning in the Fenxi Coal Mine Area, so as to reveal whether the RF and C5.0 is more fit in a coal mine area, and better evaluate the impact of Mine on landslides, and whether the mining disturbance activities such as the underground mined area and ground collapses have some contribution to the occurrence of mine geological hazards. The Fenxi Coal Mine Area is used as the study area with 265 recorded landslides and 15 condition factors, the LSP maps of the Fenxi Coal Mine Area are zoned and plotted by the C5.0, RF, and SVM algorithms, respectively. The results show that C5.0 is more suitable for landslide susceptibility evaluation in Fenxi Coal Mining Area, through the analysis of AUC accuracy and landslides distribution features. Of all the 15 condition factors, the four factors including distance to road, lithology, profile curvature, and ground collapse density are the most suitable condition factors for LSP. The distance to mined area factor has a medium contribution to the three algorithms and plays an obvious role in the occurrence of geological hazards. Hence the mining disturbance activities have prominently affected the slope instability in Fenxi Coal Mine Area. In the zoning of LSP, landslides often include different types of sub-landslides as colluvial landslides, rock and colluvial collapse, debris flow, and unstable slope. To the characteristics of the different types of sub-landslides, further consideration is needed to reflect their different characteristics in the landslide susceptibility zones.
The data analyzed in this study is subject to the following licenses/restrictions: Classified datasets containing coordinates. Requests to access these datasets should be directed to JG, Z3Vvamw4MTk2QDE2My5jb20=.
QS performed the experiments, analyzed the data, drafted the manuscript, put forward the original idea and designed the methodology. WT and SM presented the suggestions and revised the manuscript. XZ and YY checked and improved the language of this manuscript. JG collected and pre-processed the data. All authors read and approved the final manuscript.
The work described in this paper was supported by the National key research and development program of China (Project No. 2018YFB0505402); the National Natural Science Foundation of China (Project No. 41771443, 42171424); Local Natural Science Foundation of Shanxi (Project No. 201901D111048, 201901D111098) and Soft Science Foundation of Shanxi (Project No. 2018041001-5), Department of Science and Technology of Shanxi Province.
The authors declare that the research was conducted in the absence of any commercial or financial relationships that could be construed as a potential conflict of interest.
All claims expressed in this article are solely those of the authors and do not necessarily represent those of their affiliated organizations, or those of the publisher, the editors and the reviewers. Any product that may be evaluated in this article, or claim that may be made by its manufacturer, is not guaranteed or endorsed by the publisher.
Al Tobi, A., and Duncan, I. (2019). Improving Intrusion Detection Model Prediction by Threshold Adaptation. Information 10, 159. doi:10.3390/info10050159
Alghamdi, M., and Abdel-Mottaleb, M. (2021). A Comparative Study of Deep Learning Models for Diagnosing Glaucoma from Fundus Images. IEEE Access 9, 23894–23906. doi:10.1109/access.2021.3056641
Alkhasawneh, M. S., Ngah, U. K., Tay, L. T., Mat Isa, N. A., and Al-Batah, M. S. (2014). Modeling and Testing Landslide Hazard Using Decision Tree. J. Appl. Math. 2014, 1–9. doi:10.1155/2014/929768
Ayalew, L., and Yamagishi, H. (2005). The Application of GIS-Based Logistic Regression for Landslide Susceptibility Mapping in the Kakuda-Yahiko Mountains, Central Japan. Geomorphology 65, 15–31. doi:10.1016/j.geomorph.2004.06.010
Band, S. S., Janizadeh, S., Chandra Pal, S., Saha, A., Chakrabortty, R., Shokri, M., et al. (2020). Novel Ensemble Approach of Deep Learning Neural Network (DLNN) Model and Particle Swarm Optimization (PSO) Algorithm for Prediction of Gully Erosion Susceptibility. Sensors 20, 5609. doi:10.3390/s20195609
Borrelli, L., Ciurleo, M., and Gullà, G. (2018). Correction to: Shallow Landslide Susceptibility Assessment in Granitic Rocks Using Gis-Based Statistical Methods: the Contribution of the Weathering Grade Map. Landslides 15, 1143–1144. doi:10.1007/s10346-018-0955-7
Brenning, A. (2005). Spatial Prediction Models for Landslide Hazards: Review, Comparison and Evaluation. Nat. Hazards Earth Syst. Sci. 5, 853–862. doi:10.5194/nhess-5-853-2005
Chang, Z., Du, Z., Zhang, F., Huang, F., Chen, J., Li, W., et al. (2020). Landslide Susceptibility Prediction Based on Remote Sensing Images and GIS: Comparisons of Supervised and Unsupervised Machine Learning Models. Remote Sensing 12, 502. doi:10.3390/rs12030502
Chau, K. T., Sze, Y. L., Fung, M. K., Wong, W. Y., Fong, E. L., and Chan, L. C. P. (2004). Landslide hazard Analysis for Hong Kong Using Landslide Inventory and GIS. Comput. Geosciences 30, 429–443. doi:10.1016/j.cageo.2003.08.013
Chen, W., Chai, H., Zhao, Z., Wang, Q., and Hong, H. (2016). Landslide Susceptibility Mapping Based on GIS and Support Vector Machine Models for the Qianyang County, China. Environ. Earth Sci. 75, 1–13. doi:10.1007/s12665-015-5093-0
Chen, W., Peng, J., Hong, H., Shahabi, H., Pradhan, B., Liu, J., et al. (2018). Landslide Susceptibility Modelling Using GIS-Based Machine Learning Techniques for Chongren County, Jiangxi Province, China. Sci. Total Environ. 626, 1121–1135. doi:10.1016/j.scitotenv.2018.01.124
Chen, W., Zhao, X., Shahabi, H., Shirzadi, A., Khosravi, K., Chai, H., et al. (2019). Spatial Prediction of Landslide Susceptibility by Combining Evidential Belief Function, Logistic Regression and Logistic Model Tree. Geocarto Int. 34, 1177–1201. doi:10.1080/10106049.2019.1588393
Domínguez-Cuesta, M. J., Jiménez-Sánchez, M., and Berrezueta, E. (2007). Landslides in the Central Coalfield (Cantabrian Mountains, NW Spain): Geomorphological Features, Conditioning Factors and Methodological Implications in Susceptibility Assessment. Geomorphology 89, 358–369. doi:10.1016/j.geomorph.2007.01.004
Duan, Z. (2010). Temporal and Spatial Distribution and Historical Evolution of Landslides on Both Sides of Jinghe River. Xi'an: Chang'an University.
Gokceoglu, C., Sonmez, H., Nefeslioglu, H. A., Duman, T. Y., and Can, T. (2005). The 17 March 2005 Kuzulu Landslide (Sivas, Turkey) and Landslide-Susceptibility Map of its Near Vicinity. Eng. Geology. 81, 65–83. doi:10.1016/j.enggeo.2005.07.011
Guo, F. (2014). Study on Risk Assessment of Metal Mines in Western Henan. Beijing: China University of Geosciences.
Guo, Z., Shi, Y., Huang, F., Fan, X., and Huang, J. (2021). Landslide Susceptibility Zonation Method Based on C5.0 Decision Tree and K-Means Cluster Algorithms to Improve the Efficiency of Risk Management. Geosci. Front. 12, 101249. doi:10.1016/j.gsf.2021.101249
Guzzetti, F., Carrara, A., Cardinali, M., and Reichenbach, P. (1999). Landslide hazard Evaluation: a Review of Current Techniques and Their Application in a Multi-Scale Study, Central Italy. Geomorphology 31, 181–216. doi:10.1016/s0169-555x(99)00078-1
Huang, F., Cao, Z., Guo, J., Jiang, S.-H., Li, S., and Guo, Z. (2020c). Comparisons of Heuristic, General Statistical and Machine Learning Models for Landslide Susceptibility Prediction and Mapping. Catena 191, 104580. doi:10.1016/j.catena.2020.104580
Huang, F., Cao, Z., Jiang, S.-H., Zhou, C., Huang, J., and Guo, Z. (2020b). Landslide Susceptibility Prediction Based on a Semi-supervised Multiple-Layer Perceptron Model. Landslides 17, 2919–2930. doi:10.1007/s10346-020-01473-9
Huang, F., Tao, S., Chang, Z., Huang, J., Fan, X., Jiang, S.-H., et al. (2021a). Efficient and Automatic Extraction of Slope Units Based on Multi-Scale Segmentation Method for Landslide Assessments. Landslides 18, 3715–3731. Landslides. doi:10.1007/s10346-021-01756-9
Huang, F., Ye, Z., Jiang, S.-H., Huang, J., Chang, Z., and Chen, J. (2021b). Uncertainty Study of Landslide Susceptibility Prediction Considering the Different Attribute Interval Numbers of Environmental Factors and Different Data-Based Models. Catena 202, 105250. doi:10.1016/j.catena.2021.105250
Huang, F., Yin, K., Huang, J., Gui, L., and Wang, P. (2017). Landslide Susceptibility Mapping Based on Self-Organizing-Map Network and Extreme Learning Machine. Eng. Geology. 223, 11–22. doi:10.1016/j.enggeo.2017.04.013
Huang, F., Yin, K., Jiang, S., Jinsong, H., and Zhongshan, C. (2018). Landslide Susceptibility Evaluation Based on Cluster Analysis and Support Vector Machine. J. rock Mech. Eng., 156–167. doi:10.13722/j.cnki.jrme.2017.0824
Huang, F., Zhang, J., Zhou, C., Wang, Y., Huang, J., and Zhu, L. (2020a). A Deep Learning Algorithm Using a Fully Connected Sparse Autoencoder Neural Network for Landslide Susceptibility Prediction. Landslides 17, 217–229. doi:10.1007/s10346-019-01274-9
Lee, S., Choi, J., and Min, K. (2004). Probabilistic Landslide hazard Mapping Using GIS and Remote Sensing Data at Boun, Korea. Int. J. Remote Sensing 25, 2037–2052. doi:10.1080/01431160310001618734
Li, T., Tian, Y., and Wu, L. (2014). Landslide hazard Zoning Based on Random forest Method. Geogr. Geogr. Inf. Sci. 30, 25–30.
Li, Y., Mei, H., Ren, X., Hu, X., and Li, M. (2018). Geological Disaster Susceptibility Evaluation Based on Certainty Factor and Support Vector Machine. J. Geo-Information Sci. 20, 1699–1709.
Li, Y., Sheng, Y., Chai, B., Zhang, W., Zhang, T., and Wang, J. (2020). Collapse Susceptibility Assessment Using a Support Vector Machine Compared with Back-Propagation and Radial Basis Function Neural Networks. Geomatics, Nat. Hazards Risk 11, 510–534. doi:10.1080/19475705.2020.1734101
Liu, D., Yang, F., and Wei, H. (2017). Vegetation Classification Method Based on C5. 0 Decision Tree with Multiple Classifiers. Acta graphics Sinica 38, 722–728.
Liu, J. (2015). Research on Prevention and Control of Geological Disasters in Shanxi Province. ShanXi: Shanxi science and Technology Press.
Ma, Q. (2011). Analysis on the Control of Formation Lithology and Geological Structure on the Development of Geological Disasters in Qinba Mountain Area. Xi'an: Chang'an University.
Marjanović, M., Kovačević, M., Bajat, B., and Voženílek, V. (2011). Landslide Susceptibility Assessment Using SVM Machine Learning Algorithm. Eng. Geology. 123, 225–234. doi:10.1016/j.enggeo.2011.09.006
Martha, T. R., van Westen, C. J., Kerle, N., Jetten, V., and Vinod Kumar, K. (2013). Landslide hazard and Risk Assessment Using Semi-automatically Created Landslide Inventories. Geomorphology 184, 139–150. doi:10.1016/j.geomorph.2012.12.001
Maxwell, A. E., Sharma, M., Kite, J. S., Donaldson, K. A., Thompson, J. A., Bell, M. L., et al. (2020). Slope Failure Prediction Using Random Forest Machine Learning and LiDAR in an Eroded Folded Mountain Belt. Remote Sensing 12, 486. doi:10.3390/rs12030486
Medina, V., Hürlimann, M., Guo, Z., Lloret, A., and Vaunat, J. (2021). Fast Physically-Based Model for Rainfall-Induced Landslide Susceptibility Assessment at Regional Scale. Catena 201, 105213. doi:10.1016/j.catena.2021.105213
Nefeslioglu, H. A., Sezer, E., Gokceoglu, C., Bozkir, A. S., and Duman, T. Y. (2010). Assessment of Landslide Susceptibility by Decision Trees in the Metropolitan Area of Istanbul, Turkey. Math. Probl. Eng. 2010, 1–15. doi:10.1155/2010/901095
Niu, R., Peng, L., and Ye, R. (2012). Landslide Susceptibility Evaluation of Support Vector Machine Based on Rough Set. J. Jilin Univ. (Geoscience Edition) 42, 430–439.
Oliveira, S. C., Zêzere, J. L., and Garcia, R. A. C. (2015). Structure and Characteristics of Landslide Input Data and Consequences on Landslide Susceptibility Assessment and Prediction Capability. Eng. Geology. Soc. Territory 2, 189–192. doi:10.1007/978-3-319-09057-3_24
Park, I., and Lee, S. (2014). Spatial Prediction of Landslide Susceptibility Using a Decision Tree Approach: a Case Study of the Pyeongchang Area, Korea. Int. J. Remote Sensing 35, 6089–6112. doi:10.1080/01431161.2014.943326
Peart, M. R., Ng, K. Y., and Zhang, D. D. (2005). Landslides and Sediment Delivery to a Drainage System: Some Observations from Hong Kong. J. Asian Earth Sci. 25, 821–836. doi:10.1016/j.jseaes.2004.08.004
Qin, C.-Z., Bao, L.-L., Zhu, A.-X., Wang, R.-X., and Hu, X.-M. (2013). Uncertainty Due to DEM Error in Landslide Susceptibility Mapping. Int. J. Geographical Inf. Sci. 27, 1364–1380. doi:10.1080/13658816.2013.770515
Qiu, H. (2012). Characteristics Analysis of Regional Landslide and Collapse Geological Hazards and its Sensitivity and Risk Assessment: A Case Study of Ningqiang County. Xi'an: Northwest University.
Reichenbach, P., Rossi, M., Malamud, B. D., Mihir, M., and Guzzetti, F. (2018). A Review of Statistically-Based Landslide Susceptibility Models. Earth-Science Rev. 180, 60–91. doi:10.1016/j.earscirev.2018.03.001
Sevgen, E., Kocaman, S., Nefeslioglu, H., and Gokceoglu, C. (2019). A Novel Performance Assessment Approach Using Photogrammetric Techniques for Landslide Susceptibility Mapping with Logistic Regression, ANN and Random Forest. Sensors 19, 3940. doi:10.3390/s19183940
Sezer, E. A., Nefeslioglu, H. A., and Osna, T. (2017). An Expert-Based Landslide Susceptibility Mapping (LSM) Module Developed for Netcad Architect Software. Comput. Geosciences 98, 26–37. doi:10.1016/j.cageo.2016.10.001
Su, Q., Tao, W., and Zhang, S. (2020). A Study on the Spatial Distribution Pattern of Geological Hazards Sites in the Ground Surface of Fenxi Coal Mining Area. J. Taiyuan Univ. Tech. 51, 649–654. doi:10.16355/j.cnki.issn1007-9432tyut.2020.05.004
Su, Q., Zhang, J., Zhao, S., Wang, L., Liu, J., and Guo, J. (2017a). Comparative Assessment of Three Nonlinear Approaches for Landslide Susceptibility Mapping in a Coal Mine Area. Ijgi 6, 228. doi:10.3390/ijgi6070228
Su, Q., Zhao, S., and Guo, J. (2017b). Numerical Modeling and Classification of Surface Landslide hazard Sensitivity in Huoxi Coal Mine. J. Geo-Information Sci. 19, 1613–1622.
Tien Bui, D., Tuan, T. A., Klempe, H., Pradhan, B., and Revhaug, I. (2015). Spatial Prediction Models for Shallow Landslide Hazards: A Comparative Assessment of the Efficacy of Support Vector Machines, Artificial Neural Networks, Kernel Logistic Regression, and Logistic Model Tree. Landslides 13, 361–378. doi:10.1007/s10346-015-0557-6
Uitto, J. I., and Shaw, R. (2016). Sustainable Development and Disaster Risk Reduction. Tokyo: Springer.
Wu, S., Shi, J., and Wang, T. (2012). Theory and Technology of Landslide Risk Assessment. BeiJing: Science Press.
Wu, X., Ren, F., and Niu, R. (2014). Landslide Susceptibility Assessment Using Object Mapping Units, Decision Tree, and Support Vector Machine Models in the Three Gorges of China. Environ. Earth Sci. 71, 4725–4738. doi:10.1007/s12665-013-2863-4
Xiang, L., Cui, P., and Zhang, J. (2010). Sensitivity Analysis on Influencing Factors of Earthquake Induced Landslide Disaster in Wenchuan County. J. Sichuan Univ. (Engineering Sci. Edition) 42, 105–112.
Keywords: Landslide susceptibility zoning, C5.0, RF, SVM, condition factors, Fenxi Coal Mine Area, Shanxi Province
Citation: Su Q, Tao W, Mei S, Zhang X, Li K, Su X, Guo J and Yang Y (2021) Landslide Susceptibility Zoning Using C5.0 Decision Tree, Random Forest, Support Vector Machine and Comparison of Their Performance in a Coal Mine Area. Front. Earth Sci. 9:781472. doi: 10.3389/feart.2021.781472
Received: 22 September 2021; Accepted: 15 November 2021;
Published: 09 December 2021.
Edited by:
Faming Huang, Nanchang University, ChinaReviewed by:
Zizheng Guo, China University of Geosciences, ChinaCopyright © 2021 Su, Tao, Mei, Zhang, Li, Su, Guo and Yang. This is an open-access article distributed under the terms of the Creative Commons Attribution License (CC BY). The use, distribution or reproduction in other forums is permitted, provided the original author(s) and the copyright owner(s) are credited and that the original publication in this journal is cited, in accordance with accepted academic practice. No use, distribution or reproduction is permitted which does not comply with these terms.
*Correspondence: Qiaomei Su, c3VxaWFvbWVpQHR5dXQuZWR1LmNu
Disclaimer: All claims expressed in this article are solely those of the authors and do not necessarily represent those of their affiliated organizations, or those of the publisher, the editors and the reviewers. Any product that may be evaluated in this article or claim that may be made by its manufacturer is not guaranteed or endorsed by the publisher.
Research integrity at Frontiers
Learn more about the work of our research integrity team to safeguard the quality of each article we publish.