 Jun Yu
 Qiang Zhang
 Weiya Xu3
 Rubin Wang
- 1School of Transportation and Civil Engineering, Nantong University, Nantong, China
- 2Research Institute of Geotechnical Engineering, China Institute of Water Resources and Hydropower Research, Beijing, China
- 3Research Institute of Geotechnical Engineering, Hohai University, Nanjing, China
We aim to understand the relaxation of columnar joint rock masses during the excavation process of the diversion tunnel of the Baihetan hydropower station. This paper inverts the deformation parameters of the relaxed columnar joint rock based on the displacement monitoring data, and introduces a relaxation factor to describe the deterioration degree of anisotropic parameters of the relaxed columnar jointed rock. The equivalent strain is proposed as the criterion of unloading relaxation and the threshold is also given. Based on the software Flac3d, a program for calculating anisotropic elastoplastic model is developed. The distribution of the relaxation zone of the diversion tunnel after excavation is simulated, and compared with the results of the acoustic detection to verify the correctness and rationality of the program, which can provide a necessary reference for the design and construction of hydropower projects.
Introduction
The unloading relaxation of rock masses is mainly caused by the redistribution of the surrounding stress. After excavation, the stress level in the area near the excavation face decreases sharply. In low-stress and tensile stress areas, the connectivity rate of the joints, fractures, and other geological structural surfaces in the rock mass increases, resulting in the deterioration of mechanical properties of the rock mass, which has a very negative impact on the stability and safety of rock engineering. Therefore, the study of excavation relaxation has become an important topic in the field of rock engineering (Nguyen et al., 2001; Martino et al., 2004; Ma et al., 2019), especially the determination of the unloading relaxation range caused by excavation as this can provide reference for the support treatment of the relaxed rock in engineering, which has important practical significance in engineering construction.
During the last several decades, researchers have studied the formation mechanism of unloading relaxation (Cai et al., 2004; Sayers, 1990), and found that the relaxation formation is microscopically manifested as the initiation, expansion, and penetration of joint fissures in rock. In terms of engineering practice, Lu et al. studied the spatial distribution of the unloading relaxation of the high rock slope of Xiluodu Hydropower station based on an acoustic emission test (Lu et al., 2013). Sheng et al. estimated the unloading relaxation zone in the slope of the Three Gorges ship lock and believed that the weakening degree of rock mass in the relaxation zone is between 23 and 45% (Sheng et al., 2002). Li et al. studied the evolution characteristics of rockburst in the diversion tunnels of the Jinping II hydropower station through in-situ experiments (Li et al., 2012). Qian et al. determined the scale and distribution of the unloading relaxation zone of surrounding rock in the diversion tunnel of the Jinping II hydropower station through numerical simulation (Qian et al., 2009).
In the above studies, the rock mass is considered as an isotropic material. However, during the excavation of the diversion tunnel of the Baihetan Hydropower Station, a large section of columnar jointed rock mass was encountered. This rock mass exhibits obvious anisotropic mechanical properties and had significant unloading relaxation characteristics after excavation. Therefore, the traditional isotropic constitutive models are no longer applicable to the rock mass. It is necessary to study the anisotropic constitutive model reflecting the relaxation characteristics of the columnar jointed rock mass, and then determine the scale of the relaxation area caused by excavation. Pietruszczak and Morz extended the classical isotropy criterion to anisotropy criterion through combining the spatial distribution of the strength parameters (Pietruszczak and Mroz, 2000; Pietruszczak et al., 2002), and established an anisotropic yield criterion based on the microstructure tensor, which is a satisfactory solution to the anisotropy problem. On this basis, the paper takes account of the excavation relaxation characteristics of the columnar jointed rock mass, introduces a relaxation factor to describe the deterioration degree of the anisotropy parameters of the relaxed rock mass, and establishes a relaxation criterion based on the equivalent strain. An anisotropic elastoplastic calculation model embedded in software Flac3d is also developed. The distribution of the unloading relaxation zone of the diversion tunnel of Baihetan Hydropower Station after excavation is simulated, and compared with the in-situ acoustic test results to verify the rationality of the model, which can provide necessary reference for the design and construction of hydropower engineering.
The Unloading Relaxation Characteristics of Columnar Jointed Rock Mass
Engineering Geology
The Baihetan Hydropower Station is located in Qiaojia County, Yunnan Province, China. It is a hydropower station of over ten million kilowatts similar to the Three Gorges Hydropower station or Xiluodu Hydropower Station. The bedrock of the dam site is dominated by cryptocrystalline basalt, almond basalt, and breccia lava, with hard lithology; the columnar joints are developed in some lithologic sections. The rock masses of the abutment and foundation of the dam are poorly developed, and the joints, interlayer, and intralayer dislocation zones are widely distributed. The faults with steep inclination and structural planes cut each other to form multiple wedges, which makes the rock masses exhibit high anisotropy characteristics (as shown in Figure 1), and affects the stability of the arch dam and safety of the underground cavern group.
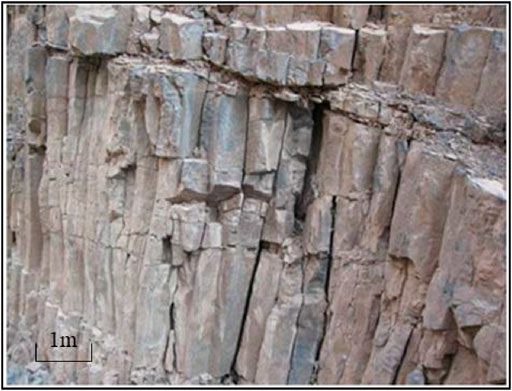
FIGURE 1. Anisotropy characteristics of columnar joints in dam site area.
As shown in Figure 2, the Baihetan hydropower station has five diversion tunnels; three diversion tunnels are set on the left bank and two diversion tunnels are set on the right bank, with elevations ranging from 574 to 605 m. The red part in Figure 2 represents the section of the diversion tunnel where the columnar jointed basalt is exposed, and its range is relatively large. Figure 3 shows the typical columnar jointed basalt in the diversion tunnel. The irregular columns have obvious contours, and their diameters range from 13 to 25 m. The inclination angle of columns are 70°–80°. The cross section of the columns are mainly irregular pentagonal and quadrilateral. Parallel cylindrical longitudinal micro-cracks are developed in the columns.
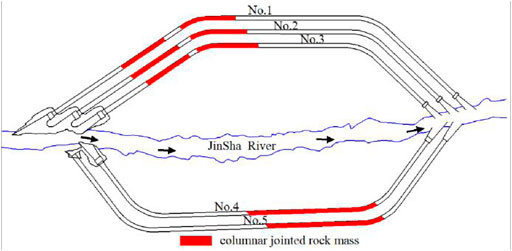
FIGURE 2. Distribution plan of diversion tunnel of Baihetan Hydropower Station.
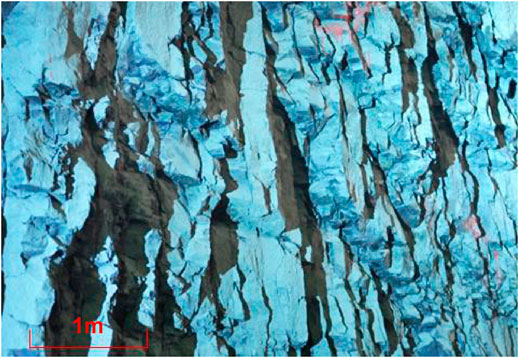
FIGURE 3. Columnar jointed basalt in diversion tunnel.
Relaxation Characteristics
In the excavation process of the diversion tunnels, unloading phenomena such as structural plane opening, tensile fracture, and rock mass relaxation appear in the surrounding rock near the excavation face. After the adjustment of the stress field near the surrounding rock, the original structural planes open and new fractures form. The widths of unloading fractures gradually decrease from the entrance to the end of the tunnel. Figure 4 shows the comparison of relaxation characteristics of the columnar jointed basalt in different sections of the diversion tunnel. The unloading fractures in the entrance section are generally developed, and are filled with gravel, rock debris, and secondary mud (Figure 4A). The relaxed columnar jointed basalt shown in Figure 4B maintains a certain integrity. Although most of the original columnar joints are open and the columns are relaxed, the rock blocks are still interlocking.
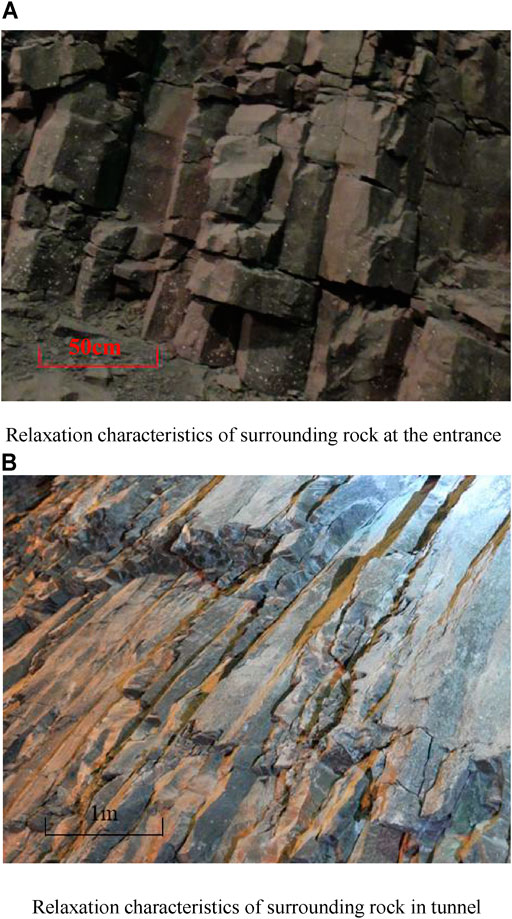
FIGURE 4. Comparison of surrounding rock relaxation characteristics in different sections of diversion tunnels. (A) Relaxation characteristics of surrounding rock at the entrance. (B) Relaxation characteristics of surrounding rock in tunnel.
Back Analysis of Anisotropic Deformation Parameters of Columnar Jointed Rock Mass
Analysis of Diversion Tunnel Displacement
Taking the No.4 diversion tunnel as an example, this paper studies the unloading relaxation of columnar jointed basalt. The diversion tunnel is excavated in three steps from top to bottom. The upper layer is 9 m high, the middle layer is 9 m high, and the lower layer is 6.2 m high. After excavation, the three-point displacement gauges are used to monitor the deformation of multiple sections of the tunnel. The deformation displacement was recorded at the depth of the hole at 0, 2, and 9 m to obtain excavation response characteristics of the columnar jointed rock mass. The layout and deformation of the multi-point displacement gauges of the 1 + 075 section are shown in Figure 5. After excavation, the top arch has the largest deformation, the shallow deformation reaches 40.71 mm, and the deep deformation also reaches 29.89 mm, which is due to the stress concentration at the arch top. The deformations of the side walls are smaller than that of the arch top. The displacement gauge in Myd6-2 measuring hole is damaged and has no recording. The displacements recorded by gauges in the remaining three monitoring holes show that the deformations of the side walls gradually decrease from shallow to deep. And the deformation of the lower part of the side wall is slightly higher than that of the upper part of the side wall, and the maximum deformation appears in the lower part of the left side wall, which is 22.38 mm.
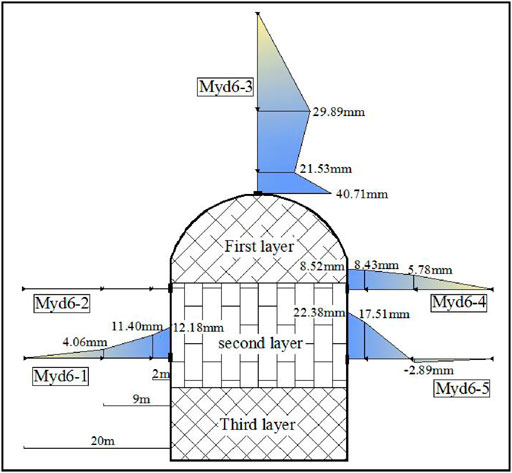
FIGURE 5. Schematic diagram of layering excavation of No.4 diversion tunnel.
Figure 6 shows the displacement sequence curves at the lower part of the left-side wall and the upper part of the right-side wall. At the initial stage after excavation, the deformation rate of the surrounding rock continues to increase. After a period of time, the deformation rate slows down and gradually becomes stable, and the deformation rate of the deep part is lower than that of the shallow part.
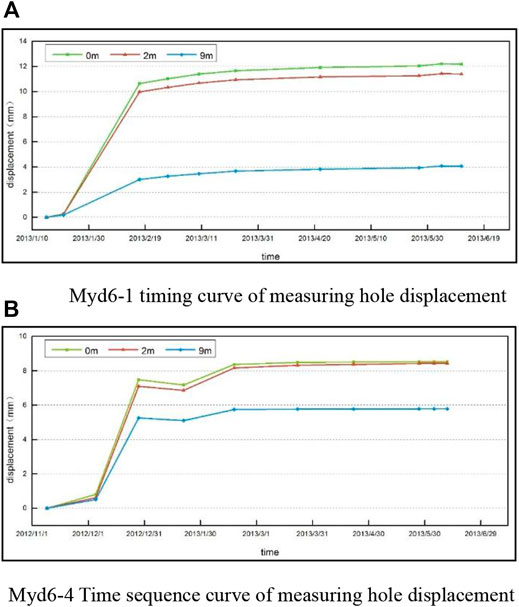
FIGURE 6. Displacement sequence curve. (A) Myd6-1 timing curve of measuring hole displacement. (B) Myd6-4 Time sequence curve of measuring hole displacement.
Back Analysis of Deformation Parameters
Considering the columnar jointed rock mass is a transverse isotropic material, the above rock mass has 10 mechanical parameters including deformation modulus
Through parameter sensitivity analysis, we know that deformation modulus
The displacements of monitoring points MYD6-1 (0 m), MYD6-1 (2 m), and MYD6-5 (2 m) were selected as the target values of the back analysis. The three parameter levels of 85, 60, and 35%, and the orthogonal sample scheme shown in Table 1 are considered. The anisotropic elastoplastic model is used for calculation, and the simulation results of the sample are shown in Table 2.
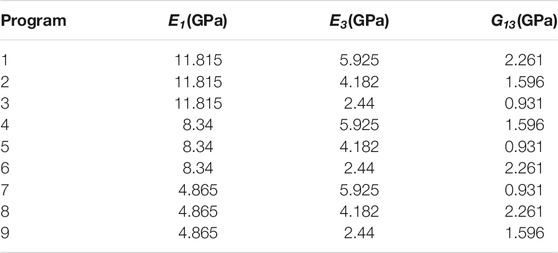
TABLE 1. Orthogonal sample scheme.
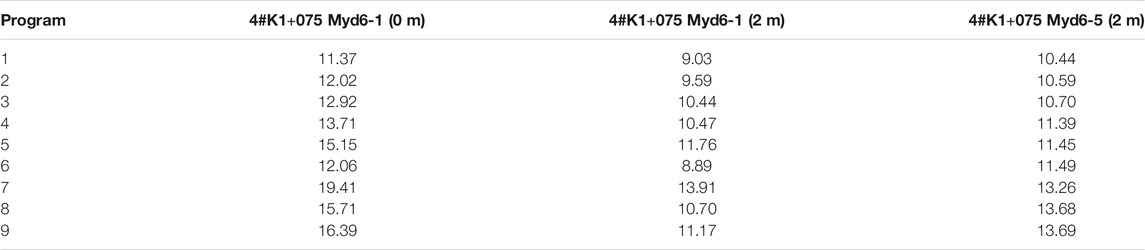
TABLE 2. The result of orthogonal sample scheme.
The mapping relationship between deformation modulus

TABLE 3. Invert the target value.
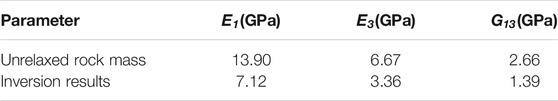
TABLE 4. The inversion results.
The results of back analysis are used as mechanical parameters to simulate the diversion tunnel deformation, and the calculated displacements of the monitor points are recorded and compared with the measured displacements (Figure 7). The comparison results show that the displacements calculated by the results of back analysis are very close to the measured displacements, therefore, the mechanical parameter obtained by back analysis can be used to determine the relaxation scale of the diversion tunnel.
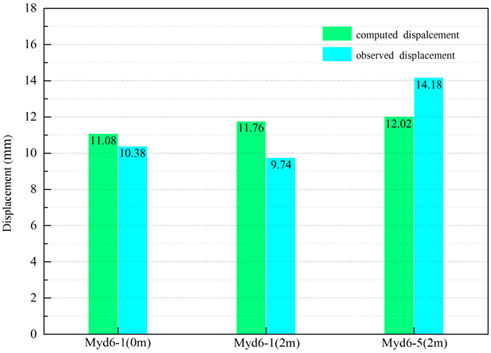
FIGURE 7. Comparison diagram of calculated displacement and detected displacement.
Anisotropic Elastoplastic Model Relaxation Criteria
Anisotropic Elastoplastic Model
Pietruszczak and Morz extended the classical isotropy criterion to anisotropy by combining the spatial distribution of strength parameters and established anisotropy yield criterion based on the microstructure tensor (Pietruszczak 1999). In the model, each scalar of anisotropy parameter is composed of mixed variables of stress and microstructure tensor. This means the physical and geometric properties of materials and the loading direction can be used as a set of variables.
The microstructure tensor
where
The generalized loading vector
The anisotropy parameter
Ning (2008) proposed an anisotropic yield criterion considering tensile strength:
where,
Anisotropic Tensile Stress Yields Function:
The shear potential function of columnar jointed rock mass corresponds to the non-associated flow rule, which can be expressed as:
where
The tensile potential function
The strain increment can be expressed as the superposition of elastic part and plastic part:
The incremental stress-strain relationship of the elastic part is:
where
The strain increment of the plastic part is determined by the plastic flow rule:
Therefore, the incremental stress-strain relationship can be expressed as:
Relaxation Factor
Relaxation factor is introduced to describe the deterioration of elastic modulus and shear modulus of rock after excavation. When the rock has no relaxation, the relaxation factor is 0; when the rock mass is completely relaxed, the relaxation factor is 1. For the rock in engineering, the relaxation factor is a value in the range of 0–1.
The expression of the degradation of elastic modulus used in this paper is
According to the aforementioned results of back analysis, the deformation modulus
where
Relaxation Evolution Equation
Considering the influence of the three principal stresses comprehensively, the relaxation threshold is defined from the respect of equivalent strain. When the equivalent strain of rock is greater than the relaxation threshold, the columnar jointed basalt enters the relaxation stage. The equivalent strain is
where
Three relaxation evolution equations can be obtained as:
There are four parameters (
Parameter Determination
The corresponding relaxation factor values can be calculated according to the results of back analysis in Table 4. Table 5 is the calculated relaxation factor, which can be used as the target value of back analysis of relaxation evolution equation.
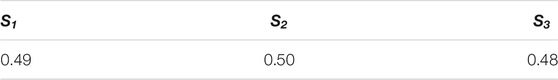
TABLE 5. Inversion target value of relaxation evolution equation.
Considering the limitation of the length of this paper, the specific method of back analysis is not given a more detailed description, although one can be found in the literature (Shen and Chun, 2014). The optimal results of back analysis are
The average value of three relaxation factors
Model Validation
Based on the development environment of Visual Studio 2008, the customized anisotropic elastic-plastic model with relaxation is compiled into dynamic link library DLL files for software Flac3d to call and execution.
Calculation Model and Parameters
Figure 8A shows the calculation model of the section of the diversion tunnel in software Flac3d; the model has a total of 14,012 elements. The model size is 60 m*60 m, and the ground stress was applied to the boundaries. The parameters of the model are shown in Table.6.
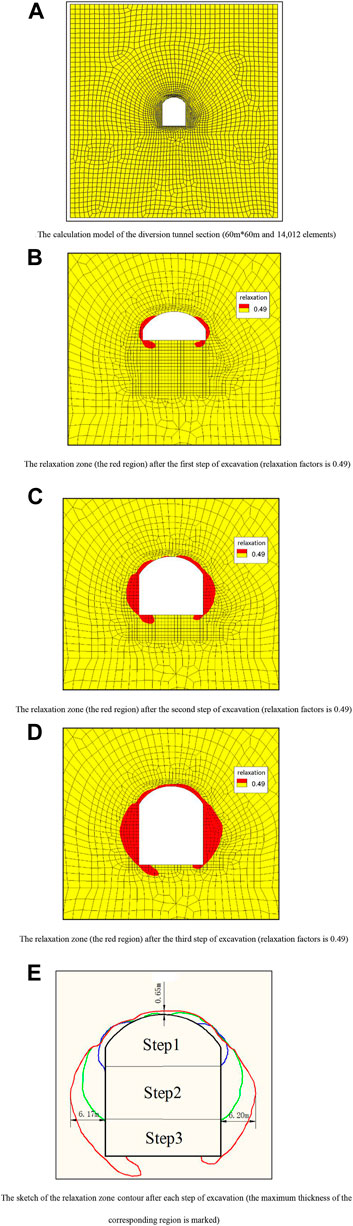
FIGURE 8. The calculation model and results. (A) The calculation model of the diversion tunnel section (60 m*60 m and 14,012 elements). (B) The relaxation zone (the red region) after the first step of excavation (relaxation factors is 0.49). (C) The relaxation zone (the red region) after the second step of excavation (relaxation factors is 0.49). (D) The relaxation zone (the red region) after the third step of excavation (relaxation factors is 0.49). (E) The sketch of the relaxation zone contour after each step of excavation (the maximum thickness of the corresponding region is marked).
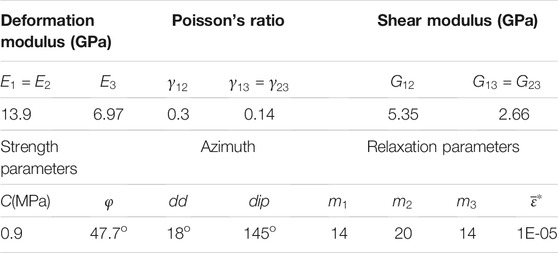
TABLE 6. Calculated parameters.
Result Analysis
Figures 8B–E shows the scale of the relaxation zone of the surrounding rock after each step of excavation. After the first step of excavation, the relaxation zone is mainly distributed on both sides of the top arch (Figure 8B). After the second step of excavation, a small amount of relaxation zone appears on the upper part of the top arch, and the relaxation zone on the side walls expands rapidly (Figure 8C). After the third step of excavation, the relaxation zone of the top arch expands into a through relaxation ring with a maximum thickness of 0.65 m. The relaxation zone on the side walls is thicker, and the thickest part of the relaxation zone appears in the middle of the side walls. The maximum thickness of the relaxation zone on the left-side wall is 6.17 m, and the maximum thickness of the relaxation zone on the right-side wall is 6.20 m (Figure 8D). Figure 8E shows the expansion process of the relaxation zone after each step of excavation. It can be seen that the next step of excavation will cause the expansion of the relaxation zone to induce by the previous step of excavation.
Table 7 shows the relaxation depth of the diversion tunnel obtained by acoustic detection. It can be found that the thickness and distribution of the relaxation zone calculated by the customized anisotropic elastic-plastic model are well consistent with the results of the in-situ acoustic detection, especially at the side walls. The simulation results are in good agreement with the measured values. At the top arch, the relaxation depth calculated by the model is slightly different from the measured values, but the error is still acceptable, and fully meets the engineering requirements.
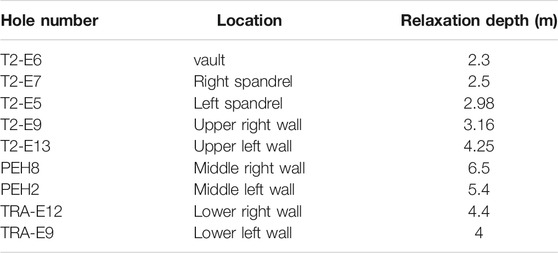
TABLE 7. Acoustic detection results of the relaxation depth of the diversion tunnel.
Conclusion
1) After the excavation of the diversion tunnel, the relaxation zone is mainly distributed on the side walls of the tunnel, especially in the middle of the side wall. The maximum thickness of the relaxation zone is about 6.20 m; the side walls of the tunnel need to be paid attention to in the subsequent support treatment.
2) The thickness and distribution of the relaxation zone calculated by the customized anisotropic elastic-plastic model are well consistent with the results of the in-situ acoustic detection. At the top arch, the relaxation depth calculated by the model is slightly different from the measured values, but the error is still acceptable, and fully meets the engineering requirements.
3) According to the results of parameter sensitivity analysis, this paper believes that the relaxation of rock is mainly due to the deterioration of deformation parameters, and the deterioration of the strength parameters is ignored. In further research, the deterioration of the strength parameters can be verified according to in-situ experiments.
Data Availability Statement
The raw data supporting the conclusion of this article will be made available by the authors, without undue reservation.
Author Contributions
JY was responsible for defining the research aims, collating and reviewing the literature and previous research for the discussion, conceptualizing the article structure, writing the manuscript draft, and figure conception and execution. QZ, WY, and RW jointly agreed upon the research objectives; provided supportive analyses and interpretations; and contributed, reviewed, and edited text. HZ contributed and edited text.
Funding
This work is financially supported by the National Key R&D Program of China(No.2018YFC0407006), Natural Sciences Fund for Colleges and Universities in Jiangsu Province (Grant Nos. 20KJB560036), National Natural Science Foundation of China-Yalong River Joint Fund Key Project (No. U1965204), Scientific Research Project of China Institute of Water Resources and Hydropower Research (No.GE110145B0022021) and the Nantong Science and Technology Plan Project (Grant Nos. JC2020122).
Conflict of Interest
The authors declare that the research was conducted in the absence of any commercial or financial relationships that could be construed as a potential conflict of interest.
Publisher’s Note
All claims expressed in this article are solely those of the authors and do not necessarily represent those of their affiliated organizations, or those of the publisher, the editors and the reviewers. Any product that may be evaluated in this article, or claim that may be made by its manufacturer, is not guaranteed or endorsed by the publisher.
References
Cai, M., Kaiser, P. K., Tasaka, Y., Maejima, T., Morioka, H., Minami, M., et al. (2004). Generalized Crack Initiation and Crack Damage Stress Thresholds of Brittle Rock Masses Near Underground Excavations. Int. J. Rock Mech. Mining Sci. 41 (5), 833–847. doi:10.1016/j.ijrmms.2004.02.001
Eberhardt, E., Stead, D., and Stimpson, B. (1999). Quantifying Progressive Pre-peak Brittle Fracture Damage in Rock during Uniaxial Compression. Int. J. Rock Mech. Mining Sci. 36 (3), 361–380. doi:10.1016/s0148-9062(99)00019-4
Li, S., Feng, X.-T., Li, Z., Chen, B., Zhang, C., and Zhou, H. (2012). In Situ monitoring of Rockburst Nucleation and Evolution in the Deeply Buried Tunnels of Jinping II Hydropower Station. Eng. Geol. 137-138, 85–96. doi:10.1016/j.enggeo.2012.03.010
Lu, W.-B., Hu, Y.-G., Yang, J.-H., Chen, M., and Yan, P. (2013). Spatial Distribution of Excavation Induced Damage Zone of High Rock Slope. Int. J. Rock Mech. Mining Sci. 64 (6), 181–191. doi:10.1016/j.ijrmms.2013.08.030
Ma, J., Yin, P., Huang, L., and Liang, Y. (2019). The Application of Distinct Lattice spring Model to Zonal Disintegration within Deep Rock Masses. Tunnel. Undergr. Space Techn. 90 (AUG), 144–161. doi:10.1016/j.tust.2019.04.017
Martino, J. B., and Chandler, N. A. (2004). Excavation-induced Damage Studies at the Underground Research Laboratory. Int. J. Rock Mech. Mining Sci. 41 (8), 1413–1426. doi:10.1016/j.ijrmms.2004.09.010
Nguyen, T. S., Borgesson, L., Chijimatsu, M., Rutqvist, J., Fujita, T., Hernelind, J., et al. (2001). Hydro-mechanical Response of a Fractured Granitic Rock Mass to Excavation of a Test Pit - the Kamaishi Mine experiment in Japan. Int. J. Rock Mech. Mining Sci. 38, 79. doi:10.1016/S1365-1609(00)00066-6
Ning, Y. (2008). Study on Equivalent Anisotropic Strength and Yield Criterion of Columnar Jointed Rock Mass. Nanjing, China: Hohai University.
Pietruszczak, S., Lydzba, D., and Shao, J. F. (2002). Modelling of Inherent Anisotropy in Sedimentary Rocks. Int. J. Sol. Struct. 39 (3), 637–648. doi:10.1016/s0020-7683(01)00110-x
Pietruszczak, S., and Mroz, Z. (2000). Formulation of Anisotropic Failure Criteria Incorporating a Microstructure Tensor. Comput. Geotechn. 26 (2), 105–112. doi:10.1016/s0266-352x(99)00034-8
Pietruszczak, S. (1999). On Inelastic Behaviour of Anisotropic Frictional Materials. Mech. Cohes. Frict. Mater. 4 (3), 281–293. doi:10.1002/(sici)1099-1484(199905)4:3<281:aid-cfm63>3.0.co;2-m
Qian, Q. H., Zhou, X. P., Yang, H. Q., Zhang, Y. X., and Li, X. H. (2009). Zonal Disintegration of Surrounding Rock Mass Around the Diversion Tunnels in Jinping II Hydropower Station, Southwestern China. Theor. Appl. Fracture Mech. 51 (2), 129–138. doi:10.1016/j.tafmec.2009.04.006
Sayers, C. M. (1990). Orientation of Microcracks Formed in Rocks during Strain Relaxation. Int. J. Rock Mech. Mining Sci. Geomech. Abstr. 27 (5), 437–439. doi:10.1016/0148-9062(90)92716-r
Shen, X. P. W., and Chun, X. (2014). Parameter Identification of a Plastic Damage Model %J Applied Mechanics and Materials. Appl. Mech. Mater. 599-601, 568–573. doi:10.4028/www.scientific.net/AMM.599-601.568
Sheng, Q., Yue, Z. Q., Lee, C. F., Tham, L. G., and Zhou, H. (2002). Estimating the Excavation Disturbed Zone in the Permanent Shiplock Slopes of the Three Gorges Project, China. Int. J. Rock Mech. Mining Sci. 39 (2), 165–184. doi:10.1016/s1365-1609(02)00015-1
Storn, R., and Price, K. (1997). Differential Evolution – A Simple and Efficient Heuristic for Global Optimization over Continuous Spaces %J Journal of Global Optimization. J. Glob. optimization 11 (4), 341–359.
Zhao, H., and Feng, X. T. (2003). Study on Genetic-Support Vector Machine in Displacement Back Analysis. Chinese J. Rock Mech. Eng. 22 (10), 1618–1622. doi:10.3321/j.issn:1000-6915.2003.10.008
Keywords: the unloading relaxation, anisotropy, relaxation factor, equivalent strain, columnar jointed rock mass
Citation: Yu J, Zhang Q, Xu W, Wang R and Zhang H (2021) Study on Unloading Relaxation Characteristics of Columnar Jointed Rock Masses Based on Displacement Back Analysis. Front. Earth Sci. 9:779537. doi: 10.3389/feart.2021.779537
Received: 19 September 2021; Accepted: 12 October 2021;
Published: 08 November 2021.
Edited by:
Mingfeng Lei, Central South University, ChinaReviewed by:
Jianjun Ma, Sun Yat-sen University, ChinaQiujing Pan, Central South University, China
Fei Ye, Chang’an University, China
Copyright © 2021 Yu, Zhang, Xu, Wang and Zhang. This is an open-access article distributed under the terms of the Creative Commons Attribution License (CC BY). The use, distribution or reproduction in other forums is permitted, provided the original author(s) and the copyright owner(s) are credited and that the original publication in this journal is cited, in accordance with accepted academic practice. No use, distribution or reproduction is permitted which does not comply with these terms.
*Correspondence: Qiang Zhang, emhhbmdxQGl3aHIuY29t