 Qizhi Chen
 Caibo Hu
 Felipe Orellana-Rovirosa
 Longshou Zhou4
94% of researchers rate our articles as excellent or good
Learn more about the work of our research integrity team to safeguard the quality of each article we publish.
Find out more
ORIGINAL RESEARCH article
Front. Earth Sci., 03 January 2022
Sec. Structural Geology and Tectonics
Volume 9 - 2021 | https://doi.org/10.3389/feart.2021.778905
This article is part of the Research TopicContinental Basin and Orogenic Processes: Deep Structure, Tectonic Deformation, and DynamicsView all 24 articles
Under regional tectonic shortening in the northern margin of Qinghai–Tibetan Plateau, the fold-and-thrust belts composed of four thrust faults (North Qilian-Shan, North Yumu-Shan, South Heli-Shan, and North Jintanan-Shan) formed from southwest to northeast discontinuously sequentially in the Jiudong Basin area during Late Cenozoic. Meanwhile, the North Qilian-Shan, Yumu-Shan, and Heli-Shan ranges were formed successively, as the Earth's local surface was unequally uplifted. In this study, based on geological and geophysical observations, a simple two-dimensional elastic-plastic numerical finite element method model for a southwest-northeast section in Jiudong Basin is successfully established to simulate the spatiotemporal evolution of the local fold-and-thrust belts. Results show that the computed equivalent plastic strain concentration zones and the four observed thrust faults are consistently correlated in spatial position orientation and time sequence. The simulated upper-surface deformation is congruent with the observed topographic peaks and uplift sequences of the North Qilian-Shan, Yumu-Shan, and Heli-Shan ranges. This study provides a geodynamic basis for understanding the growth mechanism of the northern margin of Qinghai–Tibetan Plateau under tectonic horizontal shortening. Also, we provide a thorough sensitivity analysis for the model parameters of this particular geologic setting. Our sensitivity simulations, considering systematic case variations about the regional geometrical-material parameters, suggest the manifestation of three different possible evolution patterns of fold-and-thrust belts for a wedge above a decollement layer, with wedge plastic deformation migrating from 1) thick to thin end (well-known), 2) thin to thick end, and 3) both ends to middle. Finally, our results suggest that in this region, further growth of mountain ranges is expected to continue in the future.
Influenced by the far-field effect of the India–Eurasia plate collision, the northern margin of Qinghai–Tibetan Plateau has been continuously growing outward since the Late Cenozoic (Tapponnier et al., 2001). As shown in Figure 1, Jiudong Basin is a part of the Hexi corridor, a reactivated foreland basin in the Late Cenozoic (Fang et al., 2012; Zheng et al., 2013a). Jiudong Basin in the northern margin of North Qilian Shan has formed a fold-and-thrust belt composed of four thrust faults (Figure 1A): North Qilian Shan Fault (NQSF), North Yumu Shan Fault (NYSF), South Heli Shan Fault (SHSF), and North Jintanan Shan Fault (NJSF) (Hu et al., 2019). The uneven uplifting of the Earth's local surface successively formed North Qilian Shan, Yumu Shan, and Heli Shan (currently observed as in Figure 1) (Hu et al., 2019), leaving the preexisting area north of the older Qilian Shan finally confined between the Yumu and Heli Shan ranges, and thus receiving sediments from essentially the three ranges since at least 10 Ma ago. Yuan et al. (2013) reviewed the geological data on neotectonic fault formation in Northeastern Tibet since ∼15 Ma, and they noted ∼150 km of northeastward expansion propagation of deformation. Zheng et al. (2013a) pointed out that the northern boundary of the thrust fault system in the Jiudong Basin is North Jintanan Shan Fault, which is dipping southward. Unlike the other three southward dipping thrust faults, the south Heli Shan Fault is a north-dipping fault in the Jiudong Basin (Zheng et al., 2013a). Previous studies on the structure and evolution of continental orogenic belts show that decollement (detachment) zones (interfaces, thin layers) with different depths and length scales are important structural elements of the orogenic belts, greatly controlling their evolution. The development of decollement zones, conditioned by the heterogeneity and anisotropy of rock sequences, defines major structural characteristics of orogens. A decollement zone often develops along low rock-strength (or viscosity) and high fluid-pressure layers (Ranalli, 1997; You et al., 2001; Treagus, 2003). The deformation mode of thin-skinned fold-and-thrust belts largely depends on the decollement's sliding resistance. Usually, salt beds (pressurized, hot, and water-permeated) as a basement decollement layer can exhibit very low sliding resistance (Davis et al., 1983). Previous studies show that the shallow inner-crust decollement may play an important role in the tectonic shortening deformation of the Jiudong Basin (Tapponnier et al., 1990; Huang et al., 2020). Very likely, the thrust system in the northern margin of Qilian Shan gradually expanded from southwest to northeast above a south-dipping shallow decollement layer in the Jiudong Basin (Hu et al., 2019). Seismic reflection profiles also show a shallow southward dipping reflection layer, likely with a very low dip angle, nearly horizontal (Gao et al., 2013; Huang et al., 2020). An S-wave low-velocity layer exists between the upper and lower crusts on the northern margin of Qinghai–Tibetan Plateau, also suggesting an inner crust decollement layer (Zhang et al., 2015). The P-wave velocity structure beneath the Qilian Orogen zone consistently reveals a low-velocity layer in the upper crust at depths of 10–20 km (Guo et al., 2019).

FIGURE 1. Tectonic setting of Jiudong Basin in northern margin of Qinghai–Tibetan Plateau. (A) GPS velocities (Wang and Shen, 2020), historical earthquakes (780 B.C.–A.D. 2019, M > 5.0) (*), and topography (in meters above sea level) of Jiudong Basin (Zhang et al., 2017; Hu et al., 2019; Wang et al., 2020) and surrounding regions. Locations of major faults are from Yuan et al. (2013). (B) Enlarged subset of red rectangle in (A). Four main thrusts, i.e., NQSF: North Qilian-Shan Fault, NYSF: North Yumu-Shan Fault, SHSF: South Heli-Shan Fault, and NJSF: North Jintanan-Shan Fault. (C) Elevation in meters above sea level (m.a.s.l.) profile along blue line section in (B), with original and low-pass versions of data. Three main mountain ranges in Jiudong Basin are visible: North Qilian Shan, Yumu Shan, and Heli Shan. (*) Department of Earthquake Disaster Prevention, State Seismological Bureau, 1995; Department of Earthquake Disaster Prevention, China Earthquake Administration, 1999.
In this study, we refer to previous works on the fold and thrust belts, particularly 1) Coulomb critical wedge theory (Chapple, 1978; Davis et al., 1983; Dahlen and Suppe, 1984; Dahlen, 1990; Yin, 1993, 1994; Hu and Wang, 2006, 2008; Wang and Hu, 2006; Cubas et al., 2008; Nassif et al., 2019), 2) sandbox physical simulations (Davis et al., 1983; Dahlen and Suppe, 1984; Storti et al., 2000; Bose et al., 2009; Driehaus et al., 2014; Schreurs et al., 2016), and 3) numerical simulations (Makel and Waleters, 1993; Barnichon and Charlier, 1996; Beaumont et al., 2001; Bose et al., 2009; Hardy et al., 2009; Li et al., 2009; Buiter, 2012; Ruh et al., 2012; Dean et al., 2013; Fillon et al., 2013; Ruh et al., 2013, 2017; Buiter et al., 2016; Granado and Ruh, 2019; Zhang et al., 2019). After this, based on regional and local geological and geophysical observations, a series of systematic, reasonably accurate numerical simulations can, in our understanding, provide an adequate conceptual and mathematical framework to understand the dynamics of these structures in the Jiudong Basin since Late Cenozoic. This entails a sensitivity analysis for the model parameters of this particular geologic setting, including wedge inclination angles, uniaxial compressive strength, internal friction angle, and decollement's depth and friction coefficient. We study the main features of the tectonic evolution of four thrust belts and three mountain ranges in the Jiudong Basin region since the Late Cenozoic, compare and analyze the spatiotemporal evolution of our models with observational data, and quantitatively try to explain the growth and development of fold-and-thrust belt in Jiudong Basin. In addition, it is inferred from the model results that the wedge deforms episodically with the progressive horizontal contraction, and the fold-and-thrust belt will likely grow further with time, which is useful for determining whether the northeast margin of the Qinghai–Tibetan Plateau continues to grow.
The Hexi Corridor, with an average altitude of ∼1,500 m (above sea level), is a complex foreland basin located in the north foot of the high [∼5,500 meters above sea level (m.a.s.l.)] Qilian Shan mountain range in NE Qinghai–Tibetan Plateau. The Hexi Corridor basin is divided into four sub-basins from northwest to southeast, namely, Jiuxi, Jiudong, Zhangye, and Wuwei, nearly parallel to Qilian Mountain (Fang et al., 2005; Wang et al., 2018). Fold-and-thrust belts, composed of four thrust faults, namely North Qilian Shan Fault, North Yumu Shan Fault, South Heli Shan Fault, and North Jintanan Shan Fault, have been formed in Jiudong Basin. An uneven uplift on the surface can be observed with the formation of North Qilian Shan, Yumu Shan, Heli Shan, and other mountains successively uplifted since the Late Cenozoic (Figure 1).
The sediments in Jiudong Basin are Cenozoic, most of them Miocene to Pliocene, amount to a maximum thickness exceeding 3 km (although at these depths, they are likely almost lithified). The outcropping strata reveal Cenozoic sedimentary rocks overlying Paleozoic metamorphic sedimentary rocks. The provenance of sediments in Jiudong Basin is closely related to the uplift of the Qilian mountains (Li and Yang, 1998; Bovet et al., 2009; Zhuang et al., 2011; Hu et al., 2019). Seismic reflection analysis across the Qilian Shan reveals a south-dipping Cenozoic thrust system that places Paleozoic and Mesozoic strata on undeformed Mesozoic–Cenozoic sediments in the Hexi Corridor foreland. This thrust system has accumulated >53% Cenozoic strain (∼50 km of horizontal shortening), accommodated by several south-dipping thrust faults (Zuza et al., 2016, 2018). The Jiudong Basin continuously receives sediment materials from the Qilian Mountains in the south since 7 Ma (Hu et al., 2019). In Jiudong Basin, the bedrock is composed of Paleozoic sandstone, siltstone, limestone, and volcanic rock and Mesozoic red sandstone, green mudstone, and charcoal-gray mudstone, which is exposed in Jintanan Shan and Heli Shan ranges in the northern Jiudong Basin (Hu et al., 2019). The sedimentary strata in Jiudong Basin are not horizontally distributed but show a strong structural deformation. The unconformity of sedimentary strata in the Jiudong Basin shows evident folding (Fang et al., 2005; Chen et al., 2006; Liu et al., 2011; Hu et al., 2019), suggesting horizontal contraction.
The thrusting of the North Qilian Shan started at 10–8 Ma. As Qilian Shan grew and extended to Jiudong Basin, the active fold-and-thrust belts progressed and continue to this day, including Yumu Shan anticline (Chen et al., 2006), Yumu Shan formation (Palumbo et al., 2009; Liu et al., 2010), and Heli Shan formation (Zheng et al., 2013a). The uplift of the Yumu Shan range is likely a result of the propagation of accretionary prism and SWS-NEN tectonic shortening of the North Qilian Shan region (Seong et al., 2011; Chen et al., 2017), with fault initiation and concentrated Yumu Shan deformation occurring in the north face and foot of the range. The shape of the Yumu Shan range is controlled by the local fault distribution (Seong et al., 2011; Chen et al., 2017). The Yumu Shan range began to rise at ∼3 Ma, and the Jintanan Shan range began to uplift at 1.8 Ma (Hu et al., 2019). Palumbo et al. (2009) calculated the slip rate of the Yumu Shan fault as 0.5–0.8 mm/year through cosmogenic exposure dating, which indicated that the onset of uplift of Yumu Shan range is in 2.8–4.6 Ma. Liu et al. (2011) studied the western part of the Yumu Shan range by using the angle consistency of sedimentary layers and further limited the start of uplift to 2.9–2.6 Ma (see Table 1). The growth of Yumu Shan began ∼4 Ma ago, extended to the south of Alashan block in the Hexi Corridor of Early Pleistocene (Wang et al., 2018). The vertical components of the slip rates of 0.11 ± 0.03 mm a−1 for Jintanan Shan Fault in Late Quaternary indicate that the deformation of Qinghai–Tibetan Plateau's northern margin remains significant, most likely ongoing (Zheng et al., 2013b). The uplift of the Heli Shan range started 1–4 Ma ago but is most likely to occur since ∼2 Ma ago (Zheng et al., 2013a). Bi et al. (2018) used high-resolution topographic data to constrain the slip distribution of the South Heli Shan Fault associated with several large historical earthquakes, indicating that the South Heli Shan Fault's long-term activity plays a role in the uplift of the range it bounds.
TABLE 1. Summary of chronological specifications for three mountain ranges of our study. Observations of uplift-start ages and present-day profile horizontal coordinates are shown. Although there are significant uncertainties (outliers) in ages, a clear uplift-onset migration trend from SWS to NEN exists. Horizontal coordinate as in Figure 1. See text in this subsection for references.
The thin wedge in North Qilian Shan's northern margin expanded along the south-dipping decollement zone to the basin at approximately 3 Ma (Hu et al., 2019). In the Late Cenozoic, the foreland basin was reactivated and continued to accumulate sediments. The northward progression of thrust faults from the North Qilian Shan Fault may occur above the Precambrian basement's decollement zone (Hu et al., 2019, Figure 2). The seismic reflection profile and seismic tomography also show a shallow southward-dipping reflection layer with a very small dip angle (<5°) (Gao et al., 2013; Guo et al., 2019; Huang et al., 2020). A shallow geological section of the Jiudong Basin (Fang et al., 2012), consistent with the research profile selected by us, shows the stratigraphic ages and fault distributions (Figure 2B).
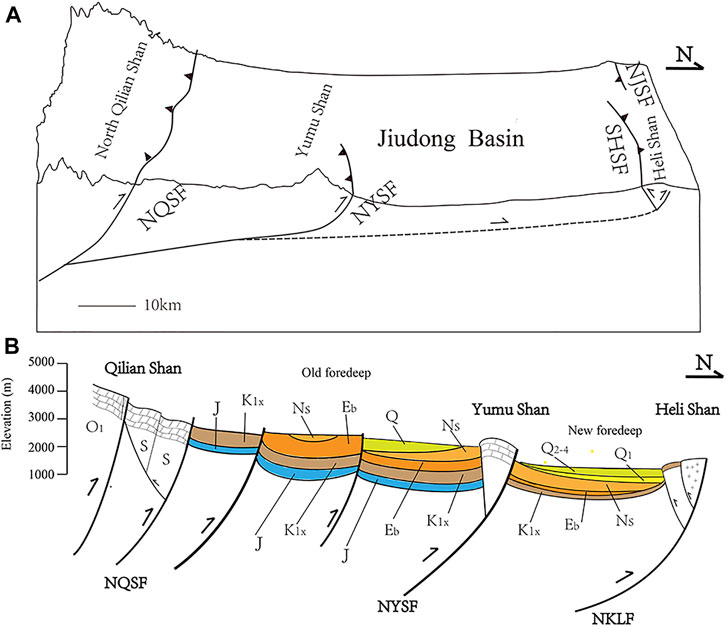
FIGURE 2. Observations near study profile. (A) Structure diagram of four major thrusts and three mountain ranges in a crustal-scale SWS-NEN section in Jiudong Basin (modified from Hu et al., 2019). These structural elements are now clearly associated with horizontal contraction dynamics in region. (B) Geological cross-section of Jiudong basin on a nearby profile, close to our selected profile; panel modified from Fang et al., 2012. NQSF, North Qilian shan fault; NYSF, north Yumu Shan fault; and NKLF, northern marginal fault of Kuantan Shan–Longshou Shan. O1, Early Ordovician; S, Silurian; J, Jurassic; K1x, Early Cretaceous Xiagou Formation; Eb, Palaeogene Baiyanghe Formation; Ns, Neogene Shulehe Formation; Q1, Early Quaternary; Q2–4, Late Quaternary.
The section selected in this paper sits in an area where some neighboring seismic-profiling data exist. There is a deep seismic reflection profile in Jiuxi Basin, approximately 150 km west of our selected section (Huang et al., 2020). The distribution of faults and the position of crustal decollement layers are revealed by the deep seismic-reflection profile (Huang et al., 2020). As a whole, they reflect the forward leaping thin-skinned structural wedge on the northern margin of the Qinghai–Tibetan Plateau. The shallow inner-crust decollement layer in Jiudong Basin is detected by seismic reflection profile (Gao et al., 1999; Huang et al., 2020). The crustal deformation of the Hexi Corridor in NE Tibet is decoupled downward by the inner-crust decollement (at the top of the crustal low-velocity layer, Huang et al., 2018, 2020). The crustal wedge above the decollement is dominated by a series of south-dipping thrust faults, developed from the decollement, perhaps indicating the northeastward expansion (continued growth) mode of the Qinghai–Tibetan Plateau (Gao et al., 1999, 2013; Zheng et al., 2013a; Huang et al., 2018, 2020). The current frontal edge may be located in the Heli Shan range (Huang et al., 2018). Huang et al. (2020) proposed a double-layered shortening mechanism on the Qinghai–Tibetan Plateau, with decoupled deformation of the upper crust and lower crust.
In this paper, we want to address the following questions:
1) Can an elastic-plastic two-dimensional 2D numerical model with a choice of reasonable (appropriate for the region) set of parameter values yield outcomes that are geologically meaningful, acceptable, and representative for the region? Are these model outcomes relatable to the observations regarding spatial behavior? Temporal behavior?
2) Can a brief exploration of the model parameter space reveal some additional clues? Do the model outcomes diverge when the parameters vary from the reference ones? Are there any patterns in the system behavior that depend on these parameter-values combinations?
In this work, simple 2D, elastic-plastic finite element method (FEM) models are used to study the fold-and-thrust belts' structural evolution in Jiudong Basin. We consider the influences of the gravity field, tectonic horizontal shortening of the region, contact basal friction on the bottom decollement layer, crustal wedge geometry, and its elastic-plastic strengths. Considering the elongated geometry of Qilian Shan and Heli Shan ranges and that our transect (shown in Figure 1) cuts across the ranges, a 2D description is a reasonable approximation for our model setup on the transect. The geometry of the finite-element reference model of a fold-and-thrust-belts wedge is as follows (Figure 3):
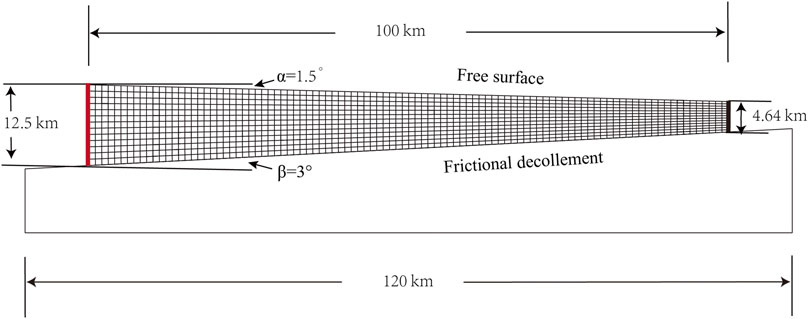
FIGURE 3. Model setting: initial condition for geometry and grid definition used in modeling tectonics of Jiudong Basin region. Left end (SW) is marked by a red line and is movable; right end (NE) is marked by a black line and is fixed. These particular parameter values pertain to our reference model.
This is the reference model (Model 1), representing a southwest-northeast section as in Figure 1. Model 1 is established based on the latest geological surveys and geophysical field observations. The upper part of the model represents a thin wedge supporting Jiudong Basin, with a horizontal length of 100 km, undergoing strong deformation since the Late Cenozoic. The lower part of the model represents the nearly undeformed basement of the Jiudong Basin with a horizontal length of 120 km (Figure 3). The wedge is considered homogeneous (except for compressibility) and isotropic in its material properties, which allows for simple and fast computation of dynamics. The wedge mass density is assumed to have a common adequate uncompressed value of 2,500 kg/m3.
Contact friction on the decollement layer between the wedge body and the (unmodelled) lower basement of the model is considered. The Coulomb contact friction is adopted, that is
The inclination angle of the upper surface of the model is based on the current surface elevation observation data. The average elevations of North Qilian Shan and Heli Shan are ∼4,000 and 1,300 m.a.s.l., respectively, and they are separated horizontally by approximately 100 km. Thus, based on a linear approximation, the slope inclination angle
The left end of the upper part of the model is approximately 12.5 km thick based on the position of shallow inner-crust decollement (Guo et al., 2019; Hu et al., 2019; Huang et al., 2020). The shallow inner-crust decollement usually has a very low dip angle, nearly horizontally (Gao et al., 2013; Huang et al., 2020); we established a wedge with an inclination
An ideal elastic-plastic constitutive equation is adopted for the wedge, with the Drucker–Prager failure criterion (Drucker and Prager, 1952; Li et al., 2009; Panian and Wiltschko, 2004, 2007); see Appendix SB.
The model wedge is subjected to gravity and to a progressive, variable-displacement boundary condition on its left vertical side (Figure 3). Observationally, low average horizontal fault slip rates (∼1 mm/year) of the northern Qilian Shan fault since its initiation (∼10 Ma) suggest that total horizontal contraction displacement did not exceed 10 km (Zheng et al., 2010). This observation, however, provides no information on the horizontal contraction of the Jiudong Basin between the Qilian Shan and Heli Shan ranges.
A constant gravity field acts on the system, at all points in space and at all steps in the computation. The left-boundary tectonic loading displacement is applied incrementally, step by step (in a total of 66 steps), that is, that boundary is prescribed with (0.0-0.1-0.2-0.3- … -6.4-6.5-6.6) km of cumulative, right-ward, horizontal displacement on the model material-points (mesh points on the left, thick, end). During the process, the boundary conditions on the right side (vertical wall) and the underlying basement remain unchanged as fixed with zero displacement. Owing to this (time-dependent) difference in horizontal displacement between the two ends, there is material horizontal shortening and associated normal stress (push). When the shortening reaches a certain value, the wedge inner-stresses begin to produce plastic strain usually intensified in concentrated zones; and later, plasticity is reactivated if stresses surpass the threshold stress at any point in space–time.
Equivalent plastic strain (EPS) is applied to describe the permanent deformation when a material is under a stress state beyond the elastic limit (which is a function, here defined by the Druker–Prager criterion, Druker and Prager, 1952; Panian and Wiltschko, 2004, 2007; Zhou et al., 2019). We performed the finite element models' calculations using the ABAQUS package (Panian and Wiltschko, 2007; ABAQUS, 2016), which can readily deal with the nonlinearity of elastic-plastic materials and basal contact friction.
It is widely known that the elastic-plastic material and contact friction of the model are both nonlinear and often computationally challenging during model calculations. These nonlinearities mean that small changes of the geometrical and material parameters can greatly influence the final patterns of the numerical simulation results. In this paper, we discussed the effects of geometry, material parameters, and contact friction on the evolution of fold-and-thrust belts in Discussion. The material parameters of all 14 models are shown in Table 2. The expansion angle and flow–stress ratio are assumed 0° and 1, respectively (ABAQUS, 2016). The geometries of Models 1–3 are different but with the same material parameters values. The geometries of Models 4–12 are the same as Model 1 but with different material parameter values. The material parameters of Models 13–14 are the same as Model 1 but with different depths of the bottom decollement layer. We will see that the series of numerical simulation experiments show three different evolution patterns on the fold-and-thrust belts in a thin wedge, which provides some knowledge about crustal material behavior and tectonic deformations.
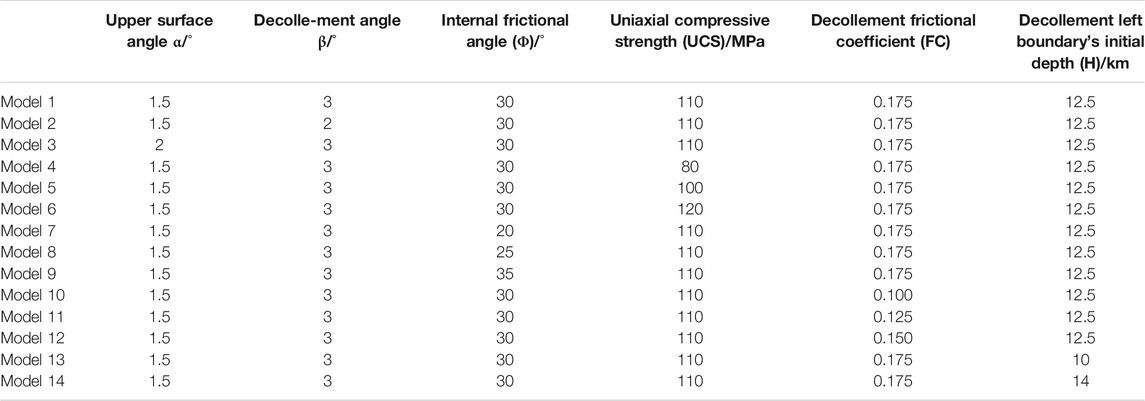
TABLE 2. Model parameters of our 14 elastic-plastic finite-element models for fold-and-thrust-belts evolution in Jiudong basin. Variables α and
Model 1, our reference model, is reasonably consistent with the tectonic evolution process of the Jiudong Basin. Four bands with important plastic strain can be observed successively from the near (thick) end to the far (thin) end of the wedge (Figure 4). The simulation is fairly consistent with the work of Hu et al. (2019).
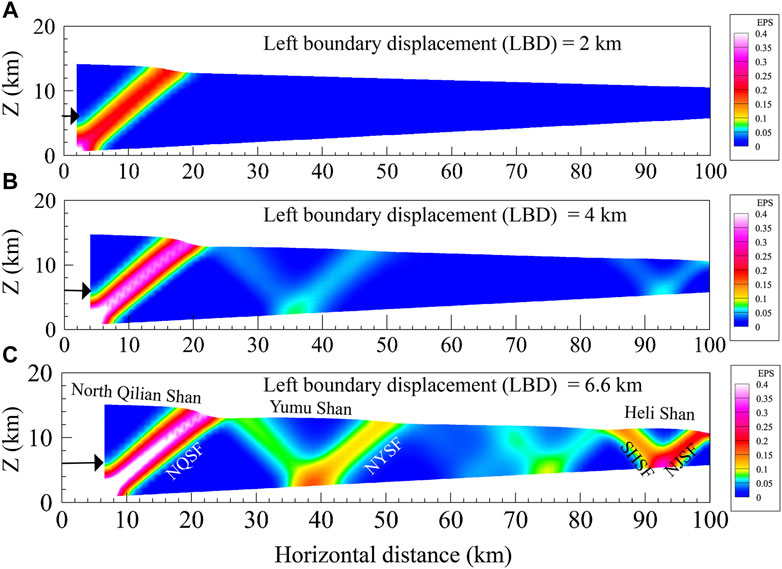
FIGURE 4. Reference model (Model 1). Equivalent plastic strain (EPS) at different amounts of tectonic left boundary displacement (LBD). Panels show deforming wedge in initial reference frame. Colors map intensity of plastic strain, with pink-white zones being at maximum concentration of deformation where faulting would likely occur. Three panels display states of system at tectonic LBD (associated with horizontal shortening) (A) of 2 km; (B) of 4 km; (C) of 6.6 km. As horizontal contraction progresses in time, plastic-deformation zones develop from thick end toward thin end of wedge. In state (C) with 6.6 km of shortening, model suggests four main thrusts, likely approximating/reproducing real Earth's NQSF: North Qilian Shan Fault, NYSF: North Yumu Shan Fault, SHSF: South Heli Shan Fault, and NJSF: North Jintanan Shan Fault and three mountain ranges: North Qilian Shan, Yumu Shan, and Heli Shan and low-plasticity area (x∼55–85 km) representing Jiudong Basin wedge region (consistent with Hu et al., 2019).
Figure 4A shows that with a tectonic shortening of 2 km, the model's first plastic-strain concentration zone developed from the lower-left boundary (SW end of the profile), likely corresponding to the North Qilian Shan thrust fault. Model surface uplift concentrates between the left end and the first plastic-strain concentration zone and is related to the North Qilian Shan range.
With a tectonic shortening of 4 km, a second plastic-strain concentration zone began to develop around x∼40 km, likely corresponding to the North Yumu Shan inverse fault (Figure 4B). The North Yumu Shan Fault and the North Qilian Shan Fault both have similar dip (SWS) angles. The relative displacements between these two inverse faults resulted in local terrain uplift (up to 800 m), related to the Yumu Shan range.
With a total tectonic shortening of 6.6 km, two conjugate (opposite dips) plastic-strain concentration zones developed near the right (thin) model end (Figure 4C), likely corresponding to two thrust faults, namely South Heli Shan Fault and North Jintanan Shan Fault, with the faults-bounded terrain (Heli Shan range?) being uplifted (computed uplift ∼600 m). In addition, two plastic-strain concentration zones with relatively small strains (EPS) located approximately around 70–80 km from the left boundary, and accompanied by surface uplift, are suggested by the model. However, recent faulting or surface uplift between 70 and 80 km is not evident in real Earth (Figure 1C); see Discussion Section 4.2.
From southwest to northeast, four simulated main EPS concentration zones (EPS > 0.1) formed with progressing tectonic shortening and, due to their spatial locations and their dip orientations, are relatable to North Qilian Shan Fault, North Yumu Shan Fault, South Heli Shan Fault, and North Jintanan Shan Fault. South Heli Shan Fault, the only major regional fault dipping northward, does have its expression in our reference simulation, and it starts at left displacement boundary (LBD) > 3 km. This model-versus-reality correspondence is not a trivial result (see Discussion Section 4.2).
As seen in Figure 5A, computed surface differential of vertical displacement, proportional to vertical velocity, shifts with time and space. It can be seen that the model region in x < 15 km has the largest rate of change and the earliest uplift time; it is then followed by activation over x∼30–45 km and later over x > 85 km. This simulated spatiotemporal surface uplift pattern shows correspondence with that of the real scenario, with three real mountain ranges in the study area. The real North Qilian Shan began to uplift roughly approximately ∼10 Ma ago (Metivier et al., 1998; Zheng et al., 2010; Zheng et al., 2017); it propagated along the northeast direction with the passage of time and flanking the Jiudong Basin, with fold-and-thrust belts such as Yumu Shan range whose formation began at approximately 4 Ma (Liu et al., 2010; Zheng et al., 2017; Yang et al., 2020), ∼4.6–2.8 Ma (Palumbo et al., 2009; Hu et al., 2019). The Heli Shan range formation began perhaps at 4 Ma but likely at approximately ∼2 Ma (Zheng et al., 2013a; Zheng et al., 2017; Yang et al., 2020). The activation times' sequence both in the model and in the observations is first Qilian Shan, then Yumu Shan, and later Heli Shan; see Table 3. This can be regarded as continental deformation spreading inward Eurasia, particularly here from the thick toward the thin sections of the wedge, gradually with the model's left boundary displacement and push.

FIGURE 5. Differentiation (rate) of two model output variables on upper surface, with respect to LBD increments (related to time increments). Finite differences (derivatives numerators) are not divided by denominator increments (of LBD or time). Panels show upper surface. (A) Differential of vertical displacement Uz and (B) Differential of EPS; as functions of horizontal distance, as they evolve with progressing LBD (which might be related to a geologic timescale, here set to last 10 Ma as a plausible relevant example). Highest “rates” of change of uplift and plasticity clearly manifest over x < 20 km. Annotations on both panels are interpreted features, highly correlated with real-Earth observed ranges (A) and faults (B). In panel (A), superimposed are dashed-line rectangles of observed (black) and modeled (white) uplift-onset time intervals, which should correspond to accelerating stages. In model, after respective onset-and-maxima times, uplift rates and plasticity rates continue being non-zero (positive), consistent with present-day continued ranges uplift and bounding-faults activity.
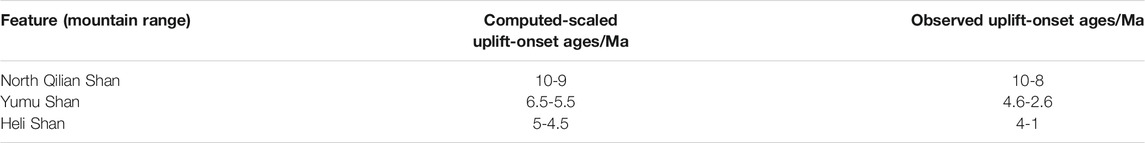
TABLE 3. Comparison between time intervals of computed and observed topographic uplift start of features that are spatially correlated. Computed onset intervals are simply accelerating stages, whereas observed ones come from diverse geochronological estimates. In this exercise, control variable LBD has been converted to time: LBD in (0, 6.6) km mapped linearly to (10, 0) Ma ago, as a potential time scaling for reference and comparison. Computed and observed time-order sequences are same, but real onset-times of YS and HS are somewhat later (younger ages) than computed ones (Discussion Section 4.2). Observations of mountain ranges' deformation times (and associated faults' slip-rates) are from Métivier et al. (1998), Zhang et al. (2001), Palumbo et al. (2009), Liu et al. (2010), Zheng et al. (2010), Seong et al. (2011), Zheng et al. (2013a), Chen et al. (2017), Zheng et al. (2017), Hu et al. (2019), and Yang et al. (2020).
GPS constraints indicate that the SWS-NEN horizontal shortening rate (Δxvx) across N Qilian Shan and Hexi Corridor is approximate of Δxvx∼1–2 km/Ma between the extremes of our 100-km long profile. Then, the timescale t = LBD/Δxvx, would imply that the shortening at LBD = 6.6 km takes approximately 4.4 Ma. The late-Cenozoic regional shortening rate is distributed on several active faults: North Yumu Shan fault, Heli Shan Fault, and Jintanan Shan fault, with the individual slip rates of faults being <∼1 mm/year (Métivier et al., 1998; Zhang et al., 2001; Palumbo et al., 2009; Seong et al., 2011; Zheng et al., 2013a; Chen et al., 2017). Figure 5B shows the results of time differentiation of upper surface EPS evolving with the LBD as a function of the horizontal distance. There is a basic surface-plastic-strain migration pattern from thick-to-thin ends of the model wedge, which is consistent with the basic uplift pattern (5a) and with the scarce observations. Different local maxima in Figure 5B can be related to real fault positions and timings, also with the faults' orientations being consistent with reality (see Discussion Section 4.2). Each uplifting region seems flanked by two strain-rate zones, exactly like conjugated inverse faults bounding an uplifting block. Structural observations suggest North Qilian Shan Fault (NQSF) activated in early times, then activation gradually spread to the neighboring North Yumu Shan fault (NYSF), then far away to the distal South Heli Shan fault (SHSF) and North Jintanan Shan fault (NJSF). The vertical slip rates of North Yumu Shan fault were 0.4–0.8 mm/year (Palumbo et al., 2009; Seong et al., 2011) and 0.4–0.7 mm/year (Chen et al., 2017); the crustal horizontal shortening rate was 0.4–1.1 mm/year (Palumbo et al., 2009; Seong et al., 2011). The vertical slip rate of the South Heli Shan fault (SHSF) was 0.18–0.53 mm/year; the crustal shortening rate was 0.1–0.5 mm/year (Zheng et al., 2013a). Figure 5B shows that strain rates in regions related to NYSF and SHSF are similar, in agreement with the fault-slip observations.
Our computed surface displacements, by spatiotemporal correlation, may reflect the formation sequence of North Qilian Shan, Yumu Shan, and Heli Shan (Figures 1, 6). Particularly in the final state, our reference model's topographic-displacement spatial pattern is remarkably similar to that of the present-day observed topography along the profile (comparing Figures 1C and 6A). Due to the unknown initial (before contraction, without recent topography) surface angle of the real Jiudong Basin, and the unknown amount of continuous horizontal shortening (between faults) this has experienced since 10 Ma (just to give a time reference), it is really hard to objectively and quantitatively compare the computed and observed topographic reliefs (elevations of mountain ranges with respect to the basin). However, we must acknowledge the remarkable similarity between the horizontal locations of computed topographic maximum displacements Uz (with peaks at x∼0 km, x∼35 km, and x∼90 km in Figure 6A, but in the final-contracted coordinate frame, these translate to x∼0 km, x∼33 km, and x∼84 km) and the observed topographic peaks [QS (x < 5 km), YS (X∼26 km), and HS (x∼85 km), Figure 1C]; see Table 4.
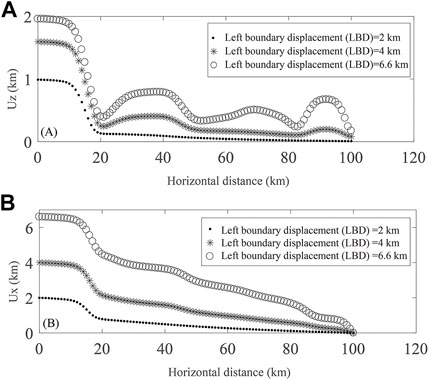
FIGURE 6. Dynamic surface 2D displacements over profile in Jiudong Basin obtained in Model 1 (reference) after 2, 4, and 6.6 km of left boundary displacement (LBD, here also equating to HS). Using model's initial frame, panels display (A) vertical displacement (Uz) and (B) horizontal displacement (Ux), as functions of horizontal coordinate (in undeformed frame). As can be seen, both vertical and horizontal displacements (as a function of distance and of shortening) are inhomogeneous and nonlinear; thus, they have associated 2D differential deformations and rotations. Important deformations are observed at horizontal coordinates x ∼ (18, 50, 83, 100) km coinciding with high-plastic-strain surface expressions.
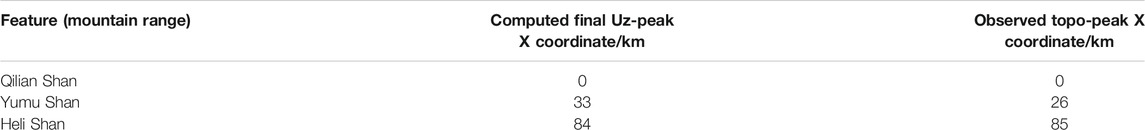
TABLE 4. Comparison of spatial (horizontal) locations of prominent topographic features: Computed peaks of vertical displacements (after 6.6 km of horizontal shortening) and present-day observed topographic peaks. For computed topography, horizontal coordinate has been transformed to final-contracted state. Observed coordinates are as in topographic profile in Figure 1C. Correlation of x-coordinate for QilianShan and HeliShan ranges' peaks is almost perfect and that of Yumu Shan range is somewhat off.
This similarity may be due to the model parameters having adequate regional values and the simple elastic-plastic formulation being able to capture the first-order precision of the variables of the system. Also, regarding the initial condition of the model based on present-day data, this similarity could alternatively be interpreted as implying a reinforcement of the existing topography toward the geologic near future.
The surface elevation, horizontal shortening variations, and plasticity occurrence on the profile in Jiudong Basin displayed in Model 1 are heterogeneous (Figures 4–6). Regions where the surface elevation varies abruptly correlate to the surface expression of plastic-strain concentration zones (Figures 4–6), and in this way, our continuous model is consistent with the fault-bounded uplifting-rigid-blocks paradigm.
Figure 7 shows the distribution of computed normal and shear stresses on the bottom decollement layer at the state of 6.6 km of horizontal shortening. Both stresses are heterogeneous along the profile (located as in Figure 1B) coordinate. The normal and shear stresses generally decrease from the southwest (thick) to the northeast (thin), but some clear short-length-scale disturbances exist all over the profile, concentrating at some positions, dynamically relating to the fault zones and uplifted mountains. The normal and shear stresses on the bottom decollement layer are subjected to the Coulomb contact friction, which is a contact nonlinearity. This is a key point for our modeling: If there is no Coulomb contact friction on the decollement layer, we cannot simulate the evolution pattern of fold-and-thrust belts in Jiudong Basin successfully.
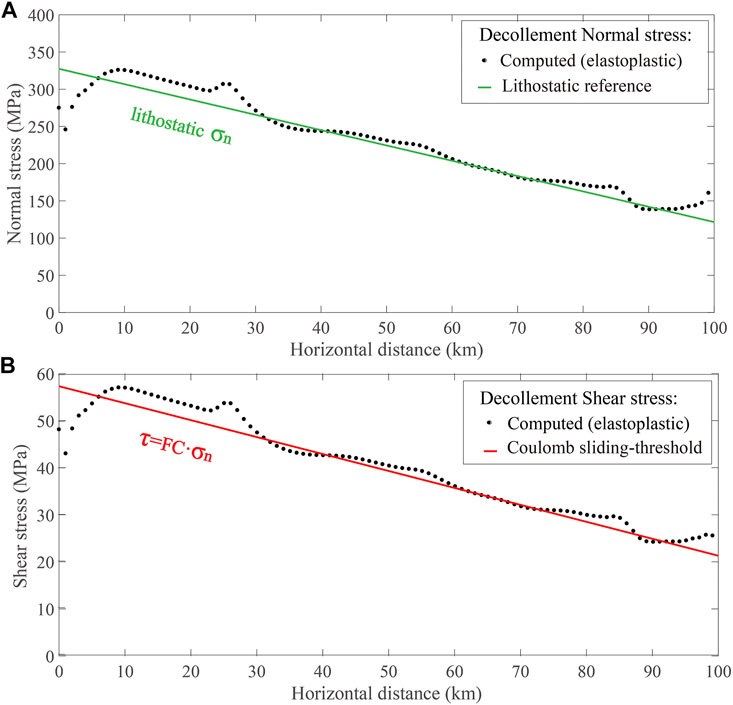
FIGURE 7. Final-state normal and shear stresses on bottom decollement after 6.6 km of tectonic shortening in reference model, plotted versus horizontal distance of its undeformed state. (A) Computed normal stress (dots) of elastic-plastic model and theoretical normal stress (green line) from a reference homogeneously deformed wedge with same parameters (these are compressive stresses); (B) computed shear stress (dots) and theoretical reference (red line) (these are up-the-slope directed). Elastic-plastic-dynamics normal stress is dominated by lithostatic-column weight (which projects onto decollement), and dynamic shear stress is very close to Coulomb sliding-threshold stress (see Appendix SA). Short-length scale and small-amplitude variations of computed stresses are result of dynamically created topography, plastic deformation zones, and differential slip-on decollement, resulting from general elastic-plastic response to horizontal shortening.
It is worth noting that the computed normal stress is highly complex (due to differential deformations) but dominated by a linear trend that stems from lithostatic-column weight projected onto the inclined (3°) decollement surface. For reference, we calculated the theoretical normal stress in the final state of a homogeneously deformed wedge (with the 6.6% shortening and the same material parameters). See Appendix SA.
The computed, dynamic contact shear-stress is upward the slope on and along the decollement, and this is so responding to the shortening and right-ward push from the left boundary. Assuming that the wedge displacement and deformation are slow and quasi-static, the dynamic shear stress cannot be too different from the sliding threshold given by Coulomb frictional criteria on the decollement. For reference, we calculated such critical shear stress using the reference normal stress previously calculated (for the deformed state), with the frictional coefficient FC = 0.175 of this model.
Both normal and shear computed stresses exhibit short-length-scale variations, likely resulting from variable topography, inhomogeneous plastic strain, and differential slip-on decollement. See Figure 7.
In summary, using the available literature information, we decided on a single (most likely) set of parameter values to perform a single forward modeling trial. This combination of parameter values chosen for the reference model yields a reasonable approximation to the observations. The spatial correlation between observed topography and computed uplift is evident and relatively large; however, in the time dimension, things are not so perfect, and this is due to observational data imprecision and difficulties in defining the model's initial condition and to unmodelled heterogeneities. Assuming a 10-Ma timescale as reasonably representative for the system evolution (constrained by geochronology), there is some correspondence between computed and observed uplift-and-plasticity timings. Our simulation produces four major high-strain regions that, given their spatial locations and dip-angle orientation (with only one having reflected dip orientation), are remarkably similar to the observed four main regional faults. The agreement or correlation between observed and simulated patterns is nontrivial. This answers our first research question.
A simple finite-element model (Model 1, reference) is adopted to simulate the spatiotemporal evolution of the fold-and-thrust belts in Jiudong Basin. In a model like ours, there are two important nonlinearities: material plasticity and contact friction, which may lead to diverging patterns of simulation results. The model sensitivity to its parameters shall now be tested. In this study, we set up 13 additional models to understand the spatiotemporal evolution patterns of the system. These models are comparable with other authors' models of thin-skinned fold-and-thrust belts (Chapple, 1978; Gao et al., 1999, 2013; Buiter, 2012; Zheng et al., 2013a; Buiter et al., 2016; Meng and Hodgetts, 2019). In the following, we will test the effects of the most important model parameters.
In presence of gravity and material friction, the wedge's upper and lower surface angles matter.
Figure 8A shows the plastic strain concentration bands' distribution in Model 1 (reference model), with a top dip angle of 1.5° and a bottom inclination angle of 3°. Model 2 has the same settings except for its bottom surface inclination angle being 2° (more horizontal). As a consequence, the resulting plastic-strain concentration bands are different than those of Model 1 (Figure 8B). Model 3 has the same settings as Model 1 except for its top inclination angle being 2° (steeper, Figure 8C). No obvious plastic-strain concentration band can be observed in the middle part of Model 3.
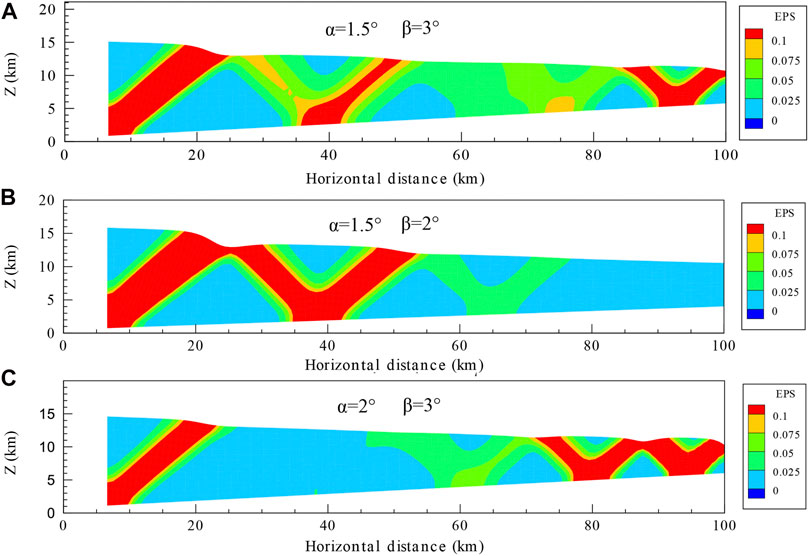
FIGURE 8. Final state EPS for models with different boundary-surfaces' inclinations. After 6.6 km of shortening displacement, panels (A–C) show states of models 1, 2, and 3, which have inclination angles (
Therefore, small changes in the model's top and bottom angles can have significant impacts on the distribution of calculated plastic-strain concentration zones and thus on the evolution pattern of fold-and-thrust belts.
The inclination angles of the top and bottom of Models 1–3 are small, ≤3°, but geologically common. Due to the nonlinearity of material and contact friction, the plastic strain (EPS) patterns by Models 1–3 are different. Davis et al. (1983) and Dahlen and Suppe (1984) gave the formula of inclination angles of top and bottom wedge tapper under a critical Coulomb failure state. Several examples of actual profiles in Taiwan (Suppe, 1980), Himalaya (Ohta and Akiba, 1973), Oregon (Snavely et al., 1980), Makran (White and Ross, 1979), etc., are gathered by Davis et al. (1983), which indicate that the inclination angles of top and bottom wedge tapper are usually less than 8°. Zhou et al. (2019) studied the cases of 4 and 8° of bottom wedge tapper, which led to difficulties and non-convergence of their numerical simulations.
Uniaxial compressive strengths (UCSs), related to cohesion, as threshold deviatoric stress with close-to-zero normal stress in at least one direction, have a definite effect on wedge plasticity.
Figure 9 shows the equivalent plastic strains of Models 4, 5, and 6. The wedge's uniaxial compressive strengths are 80, 100, and 120 MPa, respectively. All the other parameters are as in Model 1. The differences in the wedge's uniaxial compressive strength lead to different spatiotemporal patterns of equivalent plastic strain. When the wedge's UCS is low, equivalent plastic strain develops from thick end to thin end (Model 4, Figure 9A). When the uniaxial compressive strength is high (Model 6, Figure 9C), more significant plasticity occurs in the thin region.
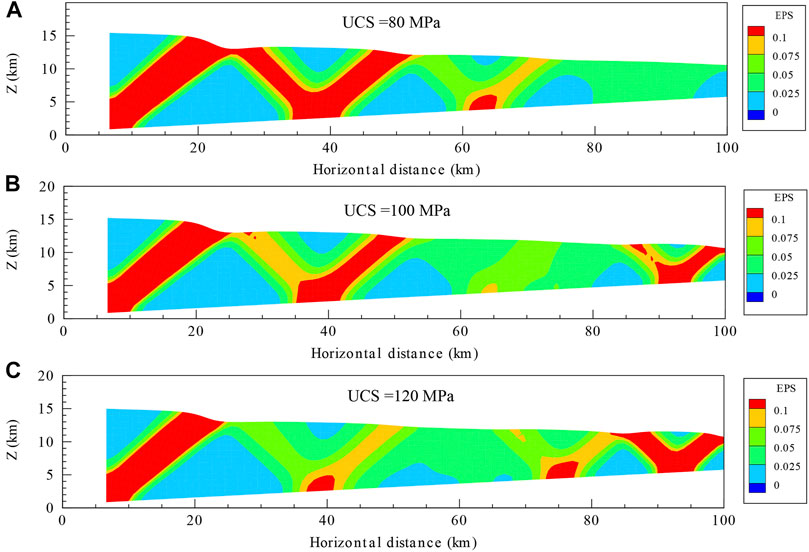
FIGURE 9. Final state EPS for models with different uniaxial compressive strength (UCS). After 6.6 km of shortening displacement, panels (A–C) show states of models 4, 5, and 6, which have uniaxial compressive strengths of (80, 100, and 120) Mpa, respectively. Plasticity concentration patterns are different among them. Higher strengths tend to decrease extent and intensity of plasticity in wedge's thick region, while slightly favoring it in its thin region.
The internal friction angle, related to the frictional shear strength of granular or rock mass materials in geotechnics, determines the actual failure angle in relation to the stress tensor.
Figure 10 shows the effect of the internal friction angles of 20, 25, and 35° by Models 7, 8, and 9, respectively, on the distribution of equivalent plastic strain. Fold and fault organizes plasticity in the different wedge regions. From Figure 10, we see that higher friction angles tend to decrease the extent and intensity of plasticity in the wedge's thick region and strongly favor it in its thin region. When the internal friction angle is high (35°, Model 9), plastic strain is important only in the distal (thin) region of the wedge (Figure 10C). Due to other plasticity parameters being different, these plastic-strain patterns are different from those by Zhou (2020).
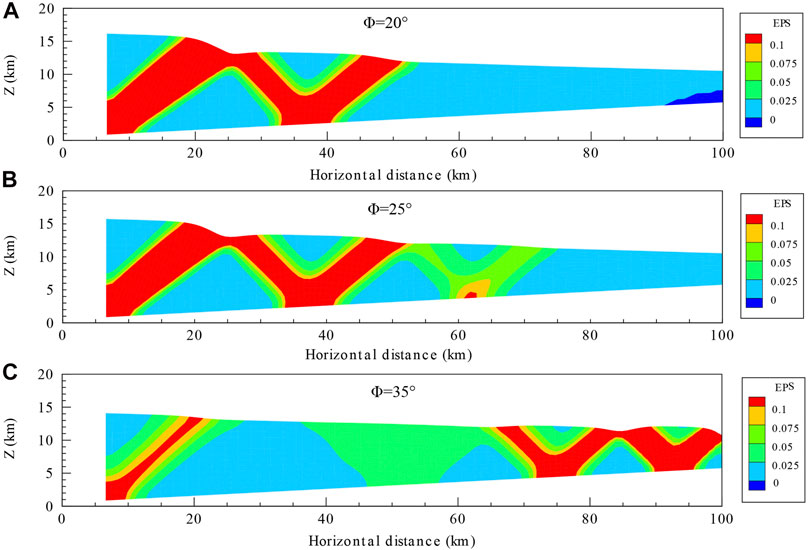
FIGURE 10. Final state EPS for models with different internal friction angles
The friction coefficient of the sliding layer (underlying the wedge) is hard to be determined from observations. We try friction coefficients in 0.1–0.175 while keeping all other parameters as in Model 1 (FC = 0.175).
For ultralow decollement friction coefficient (0.1, Model 10, Figure 11A), the fold-and-thrust belts developed from the thin end to the thick end. Two complete thrusts formed in the thin region, and the plastic strain is close to null near the thick end. With a low friction coefficient (0.125, Model 11, Figure 11B), the deformation also develops from thin to the thick end. However, compared with the friction coefficient of 0.1, the shear bands' positions are different (a shift or phase effect). When the decollement friction coefficient was slightly low (0.15, Model 12, Figure 11C), additional shear bands developed in the wedge, but the plastic strain in the thin region is consistent with that of Model 11 (coefficient of 0.125).
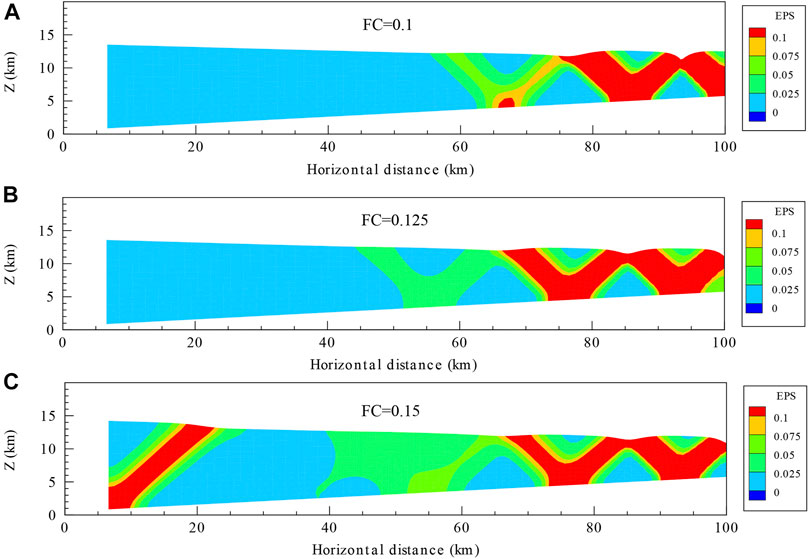
FIGURE 11. Final state EPS for models with different decollement frictional coefficients (FC). After 6.6 km of shortening displacement, panels (A–C) show states of models 10, 11, and 12, which have frictional coefficients (FC) of (0.1, 0.125, 0.15), respectively. Plasticity concentration patterns are rather similar among them, and deformation starts in wedge's thin region. When frictional coefficient is high, an extra zone of plasticity manifests in wedge's thick region.
Our models' patterns of equivalent-plastic-strain concentration zones are different from those by Zhou (2020) for the same friction coefficients. In our models, equivalent-plastic-strain concentration zones are obvious near the thin end.
The depth of the shallow inner-crust decollement layer is an important parameter for the evolution of fold-and-thrust belts in Jiudong Basin and can be observationally determined within uncertainties depending on the different methods, such as geological surveys, seismic receiver functions, deep seismic-reflection profile data, and seismic tomography (Gao et al., 1999, 2013; Zhang et al., 2015; Hu et al., 2019; Huang et al., 2020). Figure 12 shows the sensitivity of the system evolution to the depth of decollement. The depths (H) of the left (at thick end) decollement boundary of Models 13, 1, and 14 in their initial undeformed states are 10, 12.5, and 14 km, respectively. The distributions of plastic strain by the three models are obviously different under the same tectonic shortening of 4.4 km. When the initial depth H is relatively low (10 km, Model 13), important plastic-strain bands manifest in the thin wedge region (Figure 12A). When H is moderate (12.5 km, Model 1), the equivalent plastic strain bands manifest from the thick end to the thin ends of the model (Figure 12B). When H is relatively large (14 km, Model 14), plastic strain manifests only in the wedge's thick region (Figure 12C). Of course, the surface uplift regions are also different for Models 13, 1, and 14 (Figure 12).
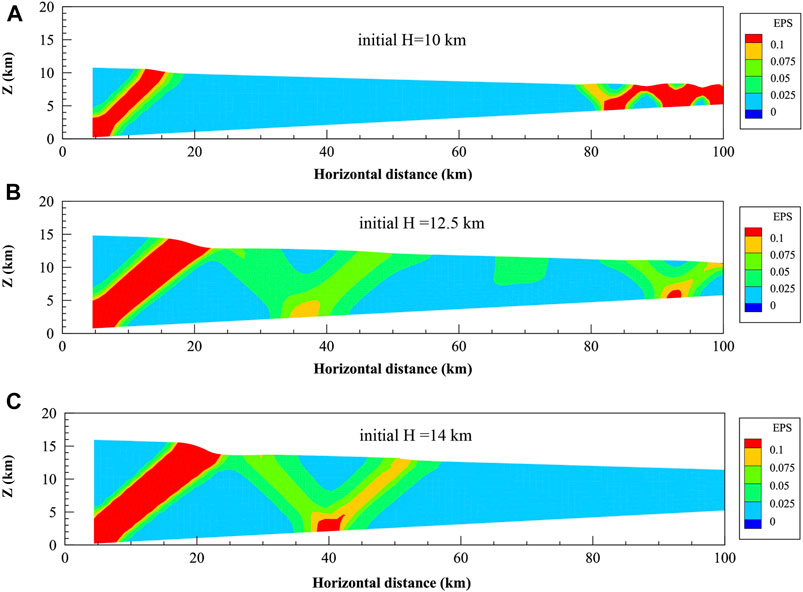
FIGURE 12. Final state EPS for models with different initial decollement depths (H). After 4.4 km of shortening displacement, panels (A–C) show states of models 13, 1, and 14, which started with initial left-end depths of shallow inner-crust decollement of (10, 12.5, and 14) km, respectively (but these left-end depths have become larger after 4.4 km shortening deformation). Plasticity concentration patterns are different among them. All of them exhibit plasticity in wedge thicker region, but important plastic deformation in thinner region manifests only for overall thinner layers (shallow decollement).
Partly answering research question 2, we have found the geometry and plastic parameters of the wedge and the friction coefficient of the basement decollement; all play important roles in the fold-and-thrust belts' spatiotemporal evolution. The diversity of plastic-strain-field outcomes among the 14 models is vast, appreciable, and beyond the intuitive.
The model producing (with 6.6 km of shortening) four main inverse (fault) strain zones, at such respective locations and orientations, in spatial pattern/sequence highly similar to that of real Earth, is not a trivial result. The computed and the real-Earth sequences of inverse faults accommodating the tectonic horizontal shortening can be expressed, in very simple terms, by the dip-angles orientations [north (N) or south (S)] and the inter-faults separations [short (s) or long (L) distance]: (S, s, S, l, N, s, S), with such “long-distance” spanning the proper Jiudong basin and the four fault-orientations as observed. The fact that the model did not show a high (but a low) plastic strain in SYSF (so it is not considered among the main four faults), that it did not show a well-developed (but a faint) pair of faults in the middle of the wedge (which hosts the basin, without faults underneath), that it produced the main four high-strain zones (including the only north-dipping fault of the region, SHSF) like in real Earth, and finally that it did not produce faults in other of the many possible configurations of conjugated inverse faults across the wedge with diverse possible locations and orientations, such as ( S, s, S, l, S, s, N ), ( S, s, N, s, S, l, N, s, S ) (see sensitivity analysis), all of them capable of accommodating the horizontal shortening is a nontrivial result, and it must stem from the choice of regionally adequate material model parameters on a good-enough physico-mathematical description.
Similar comments can be applied to the computed topographic uplift (Figures 4C and 6A), whose spatial pattern to a good degree correlates (Table 4) with the real present-day topography (Figure 1C). Reasonable model representation of the uplift process and/or numerical prediction of enhancing or reinforcing of present-day topography (in the near future) are two possible implications. Regarding computation, continuing the model shortening from 6.6 to 10 km would have likely increased the topographic relief, likely less than proportional with the shortening displacement (as uplift is usually faster at the beginning of a contraction process). The computed relief amplitudes would perhaps have produced overestimates of the real topography, but erosion, unaccounted for in our computations (see Discussion Section 4.4), would certainly lower the topographic peaks. So, we consider that the present elastic-plastic reference model is not unreasonable for the region. The reference model also shows the latest-stage minor uplifting around x = 70 km, accompanied by faint plastic-strain bands in its flanks, but nevertheless, these elements are unobserved in reality. Although it could eventually be considered a “weak” model prediction for future geologic times, we think that this feature is most likely a minor model flaw; see Discussion Section 4.4.
The time dimension of the system is not so precisely represented and simulated by our models, and the initial-condition definition is already part of the challenge. The time sequences (ordering of events, in this case, mountains uplift and plasticity-zones development) are correct (consistent with those in reality), but the (scaled) times are only fairly correlated (see Table 3). Beyond the obvious, highly limited precision of geologic dating from local field observations (see Tables 1 and 3; Figure 5), we can note the following: aside from the well-simulated Qilian Shan range, the observed uplift times of Yumu Shan and Heli Shan ranges are somewhat later than the computed-scaled ones. This could be explained as compared with the homogeneous wedge model; the real wedge is heterogeneous and specifically weaker in the thick region and/or stronger in the thin region, or alternatively, an initially strong real wedge has time-dependent properties with a “late” weakening of the thin regions; perhaps, in any/both of these ways or scenarios, which are geologically possible, active strain lasts for longer in the thick region and awakens later in the thinner regions.
Fourteen numerical models show different and diverse patterns of the spatiotemporal evolution of fold-and-thrust belts in a decollement wedge with adequate parameter values for the region. Model 1 is the reference model, which is relatively consistent with geological and geophysical observations. The calculated plastic-strain concentration zones by Model 1 gradually developed from thick to the thin end of the wedge, nearly resembling the geologic North Qilian Shan Fault, North Yumu Shan Fault, South Heli Shan Fault, and North Jintanan Shan Fault. The simulated time sequence and especially the space intervals between these elements are quite consistent with the geological ones. The calculated surface displacements can reflect the spatiotemporal sequence of three mountain ranges in Jiudong Basin, namely, North Qilian Shan, Yumu Shan, and Heli Shan. The shallow inner-crust decollement layer may have a small frictional coefficient (Panian and Wiltschko, 2004, 2007). In our FEM models, plasticity concentration is considered the diagnostic for faulting, in general, with elastic plasticity and contact laws as key factors in wedge mechanics (Chapple, 1978; Davis et al., 1983; Dahlen and Suppe, 1984; Panian and Wiltschko, 2004, 2007).
Beyond this, the 14 models here explored reveal that due to the nonlinearities of materials and contact friction, the wedge above a decollement may behave following three different main spatiotemporal evolution patterns: Plastic deformation manifesting 1) from the thick end to thin end (a well-known pattern, shown in Models 2, 4, and 8) but also perhaps 2) from the thin end to thick end (e.g., Models 10 and 11) and 3) from the two ends to the middle (e.g., Model 9 and 12).
A cartoon of the three development patterns of fold-and-thrust belts and surface elevations found after our simulations is shown in Figure 13. Figure 13A shows that deformation in the wedge develops from thick end to thin end (Pattern 1, and this is the expected, well-understood pattern always found in studies). Figure 13B shows an opposite evolution pattern, from thin end to thick end (Pattern 2). We find that such a development pattern (from thin to thick) occurs when the decollement is weak, and the uniaxial compressive strength of the tectonic wedge is high (Figure 13B). Figure 13C shows the combination pattern from both sides to the middle (Pattern 3). Fold-and-thrust patterns 2 and 3 are not well-understood and may be rare according to geological observations. The development pattern style of fold-and-thrust belts and mountains in the reference model (likely approximating the real Jiudong Basin, Figures 4 and 5) is most likely similar to Pattern 1, with deformation activating from thick end to thin end (Figure 13A), but combining with some features of Pattern 3 (Figure 13C).
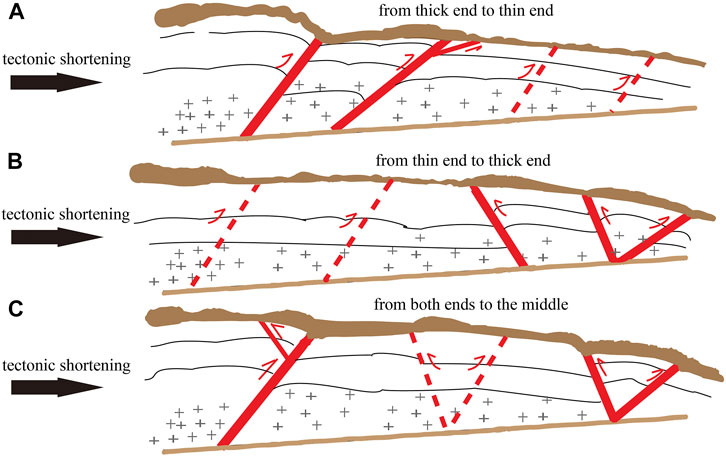
FIGURE 13. Three potential spatiotemporal migration patterns of fold-and-thrust belts and topography, manifesting in a decollement wedge 2D setting based on our numerical models. (A) Pattern 1: deformation migrating from thick end to thin end; (B) Pattern 2: deformation migrating from thin end to thick end; (C) Pattern 3: deformation migrating from both ends to middle. In some models, only one pattern manifests [especially archetypal pattern (A)], whereas, in others, mixes such as (C) seem to be manifesting. Clarifications: deformation can mean localized (yet finite-width) internal plastic strain and also topographic surface deformation.
Tectonic motions, climate character, and variability influence the solid-surface erosion and, in general, the physical evolution of fold-and-thrust belts as in a thin wedge above a decollement layer (e.g., Molnar and England, 1990; Zhang et al., 2001). As an example, glaciers and snow currently exist in Qilian Shan mountainous regions above ∼4,000 m.a.s.l., indicating that glacial/fluvial erosion has been influencing the development of the regional topography (Pang et al., 2019).
Erosion and surface mass transport have been neglected in our models, and this is a simplification of physical reality. Now, we will try to briefly assess these effects on our simulations.
During the wedge horizontal contraction, erosion (chemical–mechanical weathering) would remove mass from the growing concave highlands and, by transport (glacio-fluvio-eolic), would deposit it in the deforming convex lowlands. This mass redistribution implies alterations in the inner-wedge lithostatic pressure field.
The present-day Jiudong Basin (Figure 1) is flanked by the high relief of NQS (1300), YS (800), and HS (300) (in meters with respect to the basin); its sedimentary lowlands lie mostly in between the YS and HS, in the model coordinate range 30 km < x < 80 km. Observations of sedimentary thickness are very poor for the area. Seismic observations mostly constrain the depth of the decollement, which increases from approximately 5 km under HS to approximately 13 km under QS. In almost all geological scenarios, mountain ranges and basements are composed of denser, stronger materials (higher mass densities and elastic-plastic moduli) than those of the basins' sediments. Here, we consider mostly a sedimentary lenticular-shaped body confined between YS and HS, with a thickness of likely <3 km. In model calculations, there is a trade-off between the thickness of the layer and its mechanical properties because, in reality, the deeper, the denser and stronger the materials are. Real sediments (up to consolidated yet not lithified, in the depth range 0–3 km) may be heterogeneous and span the rough density range 1.6–2.2 g/cm3. On the other hand, our wedge model considers compressible rock density values in 2.5–2.53 g/cm3. For mechanical moduli, the contrast basement vs. sediments is larger; for example, Young's modulus and UCS can be several orders of magnitude smaller on sediments; in particular, UCS can be ∼0 in sediments and finite-valued in rocks. So, mechanical properties' contrasts between sediments and country rocks are huge. As a consequence, basin sediments (light and weak) can barely transmit the inner-wedge-rock shear stresses.
During tectonic horizontal shortening and erosion, the stress-tensor field evolves inside the wedge. We can estimate changes in lithostatic pressure stemming from the surface mass redistribution. Changes in lithostatic pressure signify changes in the threshold for plasticity: plastic strain occurs when/where shear stresses surpass a threshold value, and this value increases with pressure. With eroding mass relocating from one original (high) region to a new (low) region of the surface, the lithostatic pressure decreases under the original region and increases under the new region. Therefore, in a horizontal contraction scenario, the expected effects of erosion are to increase plasticity intensity and extent in the decompressing highlands and to decrease it in the compressing lowlands, although these effects are superimposed to tectonic deformation. Although plasticity is nonlinear, these erosion effects on inner-wedge plasticity should not be very important in the Jiudong Basin system, at least in principle due to the huge contrast in mechanical properties of sediments versus the inner wedge and highlands. Secondarily and in particular, our reference simulation shows little plasticity in the coordinate range 50–80 km, roughly where (and under) the basin is located (Figure 4). Thus, moving sediments into that area would even further limit the extent and intensity of local plasticity at depth. Thus, correcting for this would prove to be only a tiny effect, perhaps at most a second-order correction in that simulation. Surely, this could hamper the development of the faint conjugated-plastic zones in that particular area, which we already commented as a model flaw, inasmuch as they have not been observationally confirmed.
Reasonable maximum lithostatic-pressure changes that could be conceived for the system due to erosion are given considering the maximum sediment thickness in the basin, to be a relocation from the NQS-YS and HS highlands (a process that may have taken roughly ∼10 Ma). The maximum sediments overpressure may be of approximately ΔP ∼ ρs·g·hs ∼ 1,900 × 9.8 × 3,000–56 MPa, although local sediments' mass density and thickness are poorly known.
In the Drucker–Prager plasticity criterion (see Appendix SB)
where P = -I1/3, altering P to P + ΔP (here simply assuming a lithostatic approximation) implies altering the limiting stress-deviator invariant √J2. From our reference model, UCS = 110 MPa and friction angle φ = 30°, and referring to Sivakugan et al. (2014), Alejano and Bobet (2012), and Drucker and Prager (1952), we can estimate the material constants k, a; leading to the approximation
Therefore, the sediment overpressure contribution of ΔP = 56 MPa implies a differential of threshold deviatoric stress Δ√J2 ∼ 41 MPa, which could increase (in the receiving lowlands) or decrease (in the eroding highlands) the threshold for plasticity. This maximum differential of plasticity threshold (41 MPa) can be compared with the system extreme values of plasticity threshold itself: Min: 28.6 MPa (the uncompressed threshold, present roughly at the surface), Max: 267 MPa (at the wedge's left-bottom corner in the contracted state), although the effective maximum is higher, easily above 300 MPa, due to the pressure increase from horizontal contraction/compression. These are the characteristic values that ought to be considered in this problem. The variation in plasticity threshold due to surface mass transport can be non-negligible at shallow depths but only marginal approaching the decollement.
For the reference simulation, increasing plasticity under the eroding highlands (NQS-YS, HS) would imply more intense and extended plasticity in the already plastified four zones of the simulation exhibits and, simultaneously, a decrease in plasticity under the sediment-receiving basin itself, where plasticity is already very limited. As for the other 13 simulations (sensitivity analysis), we can again say that in the presence of surface mass transport, plasticity should be higher in the zones that already exhibit high computed plastic strain (because above these, there is usually uplift and thus subsequent erosion) and lower under the lowlands. So the effect of surface mass transport in general (for short-term processes like ours) would act as a reinforcement/enhancement of the plasticity patterns we have. In an extreme case, plasticity inhibition under a sediment-receiving convex lowland could perhaps hinder the propagation or migration of plasticity across the region; however, as shown in the sensitivity analysis, several simulations display plasticity in both the thick and thin regions without a connection in/across the middle regions, which means that sole, elastic stress transfers may suffice in the pattern definition.
The previous arguments, examples, and theoretical estimates suggest that erosion and surface mass transport should not produce major dynamical effects in our system and most likely would not invalidate the conclusions here drawn.
Based on observations of geological structures, geochronological dating, surface deformation, seismic tomography, and seismic-reflection profile data, we carried out and evaluated 2D FEM elastic-plastic models of Jiudong Basin on the northern margin of Qilian Shan, Qinghai–Tibetan Plateau. We studied the temporal and spatial evolution of the fold-and-thrust belts and surface deformation in the Jiudong Basin for the recent and present geologic time. From a series of 14 numerical-simulation experiments, the following conclusions are drawn:
1) Under the combined action of gravity, tectonic horizontal shortening, and bottom frictional slippage, the reference-model simulated equivalent-plastic-strain zones are in good agreement with the temporal behavior and particularly the spatial locations orientations of four real thrust faults in Jiudong Basin, namely, North Qilian-Shan Fault, North Yumu-Shan Fault, South Heli-Shan Fault, and North Jintanan-Shan Fault. Also, the simulated surface deformation (time-dependent 2D dynamic topography) can explain the observed successive uplifts of North Qilian Shan, Yumu Shan, and Heli Shan and perhaps their short-term future reinforcement.
2) Our sensitivity analysis reveals that the wedge's uniaxial compressive strength, internal friction angle, and top and bottom surfaces' angles, as well as the underlying decollement friction coefficient, all have important influences on the spatiotemporal evolution of fold-and-thrust belts, especially in the location, extent, and intensity of the plastic-deformation regions and surface topography. Our numerical simulations suggest that a wedge above a decollement layer may exhibit three main spatiotemporal evolution patterns of fold-and-thrust belts: Plastic deformation migrating from 1) thick to thin end, 2) thin to thick end, and 3) from both ends to middle. This is so specific regarding the appearance, manifestation, and migration directions of high-plastic-strain zones.
3) Thin-skinned horizontal contractional deformation by Jiudong Basin-decollement further sliding seems likely to continue with time. Continuing plastic strain and faulting occurring in new regions or intensifying in active regions (in the “wedge”) may well signify the further upthrust of fault-bounded blocks in the Jiudong Basin area and vicinity. Not having all of this would necessitate an unlikely 1) halt in tectonic convergence or 2) lateral extrusion of blocks. Therefore, with time (at least for a few Ma), it may well be plausible to have further uplift and horizontal growth of currently small mountain ranges like Heli Shan, which could signify a continued (perhaps attenuating) growth of the fringes of the Qinghai–Tibetan plateau.
The original contributions presented in the study are included in the article/Supplementary Material; further inquiries can be directed to the corresponding author.
QC and CH designed this manuscript; QC built the model and wrote the manuscript; FO-R and CH checked the manuscript and geological interpretation; LZ, HZ, and YS jointly modified and approved the manuscript; CH oversaw this study.
This research was financially supported by the National Science Foundation of China (42074117) and supported by the Fundamental Research Funds for the Central Universities.
The authors declare that the research was conducted in the absence of any commercial or financial relationships that could be construed as a potential conflict of interest.
All claims expressed in this article are solely those of the authors and do not necessarily represent those of their affiliated organizations or those of the publisher, the editors, and the reviewers. Any product that may be evaluated in this article, or claim that may be made by its manufacturer, is not guaranteed or endorsed by the publisher.
We thank professors Yongen Cai, Yuanze Zhou, and Pengpeng Huangfu, who gave some constructive suggestions on the numerical simulations. We would like to thank the reviewers for their thoughtful comments and efforts toward improving our manuscript. We are very grateful that Figure 1 was generated with the General Mapping Tools software (Wessel and Smith, 1995) with the help of Dr. Yujiang Li. The finite element modeling was carried out using the software ABAQUS version 6.16.
Alejano, L. R., and Bobet, A. (2012). Drucker-Prager Criterion. Rock Mech. Rock Eng. 45, 995–999. doi:10.1007/s00603-012-0278-2
Barnichon, J. D., and Charlier, R. (1996). Finite Element Modelling of the Competition between Shear Bands in the Early Stages of Thrusting: Strain Localization Analysis and Constitutive Law Influence. Geol. Soc. Lond. Spec. Publications 99, 235–250. doi:10.1144/gsl.sp.1996.099.01.18
Beaumont, C., Jamieson, R. A., Nguyen, M. H., and Lee, B. (2001). Himalayan Tectonics Explained by Extrusion of a Low-Viscosity Crustal Channel Coupled to Focused Surface Denudation. Nature 414, 738–742. doi:10.1038/414738a
Bi, H., Zheng, W., Ge, W., Zhang, P., Zeng, J., and Yu, J. (2018). Constraining the Distribution of Vertical Slip on the South Heli Shan Fault (Northeastern Tibet) from High-Resolution Topographic Data. J. Geophys. Res. Solid Earth 123, 2484–2501. doi:10.1002/2017JB014901
Bose, S., Mandal, N., Mukhopadhyay, D. K., and Mishra, P. (2009). An Unstable Kinematic State of the Himalayan Tectonic Wedge: Evidence from Experimental Thrust-Spacing Patterns. J. Struct. Geology. 31, 83–91. doi:10.1016/j.jsg.2008.10.002
Bovet, P. M., Ritts, B. D., Gehrels, G., Abbink, A. O., Darby, B., and Hourigan, J. (2009). Evidence of Miocene Crustal Shortening in the North Qilian Shan from Cenozoic Stratigraphy of the Western Hexi Corridor, Gansu Province, China. Am. J. Sci. 309, 290–329. doi:10.2475/00.4009.02
Buiter, S. J. H. (2012). A Review of Brittle Compressional Wedge Models. Tectonophysics 530-531, 1–17. doi:10.1016/j.tecto.2011.12.018
Buiter, S. J. H., Schreurs, G., Albertz, M., Gerya, T. V., Kaus, B., Landry, W., et al. (2016). Benchmarking Numerical Models of Brittle Thrust Wedges. J. Struct. Geology. 92, 140–177. doi:10.1016/j.jsg.2016.03.003
Chapple, W. M. (1978). Mechanics of Thin-Skinned Fold-And-Thrust Belts. Geol. Soc. America Bull. 89, 1189–1198. doi:10.1130/0016-7606(1978)89<1189:motfb>2.0.co;2
Chen, G., Zheng, W., Wang, X., Zhang, P., Xiong, J., Yu, J., et al. (2017). Present Kinematics Characteristics of the Northern Yumushan Active Fault and its Response to the Northeastward Growth of the Tibetan Plateau, [in Chinese]. Seismology Geology. 39 (5), 871–888. doi:10.3969/j.issn.0253-4967.2017.05.001
Chen, J., Wyrwoll, K. H., Lu, Y. C., Krapez, B., Wan, J. L., and Liu, J. F. (2006). Magneto-chronology of the Yumen Conglomerates and Multi-Pulsed Folding and Thrusting in the Northern Qilian Shan [in Chinese]. Quat. Sci. 26, 20–31.
Cubas, N., Leroy, Y. M., and Maillot, B. (2008). Prediction of Thrusting Sequences in Accretionary Wedges. J. Geophys. Res. 113, B12412. doi:10.1029/2008jb005717
Dahlen, F. A. (1990). Critical Taper Model of Fold-And-Thrust Belts and Accretionary Wedges. Annu. Rev. Earth Planet. Sci. 18, 55–99. doi:10.1146/annurev.ea.18.050190.000415
Dahlen, F. A., and Suppe, J. (1984). Mechanics of Fold-And-Thrust Belts and Accretionary Wedges: Cohesive Coulomb Theory. J. Geophys. Res. 89, 100087–110101. doi:10.1029/jb089ib12p10087
Davis, D., Suppe, J., and Dahlen, F. A. (1983). Mechanics of Fold-And-Thrust Belts and Accretionary Wedges. J. Geophys. Res. 88, 1153–1172. doi:10.1029/jb088ib02p01153
Dean, S. L., Morgan, J. K., and Fournier, T. (2013). Geometries of Frontal Fold and Thrust Belts: Insights from Discrete Element Simulations. J. Struct. Geology. 53, 43–53. doi:10.1016/j.jsg.2013.05.008
Department of Earthquake Disaster Prevention, China Earthquake Administration (1999). The Catalogue of Chinese Modern Earthquakes. Beijing: China Science and Tech-nology Press, 1–637.
Department of Earthquake Disaster Prevention, State Seismological Bureau (1995). The Catalogue of Chinese Historical Strong Earthquakes. Beijing: Seismological Press, 1–529.
Driehaus, L., Thierry, N., and Jean-Francois, B. (2014). Interaction between Deformation and Sedimentation in a Multidecollement Thrust Zone: Analogue Modelling and Application to the Sub-andean Thrust belt of Bolivia. J. Struct. Geology. 65, 59–68.
Drucker, D. C., and Prager, W. (1952). Soil Mechanics and Plastic Analysis or Limit Design. Quart. Appl. Math. 10 (2), 157–165. doi:10.1090/qam/48291
Fang, X., Liu, D., Song, C., Dai, S., and Meng, Q. (2012). Oligocene Slow and Miocene-Quaternary Rapid Deformation and Uplift of the Yumu Shan and North Qilian Shan: Evidence from High-Resolution Magnetostratigraphy and Tectonosedimentology. Geol. Soc. Lond. Spec. Publications 373, 149–171. doi:10.1144/SP373.5
Fang, X., Zhao, Z. J., Li, J. J., Yan, M. D., Pan, B. T., Song, C. H., et al. (2005). Magnetostratigraphy of the Late Cenozoic Laojunmiao Anticline in the Northern Qilian Mountains and its Implications for the Northern Tibetan Plateau Uplift. Sci. China Ser. D 48, 1040–1051. doi:10.1360/03yd0188
Fillon, C., Huismans, R. S., and van der Beek, P. (2013). Syntectonic Sedimentation Effects on the Growth of Fold-And-Thrust Belts. Geology 41, 83–86. doi:10.1130/g33531.1
Gao, R., Wang, H., Yin, A., Dong, S., Kuang, Z., Zuza, A. V., et al. (2013). Tectonic Development of the Northeastern Tibetan Plateau as Constrained by High-Resolution Deep Seismic-Reflection Data. Lithosphere 5, 555–574. doi:10.1130/L293.1
Granado, P., and Ruh, J. B. (2019). Numerical Modelling of Inversion Tectonics in Fold-And-Thrust Belts. Tectonophysics 763, 14–29. doi:10.1016/j.tecto.2019.04.033
Guo, B., Chen, J. H., Chen, J., Liu, Q., and Li, S. (2019). Crustal Structure beneath the Qilian Orogen Zone from Multiscale Seismic Tomography. Earth Planet. Phys. 3 (2), 232–242. doi:10.26464/epp2019025
Hardy, S., McClay, K., and Anton Muñoz, J. (2009). Deformation and Fault Activity in Space and Time in High-Resolution Numerical Models of Doubly Vergent Thrust Wedges. Mar. Pet. Geology. 26, 232–248. doi:10.1016/j.marpetgeo.2007.12.003
Hu, X., Chen, D., and Pan, B. (2019). Sedimentary Evolution of the Foreland basin in the NE Tibetan Plateau and the Growth of the Qilian Shan since 7 Ma. Geol. Soc. America Bull. 2019, B35106.1. doi:10.1130/b35106.1
Hu, Y., and Wang, K. (2006). Bending-like Behavior of Thin Wedge-Shaped Elastic Fault Blocks. J. Geophys. Res. 111 (B06409), a–n. doi:10.1029/2005JB003987
Hu, Y., and Wang, K. (2008). Coseismic Strengthening of the Shallow Portion of the Subduction Fault and its Effects on Wedge Taper. J. Geophys. Res. 113 (B12411), 5724. doi:10.1029/2008JB005724
Huang, X. F., Gao, R., Guo, X. Y., Li, W., and Xiong, X. (2018). Deep Crustal Structure beneath the junction of the Qilian Shan and Jiuxi Basin in Thenortheastern Margin of the Tibetan Plateau and its Tectonic Implications. Chin. J. Geophys. (in Chinese) 61 (9), 3640–3650. doi:10.6038/cjg2018L0632
Huang, X., Xu, X., Gao, R., Guo, X., and Li, W. (2020). Shortening of Lower Crust beneath the NE Tibetan Plateau. J. Asian Earth Sci. 198, 104313. doi:10.1016/j.jseaes.2020.104313
Li, Q., Liu, M., and Zhang, H. (2009). A 3-D Viscoelastoplastic Model for Simulating Long-Term Slip on Non-planar Faults. Geophys. J. Int. 176 (1), 293–306. doi:10.1111/j.1365-246x.2008.03962.x
Li, Y., and Yang, J. (1998). Tectonic Geomorphology in the Hexi Corridor, north‐west China. Basin Res. 10, 345–352. doi:10.1046/j.1365-2117.1998.00070.x
Liu, D., Fang, X., Song, C., Dai, S., Zhang, T., Zhang, W., et al. (2010). Stratigraphic and Paleomagnetic Evidence of Mid-pleistocene Rapid Deformation and Uplift of the NE Tibetan Plateau. Tectonophysics 486, 108–119. doi:10.1016/j.tecto.2010.01.014
Liu, D., Yan, M., Fang, X., Li, H., Song, C., and Dai, S. (2011). Magnetostratigraphy of Sediments from the Yumu Shan, Hexi Corridor and its Implications Regarding the Late Cenozoic Uplift of the NE Tibetan Plateau. Quat. Int. 236, 13–20. doi:10.1016/j.quaint.2010.12.007
Mäkel, G., and Walters, J. (1993). Finite-element Analyses of Thrust Tectonics: Computer Simulation of Detachment Phase and Development of Thrust Faults. Tectonophysics 226, 167–185. doi:10.1016/0040-1951(93)90116-2
Meng, Q., and Hodgetts, D. (2019). Structural Styles and Decoupling in Stratigraphic Sequences with Double Décollements during Thin-Skinned Contractional Tectonics: Insights from Numerical Modelling. J. Struct. Geology. 103862 (127), 1–13.
Métivier, F., Gaudemer, Y., Tapponnier, P., and Meyer, B. (1998). Northeastward Growth of the Tibet Plateau Deduced from Balanced Reconstruction of the Two Areas: The Qaidam and Hexi Corridor Basins, China. Tectonics 17, 823–842.
Molnar, P., and England, P. (1990). Late Cenozoic Uplift of Mountain Ranges and Global Climate Change: Chicken or Egg? Nature 346 (6279), 29–34. doi:10.1038/346029a0
Nassif, F. S., Canelo, H., Davila, F., and Ezpeleta, M. (2019). Constraining Erosion Rates in Thrust Belts: Insights from Kinematic Modeling of the Argentine Precordillera, Jachal Section. Tectonophysics 758, 1–11. doi:10.1016/j.tecto.2019.03.012
Palumbo, L., Hetzel, R., Tao, M., Li, X., and Guo, J. (2009). Deciphering the Rate of Mountain Growth during Topographic Presteady State: An Example from the NE Margin of the Tibetan Plateau. Tectonics 28, a–n. doi:10.1029/2009TC002455
Pang, J., Yu, J., Zheng, D., Wang, Y., Zhang, H., Li, C., et al. (2019). Constraints of New Apatite Fission-Track Ages on the Tectonic Pattern and Geomorphic Development of the Northern Margin of the Tibetan Plateau. J. Asian Earth Sci. 181, 103909. doi:10.1016/j.jseaes.2019.103909
Panian, J., and Wiltschko, D. (2007). Ramp Initiation and Spacing in a Homogeneous Thrust Wedge. J. Geophys. Res. 112, B05417. doi:10.1029/2004JB003596
Panian, J., and Wiltschko, D. (2004). Ramp Initiation in a Thrust Wedge. Nature 427, 624–627. doi:10.1038/nature0233510.1038/nature02334
Ranalli, G. (1997). Rheology of the Lithosphere in Space and Time. Geol. Soc. Lond. Spec. Publications 121 (1), 19–37. doi:10.1144/gsl.sp.1997.121.01.02
Rudnicki, J. W., and Rice, J. R. (1975). Conditions for the Localization of Deformation in Pressure-Sensitive Dilatant Materials. J. Mech. Phys. Sol. 23, 371–394. doi:10.1016/0022-5096(75)90001-0
Ruh, J. B., Gerya, T., and Burg, J.-P. (2017). Toward 4D Modeling of Orogenic Belts: Example from the Transpressive Zagros Fold Belt. Tectonophysics 702, 82–89. doi:10.1016/j.tecto.2015.09.035
Ruh, J. B., Gerya, T., and Burg, J. P. (2013). High-resolution 3D Numerical Modeling of Thrust Wedges. Geochem. Geophys. Geosystems 4 (14), 1155.
Ruh, J. B., Kaus, B. J. P., and Burg, J. P. (2012). Numerical Investigation of Deformation Mechanics in Fold-And-Thrust Belts: Influence of Rheology of Single and Multiple Décollements. Tectonics 31, TC3005. doi:10.1029/2011tc003047
Rui, G., Xiangzhou, C., and Gongjian, W. (1999). “Lithospheric Structure and Geodynamic Model of the Golmud-Ejin Transect in Northern Tibet,” in Himalaya and Tibet: Mountain Roots to Mountain Tops: Geological Society of America, Special Paper. Editors A. Macfarlene, R. B. Sorkhabi, and J. Quade, 328, 9–17. doi:10.1130/0-8137-2328-0.9
Schreurs, G., Buiter, S. J. H., Boutelier, J., Burberry, C., Callot, J.-P., Cavozzi, C., et al. (2016). Benchmarking Analogue Models of Brittle Thrust Wedges. J. Struct. Geology. 92, 116–139. doi:10.1016/j.jsg.2016.03.005
Seong, Y. B., Kang, H.-C., Ree, J.-H., Choi, J.-H., Lai, Z., Long, H., et al. (2011). Geomorphic Constraints on Active Mountain Growth by the Lateral Propagation of Fault-Related Folding: A Case Study on Yumu Shan, NE Tibet. J. Asian Earth Sci. 41, 184–194. doi:10.1016/j.jseaes.2011.01.015
Sivakugan, N., Das, B. M., Lovisa, J., and Patra, C. R. (2014). Determination Ofcandφof Rocks from Indirect Tensile Strength and Uniaxial Compression Tests. Int. J. Geotechnical Eng. 8 (1), 59–65. doi:10.1179/1938636213Z.00000000053
Snavely, P. D., Wagner, H. C., and Lander, D. L. (1980). Geologic Cross Section of the central Oregon continental Margin. Geol. Soc. Am. Map Chart Ser., MC-28J.
Storti, F., Salvini, F., and McClay, K. (2000). Synchronous and Velocity-Partitioned Thrusting and Thrust Polarity Reversal in Experimentally Produced, Doubly-Vergent Thrust Wedges: Implications for Natural Orogens. Tectonics 19 (2), 378–396. doi:10.1029/1998tc001079
Suppe, J. (1980). A Retrodeformable Cross Section of Northern Taiwan. Geol. Soc. China Proc. 23, 46–55.
Tapponnier, P., Meyer, B., Avouac, J. P., Peltzer, G., Gaudemer, Y., Shunmin, G., et al. (1990). Active Thrusting and Folding in the Qilian Shan, and Decoupling between Upper Crust and Mantle in Northeastern Tibet. Earth Planet. Sci. Lett. 97, 382–403. doi:10.1016/0012-821x(90)90053-z
Tapponnier, P., Zhiqin, X., Roger, F., Meyer, B., Arnaud, N., Wittlinger, G., et al. (2001). Oblique Stepwise Rise and Growth of the Tibet Plateau. Science 294, 1671–1677. doi:10.1126/science.105978
Treagus, S. H. (2003). Viscous Anisotropy of Two-phase Composites, and Applications to Rocks and Structures. Tectonophysics 372 (3), 121–133. doi:10.1016/s0040-1951(03)00239-7
Wang, K., and Hu, Y. (2006). Accretionary Prisms in Subduction Earthquake Cycles: The Theory of Dynamic Coulomb Wedge. J. Geophys. Res. 111 (B06410), a–n. doi:10.1029/2005JB004094
Wang, M., and Shen, Z. K. (2020). Present‐Day Crustal Deformation of Continental China Derived from GPS and its Tectonic Implications. J. Geophys. Res. Solid Earth 125, e2019JB018774. doi:10.1029/2019JB018774
Wang, W., Zheng, D., Li, C., Wang, Y., Zhang, Z., Pang, J., et al. (2020). Cenozoic Exhumation of the Qilian Shan in the Northeastern Tibetan Plateau: Evidence from Low‐Temperature Thermochronology. Tectonics 39, e2019TC005705. doi:10.1029/2019TC005705
Wang, Y., Zheng, D., Pang, J., Zhang, H., Wang, W., Yu, J., et al. (2018). Using Slope-Area and Apatite Fission Track Analysis to Decipher the Rock Uplift Pattern of the Yumu Shan: New Insights into the Growth of the NE Tibetan Plateau. Geomorphology 308, 118–128. doi:10.1016/j.geomorph.2018.02.006
Wessel, P., and Smith, W. H. F. (1995). New Version of the Generic Mapping Tools. Eos Trans. AGU 76, 329. doi:10.1029/95EO00198
White, R. S., and Ross, D. A. (1979). Tectonics of the Western Gulf of Oman. J. Geophys. Res. 84, 3479–3489. doi:10.1029/jb084ib07p03479
Yang, J., Zheng, W., Wang, Y., Bi, H., Zhang, D., Zhang, P., et al. (2020). Quantitative Geomorphological Constraints on the Landform Evolution of the Current Active Boundary of the Northeastern Tibetan Plateau. Geomorphology 358, 107120. doi:10.1016/j.geomorph.2020.107120
Yin, A. (1993). Mechanics of Wedge-Shaped Fault Blocks: 1. An Elastic Solution for Compressional Wedges. J. Geophys. Res. 98 (B8), 14245–14256. doi:10.1029/93jb00555
Yin, A. (1994). Mechanics of Wedge-Shaped Fault Blocks: 2. An Elastic Solution for Extensional Wedges. J. Geophys. Res. 99 (B4), 7045–7055. doi:10.1029/93jb02389
Y. Ohta, and C. Akiba (Editors) (1973). Geology of the Nepal Himalayas (Saporro, Japan: Himalayan Committee of Hokkaido University), 286.
You, Z., Zhong, Z., and Zhou, H. (2001). The Role of Fluid Flow during Regional Metamorphism, [in Chinese]. Earth Sci. Front. 8 (3), 157–164. doi:10.3321/j.issn:1005-2321.2001.03.018
Yuan, D. Y., Ge, W. P., Chen, Z. W., Li, C. Y., Wang, Z. C., Zhang, H. P., et al. (2013). The Growth of Northeastern Tibet and its Relevance to Large‐scale continental Geodynamics: A Review of Recent Studies. Tectonics 32, 1358–1370. doi:10.1002/tect.20081
Zhang, H. S., Gao, R., Tian, X. B., Teng, J. W., Li, Q. S., Ye, Z., et al. (2015). Crustal S Wave Velocity beneath the Northeastern Tibetan Plateau Inferred from Teleseismic P Wave Receiver Functions, [in Chinese]. Chin. J. Geophys. 58 (11), 3982–3992. doi:10.6038/cjg20151108
Zhang, H., Zhang, P., Prush, V., Zheng, D., Zheng, W., Wang, W., et al. (2017). Tectonic Geomorphology of the Qilian Shan in the Northeastern Tibetan Plateau: Insights into the Plateau Formation Processes. Tectonophysics 706-707, 103–115. doi:10.1016/j.tecto.2017.04.016
Zhang, P. Z., Molnar, P., and Downs, W. R. (2001). Increased Sedimentation Rates and Grain Sizes 2–4 Myr Ago Due to the Influence of Climate Change on Erosion Rates. Nature 410 (6831), 891.
Zhang, Z., Zhang, H., Wang, L., Cheng, H., and Shi, Y. (2019). Late Cenozoic Structural Deformation and Evolution of the central-southern Longmen Shan Fold-And-Thrust belt, China: Insights from Numerical Simulations. J. Asian Earth Sci. 176, 88–104. doi:10.1016/j.jseaes.2019.01.026
Zheng, D., Clark, M. K., Zhang, P., Zheng, W., and Farley, K. A. (2010). Erosion, Fault Initiation and Topographic Growth of the North Qilian Shan (Northern Tibetan Plateau). Geosphere 6 (6), 937–941. doi:10.1130/GES00523.1
Zheng, D., Wang, W., Wan, J., Yuan, D., Liu, C., Zheng, W., et al. (2017). Progressive Northward Growth of the Northern Qilian Shan-Hexi Corridor (Northeastern Tibet) during the Cenozoic. Lithosphere 9, 408–416. doi:10.1130/L587.1
Zheng, W.-J., Hui-Ping, Z., Pei-Zhen, Z., Molnar, P., Xing-Wang, L., and Dao-Yang, Y. (2013b). Late Quaternary Slip Rates of the Thrust Faults in Western Hexi Corridor (Northern Qilian Shan, China) and Their Implications for Northeastward Growth of the Tibetan Plateau. Geosphere 9 (2), 342–354. doi:10.1130/GES00775.1
Zheng, W.-J., Zhang, P.-Z., Ge, W.-P., Molnar, P., Zhang, H.-P., Yuan, D.-Y., et al. (2013a). Late Quaternary Slip Rate of the South Heli Shan Fault (Northern Hexi Corridor, NW China) and its Implications for Northeastward Growth of the Tibetan Plateau. Tectonics 32, 271–293. doi:10.1002/tect.20022
Zhou, L. S. (2020). “Geodynamic Numerical Simulation of Fold and Thrust Belts in the Northeastern Margins of the Qinghai-Tibetan Plateau, [in Chinese],”, 54–69. Doctoral dissertation.
Zhou, L. S., Liu, X. Y., Hu, C. B., Meng, Q., Zhang, H., and Shi, Y. (2019). Numerical Simulation of the Dynamic Process of Spatial and Temporal Evolution for Fold-Thrust Belts, [in Chinese]. Chin. J. Geophys. 62 (7), 2466–2476. doi:10.6038/cjg2019M0567
Zhuang, G., Hourigan, J. K., Ritts, B. D., and Kent-corson, M. L. (2011). Cenozoic Multiple-phase Tectonic Evolution of the Northern Tibetan Plateau: Constraints from Sedimentary Records from Qaidam basin, Hexi Corridor, and Subei basin, Northwest China. Am. J. Sci. 311, 116–152. doi:10.2475/02.2011.02
Zuza, A. V., Chen, W., Reith, R. C., Yin, A., Li, J., Zhang, J., et al. (2018). Tectonic Evolution of the Qilian Shan: An Early Paleozoic Orogen Reactivated in the Cenozoic[J]. Geol. Soc. America Bull. 130 (5–6), 881–925. doi:10.1130/b31721.1
1) Reference Normal stress: We calculate the final-state lithostatic column-weight (function of x) and project that onto the decollement surface (3°).In the initial undeformed state (density 2.5 g/cc), the vertical ‘pressure’ is
Pinitial(x) = Pinitial(0) + (dPinitial/dx)·x with x in [0,100] km
Considering P(x) = ρ·g·h(x), h(0) = 12.5 km, h(100)=4.64 km, g=9.8 m/s2, Pinitial(0)=306.3 MPa, Pinitial(100)=113.7 MPa, dPinitial/dx= -1.9257 MPa/km.
For the final state, we assume a homogeneously-deformed wedge, for which we know its final horizontal length of (100 - 6.6) km = 93.4 km; with its final density, higher than the initial, being constant in space.
The vertical thickening of the wedge is a function of the Poisson’s ratio (compressibility), but given that the final horizontal length is fixed, the lithostatic-column weight is independent of how high (by deformation) the column is, as its total mass is the same. The mass of a unit-basal-area column has increased here in time only due to horizontal convergence. Thus, the final lithostatic-column weight is simply:
Pfinal(x’) = Pinitial(x) (100 / 93.4) ( with 100/93.4 = Li/Lf = 1/ (1+ Strainxx)),
where x’ is the homogeneously-deformed horizontal coordinate.
We refer our plots to the initial coordinates, thus the transformation can be omitted.
Thus, the final reference will be refσn(x) = Pfinal(x)·cos(3°) (plotted in Figure 7 (upper) ) with extreme values: refσn(0) = 327.4 MPa, refσn(100) = 121.5 MPa.
2) Reference Shear stress: For a given normal stress σn, the Coulomb failure criterion gives the threshold shear-stress above which sliding occurs:
τthresh(x) = FC·σn(x)
In our simulations, we assume the displacement at the boundary, the whole displacement and deformation fields, to be quasi-static (negligible velocity); and we hypothesize that the actual dynamic decollement-shear-stress, at any time, can not be too different from the Coulomb sliding threshold. This latter threshold stress will be our reference τref.
Taking the linear reference normal stress refσn from the previous subsection, then the reference shear stress is simply according to the Coulomb formula. This is plotted in Figure 7 (lower).
The resultant extreme values are:
τref(0)= 57.3 MPa , τref(100)= 21.3 MPa.
Mechanical equilibrium
where σ : stress tensor, ρ : mass-density, g : gravity; solved with the specific boundary conditions (particular conditions for each boundary) detailed in the text.
The strain tensor field ε, function of the displacement field u, will be the superposition of elastic and plastic contributions
which (as in our study) for isotropic materials and using the Young’s modulus E, Poisson’s ratio ν and elastic matrix D will take the particular simplified tensor form
Drucker-Prager plasticity criterion
where
The Equivalent Plastic Strain is computed in general as
These are the main equations employed by ABAQUS software in the elastic-plastic calculations. For more details the reader is suggested to refer to, Drucker and Prager (1952), Rudnicki and Rice (1975), Hibbitt et al. (1997)
Keywords: Jiudong basin, fold-and-thrust belts, finite-element model, elasto-plasticity, frictional decollement
Citation: Chen Q, Hu C, Orellana-Rovirosa F, Zhou L, Zhang H and Shi Y (2022) Numerical Constraints on Folding and Thrusting in Jiudong Basin: Implication for the Northeastward Growth of Qinghai–Tibetan Plateau. Front. Earth Sci. 9:778905. doi: 10.3389/feart.2021.778905
Received: 17 September 2021; Accepted: 16 November 2021;
Published: 03 January 2022.
Edited by:
Xiubin Lin, Zhejiang University, ChinaReviewed by:
Lin Chen, Institute of Geology and Geophysics (CAS), ChinaCopyright © 2022 Chen, Hu, Orellana-Rovirosa, Zhou, Zhang and Shi. This is an open-access article distributed under the terms of the Creative Commons Attribution License (CC BY). The use, distribution or reproduction in other forums is permitted, provided the original author(s) and the copyright owner(s) are credited and that the original publication in this journal is cited, in accordance with accepted academic practice. No use, distribution or reproduction is permitted which does not comply with these terms.
*Correspondence: Caibo Hu, aHVjYkB1Y2FzLmFjLmNu
Disclaimer: All claims expressed in this article are solely those of the authors and do not necessarily represent those of their affiliated organizations, or those of the publisher, the editors and the reviewers. Any product that may be evaluated in this article or claim that may be made by its manufacturer is not guaranteed or endorsed by the publisher.
Research integrity at Frontiers
Learn more about the work of our research integrity team to safeguard the quality of each article we publish.