 Franziska Glueer
 Mauro Häusler
 Valentin Gischig
 Donat Fäh
- 1Swiss Seismological Service, ETH Zurich, Zurich, Switzerland
- 2CSD Ingenieure AG, Bern, Switzerland
In the past decade, ambient vibration measurements found numerous applications on unstable rock slopes and developed into a powerful tool for site characterization of slope instabilities. In this study, for the first time ambient vibration measurements were applied to a rock mass strongly disturbed and damaged by subsurface explosions. The site above the ammunition storage chamber at Mitholz (Switzerland) is especially interesting because the subsurface geology below the seismic array is well known, including the location of the caverns, and the degree of degradation caused by the subsurface explosions in 1947 of around 40 t TNT of ammunition. Measurement data were analyzed using current state-of-the-art seismic single-station and array methods, focusing on surface-wave dispersion analysis, wave field polarization, wave amplification using site-to-reference spectral ratios and analysis of normal mode behavior. The results allow for calibrating the elastic properties of a 2D numerical rock mechanical model which was used to simulate the stability of the disturbed rock mass during seismic loading. Therefore, ambient vibration measurements can contribute not only to a better understanding of the subsurface, but also for the assessment of earthquake risk.
Introduction
Underground storage of ammunitions in natural or excavated caverns offers a number of advantages, for example, release of valuable land above ground for other uses, improved safety, because the rock mass is able to confine and reduce the effects of accidental explosions, a constant temperature and decreased exposure to weathering (Geneva International Centre for Humanitarian Demining, 2008). These advantages were taken into account when the subsurface ammunition storage at Mitholz (Switzerland) was constructed between 1941 and 1944 (Schneider, 2019). At that time, little was known about uncontrolled explosions and no international codes and legal regulations for the construction and the storage existed. In 1947, parts of the repository were destroyed by an uncontrolled explosion, causing severe damage to the repository and to the village of Mitholz, including nine fatalities (Aebi, 1969). Around 40 t TNT of ammunition exploded during a 2-week period (Kummer et al., 2018) and highly damaged part of the storage tunnel system as well as the rock mass above and beneath the tunnels.
The use of ambient vibration measurements for geophysical site characterization and structural integrity assessment has increased immensely in the past 20 years. As a cost-effective, reliable and fast technique, applications are found for civil structures (e.g. Crawford and Ward, 1964; Michel et al., 2010), seismic site effect assessments (e.g. Bard et al., 2010; Michel et al., 2014; Hobiger et al., 2021), seismic bedrock imaging (e.g. Vantassel et al., 2018; Mascandola et al., 2019) and the characterization of potential landslides (e.g. Burjanek et al., 2012; Kleinbrod et al., 2017). Since ambient vibration measurements are carried out with instruments easy to deploy and independent of any active sources, they are an important additional source of information for characterizing a damaged rock mass and provide an efficient tool for differentiating damaged from intact rock. Seismic ambient vibration measurements have also proven useful to measure resonant frequencies and related volumes (e.g. Havenith et al., 2002; Colombero et al., 2021) and to receive shear-wave velocity profiles from surface wave dispersion curves (Danneels et al., 2008; Kleinbrod et al., 2019). When studying the dynamic response of an instability that is internally damaged by gravitational processes or weathering, frequency-dependent ground-motion features can be related to the internal slope structure (Burjanek et al., 2010; Kleinbrod et al., 2017). Explosions in underground cavities can be another source for internal damage in a rock mass and also cause the degradation of material stiffness and strength.
Kleinbrod et al. (2019) observed the ground motion on different rock mass instabilities and differences between types of sites whose seismic response is mainly controlled by the depth-dependent shear wave profile (depth-controlled) favoring the propagation of surface waves, and sites whose response is mainly controlled by volumes separated by deep fractures (volume-controlled) and characterized by normal mode behavior. Towers with their extreme geometry represent a special case of volume-controlled sites featuring strong amplification and directionality. In this study, ambient vibration measurements were performed at the Mitholz site to characterize the rock mass damaged from the subsurface explosions in 1947. The seismic data are analyzed using array methods likesite-to-reference spectral ratios, normal mode behavior and surface wave dispersion as already described e.g. in Burjanek et al. (2012), Kleinbrod et al. (2019) and Häusler et al. (2019). This allows for describing and interpreting the seismic response of the rock mass in terms of resonant frequencies, relative seismic amplification with respect to a reference site and normal mode shapes.
Results of this analysis are used to calibrate the elastic properties of a dynamic 2D model to analyze the earthquake stability of the remaining tunnel system. Coupling ground motion resulting from an earthquake with the stability conditions of an underground tunnel is of complex nature since two separate models have to be linked together. This has been done for earthquake-induced landslides in Jibson et al. (2013), Capolongo et al. (2002) and Lee et al. (2006). This study report two novelty: 1) it is one of very few studies where ambient vibration characterization is used to calibrate numerical models, and 2) it is to our knowledge the first study in which ambient vibration techniques are applied to a case of a damaged underground ammunition storage facility.
In case of normal-mode behavior of the rock mass itself (volume-controlled site with blocks separated by deep cracks; Kleinbrod et al., 2019), ellipticity curves derived from ground-motion polarization analysis show a prominent drop in ellipticity at the eigenfrequency. The strike gives the azimuth of the semi-major axis of the ellipse. In case of volume-controlled instabilities, the strike is generally perpendicular to the dominant joint system. The dip indicates the inclination of the semi-major axis with respect to the horizontal plane. For volume-controlled instabilities, a prominent peak in horizontal to vertical spectral ratios (H/V) can generally be observed at the eigenfrequencies of the separated blocks. The H/V curves are the ratio between the Fourier amplitude spectra of the horizontal and vertical component of the ambient vibration recordings (e.g. Nakamura, 1989). Depth-controlled sites on the other hand are characterized by increasing disintegration of the rock close to the surface. For depth controlled sites, H/V spectral ratios are used as an indicator for knowing whether a rock site consists of an intact or disturbed rock mass. This however requires a strong impedance contrast between fractured or weathered surface layers and the underlying, stiffer formation. In such case, H/V curves show a prominent peak at the resonant frequency of the site (Bonnefoy-Claudet et al., 2006). For sites with velocity gradients and no velocity contrast at depth, the peaks are small and often difficult to identify.
Mitholz Site
The Mitholz underground ammunition storage is located in Switzerland, 15 km South of Lake Thun in the Kander Valley, at an altitude of around 1,000 m a.s.l. At the eastern flank of the Kander Valley, the 350 m long flat to moderate slope of the meadow ‘Flue’ raises from south to north from 1,000 m a.s.l. to 1,120 m a.s.l. (Figure 1A). Between 1941 and 1945 an ammunition storage was constructed perpendicular to this large cubical-shaped rock, 100 m high and 200 m wide striking North-South. The meadow on top is bounded to the West by a steep and partly overhanging rockwall with three rock towers ahead called ‘Dreispitz’ originating from the explosion (“three peaks”, see Figures 1D,E, 2B). The former subsurface ammunition depot Mitholz is located underneath the Flue at a level of about 980 m a.s.l. Today, the tunnel system consists of six chambers, which are connected through a tunnel running orthogonal through the middle of the chambers. Before the explosions in 1947, a railway tunnel at the western end connected the chambers with each other (Figure 2A).
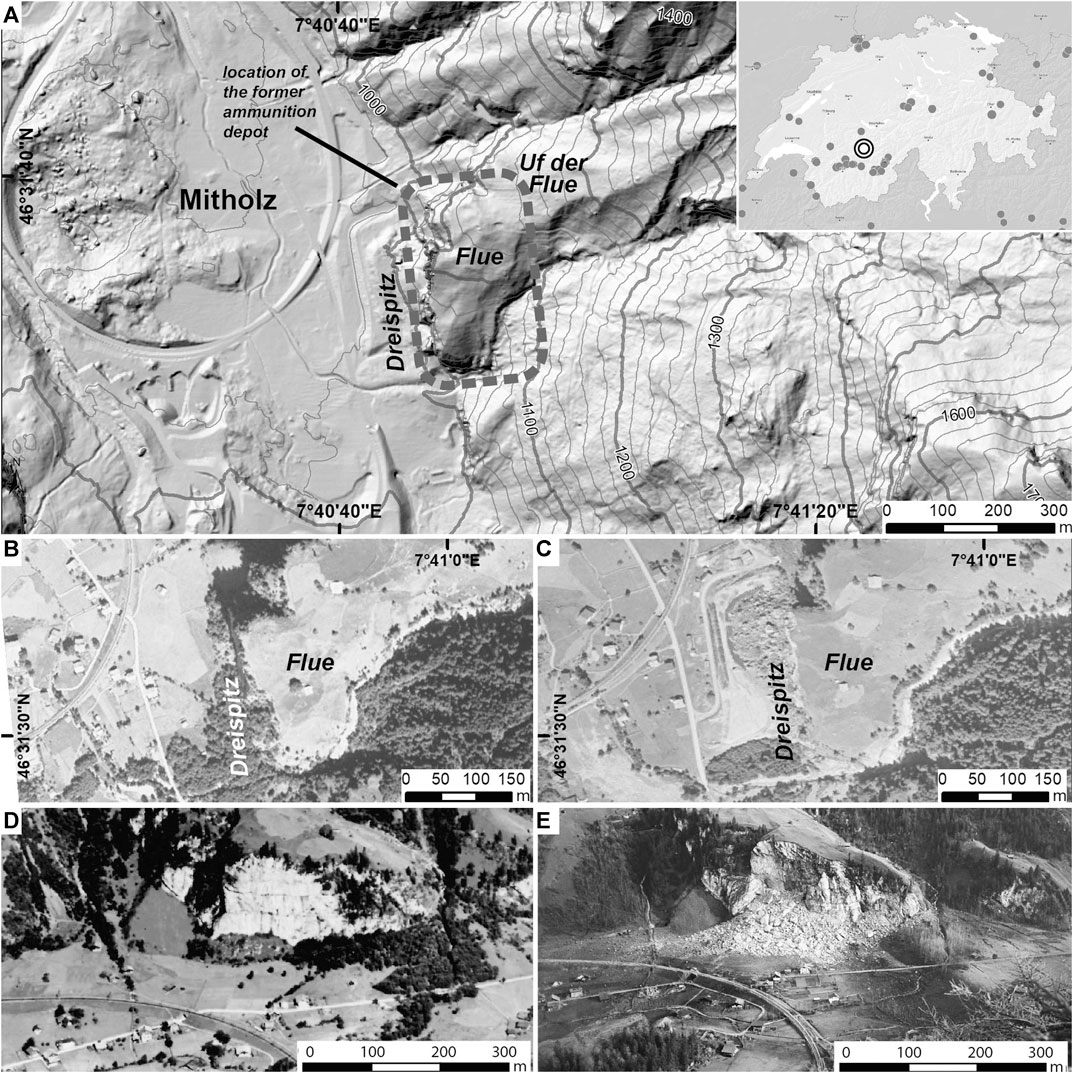
FIGURE 1. Location and appearance of the Mitholz subsurface ammunition storage. (A) Digital elevation model of the surroundings of the former Mitholz ammunition depot with location names on the LiDAR-elevation-model from swissALTI3D from 2016; the insert shows the location of Mitholz (big circle) and of historic earthquakes (grey dots) larger than Magnitude five in Switzerland (geodata source: Swiss Seismological Service and Earthquake Catalogue of Switzerland (ECOS-09); (B) aerial orthorectified image of April 1940 before the ammunition storage was build (Bundesamt für Landestopografie swisstopo); (C) aerial orthorectified image of September 1960, 13 years after the uncontrolled explosion (Bundesamt für Landestopografie swisstopo); (D) aerial historic image of ‘Flue’ before the construction of the ammunition storage (year unknown, Aebi, 1969 picture 22,487); (E) historic aerial image of Mitholz after the explosions from January 8, 1948 (Aebi, 1969, picture 22,484).
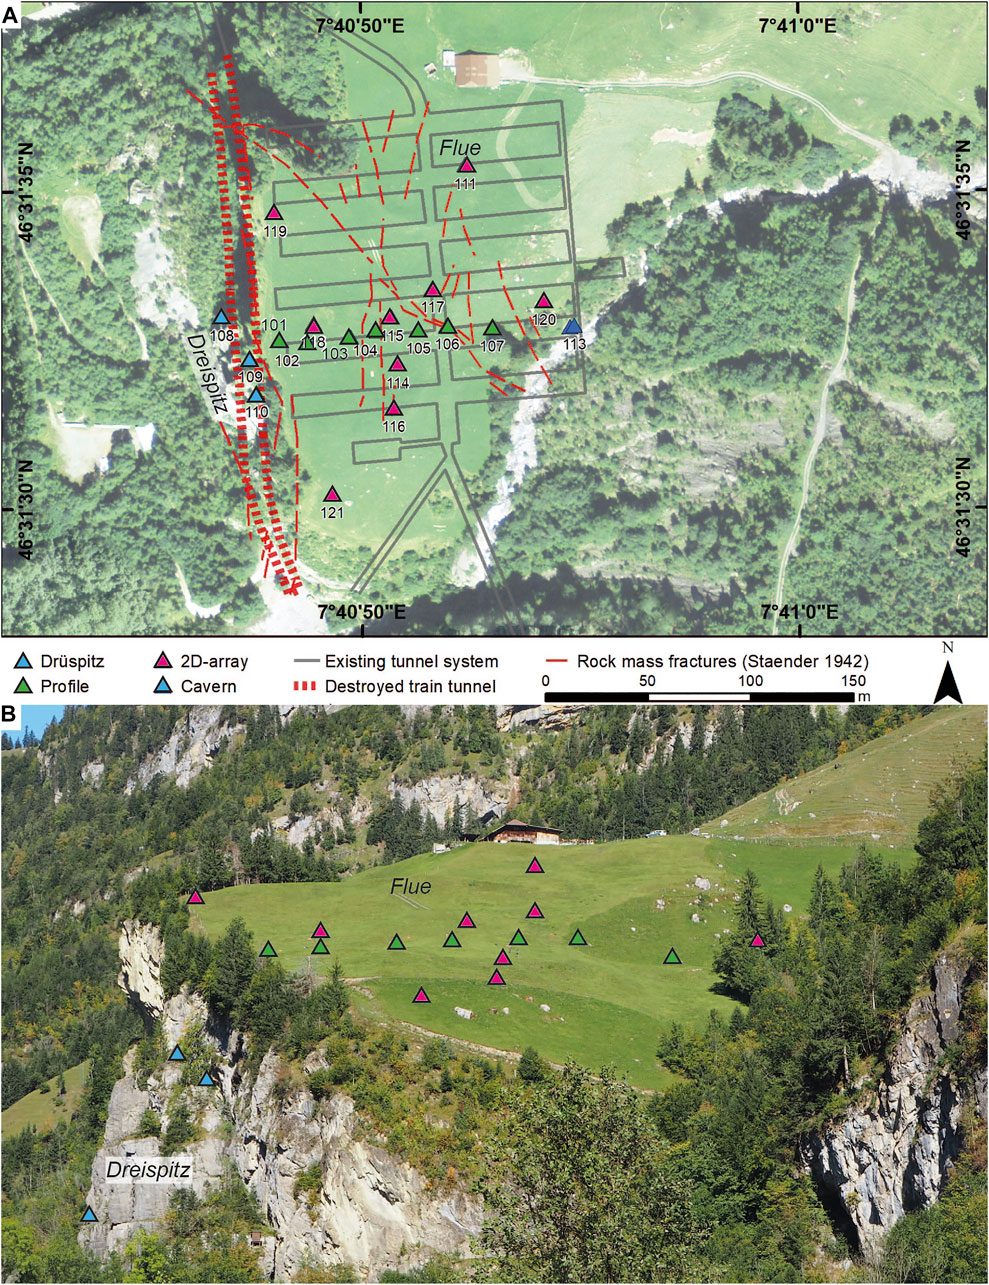
FIGURE 2. Overview of the measuring configuration at Mitholz; (A) orthoimage from swisstopo (2014), the grey lines frame the approximate location of the tunnel system with the destroyed train tunnel ∼100 m below the surface of Uf de Flue as well as the location of cracks and fissures reported during the construction (Ständer, 1942); coordinates in WGS84; (B) image taken from south facing Uf de Flue and the Dreispitz towers on the left hand side; (A) and (B) The green triangles represent the measuring points along a profile line crossing the tunnel system underneath; the stations marked with pink triangles are arranged for a 2D array at the surface; the light blue triangles represent stations located at Dreispitz and the dark blue triangles represent sensors located within the tunnel system (only in A).
Tectonically, the Mitholz site is placed on the European continental margin within several Helvetic nappes (Doldenhorn and Gellihorn-Nappe) close to the main alpine thrust. The rock mass of the subsurface tunnel system consists of Jurassic-Cretaceous limestone of the Oerli and Valanginien Formations partly with siliceous components (Flück et al., 1993). The limestone beds of the Oerli- and Betliskalk slightly dip towards south-east and are dissected by cross joints. A tectonic fault (Mitholz-fault) strikes north-south and was detected during the reconnaissance of the tunnel project in the early 1940s. During the construction of the tunnel system in 1942 another fault-system was described running NW-SE (Schneider, 2019). This fault-system caused overbreaks during the excavation and enforced the installation of reinforcement in the affected tunnels during the construction. Aebi (1969) summarizes all existing reports of the construction of the ammunition storage and states, that the dominant fractures are filled with trapped rock blocks and fine material, often even cemented with calcite. Most fractures observed during the excavation could not be traced all the way to the surface, which could also be due to the morainic cover at the Flue (Schneider, 2019). All fractures and faults in the area of the depot known from the construction work are marked in red in Figure 2A.
Around 255,000 m3 of rock mass mobilized during the accidental detonations in 1947, leading to the formation of a large debris cone ahead of the storage site (Figures 1C,E). The Mitholz-fault causes the rock wall formation Dreispitz to be completely disconnected from the in-situ rock and to lean against the rock wall (Figure 2B). For details about the history see Supplementary Appendix A.
Methods
Measurement Setup and Data Acquisition at Mitholz
In October 2019 a temporary array of 16 seismometers was installed on the meadow ‘Flue’, three seismometers were placed at the Dreispitz-towers and another two within the tunnel system (Figure 2). Ambient vibrations were recorded using LE-3Dlite 1-s period sensors (Lennartz) combined with Taurus digitizers by Nanometrics for stations 108, 109, 110, 121, and 116. All other stations were equipped with LE-3D 5-s period sensors and Centaur digitizers (Nanometrics). Sampling rate was 200 Hz. All temporary stations were mounted on metal tripods in shallow holes in the soil or wherever possible on in-situ bedrock and oriented to magnetic North using a hand-held compass with accuracy better than 5°. The digitizers are equipped with a global navigation satellite sysytem (GNSS) antenna for synchronous timing of all seismometers. The spatial location of each sensor at the surface was measured using differential GNSS (precision of ∼0.02 m). Positions of stations 108, 109 and 110 (on the Dreispitz towers) were acquired using standard handheld GNSS with an accuracy of about 10 m.
Sensors were grouped according to their measuring locations in ‘Profile’ (along a line crossing the tunnel system underneath, green triangles in Figure 2), arranged for a ‘2D-array’ (pink triangles in Figure 2), on the Dreispitz towers (light blue triangles in Figure 2) and within the Cavern (blue triangles, Figure 2A). All stations were running simultaneously overnight. A time window of exactly 120 min between 23:15 UTC on 2019/10/03 and 01:15 UTC on 2019/10/04 was picked for the analysis. Station 120 was selected as a reference station for the Site-to-Reference Spectral Ratio (SRSR; see “Site-to-Reference Spectral Ratios (SRSR)” Section). The seismic array stretches over about 170 m north/south and 170 m east/west. Measuring location 112 and 113 located inside the tunnel system are the stations with the lowest elevation of about 980 m a.s.l., whereas station 111 is the highest station with an altitude of 1,117 m a.s.l. The array at the meadow Flue covers most of the subsurface cavern structures of Mitholz (see Figure 2A).
Frequency Domain Decomposition (FDD) Modal Analysis
We performed normal mode analysis using the Frequency Domain Decomposition (FDD) technique introduced by Brincker et al. (2001), which is an established method in structural engineering (e.g., Michel et al., 2010) and found applications on geological structures, such as unstable rock columns and rock slope instabilities (Bottelin et al., 2013; Häusler et al., 2019, 2021; Mercerat et al., 2020). FDD uses the cross-power spectral density matrix of all input traces of ambient vibration recordings and computes its singular values (SV) and singular vectors through singular value decomposition. The SVs represent the auto spectral densities at each recording station with peaks at the natural (resonant) frequencies of the system. The corresponding singular vectors represent the three-dimensional mode shapes. By plotting the singular values, data of all input traces can be illustrated in one single graph, providing a rapid tool to assess the dynamic response of a site. In contrast to frequency-dependent polarization analysis, FDD preserves the phase information between stations and only considers correlating signals across recording stations. Therefore, FDD is able to recover the resonant frequencies and normal mode shapes of the entire structure and is especially powerful in detecting close and higher order modes. For more information on the technique and its implementation for assessing geological structures, see Brincker and Ventura (2015) and Häusler et al. (2019).
In this study, we followed the procedure suggested by Häusler et al. (2019) and excluded station 110 (at Dreispitz) and the stations inside the tunnel (112 and 113). Station 110 was excluded from FDD due to its very large amplification factors, degrading the quality of the normal mode analysis involving all stations. Stations 112 and 113 inside the tunnel were also excluded, since their signal is dominated by noise from machines located nearby. Station 120 was used as a reference station. We performed a second FDD analysis using only the three stations located on Dreispitz, with station 108 as a reference. To assess the stability of a normal mode shape, we used the Modal Assurance Criterion (MAC) (Allemang, 2003; Allemang and Brown, 1982) and set a threshold of 0.6, following the suggestion by Häusler et al. (2019).
Polarization Analysis
Burjanek et al. (2010, 2012) proposed the time-frequency polarisation analysis (TFPA) for ambient vibration data from landslides based on the combination of polarisation analysis and the continuous wavelet transform. The TFPA gives insight into the ground’s particle motion by describing the polarization by two angles (strike and dip of the major axis) and a value of the ellipticity. The dip shows the tilt of the plane of the ellipse with respect to the horizontal, i.e. a dip close to zero means that the ellipse is horizontal. The strike gives the orientation of the semi-major axis with respect to north and often can be found orthogonal to dominant fractures. An ellipticity close to 0 indicates linear ground motion, whereas a ratio of 1 means circular movement of the ground particles. Typical values for the ellipticity in hard-rock sites lie between 0.3 and 0.4 (Burjanek et al., 2014).
Site-To-Reference Spectral Ratios (SRSR)
To estimate the relative amplification of the ground motion of the investigated site compared to an intact rock site nearby, we calculate the site-to-reference spectral ratio (SRSR, Borcherdt, 1970; Perron et al., 2018). With the assumption of distant sources, it is possible to eliminate source and path specific effects, so that only site signatures related to the local rock mass remain. The output of the SRSR is a frequency-dependent amplification function of ground motion with respect to the reference station. As maximum amplification values are usually observed in the direction of the main polarisation (estimated by the time-frequency polarisation analysis TFPA or FDD, see “Frequency Domain Decomposition (FDD) Modal Analysis and Polarization Analysis” Section), these directions are of most interest for the SRSR on rock instabilities. SRSR can be used to identify resonant frequencies caused by local geological features. The recorded time-series are divided into different time windows of 100 s using a multi-taper method with four tapers (Thomson, 1982; Prieto et al., 2009), and then normalized by the spectrum of the reference station. It has been proven that the degree of rock mass fissuring/destruction is expressed in the amplification factors with respect to the presumably stable reference site (Gischig et al., 2015). To group stations with a similar seismic appearance, the relative amplification curves were automatically clustered following the approach by Häusler et al., 2021 and using the k-means++ clustering algorithm (Lloyd, 1982; Arthur and Vassilvitskii, 2007). It assumes similar site conditions for stations within the same cluster.
Dispersion Analysis of Surface Waves
We use three-component high resolution beamforming in frequency-wavenumber (f-k) domain which has proven to be robust to retrieve dispersion curves on geological structures of with lateral variability (Chieppa et al., 2020; Hobiger et al., 2021). Kleinbrod et al. (2019) applied the method in depth-controlled sites only, because pure volume-controlled sites do not show surface wave propagation due to open cracks. Generally, on depth-controlled instabilities, only small sections of dispersion curves of Rayleigh and Love waves can be identified. The low frequency resolution limit is driven by the 1D requirement for the velocity profile and the possible array size, which on unstable slopes often is very restricted. The high-frequency limit to measure surface wave propagation depends strongly on the degree of lateral variability of the near-surface structure.
Even though the prominent fracture sets show persistency of several tens of meters (as some fractures within the tunnels daylight and reach the surface at Dreispitz), it is supposed that the fractures are mainly filled and cemented and thus don’t hinder the propagation of waves. We therefore applied three-component high resolution beam forming to our array data as described in Poggi and Fäh (2010).
Seismic Response of the Investigated Site Mitholz
Modal Analysis
The singular value plot (SVP) of the FDD modal analysis (Figure 3A) shows two broad peaks at 3 Hz and about 5.8 Hz, and several narrow-banded spikes, for example, at 4 Hz, 5.2 Hz, 7.4 Hz. Many higher singular values at these narrow-banded spikes are elevated synchronously, indicating a disturbing monochromatic noise signal (Brincker et al., 2001). Therefore, these frequencies are not interpreted as structural information. The broad peak at 3 Hz has a Modal Assurance Criterion (MAC) > 0.6 between 2.1 and 3.2 Hz and is, thus, well defined. Therefore, we interpret this frequency as the fundamental mode of the system. The mode shapes at this frequency normalized to station 120 are plotted on the amplification map in Figure 3C. We observe a gradual decrease in maximum amplification (in direction of the mode shape) from the overhanging cliff at station 119 (factor ∼7) towards east and south. Amplifications drop below factor four east of station 103 (easting of 618,500). The predominant deflection is east-west. Note that all recording stations are vibrating in-phase. This analysis clearly classifies the site as being volume-controlled according the classification by Kleinbrod et al. (2019).
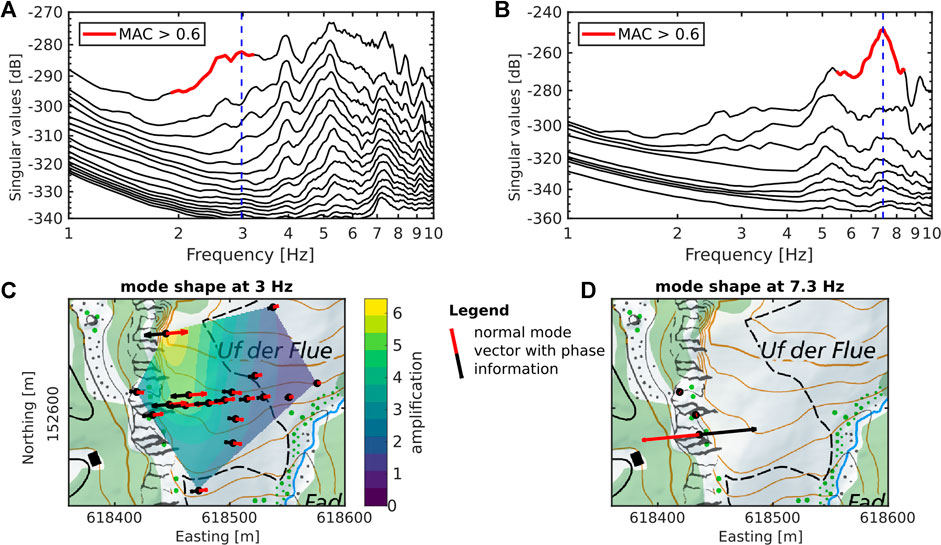
FIGURE 3. Results of the Frequency Domain Decomposition (FDD) modal analysis; (A) the singular value plot of all stations shows two broad peaks at 3 Hz and about 5.8 Hz and several narrow-banded spikes, for example, at 4 Hz, 5.2 Hz, 7.4 Hz, and 14.6 Hz; the red color indicates the bandwidth with a MAC >0.6 compared to the picked frequency (blue dashed line); the peak at 3 Hz is interpreted as the fundamental resonant mode of the structure; (B) the SVP for stations located at Dreispitz (108, 109, 110) is characterized by a broad peak at 3 Hz (same peak as visible on the other stations) and a very strong peak at 7.3 Hz (blue dashed line); (C) Amplification map of the mode shape at 3 Hz for all stations at Flue with arrows indicating the normal mode vector (polarization). The color of the arrows represents the phase information; (D) Amplification map of the mode shape at 7.3 Hz for the stations at Dreispitz (108, 109, 110).
We repeated the FDD modal analysis using Stations 108, 109 and 110 at Dreispitz with station 108 as a reference. The SVP (Figure 3B) is characterized by a broad peak at 3 Hz (same peak as visible on the other stations) and a very strong peak at 7.3 Hz. This mode bell shows a MAC >0.6 between 5.6 and 8.2 Hz. The mode shapes (Figure 3D) reveal that this peak originates solely from station 110, which is located on a free-standing tower leaning against the rockwall of the Flue. Dominant direction is WSW-ENE.
Polarization
Polarization analysis reveals a highly directional ground motion at several stations in the western area of Flue. In the area around stations 101, 102, 103, 118 and 119, strong polarization of the ground motion in the horizontal plane is observed and polarization is mainly oriented in the E-W direction (see Supplementary Appendix B) and, thus, agrees with the FDD normal mode analysis. Examples for ellipticity, strike and dip are given for station 119 at the NW border of the meadow Flue (Figure 4A) and station 118 in the central part of Flue (Figure 4B). This station showed a peak in the normal mode analysis. In general, the degree of wavefield polarization decreases from west to east. Polarization around 3 Hz is also seen in the horizontal to vertical spectral ratios given in Supplementary Appendix C. Most stations show clear directional ground motion between 3 and 4 Hz and between 9 and 10 Hz. Strong signatures in the dip with variations of ±10° around the horizontal are visible at stations 101, 108, 109, 110, 119 and 121. These are all stations located close to the west-facing rock wall of the Flue, thus having the freedom to tilt down-resp. westward for stations located on Flue and eastward (towards the wall) for stations located at Dreispitz. Especially along the western edge of the Flue with station 101, 119 and 121 the partly overhanging rock wall enables a toppling movement in western direction which is reflected in the dip vs frequency plots (see example Figure 4A). Stations on the Dreispitz towers (108, 109, 110) are also free to move since they are mostly not bounded laterally, which is reflected in a clear dip with variations of ±10° around the horizontal. Station 108 and 109 (on the western side of the Dreispitz) show a dip towards west. Station 110 on top of the largest Dreispitz tower also shows this western dip at 3 Hz, but for larger frequencies this turns into an eastern dip (for details see Supplementary Appendix B). This could possibly be explained by the fact that the Dreispitz-structure leans against the Flue and is therefore coupled to the normal-mode vibration of the Flue at 3 Hz. On the other hand, the free part of the Dreispitz-tower displays an eigenfrequency at 7.3 Hz and direction as analyzed in the modal analysis (Figure 4D).
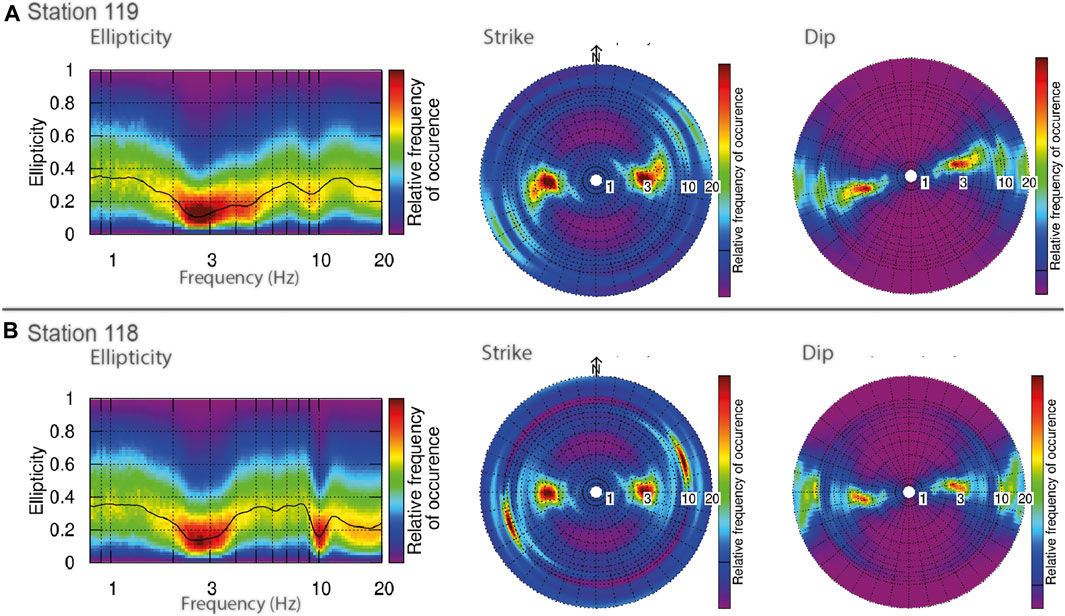
FIGURE 4. Example of the seismic response of stations at Flue in terms of ground motion polarization; (A) Station 119 (located NW of the Flue) with its ellipticity dropping around 3 Hz, the strike in E-W direction and dip tilted by around 15° downwards; (B) Station 118 located in the central area of the array on Flue with its ellipticity showing two drops at around 3 and 10 Hz, its strike in E-W direction for the peak at 3 Hz and NE-SW for the peak at 10 Hz and a horizontal dip.
Wave Amplification
There are considerable differences in observed amplification between the seismic stations (Figure 5). We performed a cluster analysis that was done in an automatically fashion based on the directional amplification of the east-component as described in “Site-to-Reference Spectral Ratios (SRSR)” Section. Cluster 1 includes all stations at the eastern part of the Flue (blue circles in Figure 5C) showing in average low amplification values of around two, with peaks at 3.1, 6.3 and 8.8 Hz. Cluster 2 is the strongly amplified station 119 (red hexagon in Figure 5C) located at the northwestern border of the Flue in a partly overhanging rockwall with the largest dip in the polarization analysis (Figure 4A), showing peaks at 3.2, 4.0 and 8.7 Hz and amplification values of up to 7.5. Cluster 3 includes all stations in the western Flue, namely station 101, 102, 103 and 118 (orange triangles in Figure 5C), with amplification peaks at 3.2, 6.3 and 8.8 Hz in the east-component with an average amplification of up to 6 (at 3.2 Hz). The stations at Dreispitz are forming a forth cluster with peaks at 3.2 and 7.3 Hz. The SRSR curves for the Dreispitz stations show the strongest directional amplification of 25 for station 110 in E-W direction (Figure 5B).
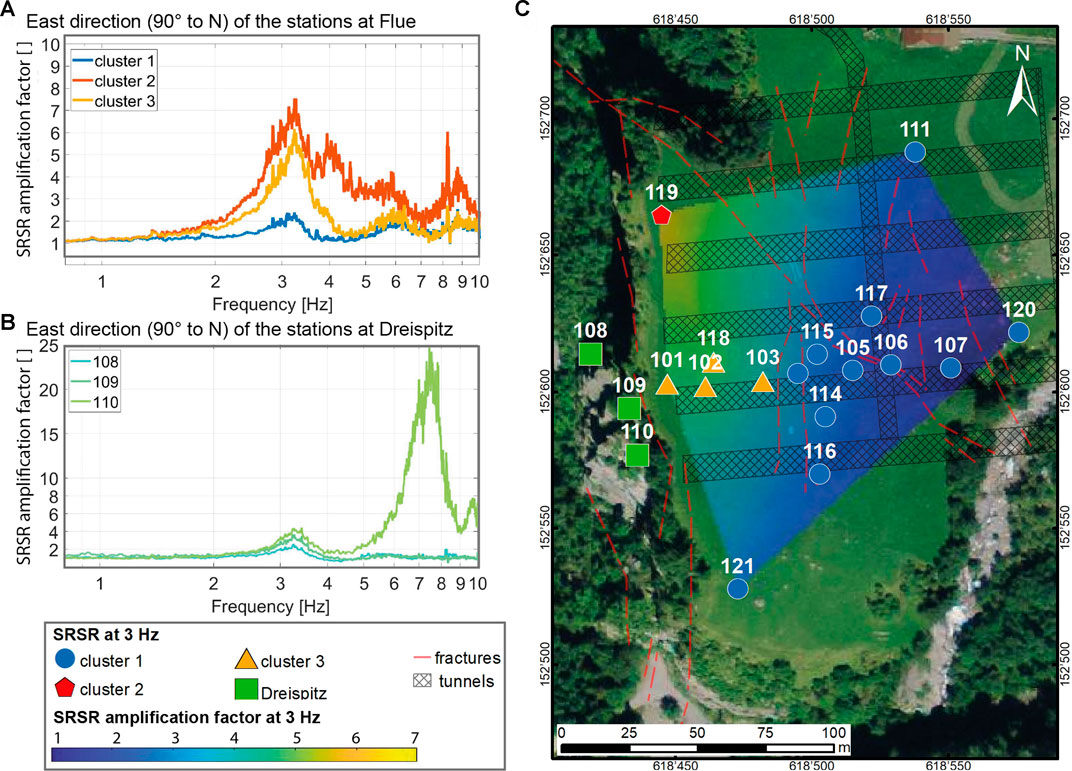
FIGURE 5. Site-to-reference spectral ratios (SRSR) of ambient vibration data recorded at the site Mitholz in 2019; (A) SRSR mean curves for cluster 1-3 in the direction of maximum amplification (east-component); (B) SRSR curve in east-direction of the stations located at Dreispitz (108–110), representing the cluster Dreispitz; (C) location map of the stations with the assignment to the different clusters, the current tunnel system around 100 m underneath (black crossed lines) and the known fractures from the tunnel excavation in 1941. Additionally, the SRSR map of the east-component, which is the direction of main polarization, for the fundamental frequency of 3 Hz with respect to reference station 120 is displayed; the color represents the amplification factor as indicated in the legend.
The relative wave amplification based on the site-to-reference spectral ratio (SRSR) of all stations on Flue with respect to station 120 for direction of maximum polarization, which corresponds to the east component of the horizontal plane can be seen in Figure 5A for the mean curves of cluster 1, cluster 2 and cluster 3. Note that the color of the highlighted stations refers to the grouping using the automatic clustering analysis for the directional amplification. All spectral ratios were computed with respect to station 120 (for location of stations see Figure 5C).
In Figure 5C, the SRSR amplification map for the 3 Hz fundamental mode of the stations at Flue using the direction of maximum polarization is displayed. In general, amplification is increasing towards west in the direction of the destroyed cavern and the steep and partly overhanging rock wall in front of Dreispitz (station 119) and the towers of Dreispitz itself (stations 108 to 110 in Figure 5C). Areas further away from the destroyed caverns show lower amplification factors (towards the east). The amplitudes of the SRSR at Flue compare well with those of the normal mode analysis. The amplifications in the normal mode analysis shown for the towers at a frequency of 7.3 Hz is also visible in the SRSR of the east-component in Figure 5B, in particular for station 110. The amplitudes are not directly comparable because of a different reference. In the following section, amplifications refer to the results from SRSR for the maximum directional amplification in E-W direction with respect to station 120.
Dispersion Curve Analysis
The data are acquired on the meadow Flue approximately 100 m of elevation above the damaged tunnel system. There are several open cracks in the area of the detonations, but in general within the largest part of the plateau, fractures are supposed to be filled with rock fragments and fine material, sometimes even calcified. We applied three-component high-resolution beam forming f-k analysis to our array recordings in order to track coherently propagating waves. The frequency band of interest expands from 1 to 20 Hz, originating from our empirical observation presented in the previous sections. It was possible to identify propagating waves in the ambient vibration recordings and we suggest possible dispersion curves in a frequency band well above the normal-mode resonant frequency (Figure 6). A dispersion curve is proposed for the horizontal component (Love waves) in the frequency band between 6 and 15 Hz (Figure 6A), with decreasing velocities from about 1,500 m/s at 7 Hz to a rather constant velocity of about 1,100 m/s between 8 and 10 Hz. From 10 to 13 Hz the velocity is decreasing to about 800 m/s. Such decreasing velocities are expected from the observed H/V spectral ratios with variable secondary peaks above 10 Hz, indicating a surface layer of softer material. The peak above 10 Hz is visible at a number of sites (Supplementary Appendix B). However, due to the large scatter of the velocities, the interpretation is not unique and we might suggest also flatter dispersion curves. In Figure 6B, the results are shown for Rayleigh waves using the vertical components. We can track a rather flat supposed dispersion curve between 7 and 14 Hz, with relatively constant velocities of about 1,400 m/s. Above 14 Hz, the Rayleigh wave dispersion curve seems to drop a little down to 1,100 m/s at 15 Hz. Both velocity vs frequency diagrams possibly also show the first higher modes of Rayleigh and Love waves, respectively, or a mixture between the fundamental and higher modes. In the frequency range 7–10 Hz, the velocities of the surface waves are between 1,000–1,500 m/s. Since the effective depth of penetration of surface waves is approximately one-third to one-half of the wavelength, we can argue that this velocity range reflects the S-wave velocity in the upper 30–100 m of the structure.

FIGURE 6. Three-component high-resolution beam forming of the Mitholz array data; (A) hypothetical fundamental-mode Love wave obtained from the transverse component and (B) hypothetical fundamental-mode Rayleigh wave obtained from the vertical component. They correspond to the histograms of the analyzed time windows at the respective frequency ranges, normalized to the maximum value at each frequency, where dark colors correspond to high values and light colors to low values. Solid and dashed thin black lines are the array resolution limits corresponding to kmin/2 and kmin. Solid and dotted thick blue lines are selected from the data, where the central line indicates the best-fitted values and the two outer lines the standard deviation.
Analysis of the Earthquake Stability
Seismic Risk at Mitholz
One of the key risks for the still buried 3`500 t of ammunition at Mitholz has been seen in triggering through earthquakes. Within 40 km distance from Mitholz, earthquakes with moment magnitudes Mw = 5.7 (1755 Brig), Mw = 6.2 (1855 Visp) and Mw = 5.8 (1946 Sierre) are known to have reached maximum intensities of VIII (European Macroseismic Scale, EMS98, Grünthal, 1998). Seismic hazard in Switzerland is represented by the seismic hazard model SUIhaz15 (Wiemer et al., 2015), which gives values for the maximum horizontal spectral acceleration at different frequencies and return periods. Here, the earthquake stability of the Mitholz tunnel system, in particular of the collapsed train tunnel, is assessed in more detail with numerical models. We performed the analysis in three steps: Ambient vibration measurements discussed above are used to quantify at which frequencies and how strong shaking is amplified during an earthquake. The elastic properties of the 2D numerical model is based on the local geological model and in particular the Young’s modulus of the limestone is calibrated using the results from the ambient vibration survey. Such calibration of the Young’s modulus was previously performed in numerical site response analyses of rock structures (e.g. Burjanek et al., 2019). The calibrated model is then used to compute the effect of earthquakes on the subsurface structures by applying a selection of earthquake records with magnitudes Mw in the range 5.3–6.6. The earthquake ground motions were taken from the database of the USGS software SLAMMER (Jibson et al., 2013). We used ground motions recorded on rock at distances of 9–70 km, which cover a wide range of peak ground acceleration (PGA, 0.05–0.5 g) and peak ground velocity (PGV, 10–500 mm/s). The mean frequencies of the seismograms are in the range 0.6–6.5 Hz. In total, we applied 48 earthquake recordings.
Model Setup
Since faults and fissures play an important role at the Mitholz site, the distinct element discontinuum-based 2D modelling software UDEC 6.0 (Itasca, 2019) was used. The method has been successfully applied in similar studies on earthquake stability (Gischig et al., 2015). The ability to include discontinuities and model large dislocations makes this code a suitable tool to model earthquake-induced displacements. Connected by springs, the blocks can experience both normal and shear forces, but also failure, based on the Mohr-Coulomb failure criterion that is assigned to both the discontinuities and the blocks. The blocks are treated as a discretized continuum. The governing equations are solved with a finite difference scheme. The central elements of the geometry of the model are the Flue and Dreispitz towers, where the faults and fissures are explicitly included. Also the valley-infill, which has a thickness of about 80 m and reaches until 880 m a.s.l. was taken into account when creating the model. Additionally, loose deposits of debris at the foot of the Dreispitz represent the material that accumulated during cavern construction as well as during the detonation and the rockfall of 1947. Figure 7A shows the overall model geometry and Figure 7B a close-up of the area around Flue and Dreispitz.
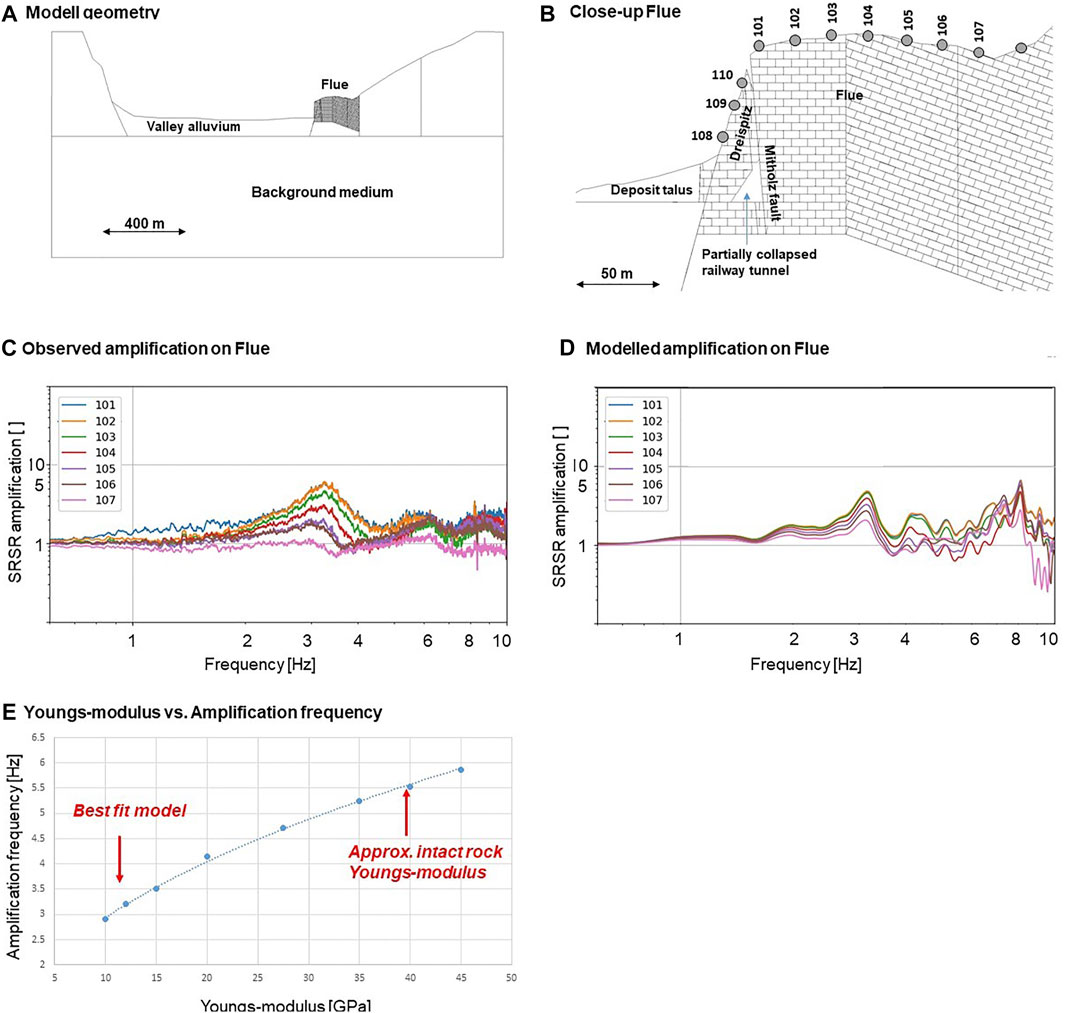
FIGURE 7. Model calibration for the site Mitholz, which exploded uncontrolled in 1947 with (A) the entire model and its boundaries; (B) the geometry of the model around Flue; numbers and dots are the location of the seismic stations; (C) the observed amplification values from the field measurements of October 2019, compared to (D) the modelled amplification values; (E) calibration of the E-modulus on the Flue: the best fit model for an amplification frequency between 3.0 and 3.5 Hz corresponds to a Young’s modulus of 12 GPa.
To represent stress conditions and wave propagation appropriately, the model must have an extent about an order of magnitude larger than the Flue and the Dreispitz. The minimum grid size that allows the spatial representation of shear waves with a velocity of 1,240 m/s (computed from the calibrated Young’s modulus) and a frequency of 10 Hz is 12–18 m. In our case, the structures with the lowest Young’s modulus were discretized with 12 m grid length. The temporal discretization is automatically computed from the shear wave velocity, the spatial discretization and the numerical damping of the wave equations (i.e. Rayleigh damping). For the propagation of the waves, it is necessary that there is no reflection at the model edges (except the topographic surface). This requirement is solved in UDEC by viscous boundary conditions, which cause the waves to be absorbed at the edges. However, this type of boundary conditions requires that the model is initiated with stress boundary conditions. For this, we assume that the vertical stress component is equal to the overload at the model edges and the horizontal stress component is equal to the vertical one. To avoid force imbalance under stress boundary conditions, both side edges must be equal in height. For this, the lateral boundary had to be adjusted accordingly on the western side of the valley.
In UDEC, rock properties must be assigned to both the ‘intact’ blocks and the interfaces (fractures or discontinuities) that separate the medium into blocks. Required parameters for the modelling include 1) elastic properties of the blocks (i.e., rock mass) with Young’s modulus and Poisson’s ratio ν; 2) elastic properties of the discontinuities between the blocks represented by the normal and shear stiffness kn and ks; 3) strength properties of the blocks with friction, cohesion and tensile strength; and 4) strength properties of the discontinuities with friction, cohesion and tensile strength. To account for strength loss at failure, a brittle-plastic behavior is used for the discontinuities, i.e. the discontinuities are assigned both a peak strength (peak friction, peak cohesion and peak tensile strength) and a residual strength (residual friction, residual cohesion and residual tensile strength). Here, the strength and elasticity parameters were estimated from laboratory tests of Oerli- and Betliskalk (limestone) measured at other sites in Switzerland (Lombardi, 2015). From these typical laboratory values of unconfined compressive strength (UCS) of intact rock, the friction, cohesion and tensile strength of the local rock mass were estimated using the Geological Strength Index (GSI) approach (e.g. Hoek and Carranza-Torres, 2002). For the discontinuities, it was considered that fractures contain rock bridges and large-scale roughness so that the peak strength is best represented by a fraction of the residual strength and a fraction of the rock mass strength. Using the approach of Jennings (1970), the properties of the interfaces can be estimated by a mixed calculation assuming a fraction of rock bridges (in percent). For the residual strength, common values adapted to the geological conditions were used. The Young’s modulus of the limestone blocks was modified during the model calibration until the model reproduced the measured amplification characteristics as best as possible. Using the equation by Hoek and Diederichs (2006), the calibrated rock mass Young’s modulus could be related to typical values of the E-modulus of intact rock. This allows for an additional assessment of the estimated GSI and the disturbance factor D (D = 1 for rock mass affected by blasting, D = 0 otherwise, see Hoek and Diederichs, 2006). The joint stiffness values (kn: normal stiffness, ks: shear stiffness) were set to common values in literature. Note their impact on the amplification characteristics is similar but smaller than the one of the Young’s modulus. Thus, in our calibration we kept kn and ks constant and only changed Young’s modulus of the limestone. Table 1 shows the material properties after calibration as used in this study.
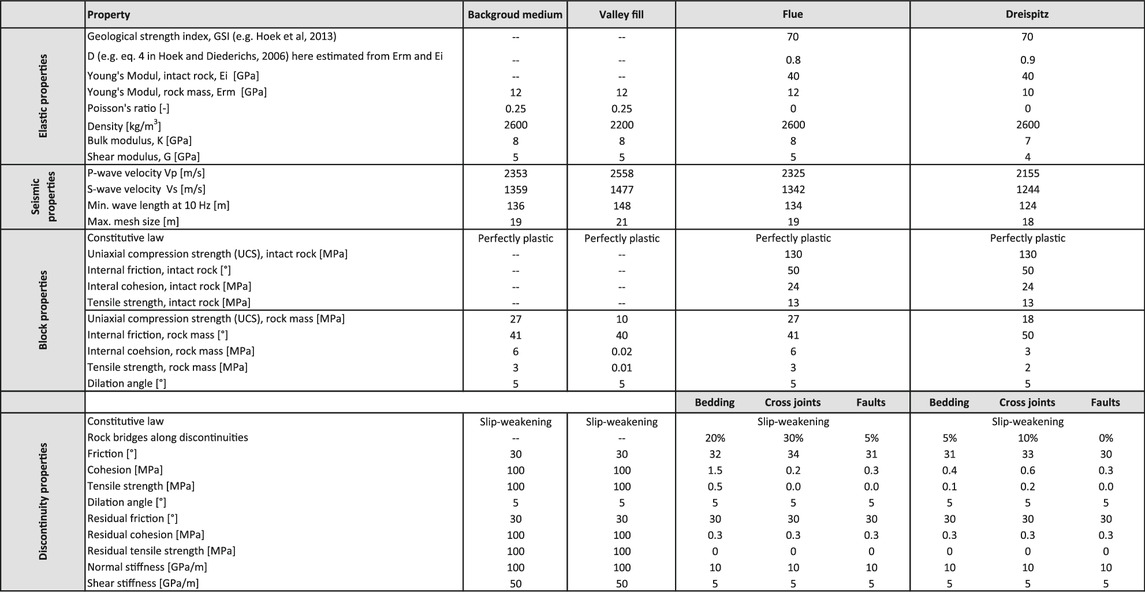
TABLE 1. Elastic and strength properties of the rock mass shown in Figures 7A,B.
Rock mechanical modeling requires that the stress state in the rock is represented realistically. This does not only depend on initial or boundary conditions, but also of the topography and model procedure. To a block at an elevation of 1,400 m a.s.l. the assumptions were assigned that the vertical stress component is equal to the overload at the model edges and the horizontal stress component is equal to the vertical one as initial condition. Then, the topography before the 1947 rockfall was excavated and a stress equilibrium was calculated purely elastically, i.e., without considering strength. To reduce unrealistic stress peaks along the topography, strength values were assigned to the blocks first and only later to the interfaces. In a later step, the cavern was excavated. The rock mass blasted off by the explosion was removed from the nose of the rock wall and placed as a deposit at the base of the slope with today’s topography.
Model Calibration
We used the amplification spectra obtained from the array measurements of October 2019 to calibrate the elastic properties (Young’s modulus) and the geometry (i.e. the location of the Mitholz fault was confirmed). For the Flue, we aimed at reproducing a resonant frequency of 3.0–3.5 Hz, as well as the corresponding amplification factors of 6 – 7 that decrease from west towards east. For the Dreispitz, we aim at modelling a more complex amplification pattern conceptually (i.e. not exactly), which showed amplification also at 3.0–3.5 Hz as well as amplification factors of more than 20 at higher frequencies. We modelled wave amplification at different points at the ground surface (grey dots in Figure 7B). The model is excited at the lower model boundary with a Ricker-wavelet (Ricker, 1943), which is an impulsive wave with a well-defined frequency bandwidth around the dominant frequency fdom. To ensure that the frequency range between 0.1 und 10 Hz is sufficiently covered, we used a superposition of Ricker-wavelets with fdom = 1, 2, 4, 8 Hz. The modeled Fourier spectrum at the points at the model surface corresponding to the ambient vibration measurement locations (Figure 7B) is divided by the spectrum at the point corresponding to the reference station. Thus, we obtain an amplification spectrum that can be compared to the measured amplification spectra.
We primarily changed the Young’s modulus until we arrived at an optimal fit between the measured and modelled amplification spectra at the Flue (Figures 7C,D). We then changed the Young’s modulus of the Dreispitz until the modelled amplification spectrum reproduced the measured ones in principle, i.e. we did not attempt to fit the details of the complex amplification pattern, but merely the fact that amplification factors reach values of about 20 at frequencies higher than 4 Hz. The resulting amplification spectra from modelling using fitted best the observed amplification factors for the Flue using a Young’s modulus of 12 GPa (Figures 7C,D). The amplification spectra for the Dreispitz varied in a more complex and unsystematic manner. We found that a Young’s modulus of 10 GPa, slightly lower than for the Flue, can best meet the requirement that amplification factors on the order of 20 are produced at higher frequencies. Figure 7E demonstrates the effect of the Young’s modulus on the resonant frequency. This dependence highlights that the Young’s modulus can be defined using the observed resonant frequency.
Note that the Young’s modulus of an intact rock typical for limestone is about 40 GPa (Table 1; Figure 7E). We estimated that the GSI of the rock mass of the Flue having relative good quality to be about 70 (Hoek and Carranza-Torres, 2002). The estimated (apparent) bulk Young’s modulus of 12 GPa (Flue) and 10 GPa (Dreispitz) requires a disturbance factor D of 0.8 (Flue) and 0.9 (Dreispitz) (Hoek and Diederichs, 2006), which seems realistic given the blasting damage produced by the explosion (see Table 1). The final selection of parameters results in a shear wave velocity of 1,240 m/s for the rock mass at Flue which is in the range of values seen in surface wave analysis presented in “Dispersion Curve Analysis” Section.
Earthquake-Induced Displacement Patterns
From a total of 48 earthquake records taken from the database of the USGS software SLAMMER (Jibson et al., 2013), three deformation patterns emerge showing different levels of damage in the rock mass around the partially collapsed railway tunnel (Figure 8). For each of these deformation behaviors we interpret a corresponding typical hazard pattern.
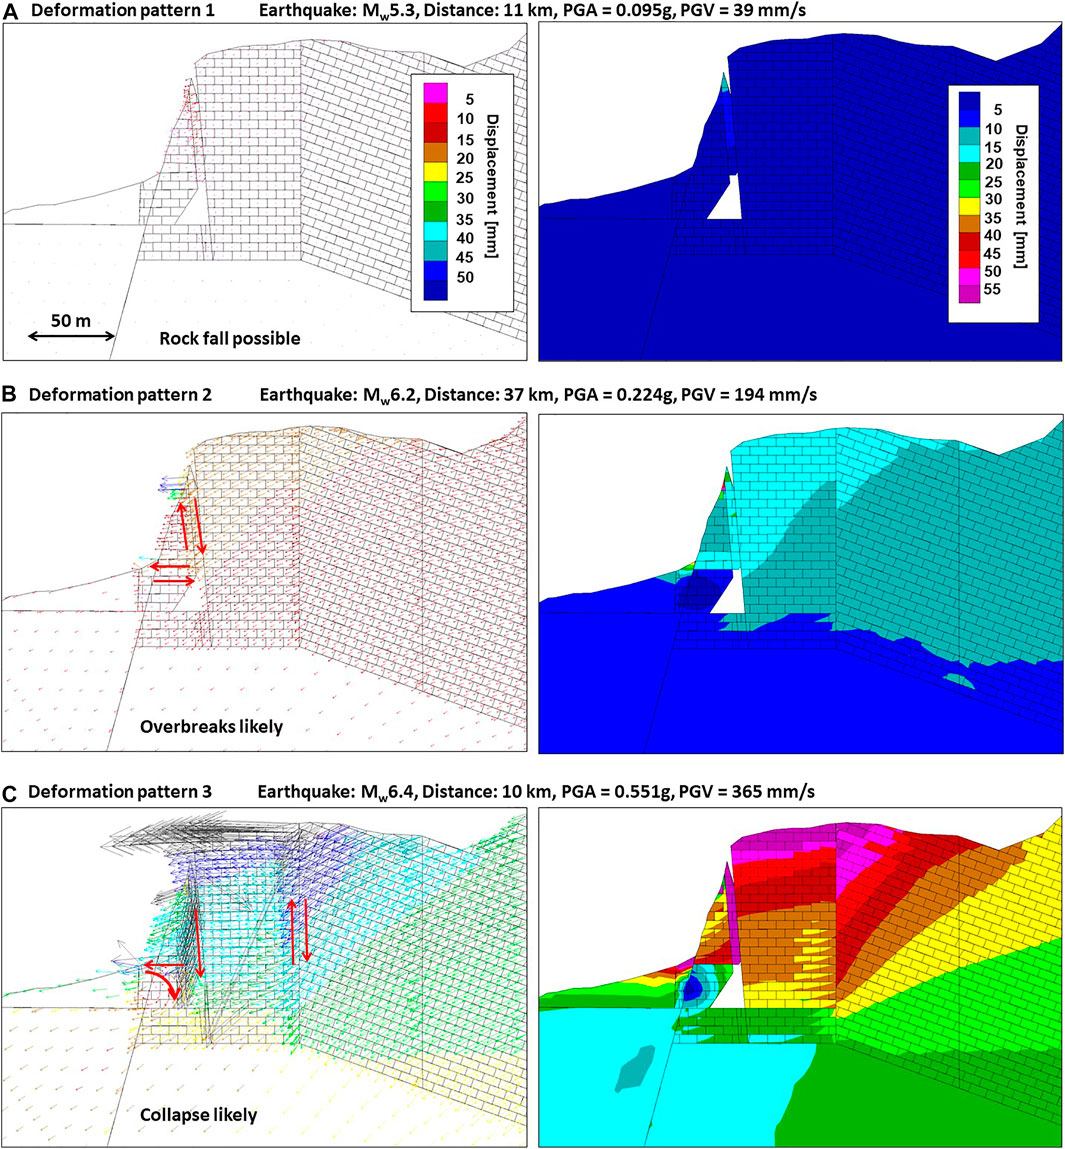
FIGURE 8. Typical deformation patterns with (A) falling blocks, (B) a partial collapse of the train tunnel and (C) downbursts from the Mitholz-fault with a partial emptying of the backfill modelled in UDEC with different earthquake scenarios described in the subtitles. The legend of (A) is valid for all patterns.
Deformation Behavior 1
The entire area around the railway tunnel deforms slightly without major dislocations along faults (i.e. dislocation remain <10 mm). Movements increase towards the top of the Dreispitz towers and mainly affect the uppermost blocks. Displacements and fracture offsets around the tunnel are in the range of a few millimeters. In this case, falls of unstably bedded blocks at exposed locations in the collapsed train tunnel or from the Mitholz fault are possible (Figure 8A).
Deformation Behavior 2
A dislocation of about 10 mm or more (dextral shear sense) occurs along the Mitholz fault. Along the bedding joint, which daylights on the outside of the Dreispitz or below the debris deposit, dislocations of several mm occur (sinisterly shear sense). In this case, falling blocks and a partial collapse of the remaining tunnel structures, as well as overbreaks from the Mitholz fault (partial emptying of the fault material) are likely. Long-term destabilization of the rock formation in the Dreispitz area above the tunnel ridge is expected (Figure 8B).
Deformation Behavior 3
Considerable dislocations of several cm (dextral and sinisterly shear sense) occur along both faults representing the Mitholz fault. Falling of large blocks from and around the Mitholz fault is likely. Similar dislocations also occur along the steepest faults to the east below the Flue (dextral shear sense), primarily affecting the rest of the caverns. Offsets of several cm also occur along the horizontal bedding joints that daylight at Dreispitz. The rock mass forming the outer wall of the cavern rotates into the cavern, thus a complete collapse of the train tunnel is possible. Larger breakdowns from the Mitholz fault (complete emptying of the backfill) are likely. Further failure of the Dreispitz (i.e. partial failure of the rock structure with significant deformations) is likely (Figure 8C).
Figure 9 shows that the rock mass displacement around the tunnel increases linearly in log-log-space with peak ground acceleration (PGA) and peak ground velocity (PGV), although the scatter is discernably less for PGV. For each deformation pattern (1–3) a threshold level of PGA and PGV can be derived (Figures 9A,B). Deformation pattern 1 occurs for a PGA of around 0.02 g and/or a PGV of about 10 mm/s, deformation pattern 2 occurs for a PGA of about 0.1 g and/or a PGV of about 60 mm/s, while deformation pattern 3 occurs at around 0.2 g and/or 200 mm/s. The deformation patterns or damage levels are put into context with the seismic hazard estimate. From a comparison for the hazard values for the threshold PGAs shown in Figure 9C (data from the European Facilities for Earthquake Hazard and Risk; http://efehr.org), deformation pattern 2 can occur with 8% probability of exceedance in 50 years. This corresponds to earthquakes with a return period of about 600 years (range of 200–3,000 years (return period calculated with standard Poisson distribution) within the 5–95% percentiles). For deformation pattern 3 and 2% probability of exceedance in 50 years, earthquakes with a return period of about 2,500 years (a range of 800–16,000 years with the 5–95% percentiles) are expected. From the representation of the magnitude-distance scenarios with the median displacements and deformation pattern, we see no clear separation of the patterns. However, we can note a range of magnitudes and distances where only pattern 1 might be expected (Figure 9D).
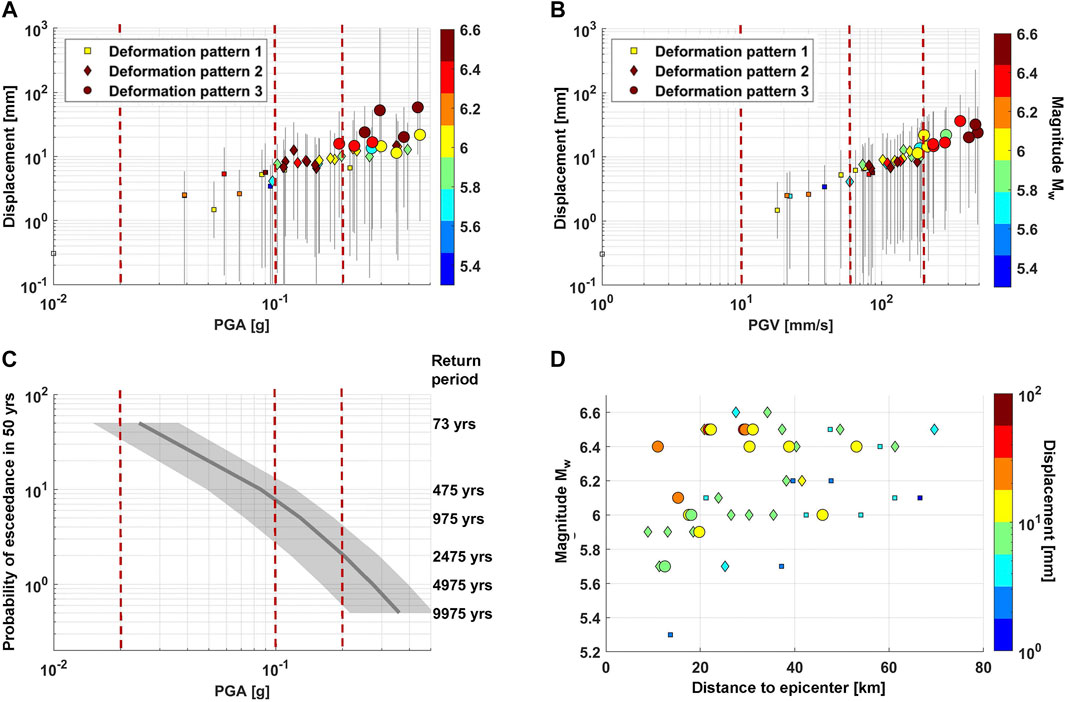
FIGURE 9. Deformation patterns and their occurrence depending on peak ground acceleration (PGA), peak ground velocity (PGV) and their relation to return period, distance to epicenter and magnitude; (A) Displacement (median) around the cavern of the collapsed tunnel below Dreispitz for different deformation patterns depending on the peak ground acceleration (PGA) respectively; (B) peak ground velocity (PGV); grey bars represent the range between the minimum and the maximum displacement; (C) Hazard curves for PGA (downloaded from the EFEHR (European Facilities for Earthquake Hazard and Risk) website http://efehr.org) based on the Swiss seismic hazard model (Wiemer et al., 2015); (D) representation of the earthquake scenarios in magnitudes and distance, with the associated median displacement at the site Mitholz and the resulting deformation pattern; red dotted lines represent the threshold values for the three deformation patterns.
Interpretation of the Seismic Response
Based on ambient vibration data, we were able to characterize the site in terms of ground motion, polarization and amplification. Stations close to the rock wall show tilt, identified from the dip in the polarization analysis. Measured dispersion curves of surface waves allowed us to define a range of Vs values in the structure above the tunnels. The amplification pattern was used to calibrate a subsurface model for coseismic stability assessment and to analyze earthquake-induced displacement patterns. The results were put in the context of probabilistic seismic hazard which enables an assessment of the return periods of earthquakes being potentially problematic for the site.
The ambient vibration measurements at Flue–located around 100 m above the tunnel system show an increased amplification of the signal just in the destroyed section of the tunnel system. This is interpreted as the rock mass structure, which is strongly disturbed around the tunnels affected by the detonations, and less around the intact tunnel system. Seismic wavefield polarization and normal mode analysis at the site Flue indicate a normal mode behavior at 3 Hz, probably due to a 2D structure with degraded material supposedly limited by the existing fracture system. The ground motion has a dominant E-W deflection and a maximum amplification of 6–7 in direction of polarization. This mirrors the dominant local fracture and fault system as these systems strike N/S and enable the rock mass to vibrate E-W, which is represented in the E-W deflection of the polarization data. These results build on the observation that the rock wall bounding the meadow Flue, which strikes N/S, enables the rock mass in the western part of the Flue to tilt westward. In front of Dreispitz this freedom to tilt westward is bounded by the connection to the Dreipsitz towers. The ambient vibration data permit to see a structural connection between the structure Dreispitz and Flue, since signals show strong similarities at frequencies around 3 Hz.
At the current morphology of the meadow Flue, no surface expressions of the subsurface fracture systems are visible. Nevertheless, when looking on images taken shortly after the explosion, we were able to trace slope breaks along the meadow Flue and determine their approximate location on the aerial image (Figure 10). There are two distinct slope breaks in the historic image of Beck (1948) running from west to east at a length of about 100 m. A third slope break can be located 50 m east of the Dreispitz towers on the Flue running in N/S direction (Figure 10A). When plotting the approximate locations of the slope breaks on the map (Figure 10B), both surface breaks running east-west directly locate above chamber II and chamber IV of the tunnel system. The surface expression running north-south plots well above the fracture system parallel to the Mitholz-fault. Reading historic reports (e.g. Beck, 1948; Schneider, 2019) about the reconstruction of the detonations within the different chambers of the tunnel system (I–VI), proves this observation: the strongest explosions must have happened in chamber II and chamber IV, since at this point of time, the destruction of the rock mass within the tunnels was visible even at the slopes surface in 1948. Thus it can be concluded that the fracture system is persistent throughout the entire Flue starting at the elevation of the ammunition depot and reaching the top of the Flue 100 m of altitude higher.
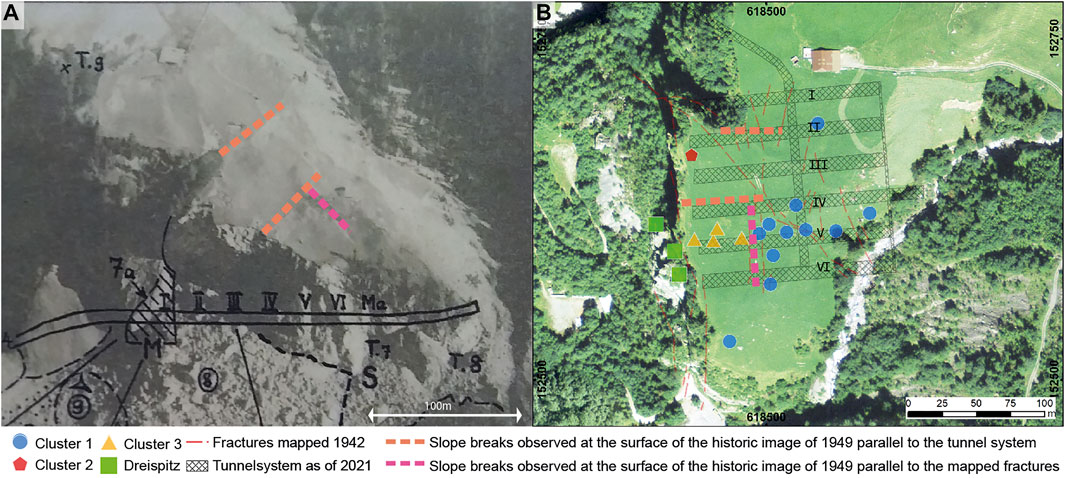
FIGURE 10. Surface morphology directly after the detonations in 1947; (A) Morphologic surface expressions due to displacements within the tunnel system caused by the detonations, seen on an aerial image of the Flue taken in 1948 and (from Beck, 1948, Tafel IV); (B) Supposed fractures mapped in (A) projected on the latest aerial image of the area with the location and numbering (I–VI) of the tunnel system 100 m of elevation below.
When looking at the cluster analysis in “Wave Amplification” Section, it can be seen that stations located on Flue are separated by the dominant fracture system running north-south through the Flue (see Figure 10B blue circles for cluster 1 and orange triangles for cluster 3). The surface breaks traced on the historic image of 1948 (Figure 10A) support this observation, since these slope breaks cannot be traced east of the dominant fracture system running north-south. Thus it can be conducted that the clusters formed from the analysis of the seismic data of 2019, have their origin from the dominant fracture sets of the rock mass underneath.
Discussion and Conclusions
Measurements presented in this paper support our hypothesis that a rock mass disturbed from subsurface explosions shows a similar signal in ambient vibration data as unstable rock slopes do. The normal mode behavior clearly indicates a volume-controlled behavior caused by the large fracture systems and an increased rock mass degradation induced by the explosions. This directly influences the overall elastic properties of the rock mass.
Calibration of the numerical model was performed by varying the Young’s modulus until resonant frequency and amplification factors modelled by UDEC agreed with the observed field data. Estimating the deformation modulus of a rock mass is crucial to analyze a rock mass behavior that includes deformation. From the existing empirical relationships for estimating the value of isotropic rock mass deformation modulus (Rock Mass Rating (RMR), Bienawski, 1993; Tunneling Quality Index (Q), Barton, 1988; Geological Strength Index (GSI), Hoek and Brown, 1997) we used a GSI of 70 for a first estimation of the deformation modulus. For a more realistic estimate and due to the fact, that heavy blast damages result in the disturbance of the rock mass, a disturbance factor D of 0.8 for the entire Flue and 0.9 for Dreispitz was applied. However, other fundamental dynamic properties, such as normal mode shapes (polarization) and modal damping ratios were not considered. Burjanek et al. (2019) showed by numerical models that damping primarily depends on the contrast in elastic moduli between fracture and rock mass. Therefore, measuring damping (e.g., as described by Häusler et al., 2021) could provide important information about fracture stiffness, which were held constant in this study and, thus pose a major source of uncertainties.
It is important to interpret the present results of the UDEC modeling in the light of the limitations of numerical simulations. Such simulations require a large number of assumptions and simplifications that influence the results. In this study, earthquake stability was assessed using 2D cross-sections. Although the ambient vibration measurements showed that the wave polarization is indeed mainly in the E-W direction, and thus a 2D section in the E-W direction is justified, the reproducibility of some 3D aspects of the field measurements remain limited in the model. It is also possible that this overestimates stability, since motions and kinematic degrees of freedom with north-south components are not considered in the profile. Fracture growth and strength loss is only possible along the specified interfaces, but not across the blocks. This means that the kinematics are partially prescribed and the kinematic degrees of freedom are underestimated. In particular, this prevents the explicit modeling of crashes of small blocks, but also of collapses or downbursts. These hazard patterns must therefore be interpreted from the deformation patterns and shear rates along interfaces. The partially backfilled cavern (train tunnel) was geometrically simplified. In particular, the backfilling with loose material was not explicitly represented for reasons of computational time. Since the loose material has a supporting effect on the cavern walls, the model can be considered pessimistic. The estimation of strength parameters is subject to large uncertainties, since these properties cannot be determined directly in the field. However, this uncertainty is taken into account in our study by also investigating a very pessimistic set of parameters for the strengths. This approach not only captures the uncertainties in the rock properties, but also the previously mentioned model properties (2D, simplified geometry, limited kinematic degrees of freedom) that make the results potentially too optimistic. Therefore, we consider the results robust because they do not differ significantly even in scenarios with pessimistic strength values (not shown here, see report CSD, 2019).
To conclude, in this study we used the results of ambient vibration measurements to calibrate a numerical model for the coseismic stability assessment of a tunnel system damaged by subsurface explosions. Kleinbrod et al. (2019) describes the classification of sites from ambient vibration measurements. In this sense the Mitholz site is a volume-controlled site with a clear resonant frequency and normal mode behavior, which was the key for calibrating the numerical model. For depth-controlled sites with amplified ground motion but no clear polarization peaks or resonant frequencies as described in Kleinbrod et al. (2019), a calibration of a numerical model poses other questions to be solved. Coseismic stability assessment of landslides is rarely conducted yet and the method described in this paper could be applied to potential mass movements as well. Therefore, this study provides a new strategy to use different approaches for the calibration of numerical models based on geophysical measurements being an important input to a better understanding of coseismic events.
Data Availability Statement
Data generated in this study and their corresponding metadata will be freely available on the ETH Research Collection upon publication via: https://www.research-collection.ethz.ch. For review purpose, data can be accessed on https://libdrive.ethz.ch, which will be linked to the ETH Research Collection upon publication. Instructions for data access are given in the metadata on the ETH Research Collection.
Author Contributions
Conceptualization: FG, MH, and DF; Methodology: FG, MH, VG, and DF; Formal analysis: FG and DF; Field Investigation: FG and MH; Numerical simulations: VG; Writing—original draft preparation: FG; Writing—review and editing: FG, MH, VG, and DF; Visualization: FG, MH, VG; Supervision, DF. All authors have read and agreed to the published version of the manuscript.
Funding
This research was funded through contracts with Armasuisse Federal Department of Defense, Civil Protection and Sports (VBS), and research projects SNF-200021E_177586 “4D seismic response and slope failure” and ETH-0-20361-17 “Skyfall”. The funders had no role in the design of the study; in the collection, analyses, or interpretation of data; in the writing of the manuscript, or in the decision to publish the results.
Conflict of Interest
Author VG was employed by CSD Ingenieure AG.
The remaining authors declare that the research was conducted in the absence of any commercial or financial relationships that could be construed as a potential conflict of interest.
Publisher’s Note
All claims expressed in this article are solely those of the authors and do not necessarily represent those of their affiliated organizations, or those of the publisher, the editors and the reviewers. Any product that may be evaluated in this article, or claim that may be made by its manufacturer, is not guaranteed or endorsed by the publisher.
Acknowledgments
We thank P. Bucher (VBS, armasuisse facility management) and B. Cavelti (Ingenieurbureau Heierli AG) for their collaboration and access to the site. We thank Chr. Rütimann and M. Fuchs (Monitron AG) for help in the field. We further thank our field helpers (M. Studer, J. Junker) for their efforts. Any use of trade, firm, or product names is for descriptive purposes only and does not imply endorsement by ETH Zurich or the Swiss government.
Supplementary Material
The Supplementary Material for this article can be found online at: https://www.frontiersin.org/articles/10.3389/feart.2021.773155/full#supplementary-material
References
Aebi, F. M. (1969). Zusammenfassende Darstellung der Explosionskatastrophe vom 19. und 20. Dezember 1947 in der unterirdischen Munkitionsanlage Mitholz, 29. Thun: Gruppe für Rüstungsdienste.
Bard, P.-Y., Cadet, H., Endrun, B., Hobiger, M., Renalier, F., Theodulidis, N., et al. (2010). “From Non-invasive Site Characterization to Site Amplification: Recent Advances in the Use of Ambient Vibration Measurements,” in Earthquake Engineering in Europe. Editors M. Garevski, and A. Ansal (Dordrecht: Springer Netherlands), 105–123. doi:10.1007/978-90-481-9544-2_5
Barton, N. (1988). “Rock Mass Classification and Tunnel Reinforcement Selection Using the Q-System,” in Rock Classification Systems for Engineering Purposes (Philadelphia: ASTM International).
Beck, P. (1948). Der Ablauf der Explosionskatastrophe von Blausee-Mitholz nach Auffassung des Geologen. Thun: Archiv Mitholz.
Bieniawski, Z. T. (1993). “Classification of Rock Masses for Engineering: the RMR System and Future Trends,” in Rock Testing and Site Characterization (State College (PA): Elsevier), 553–573. doi:10.1016/b978-0-08-042066-0.50028-8
Bonnefoy-Claudet, S., Cotton, F., and Bard, P.-Y. (2006). The Nature of Noise Wavefield and its Applications for Site Effects Studies. Earth-Science Rev. 79 (3), 205–227. doi:10.1016/j.earscirev.2006.07.004
Borcherdt, R. D. (1970). Effects of Local Geology on Ground Motion Near San-Francisco-Bay. Bull. Seismological Soc. America 60 (1), 29.
Bottelin, P., Lévy, C., Baillet, L., Jongmans, D., and Guéguen, P. (2013). Modal and thermal Analysis of Les Arches Unstable Rock Column (Vercors Massif, French Alps). Geophys. J. Int. 194 (2), 849–858. doi:10.1093/gji/ggt046
Brincker, R., and Ventura, C. E. (2015). Introduction to Operational Modal Analysis. Chichester, England: Wiley.
Brincker, R., Zhang, L., and Andersen, P. (2001). Modal Identification of Output-Only Systems Using Frequency Domain Decomposition. Smart Mater. Struct. 10 (3), 441–445. doi:10.1088/0964-1726/10/3/303
Burjanek, J., Cauzzi, C., Fäh, D., Bard, P.-Y., Cornou, C., Pitilakis, K., et al. (2012). “Toward Reliable Characterization of Sites with Pronounced Topography and Related Effects on Ground Motion.” in Paper presented at the 15th World Conference on Earthquake Engineering (15WCEE). September, 24-28. Lisbon: Portugal. http://hdl.handle.net/20.500.11850/61207.
Burjánek, J., Edwards, B., and Fäh, D. (2014). Empirical Evidence of Local Seismic Effects at Sites with Pronounced Topography: a Systematic Approach. Geophys. J. Int. 197 (1), 608–619. doi:10.1093/gji/ggu014
Burjánek, J., Gassner-Stamm, G., Poggi, V., Moore, J. R., and Fäh, D. (2010). Ambient Vibration Analysis of an Unstable Mountain Slope. Geophys. J. Int. 180 (2), 820–828. doi:10.1111/j.1365-246X.2009.04451.x
Burjánek, J., Kleinbrod, U., and Fäh, D. (2019). Modeling the Seismic Response of Unstable Rock Mass with Deep Compliant Fractures. J. Geophys. Res. Solid Earth 124 (12), 13039–13059. doi:10.1029/2019jb018607
Capolongo, D., Refice, A., and Mankelow, J. (2002). Evaluating Earthquake-Triggered Landslide hazard at the basin Scale through GIS in the Upper Sele River valley. 23(6), 595–625.doi:10.1023/a:1021235029496
Chieppa, D., Hobiger, M., Bergamo, P., and Fäh, D. (2020). Ambient Vibration Analysis on Large Scale Arrays when Lateral Variations Occur in the Subsurface: A Study Case in Switzerland. Pure Appl. Geophys. 177 (9), 4247–4269. doi:10.1007/s00024-020-02516-x
Colombero, C., Jongmans, D., Fiolleau, S., Valentin, J., Baillet, L., and Bièvre, G. (2021). Seismic Noise Parameters as Indicators of Reversible Modifications in Slope Stability: A Review. Surv. Geophys. 42 (2), 339–375. doi:10.1007/s10712-021-09632-w
Crawford, R., and Ward, H. S. (1964). Determination of the Natural Periods of Buildings. Bull. Seismological Soc. America 54 (6A), 1743–1756. doi:10.1785/bssa05406a1743
Danneels, G., Bourdeau, C., Torgoev, I., and Havenith, H.-B. (2008). Geophysical Investigation and Dynamic Modelling of Unstable Slopes: Case-Study of Kainama (Kyrgyzstan). Geophys. J. Int. 175 (1), 17–34. doi:10.1111/j.1365-246X.2008.03873.x
Flück, W., Furrer, H., and Ackermann, A. (1993). Landeshydrologie und, g. (Cartographer). Zürich: Adelboden.
Geneva International Centre for Humanitarian Demining (2008). A Guide to Ammunition Storage. First Edition. Geneva: Centre International de Deminage Humanitaire, 76.
Gischig, V. S., Eberhardt, E., Moore, J. R., and Hungr, O. (2015). On the Seismic Response of Deep-Seated Rock Slope Instabilities - Insights from Numerical Modeling. Eng. Geology. 193, 1–18. doi:10.1016/j.enggeo.2015.04.003
Häusler, M., Michel, C., Burjánek, J., and Fäh, D. (2021). Monitoring Rock Slope Instabilities Using Frequency Domain Decomposition Modal Analysis.” in Paper presented at the EGU General Assembly Conference Abstracts.
Häusler, M., Gischig, V., Thöny, R., Glueer, F., and Fäh, D. (2021). Monitoring the Changing Seismic Site Response of a Fast-Moving Rockslide (Brienz/Brinzauls, Switzerland). Geophys. J. Int.
Häusler, M., Michel, C., Burjánek, J., and Fäh, D. (2019). Fracture Network Imaging on Rock Slope Instabilities Using Resonance Mode Analysis. Geophys. Res. Lett. 46 (12), 6497–6506. doi:10.1029/2019gl083201
Häusler, M., Michel, C., Burjánek, J., and Fäh, D. (2021). Monitoring the Preonzo Rock Slope Instability Using Resonance Mode Analysis. J. Geophys. Res. Earth Surf. 126 (4), e2020JF005709. doi:10.1029/2020JF005709
Havenith, H.-B., Jongmans, D., Faccioli, E., Abdrakhmatov, K., and Bard, P.-Y. (2002). Site Effect Analysis Around the Seismically Induced Ananevo Rockslide, Kyrgyzstan. Bull. Seismological Soc. America 92 (8), 3190–3209. doi:10.1785/0120010206
Hobiger, M., Bergamo, P., Imperatori, W., Panzera, F., Lontsi, A. M., Perron, V., and Fäh, D. (2021). Site Characterization of Swiss Strong‐Motion Stations: The Benefit of Advanced Processing Algorithms. Albany: Bulletin of the Seismological Society of America.
Hoek, E., and Brown, E. T. (1997). Practical Estimates of Rock Mass Strength. Int. J. Rock Mech. Mining Sci. 34 (8), 1165–1186. doi:10.1016/s1365-1609(97)80069-x
Hoek, E., and Diederichs, M. S. (2006). Empirical Estimation of Rock Mass Modulus. Int. J. Rock Mech. Mining Sci. 43 (2), 203–215. doi:10.1016/j.ijrmms.2005.06.005
Itasca, U. (2019). UDEC 7.0 — Universal Distinct Element Code, Ver. 7.0. Minneapolis: Itasca. Itasca Consulting Group, Inc.
Jennings, J. (1970). “A Mathematical Theory for the Calculation of the Stability of Slopes in Open Cast Mines,” in Paper Presented at the Planning Open Pit Mines (Johannesburg: Proceedings).
Jibson, R., Rathje, E., Jibson, M., and Lee, Y. (2013). SLAMMER: Seismic Landslide Movement Modeled Using Earthquake Records. Denver, 2328–7055.
Kleinbrod, U., Burjánek, J., and Fäh, D. (2019). Ambient Vibration Classification of Unstable Rock Slopes: A Systematic Approach. Eng. Geology. 249, 198–217. doi:10.1016/j.enggeo.2018.12.012
Kleinbrod, U., Burjánek, J., and Fäh, D. (2017). On the Seismic Response of Instable Rock Slopes Based on Ambient Vibration Recordings. Earth Planets Space 69, 5. doi:10.1186/s40623-017-0712-5
Kleinbrod, U., Burjánek, J., Hugentobler, M., Amann, F., and Fäh, D. (2017). A Comparative Study on Seismic Response of Two Unstable Rock Slopes within Same Tectonic Setting but Different Activity Level. Geophys. J. Int. 211 (3), 1428–1448. doi:10.1093/gji/ggx376
Kummer, P., Nussbaumer, P., Bürge, M., Scheiwiller, A., Muckel, M., and Winkelmann, K. (2018). 1051/AA Risikoanalyse Schlussbericht.
Lee, S., Evangelista, D. G., and Sciences, E. S. (2006). Earthquake-induced Landslide-Susceptibility Mapping Using an Artificial Neural Network. Nat. Hazards Earth Syst. Sci. 6 (5), 687–695. doi:10.5194/nhess-6-687-2006
Lloyd, S. (1982). Least Squares Quantization in PCM. IEEE Trans. Inform. Theor. 28 (2), 129–137. doi:10.1109/TIT.1982.1056489
Lombardi, V. (2015). Stellungnahme SPEGEO zu den Felskennwerten (Vorschlag Lombardi) 070191 N03/70 Kerenzerbergtunnel Sicherheitsstollen / DP. St. Gallen: CSD Ingenieure 27.8.
Mascandola, C., Massa, M., Barani, S., Albarello, D., Lovati, S., Martelli, L., et al. (2019). Mapping the Seismic Bedrock of the Po Plain (Italy) through Ambient‐Vibration Monitoring. Bull. Seismological Soc. America 109 (1), 164–177. doi:10.1785/0120180193
Mercerat, E. D., Payeur, J. B., Bertrand, E., Malascrabes, M., Pernoud, M., and Chamberland, Y. (2020). Deciphering the Dynamics of a Heterogeneous sea cliff Using Ambient Vibrations: Case Study of the Sutta-Rocca Overhang (Southern Corsica, France). Geophys. J. Int. 224 (2), 813–824. doi:10.1093/gji/ggaa465
Michel, C., Edwards, B., Poggi, V., Burjánek, J., Roten, D., Cauzzi, C., et al. (2014). Assessment of Site Effects in Alpine Regions through Systematic Site Characterization of Seismic Stations. Bull. Seismological Soc. America 104 (6), 2809–2826. doi:10.1785/0120140097
Michel, C., Guéguen, P., El Arem, S., Mazars, J., and Kotronis, P. (2009). Full-scale Dynamic Response of an RC Building under Weak Seismic Motions Using Earthquake Recordings, Ambient Vibrations and Modelling. Earthquake Engng Struct. Dyn. 39 (4), a–n. doi:10.1002/eqe.948
Nakamura, Y. (1989). A Method for Dynamic Characteristics Estimation of Subsurface Using Microtremor on the Ground Surface. Q. Rep. Railw Tech. Res. Inst. 30 (1), 25–33.
Perron, V., Gélis, C., Froment, B., Hollender, F., Bard, P.-Y., Cultrera, G., et al. (2018). Can Broad-Band Earthquake Site Responses Be Predicted by the Ambient Noise Spectral Ratio? Insight from Observations at Two Sedimentary Basins. Geophys. J. Int. 215 (2), 1442–1454. doi:10.1093/gji/ggy355
Poggi, V., and FÃh, D. (2010). Estimating Rayleigh Wave Particle Motion from Three-Component Array Analysis of Ambient Vibrations. 180(1), 251–267. doi:10.1111/j.1365-246X.2009.04402.x
Prieto, G. A., Parker, R. L., and Vernon III, F. L. (2009). A Fortran 90 Library for Multitaper Spectrum Analysis. Comput. Geosciences 35 (8), 1701–1710. doi:10.1016/j.cageo.2008.06.007
Ricker, N. (1943). Further Developments in the Wavelet Theory of Seismogram Structure*. Bull. Seismological Soc. America 33 (3), 197–228. doi:10.1785/bssa0330030197
Schneider, H. R. (2019). Die Schreckensnacht von Mitholz : 19./20. Dezember 1947 : die Geschichte rund um eine unterirdische Militäranlage. Frutigen: Verlag HS-Publikationen, 1. Auflage, 228.
Ständer, G. (1942). Geologisches Gutachten Betreffend Unterirdische Armeemagazine Blausee-Mitholz. Thun.
Thomson, D. J. (1982). Spectrum Estimation and Harmonic Analysis. Proc. IEEE 70 (9), 1055–1096. doi:10.1109/PROC.1982.12433
Vantassel, J., Cox, B., Wotherspoon, L., and Stolte, A. (2018). Mapping Depth to Bedrock, Shear Stiffness, and Fundamental Site Period at CentrePort, Wellington, Using Surface‐Wave Methods: Implications for Local Seismic Site Amplification. Bull. Seismological Soc. America 108 (3B), 1709–1721. doi:10.1785/0120170287
Keywords: ambient vibration measurements, explosion-induced damage, site effects, wave propagation, coseismic failure, seismic stability assessment
Citation: Glueer F, Häusler M, Gischig V and Fäh D (2021) Coseismic Stability Assessment of a Damaged Underground Ammunition Storage Chamber Through Ambient Vibration Recordings and Numerical Modelling. Front. Earth Sci. 9:773155. doi: 10.3389/feart.2021.773155
Received: 09 September 2021; Accepted: 10 November 2021;
Published: 17 December 2021.
Edited by:
Sylvie Demouchy, Centre National de la Recherche Scientifique (CNRS), FranceReviewed by:
Fuqiong Huang, China Earthquake Networks Center, ChinaAlexey Lyubushin, Institute of Physics of the Earth (RAS), Russia
Copyright © 2021 Glueer, Häusler, Gischig and Fäh. This is an open-access article distributed under the terms of the Creative Commons Attribution License (CC BY). The use, distribution or reproduction in other forums is permitted, provided the original author(s) and the copyright owner(s) are credited and that the original publication in this journal is cited, in accordance with accepted academic practice. No use, distribution or reproduction is permitted which does not comply with these terms.
*Correspondence: Franziska Glueer, RnJhbnppc2thLmdsdWVlckBzZWQuZXRoei5jaA==