 Ke Zhu
 Yifan Zeng1,2*
- 1College of Geoscience and Surveying Engineering, China University of Mining and Technology (Beijing), Beijing, China
- 2National Engineering Research Center of Coal Mine Water Hazard Controlling, Beijing, China
Although buildings are often heated and cooled by single-well circulation coupled groundwater heat pump systems, few studies have evaluated the long-term performance of these systems. Therefore, the present study investigated the performance of these systems by analyzing the efficiency and energy consumption using 4 years of operating data. The results indicate that the coefficient of performance (COP) of the system gradually decreases because of thermal breakthrough or an accumulation of cold. In addition, the sealing clapboards could effectively slow down thermal breakthrough. In addition, compared with the heating period, the COP of the heat pump unit (HPU) and system increases, and its energy consumption decreases in the cooling period. It was also found that partial heat loss occurs when water from the single-well circulation outlet penetrates the main pipeline. Moreover, the heat-exchange efficiency of a single HPU exceeds that of multiple HPUs, and the COP of a HPU decreases during operation with increasing indoor temperature. Accordingly, we improved the performance of system by increasing the underground heat storage. Herein, we focus on optimizing the system design during long-term operation, which includes taking steps such as lengthening the sealing clapboards, using insulated pipes, discharging the remaining water and adding intelligent control devices.
Introduction
In the context of the global energy and environmental crisis, groundwater heat-pump (GWHP) systems have been extensively implemented to use shallow geothermal energy sources for heating or cooling of residential and commercial buildings (Li et al., 2013). In winter, groundwater is extracted and used as a heat source to heat to residential or commercial buildings; in summer, groundwater is extracted as a cold source to cool buildings by reversing the heat-pump system. Furthermore, surplus heat is injected underground, which is serves as a heat storage medium for thermal energy. Compared with other types of traditional heating, ventilation, and air conditioning (HVAC) systems, GWHP systems consume less electric power and generate more heat energy without producing polluting gas and without the consumption of groundwater (Luo et al., 2018; Blázquez et al., 2019; Fang and Zhang, 2020; Luo et al., 2020; Qiu et al., 2021; Zhang et al., 2021).
With the development of GWHP systems, many different GWHP systems have been applied in practical engineering. The single-well circulation (SWC) coupled GWHP system, as a new technology that has attracted extensive attention. As shown in Figure 1, the SWC system consists of three parts: a lower pumping zone, a middle sealing zone and an upper injection zone. First, the lower pumping zone is filled with groundwater into which is placed a submersible pump connected to a suction pipe. Groundwater is pumped by the submersible pump through a suction pipe into the machine room. Pumping groundwater exchanges heat via the heat-pump units (HPUs). Next, the upper injection zone is filled with heat-exchanged groundwater, which is injected through the discharge tube into the upper injection zone. Third, the middle sealing zone contains clapboards to prevent the heat-exchanged groundwater from entering the pumping well. Gravity-induced pressure causes the heat-exchanged water to exchange heat with surrounding rock and soil before it flows back to the pumping area. In the whole process, the system extracts heat without consuming groundwater by completely recharging in the same layer (Sun et al., 2015). The system also offers the advantages of lower initial investment and operational costs, a smaller footprint, and a diminished on groundwater quality (Song et al., 2019a), which has led to the wide use of these systems in practical engineering.
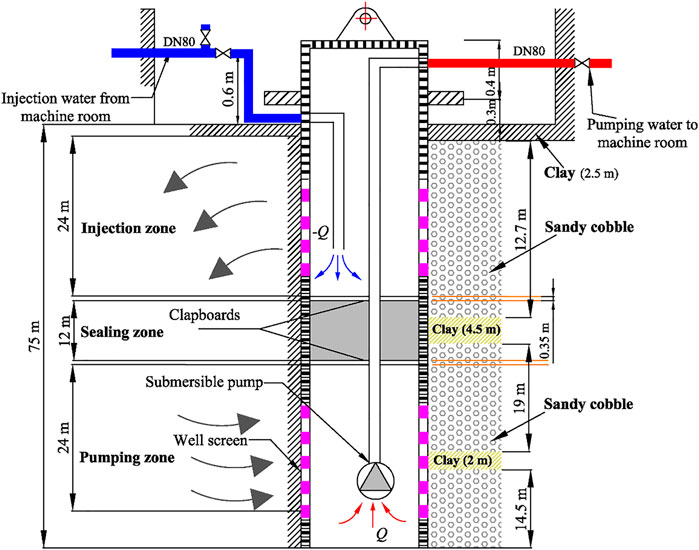
FIGURE 1. Schematic diagram of the SWC system.
As far as we known, the performance and efficiency of other forms of heat-pump systems decrease over long-term operation (Sommer et al., 2015; Hein et al., 2016). Significant research efforts have sought to avoid the phenomenon and promote the efficient and sustainable operation of SWC coupled GWHP systems in practical engineering. First, in terms of system design, Yuill and Mikler (1995) and Mikler (1993) found that the equivalent thermal conductivity coefficient can be used to calculate the depth of the thermal well by using a model involving coupled thermohydraulic energy transfer in an aquifer surrounding a thermal well. By investigating successful commercial cases of SWC systems, Orio et al. showed that the key parameter of an SWC system design must be “bleed” (Orio, 1994; Orio et al., 2005). They also reported that bleeding can keep the SWC system sustainable when the system design assumes suitable hydrological and geological conditions. In other work, Wu et al. (2015) found that the aquifer properties should be determined and considered in the system design to maximize efficiency, reduce installation costs, and minimize environmental impact. Through field and numerical studies, Park et al. (2015) verified that thermal dispersion significantly affects the heat transfer of SWC systems with high flow rate, which is important for system design. Deng et al. (2005) established a computationally efficient numerical model of groundwater flow and heat transfer in and around SWC systems, which serves as a design tool.
Site conditions including seepage field, temperature field, groundwater level, and surface temperature, are also relatively important to maintain the efficiency and stability of SWC systems. In an extreme cold-climate experiment, Minea (2013) found that the residential SWC systems in Canada are not suitable for extreme cold weather without seepage, whereas Nguyen et al. (2020) reported that SWC systems can be used in cold climates. By simulating a seepage field, it has been found that groundwater seepage and fluid flow improves thermal conductivity and enhances the heat-transfer capacity of the heat exchanger (Deng et al., 2006; Al-Sarkhi et al., 2008). However, Kastrinos et al. (2019) found that heat transfer caused by horizontal groundwater flow is very small by injecting tracer bromide into an SWC system. Using a thermal-response experiment, Chang et al. (2017); Chang et al., 2019) investigated how hydrogeology affects the thermal characteristics of an SWC system and found that groundwater flow has negligible impact on the thermal conductivity of an SWC system. Finally, three-dimensional numerical models of the seepage field and temperature field were developed by Lee (2011) and Song et al. (2019b), and these showed that groundwater flow improves thermal transport and heat transfer. By modeling groundwater seepage and heat transfer, Ni et al. (2011) derived an analytic seepage solution to show that SWC systems can accommodate large space heating and cooling loads with a thermal effective radius exceeding 40 m. To investigate SWC seepage fields, Tu et al. (2018); Tu et al., 2020a; Tu et al., 2020b) developed a mathematical model and derived an analytical solution for groundwater flow and an approximate analytical solution for non-Darcian flow. The results reveal how the flow field varies as a function of SWC. By using numerical simulations, Wu et al. (2018) and Choe and Ko (2017) studied how hydrogeology and thermogeological affect thermal performance, sustainability, and efficiency of SWC systems.
Researchers also considered operational strategies to analyze the sustainability of SWC systems and found that heat storage should be increased to maintain the efficient and sustainable operation of SWC systems in practical operation (Song et al., 2019a; Lee et al., 2019). Zeng et al. (2017) found that the groundwater quality in areas where SWC strongly effects system operation and can reduce equipment efficiency and lifetime. Léo et al., (2020) found that excess calcium concentration in groundwater can degrade system efficiency, requiring the calcium concentration to be decreased by operating a groundwater treatment unit, using suitable flowmeters, and purging the above-ground piping network, which requires a prolonged downtime period.
These studies show the significant research that has been conducted on the sustainable use of SWC systems, and have focused on system design, site conditions and operational strategies through both simulations and experiments. However, relatively few studies have considered the repercussions of the long-term operation of SWC coupled GWHP systems. In particular, little information is available on the relevant parameters for practical engineering experimentation, despite these parameters affecting the long-term operation of SWC systems. Researchers and designers would thus like to know the parameters and factors influencing SWC systems in practical operation so that the SWC can be better promoted and applied.
Given these difficulties, we report herein on a 4 year field test of an SWC coupled GWHP system conducted in Beijing, China. Based on data measured over 4 years, we studied the factors that reduce the SWC system efficiency and increase energy consumption to evaluate the long-term performance of this SWC system. In addition, we suggest ways to optimize SWC systems, including suggestions on operational strategies and system design. The results are significant for practical engineering and related research.
Experimental Apparatus and Methods
Description of Building
The SWC system was installed in a school building in the Haidian District of, Beijing. The building has four floors above ground and two floors underground, is 18 m high, and has a total floor area of 45,952 m2. The main functional areas of the building are classrooms, gymnasiums and other teaching rooms. The total heating and cooling loads of the building are 3,450 and 3,600 kW, respectively. In addition, the hot-water heating and swimming-pool heating loads sum to 514 kW. The heating period lasts 120 days (from November 15 to March 15), and the SWC system operates daily from 7:00 to 16:00. The cooling period is 122 days (from May 15 to September 15), and the system operating time is from 8:00 to 16:00. For this paper, 4 years of monitoring data were collected (2016–2019), with the academic year 2016-2017 serving as the system trial operation stage. During the monitoring period, the groundwater level was recorded for all 4 years. The total energy consumption was also collected from May 2016 to Dec 2019, while the system was shut down in the transition period without data. Data relating to the practical operation of the system was collected from May 2016 to July 2018.
Site Conditions
According to a geological survey of the project site, a quaternary system is widely distributed over the working area. The stratum lithology consists mainly of gravel, sand gravel and coarse sand gravel with a thin cohesive-soil layer between the gravel and sand gravel. The quaternary system is about 150 m thick, and the cumulative thickness of the aquifer is 80–120 m. When the groundwater level drops by 1 m, the water yield of a single well is more than 5,000 m3/d. The heat-exchange capacity of the SWC system was designed to be 300 kW in winter and 420 kW in summer. Finally, the circulating water flow was about 60 m3/h, and the well was 70–80 m deep.
System Configuration
Figure 2 shows a schematic diagram of the monitoring system of the SWC coupled GWHP system. The SWC system is composed essentially of four parts: energy collection, energy boost, energy release and monitoring well area. In Figure 2, the energy collection area contains the 12 sets of SWCs devices that enter the theoretical calculation. Non-storage particle geothermal energy collection wells were used. The energy boost area is divided into two parts: the heating-cooling part and the part for heating water. The machine room contains four sets of HPUs. Two YSSR-1300A/2 and one YSSR-700A/2 geothermal HPUs are selected to meet the building heating and cooling requirements, and one YSSR-600B/2 heats the swimming pool and provides domestic hot water. The energy release area consists of a circulating pump, a water divider, and a water collector. The air conditioning units mainly use fan coils and floor radiators to meet the cooling and heating requirements of the building. The monitoring well area consists of a well for monitoring the groundwater level and a well for monitoring the underground temperature.
(a) energy collection area, (b) energy boost area (machine room), (c) energy release area (terminal), (d) monitoring well area.
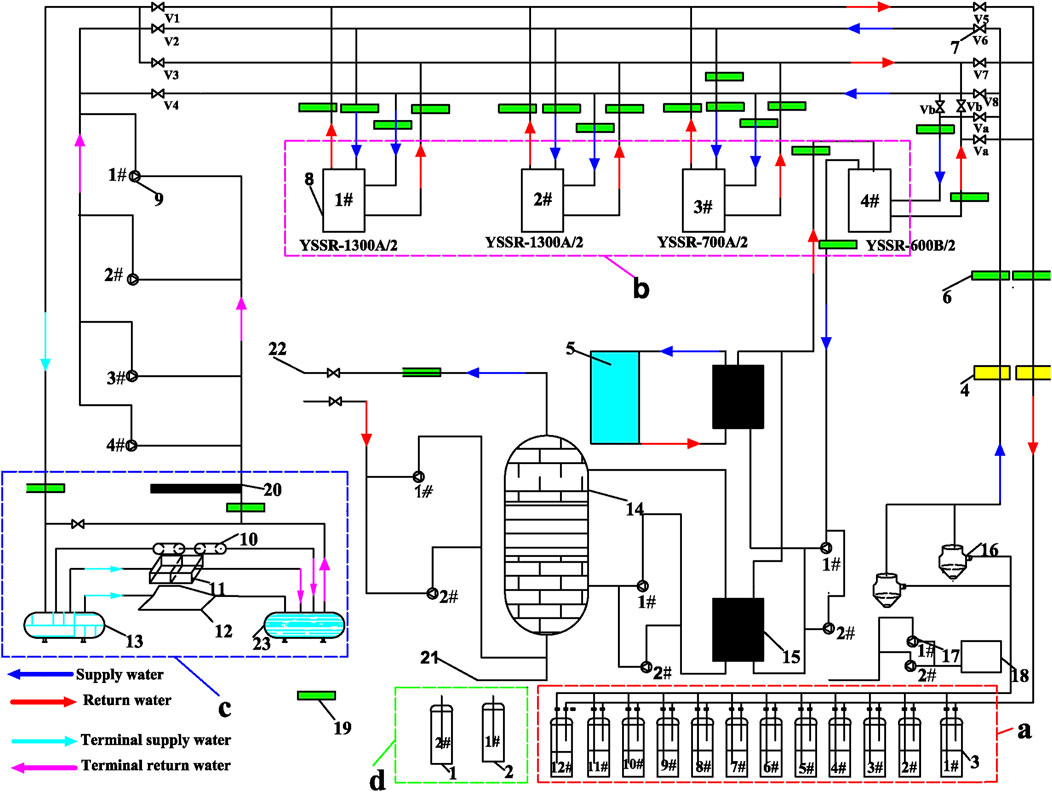
FIGURE 2. Monitoring schematic for SWC coupled GWHP system.
1: water level monitoring well, 2: underground temperature monitoring well, 3: 1#-12# SWCs, 4: circulating water flowmeter, 5: swimming pool, 6: thermoreceptor, 7: Valve, 8: 1#-4# HPUs, 9: terminal system circulating pump, 10: fan coil, 11: air condition unit, 12: floor heating, 13: water segregator, 14: water storage tank, 15: hot water heat pump, 16: heat source circulating pump, 17: terminal feed pump, 18: softened water tank, 19: outdoor temperature recorder, 20: connect the make-up pump area, 21: tap water connection, 22: hot water area, 23:mainfold.
Monitoring Methods
The monitoring data from the of SWC system monitoring part and from the two monitoring wells were collected to analyze the system’s performance. The monitoring methods are introduced below.
Temperature Monitoring
The water temperature of each key pipeline was monitored during the operation of the SWC system for the cooling period and heating period. The minimum monitoring frequency was four times per day generally and once per day during intermittent periods. The system temperature data include the outlet and inlet water temperature of the SWC systems, the supply and return water temperature of the single well-side main pipe, the supply and return water temperature of the terminal main pipe of the SWC system and the exterior temperature. The temperature parameters were measured by using a one-piece temperature transmitter.
The 1# monitoring well was 70–80 m deep and separated by 10 m from the nearest SWC. The cable for measuring the temperature was 80 m long and held 100 temperature sensors at 0.8 m intervals. The temperature measuring cables buried in the monitoring well were used to monitor the soil temperature.
Monitoring Groundwater-Level
The groundwater level is monitored by the 2# monitoring well, which is 6 m from the nearest SWC. The groundwater-level monitoring terminal automatically measures groundwater-level, and the data are saved automatically in memory and exported regularly to the computer.
Monitoring Groundwater Circulation
During the operation of the SWC system, the following flow rates are monitored: 12 sets of SWCs inlet-outlet pipe flows, the well-side main pipeline supply-return water flow, the circulating pump supply-return water flow, and other parameters. The minimum monitoring frequency was once per month during the operation period.
Power Consumption Record
The main operating cost of the SWC system is electricity charge, which is required to monitor the SWC system’s operational costs and to analyze its power consumption. During the operation of the SWC system, electric meters were set up to monitor the electric consumption of the submersible pump of the single well, the circulating pump and the HPUs. There were two compressors for the 1# and 2# HPUs, respectively, and each compressor was equipped with an electric meter. The 3# and 4# HPUs were also equipped with electric meter, respectively. The 4# HPU and 12 branches of the submersible pumps used the same electric meter. The following automatic calculations occurred in the background: cumulative total power of submersible pump equals the cumulative power of the 4# unit and the 12 submersible pump branches minus the cumulative power of the 4# unit.
Monitoring Platform
The monitoring software had a modular structure consisting of two main modules: a communication unit and a human-machine interface. Each module was composed of several small modules. The communication unit was mainly responsible for communication between the monitoring center and the field equipment. It supported the coexistence of multiple communication methods in a system. The human-machine interface included dynamic system diagrams, a basic data display, manual input, data management and many other functions. The data-collection cycle could be set as required. The specifications of the monitoring system are shown as Table 1.
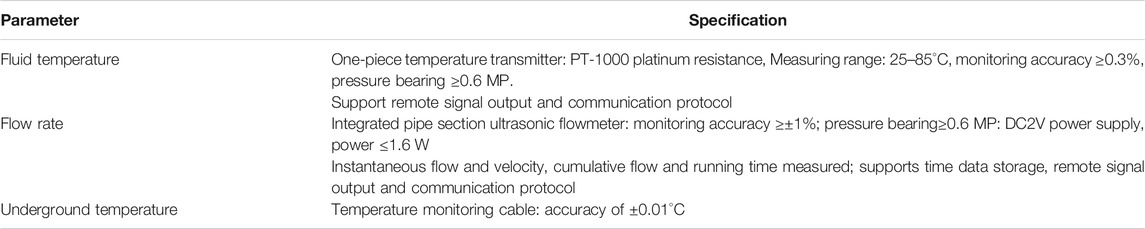
TABLE 1. Specification of the monitoring system.
Results and Discussions
Operation Characteristics of SWC System
To analyze the operating characteristics of the SWC coupled GWHP system, we collected the parameters of the well-side supply-return water temperature, the inlet-outlet temperature of 12 SWC systems, the terminal supply-return water temperature, the fluid flow rate in each link, and the exterior temperature. In addition, two typical days were selected, January 26, 2017 and July 6, 2017, to analyze the operating performance of the SWC system. The typical days were in the middle of the heating and cooling periods when the SWC system had been operating for a long time. Moreover, the SWC system operated in the steady state on the two typical days, which ensured more representative data.
Well-Side Supply-Return Water Temperature
The well-side supply-return water temperature reflects the stability of the SWC system during operation. As shown in Figure 3, the well-side supply-return water temperatures vary with time. Changes in the supply-return water temperature show a similar trend in Figure 3A. The temperature difference in the supply-return water falls in the range 1.7–4.2°C, which decreases with increasing exterior temperature. An increase in exterior temperature reduces the indoor heat load, which in turn reduces the heat exchanged in the HPU. As indicated in Figure 3A, the temperature difference is about 0.5°C between the temperature of the 7# SWC and the main pipeline. This is because the 7# SWC outlet water dissipates heat into the environment and reduces the outlet water temperature at the point where the outlet water enters the main pipeline. Therefore, the temperature of the water supply for the main pipeline is 0.5°C lower than the outlet water temperature of the 7# SWC. We further improve the efficiency by wrapping the main pipeline in insulated pipe to reduce heat loss.
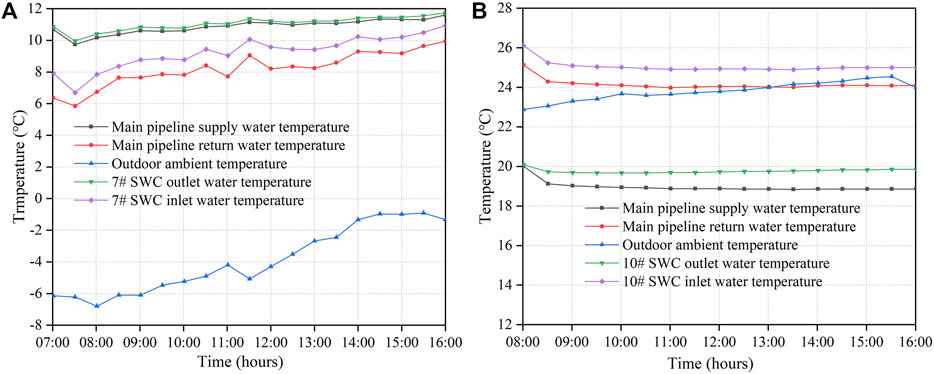
FIGURE 3. Well-side supply-return water temperature as a function of time during (A) heating period (January 26, 2017) and (B) cooling period (July 6, 2017).
The temperature of the well-side supply-return water for the SWC system during the heating period appear in Figure 3B. The temperature difference between the supply and return water is maintained at 5°C in the main pipeline, which indicates that the pumping temperature is relatively stable and not affected by the return water in the pumping area of the wells. During the cooling period, the 10# SWC outlet water temperature is higher than the temperature of the main pipeline supply water for a reason, which is similar to that of the heating period. Figures 3A,B show that the temperature difference between the supply and return water during the cooling period is greater than that during the heating period, which reveals that the cooling capacity exceeds the heating capacity given the same time and flow conditions. In addition, the efficiency of the cooling period is relatively high, and the SWC system operates stably with large thermal reserves. Furthermore, heat loss from the main pipeline significantly degrades the performance of the SWC system, therefore, we must consider heat loss when designing a SWC system.
Fluid Circulation
Figure 4 shows the mean fluid temperature (right axis) and the flow rate (left axis) as functions of time during the heating and cooling periods. The flow rate is 5.62 m3/min in the steady state, as shown in Figure 4A. The mean fluid temperature fluctuates between 10.0 and 11.5°C, giving a fluctuation range of 1.5°C. Figure 4A shows that the mean fluid temperature rises with increasing pumping capacity. The system was initially operated with a low supply-water temperature because the well supply water was mixed with return water from the previous day’s thermal breakthrough and incomplete heat exchange. With the system in operation, part of the supply water came from the aquifer, so the water temperature was higher, which explains the phenomenon. This means that the aquifer stores abundant energy, and this is beneficial for long-term operation of the system.
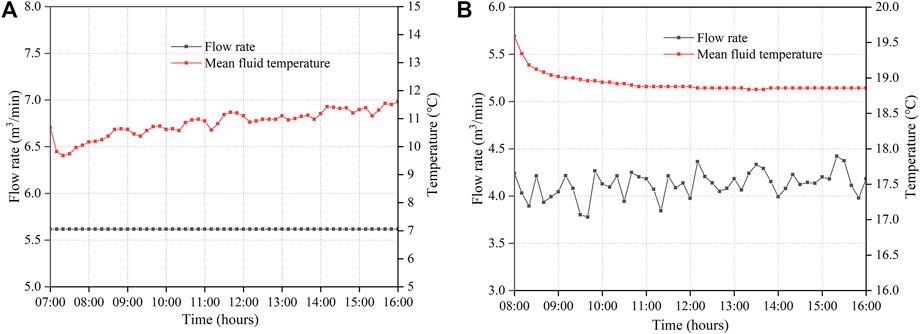
FIGURE 4. Mean fluid temperature and flow rate as functions of time during (A) heating period (January 26, 2017) and (B) cooling period (July 6, 2017).
Figure 4B shows that, during the cooling period, the flow rate and mean fluid temperature different from those during the heating period. After 30 min of operation, the flow temperature drops from 19.5 to 18.8°C and then remains stable. This evolution is attributed to the temperature monitoring device, which is affected by the surrounding environment-in this case, cooling water that flowed over in the pipe, causing a period of temperature fluctuation. The flow rate fluctuates in the range 3.7–4.4 m3/min (a fluctuation range of 0.7 m3/min). Given the essentially constant fluid temperature in Figure 4B, the SWC system is in normal operation.
Temperature of Terminal Supply-Return Water
Figure 5 shows the temperature and flow rate as functions of time of the terminal supply-return water. In the first 25 min, the temperature of the terminal supply-return water increases as the system starts operation, as shown in Figure 5A. This is because that the temperature of the water remaining in the pipe is lowered by the lower exterior temperature. Thus, the remaining water should be discharged.
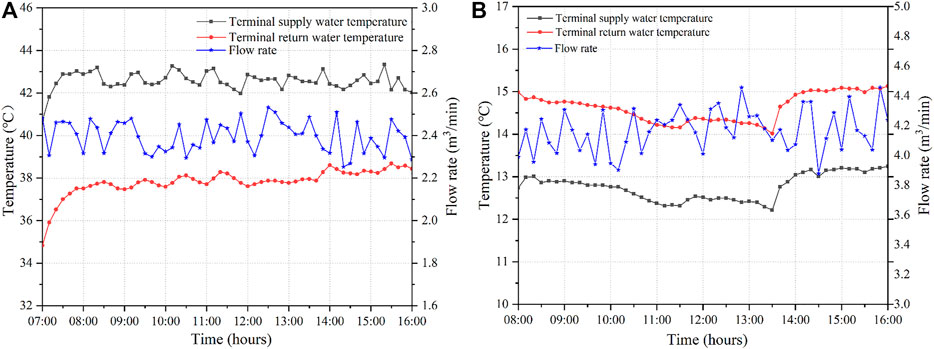
FIGURE 5. Temperature and flow rate of terminal supply-return water as a function of time during (A) operation in heating period (January 26, 2017) and (B) operation in cooling period (July 6, 2017).
The two curves also mirror each other in Figure 5B. The supply-return water of the terminal main pipe is supplied by different HPUs, so the variation indicates that the other HPUs are operating stably and properly. At 13:30, both curves rise by about 1°C because the operator adjusted the set temperature according to the actual load requirements. To meet the cooling load, the energy savings of the system are about 5% in actual operation when the supply-water temperature increase by 1°C to meet the building load, the temperature of the supply water it should be adjusted to save energy.
Geo-Temperature Field of SWC System Under Long-Term Operation
The operating performance of the SWC system is closely related to the geo-temperature field, making it necessary to monitor and analyze the underground temperature. We monitored the underground temperature of the 1# monitoring well (see Figure 6). The monthly mean underground temperatures for different depths around the SWC were recorded from January 2017 to March 2018. The underground temperatures at 10 m intervals underground (see Figure 1) serve to investigate the temperature variations.
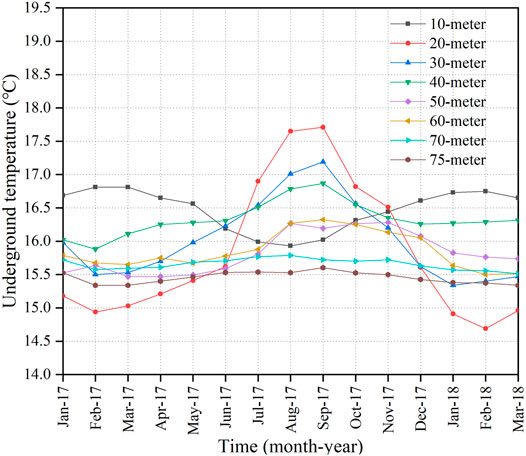
FIGURE 6. Underground temperature at different depths from January 17, 2017 to March 18, 2018.
The temperature variations at 10-m depth are opposite those of the other depths shown in Figure 6 (concave versus convex). The 10-m depth is thus within the variable-temperature part, where the temperature basically follows the annual average surface temperature. The temperature varies the most at 20-m depth, and where the curve is convex. The maximum temperature difference is about 3°C. Because the 20-m depth is near the injection zone, its temperature is significantly influenced by recharge water. During the transition period, the temperature recovers slowly, producing a natural heat exchange. During the cooling period, the surplus heat is injected underground through the injection area, and in cooling period, the temperature recovers quickly. Using the underground as a heat-storage medium is an effective way to slow the accumulation of heat or cold.
A depth of 30-m falls in the sealing partition zone and is adjacent to the injection zone. The temperature variation resembles that of the 20-m depth, but the maximum temperature difference is 2°C, and the temperature essentially returns to its original value. The 40-m depth is close to the lower part of the sealing partition zone. The temperature varies relatively slowly and weakly here, with a maximum difference of 1°C. The recharge water partially exchanges heat with the surrounding rock and soil, which has a relatively small impact on the underground temperature near 40-m depth. This result shows that the sealing partition is necessary for the SWC system to weaken or avoid thermal breakthrough.
At 50- and 60-m depth, the temperature is relatively stable, which reveals that the recharge water exchanges significant thermal energy with the surrounding rock and soil. However, the recharge water enters into the pumping area, so the temperature at 60-m depth drops by 0.35°C. The SWC system appears to suffer a thermal breakthrough, except that the temperatures at 70- and 75-m depth remain stable. However, the temperature at 70- and 75-m depth drops by 0.1°C, which reflects cold accumulation.
Analyzing the eight curves in Figure 6 shows that the temperature of each curve is periodic with a period of 15 months. However, the temperature drops over long periods at 60-,70-, and 75-m depth. In particular, the temperature drops by 0.35°C at 60-m depth, which indicates cold accumulation. This is attributed to the imbalance of the cooling and heating loads of the buildings.
To summarize, operating of the SWC system affects the underground temperature, and changes the temperature of the supply-water, and the performance of the SWC system. Therefore, the operating strategy of the SWC system must be adjusted to compensate for increasing heat storage and lengthening of the sealing clapboards.
Monitoring Groundwater Level
Monitoring the groundwater level involves investigating how a system’s operation affects the groundwater level and evaluating the sustainability of SWC systems. It is closely related to the long-term operating performance of the system. Figure 7 shows the annual average groundwater level and the monthly average groundwater level of the monitoring well from 2016 to 2019. In this study, the South-to-North Water-Diversion Project in Beijing caused a huge recharge of groundwater and a concomitant increase in groundwater level. As shown in Figure 7A, the groundwater level in Beijing increased 3 m from 2016 to 2019. Compared with the year 2017, the groundwater level in Beijing, rose by 1.94 m in 2018 and, the monitoring-well groundwater level rose by 1.98 m. From 2017 to 2019, the groundwater level fluctuated by 0.2–0.3 m between the groundwater monitoring wells and that of Beijing. Unfortunately, because of the groundwater recharge of the South-to-North Water-Diversion Project, Figure 7A does not show whether the SWC system consumes groundwater.
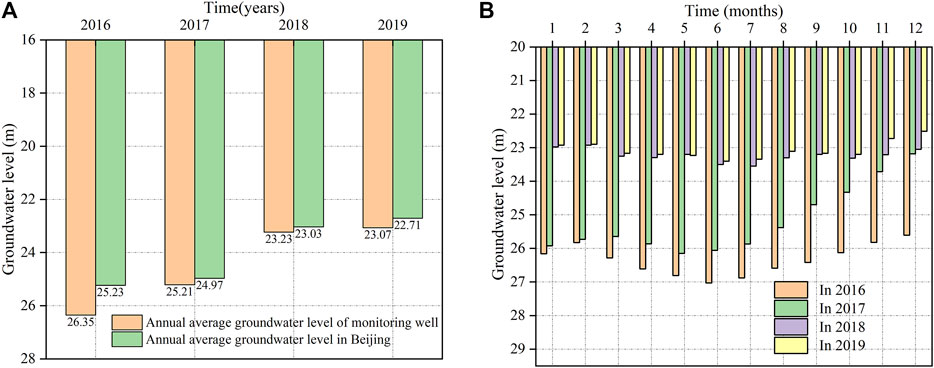
FIGURE 7. (A) Annual average groundwater level from 2016 to 2019, (B) monthly average groundwater level from 2016 to 2019.
The variations in groundwater level are basically repeated each year (see Figure 7B). The groundwater level dropped from January to June in the 4 years studied, reaching the lowest point in May or June, following which they rose from July to December. Although the groundwater level rose every year, it underwent periodic changes, except in 2017 (which is due to the recharge of the South-to-North Water- Diversion Project). Compared with the groundwater level in January, the groundwater level in December varied little from year to year (except for 2017), which indicates that the system operates without consuming groundwater.
To summarize, the operation cycle of a SWC system has a negligible impact on groundwater level, which means that SWC systems do not consume groundwater but only extract heat for building heating and cooling.
Energy Distribution of SWC Coupled GWHP System
Heat Exchange of SWC System
To determine the actual performance of SWC systems, we analyze and evaluate the heat exchange capacity (HEC) of the HPUs on the well side. The heat exchanged is expressed as:
where Q is the heat exchanged [J], ρ is the density of water [kg/m3], c is the specific heat capacity of water [J/Kg°C],
The data recorded on a typical day are used in Eq. 1. Figure 8A shows that the HEC average is 247 kW h, and the average energy consumption is 42.7 kW h. In Figure 8A, the ratio of the two averages is 1:5.88. During the cooling period, the HEC of the 2# HPU compressor is relatively high, reflecting the high efficiency and stability of the system operation. Figure 8B shows the HEC of 2# HPU for the heating period. The two curves basically mirror each other, with similar ranges of variation. The maximum HEC and energy consumption reaches 180 and 41 kW h, respectively. In Figure 8B, the ratio of energy consumption and average HEC is 1:4.5. Compared with the cooling period in Figure 8A, the heat exchange efficiency (HEE) is lower than that during the cooling period. Figure 3 shows that the difference in temperature of the supply water during the cooling period exceeds that during the heating period. Thus, according to Eq. 1, the HEE is higher under the same conditions.
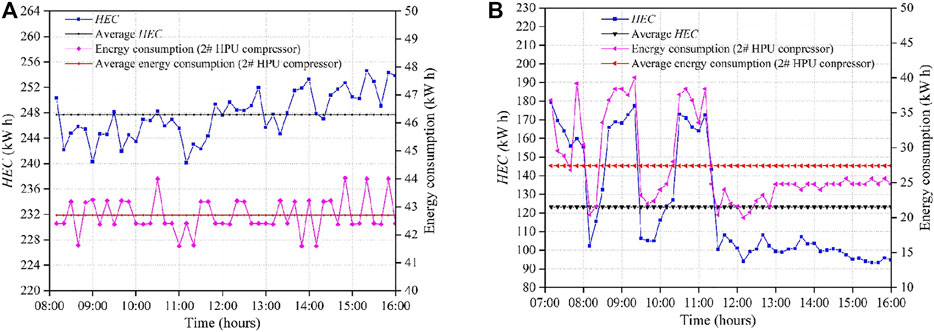
FIGURE 8. HEC of SWC system and energy consumption as a function of time during (A) cooling period (July 6, 2017) and (B) heating period (January 20, 2017).
Figure 9 shows the HEC of the 1# and 2# HPUs operating together versus time during the heating period. The HEC of the HPUs gradually increases with increasing energy consumption. However, when the energy consumption reaches a threshold, the HEE begins to decrease or is even limited. As indicated in Figure 9, the total energy consumption of compressor is about 115 kW h, and the maximum HEC is 320 kW h, so the HEC decreases. The HEC of the system is not positively proportional to the energy consumption of the compressor, therefore the HEE decreases after reaching a threshold. To maintain a high the HPU efficiency, the HPU should be equipped with complete control equipment.
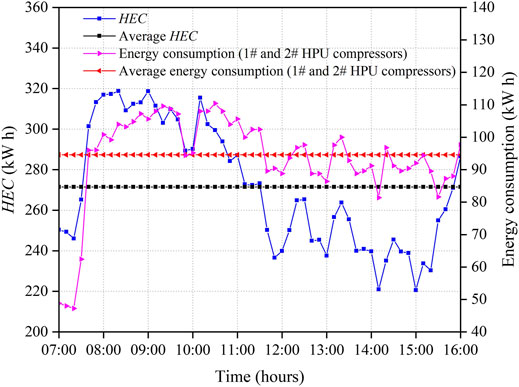
FIGURE 9. HEC of system and energy consumption as a function of time during heating period (January 17, 2018).
The ratio of the two average lines in Figure 9 is 1:2.87. Compared with the analogous ratio during the heating period (Figure 8B), the HEE is lower than that of a single HPU during the heating period. The HEE of a single HPU is thus stronger than that of multiple-HPUs over a heating period. In addition, the ratio of the two average values during the cooling period (Figure 8A) also exceeds that in Figure 9. A comprehensive comparison shows that the HEE of the system during the cooling period is greater than that during the heating period. Therefore, energy consumption should be reduced by optimizing the operation strategy.
Energy Consumption of Each Part of the SWC System
The economy and efficiency were investigated over the long-term operation of the SWC system. Figure 10 shows the total energy consumption (TEC) and monthly energy consumption of each part. The TEC of the system varies periodically, therefore the energy consumption is basically the same each year, except from May 2016 to March 2017 (Figure 10A), which is because the system was in the trial operation and commissioning stage and thus consumed more energy in this period. The school schedule includes holidays in February and August each year, so some buildings are not heated or cooled at these times. In addition, only 15 days of heating are provided in November and March. Therefore, the system consumes relatively little energy during these periods.
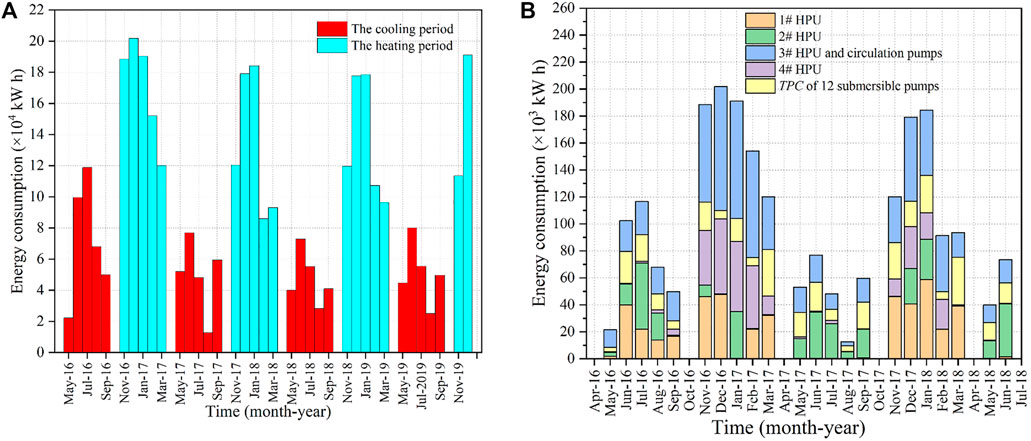
FIGURE 10. (A) Total energy consumption of the SWC system from 2016 to 2019 and (B) each part the energy consumption of the SWC system from 2016 to 2018.
The TEC during the heating period exceeded that during the cooling period (Figure 10A). The ratio of TEC during the heating period to that during the cooling period falls in the ranges 2.70–2.79, which may be explained by two main reasons. The first reason is that the 4# HPU was turned on to supply hot water and therefore consumed a larger amount of energy. The second reason is that the system is less efficient during the heating period than during the cooling period, resulting in increased of energy consumption. The average temperature difference of the main pipeline supply-return water during the cooling period is 2.15°C higher than that of in heating period, as shown in Figure 3. Therefore, the system can extract more heat during the heating period. To further investigate the composition of the system TEC and the difference in energy consumption between the heating period and the cooling period, we plot each part of the energy consumption of the system, Figure 10B, and the data are listed in Table 2.
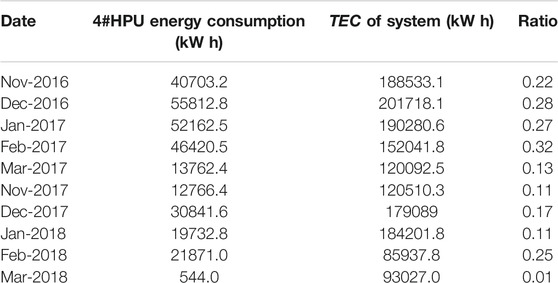
TABLE 2. 4# HPU energy consumption in the SWC system.
Each part of the energy consumption from May 2016 to June 2018 is recorded, and the ratio of 4 # HPU energy consumption is displayed in Figure 10B. Using Table 2, the ratio of the 4# HPU energy consumption to the energy consumption of the system was 0.24 and 0.13 during the two heating periods. Therefore, the 4# HPU was one of the reasons for the large energy consumption in the heating period. Excluding the energy consumption of the 4# HPU in the system, the ratio of the TEC of the heating period and that of the cooling period was 2.43:1. Compared with the ratio of the TEC above, the maximum difference between the ratios was only 0.36. Thus, the TEC was greater during the heating period than the during the in cooling period.
As shown as Figure 10B, the HPU consumed the most energy in the system, followed by the submersible pump and then the circulating pump (during the cooling period). According to this analysis, the energy consumption of the HPU compressor accounted for about 60–70% of the energy consumption of the system during the heating period. During the cooling period, the energy consumption of the HPU compressor accounted for about 50% of the energy consumption of the system. Therefore, to meet the load, the reduced of the energy consumption of the HPU can improve the system energy efficiency, thereby saving and reducing emissions.
Energy Efficiency of SWC System
Coefficient of Performance of HPU
The coefficient of performance (COP) is an important indicator of the energy efficiency of a heat pump and this is defined as the ratio of the cooling capacity (heating capacity) to the input power.
The cooling capacity (heating capacity) Q of the HPU is given by:
where V is the average flow on the user side of the HPU [m3/h], ∆t is the temperature difference between the inlet and the outlet on the user side of the HPU [°C], ρ is the density of water [kg/m3], and c is the specific heat capacity of water [kJ/(kg °C)].
The COP of a heat pump during the cooling period can be expressed as:
where COP is the cooling (heating) coefficient of the unit, Q is the average cooling (heating) capacity of the unit [kW h], Ni is the average input power of the unit [kW h].
The COP of the system is the ratio of the cooling capacity (heating capacity) to the total energy input into the system.
The energy sufficiency ratio of the system can be written as follows:
where COPs is the cooling (heating) energy efficiency ratio of the system, Q is the total cooling capacity (heating capacity) [kW h], Ni is the energy consumption of the HPU [kW h],
COP of HPU During Operation
Figure 11 plots the COP for HPU as a function of time during operation with time intervals of 10 min. During heating (cooling) period, the average COP was 3.7 (5.3), which meets the design requirements for the normal operation of the system. The average COP for an HPU during the cooling period exceeded that during the heating period. The difference in the average COP between cooling and hearing periods was 1.6. Although the heat-pump reverse Carnot cycle predicts a greater COP during the heating period, the opposite occurs in practical engineering because the temperature difference of the supply-return at the well side and the operating power differ between the cooling period and the heating period in actual operation.
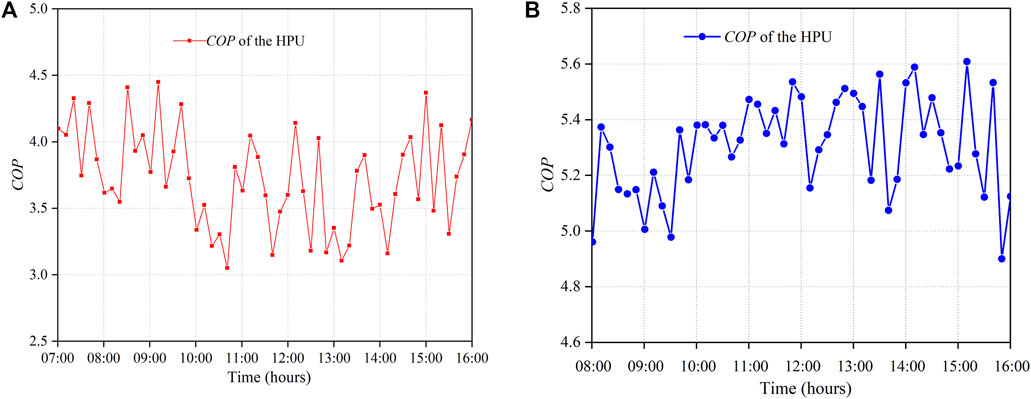
FIGURE 11. COP of an HPU as a function of time for a typical day during (A) heating period (January 26, 2018) and (B) cooling period (July 4, 2017).
In Figure 11A, it can be seen that the COP fluctuates during the heating period. The overall trend of the COP is decreasing, and the COP decreases to a minimum at 10:00-11:00 because the indoor temperature increases gradually as the SWC system operates and peaks at 10:00-11:00 in practical operation. Combined with the relation in Figure 9 between HEE and energy consumption, the variation in the COP is similar in Figure 11A. In addition, the heat pump reverse Carnot cycle predicts that, the heating coefficient of a heat pump decreases with increasing temperature of the high-temperature object. It also verifies that the COP varies with indoor temperature in Figure 11A. Therefore, the COP of an HPU may be increased by optimizing the system operation.
COPs of SWC System
Figure 12 plots COPs as a function of time with a time interval of 10 min for the SWC system operating during the heating and cooling periods. As shown in Figure 12A, the value of COPs fell in the range 2.5-3.5 with an average of 3.0 during the heating period. As shown in Figure 12B, COPs fell in the range 3.1-4.2 with an average of 3.6 during the cooling period. The difference between the average COPs of the heating and cooling periods was 0.6. The lower average COPs in the heating period is due to the significant power consumption of the submersible pumps and circulating pumps. To improve efficiency, the energy consumption of the submersible pumps and circulating pumps should be decreased. During the heating period, the operating efficiency of the SWC system is less than that during the cooling period. The SWC system is thus more efficient during the cooling period.
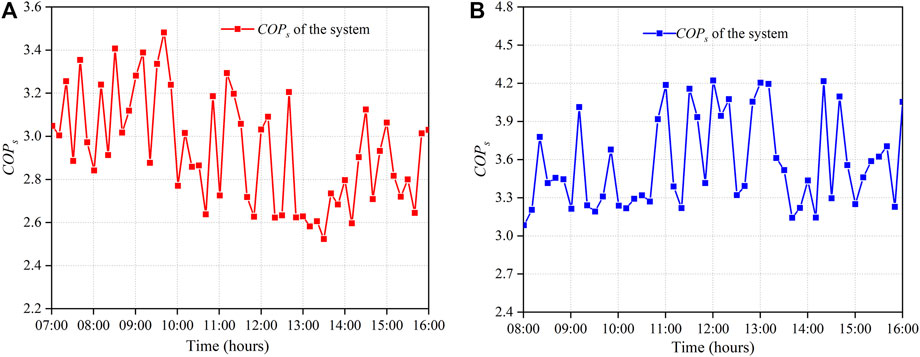
FIGURE 12. COPs of the SWC system as a function of time for a typical day during (A) heating period (January 26, 2018) and (B) cooling period (July 4, 2017).
Long-Term Operation Performance of SWC System and HPUs
Figure 13 shows that the monthly average COP and COPs from May 2016 to Jul 2018, which show similar fluctuations. COPs and COP reach their lowest levels in January. One reason for this phenomenon is that the system has been running for a long time and experiences a slight thermal breakthrough (Tu et al., 2018), which decreases its energy efficiency. In addition, the decrease in exterior temperature increases the indoor load, which indirectly reduces the energy efficiency. However, during the cooling period, the COPs and COP decrease. As shown in Figure 3, the temperature difference between the supply and return water is 5°C during the cooling period. The lower temperature return water affects the temperature of the pumping area in long-term operation (Tu et al., 2018).
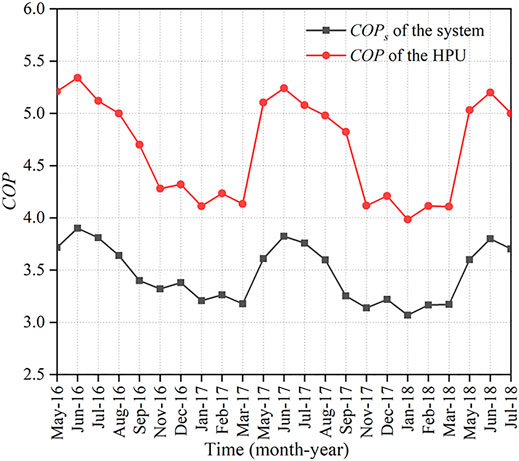
FIGURE 13. COP as a function of time of SWC system and HPU from May 2016 to Jul 2018.
Under the long-term operation of system, COPs varies slightly during the long-term operation of the system. The average COPs value was 3.25 from November 2016 to March 2017, and the average COPs was 3.19 from November 2017 to March 2018. The difference between the two periods is 0.06. The COPs of SWC system thus varied by 0.06. In addition, the COP of the HPU varied by 0.036. Meanwhile, two curves have a downward trend as whole in Figure 13. This phenomenon is caused by thermal breakthroughs during the long-term operation and attenuation of the system (Tu et al., 2020b). According to Figure 6, the phenomenon of cold accumulation is also a reason to make the system COPs change. Therefore, thermal breakthrough and the cold accumulation should be considered in system design. In practical engineering, thermal breakthrough should be avoided by lengthening the sealing zone (Song et al., 2019a). Furthermore, the variations in the system COPs and the HPU COP curves verify the high efficiency and energy savings of the SWC system.
Conclusion
We investigate the operating performance of an SWC coupled GWHP system by monitoring 4 years of data. The SWC system was designed for an HVAC system for a middle school in the Haidian District of Beijing, China. The data were analyzed to determine the system performance, including the supply-return water temperature of the well and user sides, the underground temperature, the groundwater level, and the energy consumption of the HPUs. In addition, suggestions have been made to optimize the system. Overall, the system operates in a stable and efficient state. The results lead to the following main conclusions.
1) The SWC system operation has a periodic effect on the underground temperature. The return water basically completes heat exchange with the surrounding rock and soil, and enters the pumping water area. However, part of the low-temperature recharge water enters the pumping area and causes thermal breakthrough. In addition, cold accumulates underground due to the imbalance of the cold and hot load.
2) The HEE of the cooling period is greater than that of the heating period, and the ratio of the two HEEs approaches two. Also, the HEE of a single HPU is greater than that of multiple units during the heating period, and the HEE of the two approaches 1.6.
3) The energy consumption of the SWC system during the heating period exceeds that during cooling period. The ratio of energy consumption during the heating period to that during the cooling period is 2.4:1. For the SWC system, the HPUs consume the most power, accounting for 60–70% of the TEC during the heating period, and about 50% of the TEC during the cooling period.
4) The COP of an HPU decreases with the increase of indoor temperature when the indoor temperature (heated object) reaches a certain temperature.
5) The COPs and COP values during the cooling period exceed those during the heating period, and the COP and COPs values vary periodically during the long-term operation of the SWC system, when the COPs (COP) of the SWC system decreases by 0.06 (0.036). This phenomenon is caused by thermal breakthrough and the accumulation of cold during the long-term operation of the system. This topic should be studied further in future work.
Data Availability Statement
The original contributions presented in the study are included in the article/supplementary material, further inquiries can be directed to the corresponding author.
Author Contributions
KZ, YFZ, and QW contributed to conception and design of the study. KZ wrote the first draft of the manuscript and performed the statistical analysis. SHX, KT, and XXL wrote sections of the manuscript. All authors contributed to manuscript revision, read, and approved the submitted version.
Funding
This research was financially supported by the China National Natural Science Foundation (41430318, 41572222, 41877186, 41602262, 41702261), the National Key R&D Program of China (2016YFC0801800), the Beijing Natural Science Foundation (8162036), and the Fundamental Research Funds for the Central Universities (2010YD02).
Conflict of Interest
The authors declare that the research was conducted in the absence of any commercial or financial relationships that could be construed as a potential conflict of interest.
Publisher’s Note
All claims expressed in this article are solely those of the authors and do not necessarily represent those of their affiliated organizations, or those of the publisher, the editors and the reviewers. Any product that may be evaluated in this article, or claim that may be made by its manufacturer, is not guaranteed or endorsed by the publisher.
Acknowledgments
The authors would like to thank the editor and reviewers for their constructive suggestions.
References
Al-Sarkhi, A., Abu-Nada, E., Nijmeh, S., and Akash, B. (2008). Performance Evaluation of Standing Column Well for Potential Application of Ground Source Heat Pump in Jordan. Energ. Convers. Management 49, 863–872. doi:10.1016/j.enconman.2007.06.028
Blázquez, C. S., Verda, V., Nieto, I. M., Martín, A. F., and González-Aguilera, D. (2019). Analysis and Optimization of the Design Parameters of a District Groundwater Heat Pump System in Turin. Italy. Renew. Energ. 149, 374–383.doi:10.1016/j.renene.2019.12.074
Chang, K. S., Kim, M. J., and Kim, Y. J. (2017). An Experimental Study on the Thermal Performance Evaluation of SCW Ground Heat Exchanger. Int. J. Air-Conditioning Refrigeration 25 (1), 1750006. doi:10.1142/s2010132517500067
Chang, K. S., Kim, Y. J., and Kim, M. J. (2019). An Investigation of Hydrological Effects on the thermal Performance of Standing Column Well Using the In-Situ thermal Response Test. Int. J. Air-Conditioning Refrigeration 27 (2). doi:10.1142/s2010132519500159
Choe, T. C., and Ko, L. J. (2017). Method of Simulation and Estimation of SCW System Considering Hydrogeological Conditions of Aquifer. Energy & Buildings 163, 140–148. MAR. doi:10.1016/j.enbuild.2017.10.058
Deng, Z., Rees, S. J., and Spitler, J. D. (2005). A Model for Annual Simulation of Standing Column Well Ground Heat Exchangers. Hvac&r Res. 11 (4), 637–655. doi:10.1080/10789669.2005.10391159
Deng, Z., Spitler, J. D., and Rees, S. J. (2006). Performance Analysis of Standing Column Well Ground Heat Exchanger Systems. ASHRAE Trans. 112 (2), 633–643.
Fang, Q., and Zhang, Y. (2020). Evaluation of the Performance of a Hybrid Cooling/heating System Combining Groundwater Direct Cooling with Groundwater Heat Pump for Rural Buildings. IOP Conf. Ser. Earth Environ. Sci. 467, 012049. doi:10.1088/1755-1315/467/1/012049
Hein, P., Kolditz, O., Görke, U.-J., Bucher, A., and Shao, H. (2016). A Numerical Study on the Sustainability and Efficiency of Borehole Heat Exchanger Coupled Ground Source Heat Pump Systems. Appl. Therm. Eng. 100, 421–433. doi:10.1016/j.applthermaleng.2016.02.039
Kastrinos, J. R., Chiasson, A., and Ormond, P. (2019). Estimating Groundwater Heat Exchange in a Standing-Column Well by Injection of a Bromide Tracer. Geothermics 82, 121–127. doi:10.1016/j.geothermics.2019.06.006
Lee, D. Y., Seo, B. M., Hong, S. H., Choi, J. M., and Lee, K. H. (2019). Part Load Ratio Characteristics and Energy Saving Performance of Standing Column Well Geothermal Heat Pump System Assisted with Storage Tank in an Apartment. Energy 174, 1060–1078. MAY 1. doi:10.1016/j.energy.2019.03.029
Lee, K. S. (2011). Modeling on the Performance of Standing Column Wells during Continuous Operation under Regional Groundwater Flow. Int. J. Green Energ. 8 (1-4), 474–485. doi:10.1080/15435075.2011.576290
Léo, C., Courcelles, B., and Pasquier, P. (2020). Impact of Standing Column Well Operation on Carbonate Scaling. Water 12 (8), 2222. doi:10.3390/w12082222
Li, H., Yang, L., and Dong, H. Q. (2013). Groundwater Source Heat Pump Technology Use for Heating and Air-Conditioning of a Commercial Building. Adv. Mater. Res., 608–609. doi:10.4028/www.scientific.net/AMR.608-609.994
Luo, J., Luo, Z., Xie, J., Xia, D., Huang, W., Shao, H., et al. (2018). Investigation of Shallow Geothermal Potentials for Different Types of Ground Source Heat Pump Systems (GSHP) of Wuhan City in China. Renew. Energ. 118, 230–244. doi:10.1016/j.renene.2017.11.017
Luo, J., Xue, W., and Shao, H. B. (2020). Thermo-economic Comparison of Coal-Fired Boiler-Based and Groundwater-Heat-Pump Based Heating and Cooling Solution – A Case Study on a Greenhouse in Hubei, China. Energy and Buildings 223, 110214. doi:10.1016/j.enbuild.2020.110214
Mikler, V. (1993). A Theoretical and Experimental Study of the Energy Well Performance, Master Thesis. Tarragona: Pennsylvania State University.
Minea, V. (2013). Experimental Investigation of the Reliability of Residential Standing Column Heat Pump Systems without Bleed in Cold Climates. Appl. Therm. Eng. 52, 230–243. doi:10.1016/j.applthermaleng.2012.11.031
Nguyen, A., Beaudry, G., and Pasquier, P. (2020). Experimental Assessment of a Standing Column Well Performance in Cold Climates. Energy and Buildings 226, 110391. doi:10.1016/j.enbuild.2020.110391
Ni, L., Li, H., Jiang, Y., Yao, Y., and Ma, Z. (2011). A Model of Groundwater Seepage and Heat Transfer for Single-Well Ground Source Heat Pump Systems. Appl. Therm. Eng. 31, 2622–2630. doi:10.1016/j.applthermaleng.2011.04.030
Orio, C. D. (1994). Geothermal Heat Pumps and Standing Column wells. Geothermal Resour. Counc. Trans. 18, 375–379.
Orio, C. D., Johnson, C. N., Rees, S. J., Chiasson, A., Deng, Z., and Spitler, J. D. (2005). A Survey of Standing Column Well Installations in North America. ASHRAE Trans. 111 (2), 109–121.
Park, B.-H., Bae, G.-O., and Lee, K.-K. (2015). Importance of thermal Dispersivity in Designing Groundwater Heat Pump (GWHP) System: Field and Numerical Study. Renew. Energ. 83, 270–279. doi:10.1016/j.renene.2015.04.036
Qiu, H., Gui, H., Fang, P., and Li, G. (2021). Groundwater Pollution and Human Health Risk Based on Monte Carlo Simulation in a Typical Mining Area in Northern Anhui Province, China. Int. J. Coal. Sci. Technol.
Sommer, W., Valstar, J., Leusbrock, I., Grotenhuis, T., and Rijnaarts, H. (2015). Optimization and Spatial Pattern of Large-Scale Aquifer thermal Energy Storage. Appl. Energ. 137, 322–337. doi:10.1016/j.apenergy.2014.10.019
Song, W., Ni, L., and Yao, Y. (2019). Experimental Research on the Characteristics of Single-Well Groundwater Heat Pump Systems. Energy and Buildings 191, 9062. doi:10.1016/j.enbuild.2019.02.039
Song, X., Wang, G., Shi, Y., Zheng, R., and Li, J. (2019). Numerical Analysis on Thermal Characteristics of an Open Loop Geothermal System in a Single Well. Energ. Proced. 158, 6112–6117. doi:10.1016/j.egypro.2019.01.501
Sun, H. Z., Wu, Q., Xu, S. H., Zeng, Y. F., and Liu, S. H. (2015). Research on Thermophysical Characteristics with SWGECCHE Coupled by Stokes-Darcy Flow. Acta Energiae Solaris Sinica 31, 2571–2577.
Tu, K., Wu, Q., and Sun, H. Z. (2018). A Mathematical Model and thermal Performance Analysis of Single-Well Circulation (SWC) Coupled Ground Source Heat Pump (GSHP) Systems. Appl. Therm. Eng. 147, S1359431117366747. doi:10.1016/j.applthermaleng.2018.09.029
Tu, K., Wu, Q., Simunek, J., Chen, C. F., Zhu, K., Zeng, Y. F., et al. (2020). An Analytical Solution of Groundwater Flow in a Confined Aquifer with a Single‐Well Circulation System. Water Resour. Res. 56, e2020WR027529. doi:10.1029/2020WR027529
Tu, K., Wu, Q., Simunek, J., and Zhu, K. (2020). An Approximate Analytical Solution for Non-darcian Flow in a Confined Aquifer with a Single Well Circulation Groundwater Heat Pump System. Adv. Water Resour. 145, 103740. doi:10.1016/j.advwatres.2020.103740
Wu, Q., Tu, K., Sun, H., and Chen, C. F. (2018). Investigation on the Sustainability and Efficiency of Single-Well Circulation Groundwater Heat Pump Systems. Renew. Energ. 130, 656–666. JAN. doi:10.1016/j.renene.2018.06.107
Wu, Q., Xu, S., Zhou, W., and LaMoreaux, J. (2015). Hydrogeology and Design of Groundwater Heat Pump Systems. Environ. Earth Sci. 73 (7), 3683–3695. doi:10.1007/s12665-014-3654-2
Yuill, G. K., and Mikler, V. (1995). Analysis of the Effect of Induced Groundwater Flow on Heat Transfer from a Vertical Open-Hole Concentric-Tube thermal Well. ASHRAE Trans. 101 (1), 173–185.
Zeng, Y. F., Zhou, W. F., and Lamoreaux, J. (2017). Single-well Circulation Systems for Geothermal Energy Transfer. Environ. Earth Sci. 76, 296. doi:10.1007/s12665-017-6621-x
Keywords: single-well circulation, groundwater heat pump, efficiency, energy consumption, coefficient of performance
Citation: Zhu K, Zeng Y, Wu Q, Xu S, Tu K and Liu X (2021) Study on the Long-Term Performance and Efficiency of Single-Well Circulation Coupled Groundwater Heat Pump System Based on Field Test. Front. Earth Sci. 9:772977. doi: 10.3389/feart.2021.772977
Received: 09 September 2021; Accepted: 04 November 2021;
Published: 26 November 2021.
Edited by:
Yanlong Kong, Institute of Geology and Geophysics (CAS), ChinaReviewed by:
Xiaoming Tian, Delft University of Technology, NetherlandsXianbiao Bu, Guangzhou Institute of Energy Conversion (CAS), China
Copyright © 2021 Zhu, Zeng, Wu, Xu, Tu and Liu. This is an open-access article distributed under the terms of the Creative Commons Attribution License (CC BY). The use, distribution or reproduction in other forums is permitted, provided the original author(s) and the copyright owner(s) are credited and that the original publication in this journal is cited, in accordance with accepted academic practice. No use, distribution or reproduction is permitted which does not comply with these terms.
*Correspondence: Yifan Zeng, NDgyNzkyMTRAcXEuY29t