 Jean de Bremond d’Ars
 Dominique Gibert
- 1Univ Rennes, CNRS, Géosciences Rennes - UMR 6118, Rennes, France
- 2LGL-TPE, Univ Lyon, Univ Lyon 1, ENSL, CNRS, UMR 5276, 69622, Villeurbanne, France
Volcanoes with highly-developed and shallow hydrothermal systems may be subject to sudden increases of their surface steam emission at vents in response to either deep forcing (e.g. increase of heat flux coming from the magma chamber) or external forcing (e.g. sudden decrease of atmospheric pressure or variation of meteoric water input). Because the vent plumbing has a limited heat and mass transfer capacity, the rise of steam pressure accompanying the increase of flux may destabilize the system in order to augment its net transfer capacity. This reorganization may, for instance, take the form of an enlargement of existing conduits and vents or to the creation of new ones. In such a case, local and extremely dangerous blast phenomena are likely to occur with devastating consequences several hundreds of meters around. Even volcanoes with a moderate activity and considered safe by the local population are exposed to such abrupt and dangerous events. The detection of early warning signals through temperature monitoring in the vents is of a primary importance and a main difficulty is to correctly interpret temperature jumps in order to reduce false alarms. We analyze time series of the temperature measured in three fumaroles located at the top of La Soufrière volcano in Guadeloupe, which are characterized by their relatively low temperature around 99°C, slightly above the boiling temperature of water at this altitude. Thanks to the long duration of the records from January to August 2017 and to their short 1-s sampling interval, a multiscale analysis can be performed over several orders of magnitude. We show that, despite their complex and sometimes erratic appearance, the temperature variations observed in the vents contain components highly correlated with rain input variations. Some remarkable patterns recurrently appear at different periods and we show that the main temperature variations of more than 10°C are related to the rainfall intensity. Our results illustrate the importance of external forcing on the otherwise complex and possibly chaotic dynamics of the shallow hydrothermal system of La Soufrière. They also reveal that a careful analysis of rainfall forcing must be done to be able to draw any conclusion concerning changes caused by the underlying hydrothermal system.
Introduction
A volcano acts as a conveyor of heat and mass from the Earth’s interior to the atmosphere, and because of its location at the top part of the magmatic-hydrothermal system, it is prone to important reactions in response to variations of the atmospheric boundary conditions. Beside variations caused by its own dynamics, the atmosphere is subject to external forcing like seasonal variations of the solar radiance and tidal effects. Such a variety of causes results in a wide range of time constants observed in the variations of atmospheric forcing producing more or less important changes in the dynamics of the volcano, depending on its dynamical time constants. Like wind collapsing a bridge when resonance occurs, it is possible that resonance between external forcing and volcano dynamics may affect the volcano behavior. For volcanic areas located in oceanic domains where ocean-atmosphere interaction produces huge atmospheric phenomena like hurricanes, sudden jump of atmospheric pressure and heavy rain may dramatically destabilize volcanoes (Mastin, 1993; Violette et al., 2001; Farquharson and Amelung, 2020; Vittecoq et al., 2020; Scafetta and Mazzarella, 2021). The influence of rainfall on the dynamics of hydrothermal zones is well documented in many areas (e.g. Connor et al., 1993; Richter et al., 2004; Pearson et al., 2008; Diliberto, 2011; Diliberto, 2013; Madonia et al., 2013; Gaudin et al., 2017; Zimmer et al., 2017; Della Seta et al., 2021) most of them considering high-temperature systems, over 300°C. We will focus here on a lower-temperature hydrothermal system where fumaroles release gases around 99 °C, slightly above the boiling point of water.
La Soufrière de Guadeloupe volcano possesses a highly-developed hydrothermal system, subject to heavy rain input, where heat and mass transfers are ensured by hot hydrothermal fluids emitted by springs and fumaroles (Komorowski et al., 2005; Jessop et al., 2020). It can be considered as belonging to the volcanic subclass of “wet volcanoes” (Gunawan et al., 2017) offering monitoring challenges and research monitoring opportunities. Fumaroles can be seen as the ultimate end-part of the fracture network draining the thermal energy from deep under the lava dome toward the surface and, because of the relatively small number of outlets compared to the supposed size of the drained volume, it is likely that the fracture network has an arborescent structure with many deep-seated cracks converging toward the fumaroles (Jacob et al., 2005; Tamburello et al., 2019). Such a structure has a transport capacity limited by the upper end-part of the network which is particularly exposed to external atmospheric forcing, particularly rain inputs. Massive rainfall occurring during a short time period could provoke sudden steam collapse in the shallower part of the hydrothermal system accompanied by important pressure jumps able to initiate strong hammer water phenomena. Although not documented for volcanoes, this type of hazard is well-known in industrial applications (e.g. Urban and Schlüter, 2014; Mahmoudi et al., 2018) and could contribute to the mechanical weakening of a volcano.
Hydrothermal explosions occurring on “wet” active volcanoes represent a major risk if located nearby populated areas or tourists attracting sites (Rouwet et al., 2014; Erfurt-Cooper, 2018). The event of September 2014 on the Ontake volcano (Japan) where 63 persons were killed (data from EM-DAT, CRED/UCLouvain, Brussels, Belgium – www.emdat.be) illustrates the dangerousness of these highly explosive events that often occur without clear warning (Kaneko et al., 2016; Sandri et al., 2017). As recently stated in a US National Academy of Science report (National Academies of Sciences Engineering and Medicine, 2017), most unrest episodes of volcanoes start in hydrothermal systems and many phreatic eruptions occur without warning during periods of repose (Cyranoski, 2014; Fritz, 2014; Williams, 2014). As emphasized in a recent issue of Advances in Volcanology (Fearnley et al., 2018), understanding the dynamics of hydrothermal systems is an important challenge to win to predict dangerous events of hydrothermal origin (Erfurt-Cooper, 2018; Stix and de Moor, 2018). This appeals for an improvement of monitoring methods to follow temporal variations of fluid movements and pressure build-up susceptible to cause sudden and potentially deadly destabilization of hydrothermal systems. A better anticipation would be possible if reliable information concerning the dynamics and the state of the deep parts of the hydrothermal system may be extracted from the complex signals obtained with the monitoring set-up. In particular, it is of a primary importance to understand the effects of external forcing and remove variations imputable to forcing from the data time series in order to isolate information related to internal changes. Sudden external events (e.g. heavy rains, atmospheric pressure drop due to hurricanes) constitute short-time and intense forcing signals able to reveal impulse response of the volcano system. For instance, such events may be used to infer the typical time-scale of return to equilibrium. For complex systems like volcanoes, long time-constant may be due to the appearance of the so-called critical slowing down phenomenon which, in many instances may indicate that the system state is approaching a tipping point. In such a situation, the system becomes unstable and highly sensitive to small perturbations that can cause significant changes in its dynamics (Dakos et al., 2008; Scheffer et al., 2012).
In the present paper, we study in detail the influence of rain forcing on the temperature variations measured in three nearby fumaroles located in the South crater of la Soufrière de Guadeloupe volcano. We show that rain events produce signals at very different time-scales in the temperature time series, making the interpretation of the observed temperature variations in the vents particularly delicate. To isolate signal components related to changes in the dynamics of the deep parts of the hydrothermal system, it is necessary to carefully account for the rainfall history during the preceding days, weeks and months. Because of the specificity of each vent and near-surface hydrothermal system, some training of the analysis procedure is necessary before being able to identify warning signal indicating that thermodynamic conditions changed underground. It is then necessary to implement monitoring systems sufficiently early in order to acquire a training data set.
La Soufrière de Guadeloupe is an andesite volcano located in the French West Indies (Figure 1) and is amongst the most active and potentially dangerous volcanoes of the Lesser Antilles Arc (Komorowski et al., 2005). Its phreatic last eruptions occurred in 1975-1977 (Feuillard et al., 1983) and since then an intense fumarolic activity is widespread at the summit of the dome with the emergence of new high flux fumaroles in recent years (Jessop et al., 2020; Moretti et al., 2020). Located in a tropical area, the hydrothermal system is fed by heavy rains, with an average annual cumulated rainfall over 7,000 mm/yr (Météo France data, http://pluiesextremes.meteo.fr, February 23, 2016 edition). Amongst all the active vents showing an important fumarolic activity on top of the dome (Jessop et al., 2020), we selected the South Crater area (SC) where three vents are instrumented, namely the northern (NSC), centre (CSC) and southern (SSC) fumaroles (Figure 1).
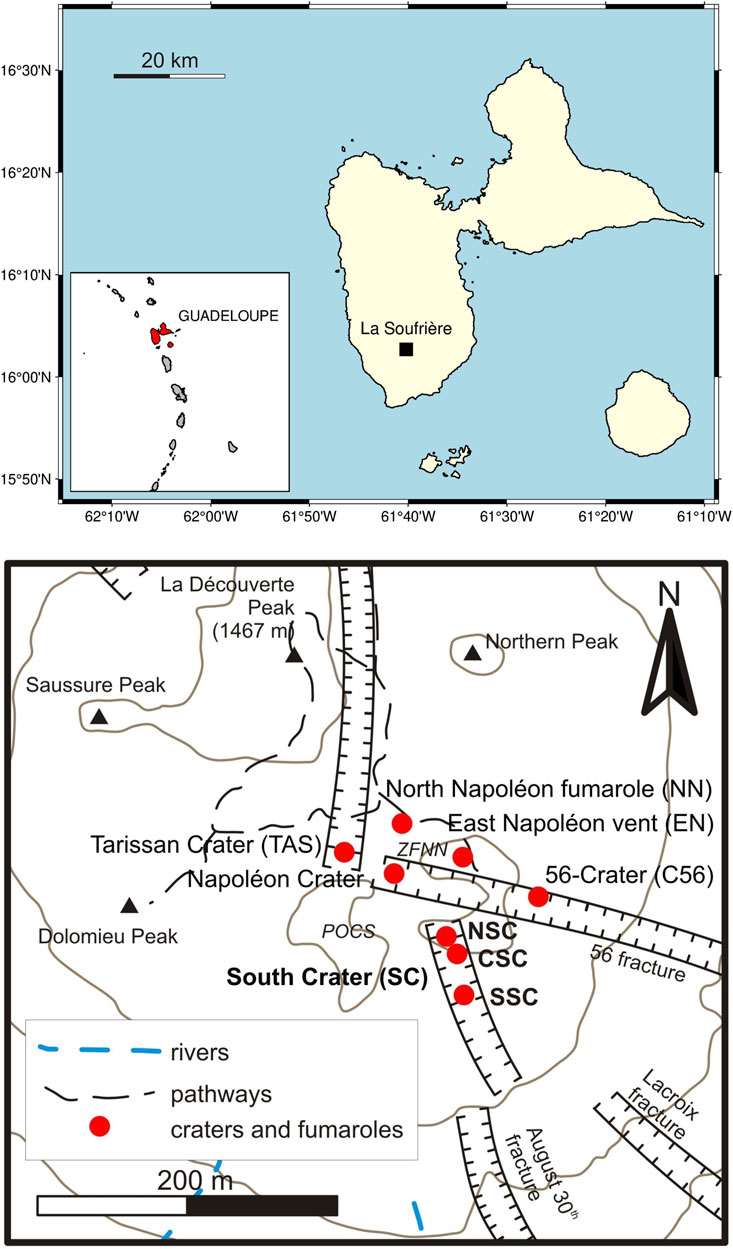
FIGURE 1. Top: location map of Guadeloupe Island in the West Indies archipelago and of La Soufrière on Guadeloupe. Bottom: detailed map of the summit area of La Soufrière lava dome. The three active vents within the South Crater (SC) are the northern (NSC), center (CSC) and southern (SSC) craters.
Measurement Methods
The data were acquired with a Gantner Instruments Qstation connected to 24 bits A/D A107 Qbloxx modules via a RS485 bus. The Qstation is equipped with a GPS receiver providing a common time base to all modules. The sampling rate is 1 s and the data are transmitted to the Guadeloupe Volcano Observatory (OVSG) through a long-range Wi-Fi link. Platinum Pt1000 probes are used to measure the temperature in the fumarole vents. Because of the harsh environmental conditions, the Pt1000 are coated in a sealed Fluorinated Ethylene Propylene (FEP) tube. The inner diameter of the FEP tube is chosen to tightly fit the Pt1000 probe and ensure a good thermal conduction. This enables a fast time-response of the probe to abrupt temperature change. As it can be seen in Figure 2, the time constant of the response is less than 2 min. In the present study, the original 1-s time series are averaged over a 1-min sampling interval. Depending on the local configuration, the Pt1000 are inserted between 0.5 and 1 m in the fumarole conduit in order to minimize exterior perturbations like direct Sun or rain exposure. The meteorological data (wind, rain, pressure, atmospheric temperature) come from the weather station maintained by the OVSG, located at the northern peak (Figure 1), about 200 m north of the South Crater and at about the same altitude around 1,411 m.
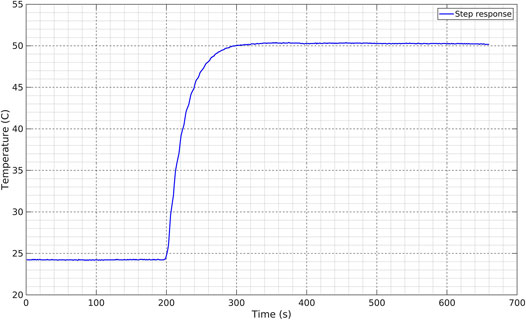
FIGURE 2. time response of Pt1000 temperature probe obtained by suddenly immersing the probe in hot water.
Multiscale Forcing of Shallow Hydrothermal Activity by Rain Input
The three temperature time-series for the South crater vents from January to August 2017 are shown in Figure 3. Depending on the considered period, the time series are variably correlated and synchronized at short time scales. However, all curves share an identical and in-phase long-period appearance consisting in repeated patterns with a progressive temperature rise followed by a sharper temperature decrease. Despite its huge complexity, the CSC temperature curve has an upper envelope identical to the NSC curve.
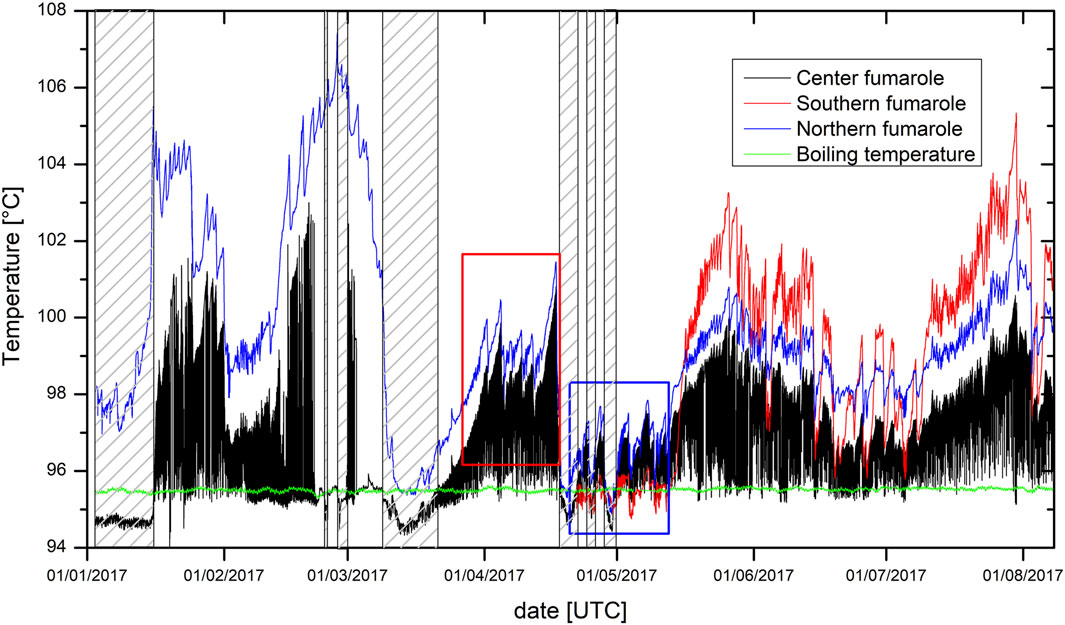
FIGURE 3. Temperatures in the center, southern and northern fumaroles of the South Crater. Boxes with hatched pattern are when the Center fumarole temperature is below the boiling temperature of water (see part 3.4). Red and blue boxes are “hot” and “cold” periods of the northern fumarole discussed in part 4.2.
Long-Period (months) Correlation Between Rain and NSC Temperature Time Series
Among the three temperature curves of Figure 3, the NSC temperature time series TNSC(t) is the most continuous and we shall focus on this data set to study the long-period forcing caused by rain input. We first look for a possible long-term forcing of the fumarole activity by meteoric water input. For this purpose, causal cumulative time series RCΔt(t) of rainfall are constructed for different duration Δt of rain accumulation:
R(t) is the instantaneous rain and RCΔt(t) represents the amount of rainfall during a time period of Δt days preceding time t.
The cross-correlation between RCΔt(t) and TNSC(t) is computed for each value of the integration period Δt (Figure 4A), and we find that RCΔt(t) and TNSC(t) are maximally anti-correlated for Δt = 18 days (Figures 4A, B). A visual comparison between RCΔt=18(t) and TNSC(t) (Figures 4C, D) suggests that, although globally achieved, the anti-correlation is not constant over the considered time period. This is quantitatively assessed with the sliding linear correlation curve of Figure 4E where the size of the sliding window equals 18 days. The variations of correlation are moderate in January and February before vanishing in March with a very good anti-correlation near -1 during the whole month. April is characterized by a restart of the correlation variations whose amplitude increases in the second half of the month. The May to August period is characterized by large amplitude variations of the correlation with a pseudo period of roughly 1 month, i.e. nearby to the monthly modulation of the luni-solar tide. We emphasize that the variation pattern of the sliding correlation of Figure 4E follows the recognized seasonal modulation of the Guadeloupe climate: monthly rainfall are 830, 600, 680, 970, 1,340, 1,080, 1,300 and 1,690 mm/month respectively from January to August .1
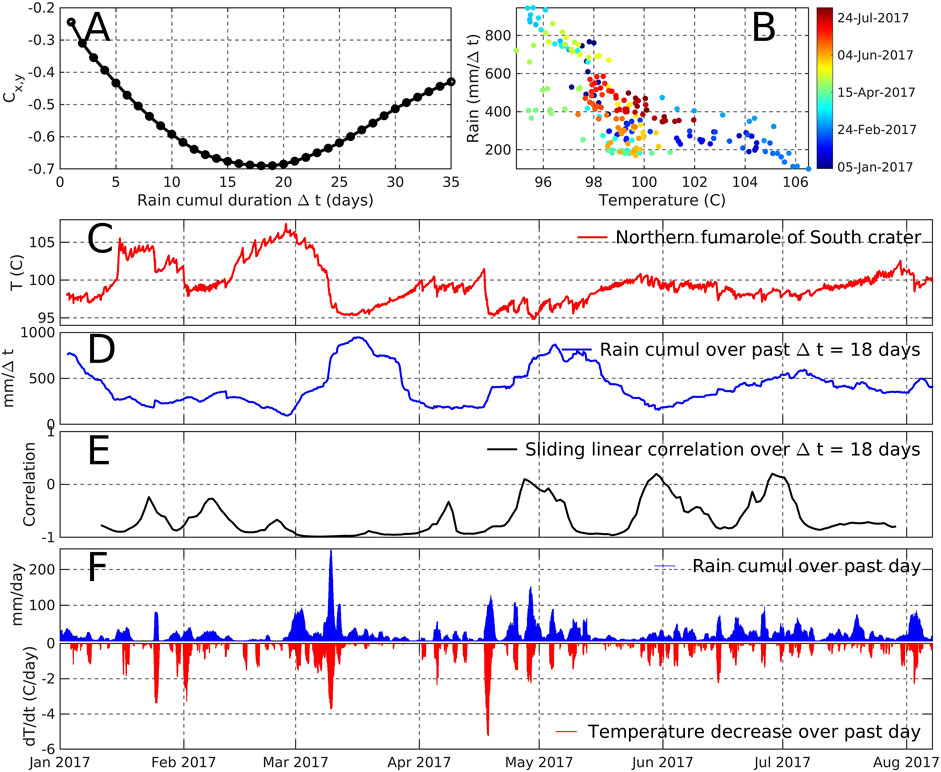
FIGURE 4. Long- and short-term correlation between rain and temperature at NSC (A) Best correlation value obtained for different durations of rain accumulation. The best anti-correlation is for Δt = 18 days (Eq. 1) (B) Scatter plot of cumulated rain data for Δt = 18 days and NSC temperature (C) NSC temperature time series (D) Cumulated rain for Δt = 18 days (E) Linear correlation coefficient between cumulated rain and NSC temperature derived for a sliding window of 18 days (F) Mirror plot of cumulated rain for Δt = 1 day and of 1-day temperature difference at NSC (Eq. 2).
Medium-Period (weeks) Forcing of Rain Input
At intermediate time-scales, and neglecting the short-time variations discussed below, the temperature time series at NSC (Figure 4C) appears as a piece-wise linearly segmented curve, indicating that the temperature roughly increases, decreases or remains constant during time periods of one or 2 weeks. This may be explained by the fact that rain events bring cold water underground, and depending on the balance between the amount of meteoric water supplied to the system and the energy flux coming from below, the fumarole temperature will either increase, decrease or remain constant.
We used the Shape Language Modeling tool (D’Errico, 2017) to perform a linear piece-wise decomposition of the temperature curve at NSC (Figure 5A). Each linear segment represents a situation where the temperature variation is steady, i.e. the temperature steadily decreases, remains constant or increases. The slope of each linear segment represents the temperature variation rate (°C day−1) during the considered time interval. In order to document the influence of rain input on the temperature variation rate, we computed the rainfall rate [mm day−1] for each time period of linear segment in Figure 5A. As it can be observed, the temperature variation rate is linearly correlated with the average rainfall rate (Figure 5B). Most data points (in red) are well aligned with a maximum likelihood bootstrapped slope of -0.021 ± 0.002 (°C day−1)/(mm day−1) (Figure 5C). The bootstrapped linear regressions allow to compute the histogram (Figure 5D) of the intercepts of the fitted straight lines with the horizontal axis of Figure 5B. The maximum likelihood intercept equals 25 ± 0.6 mm day−1 and represents the rain rate necessary to maintain a steady fumarole temperature. The significance of the negative slope is established with a bootstrapping procedure that allows to determine the likelihood curve of each parameter, namely the slope and the intercept with the horizontal axis (Figure 5B). The slope probability curve (Figure 5C) is entirely supported in the negative part of the axis and rules out the possibility of a null or positive slope.
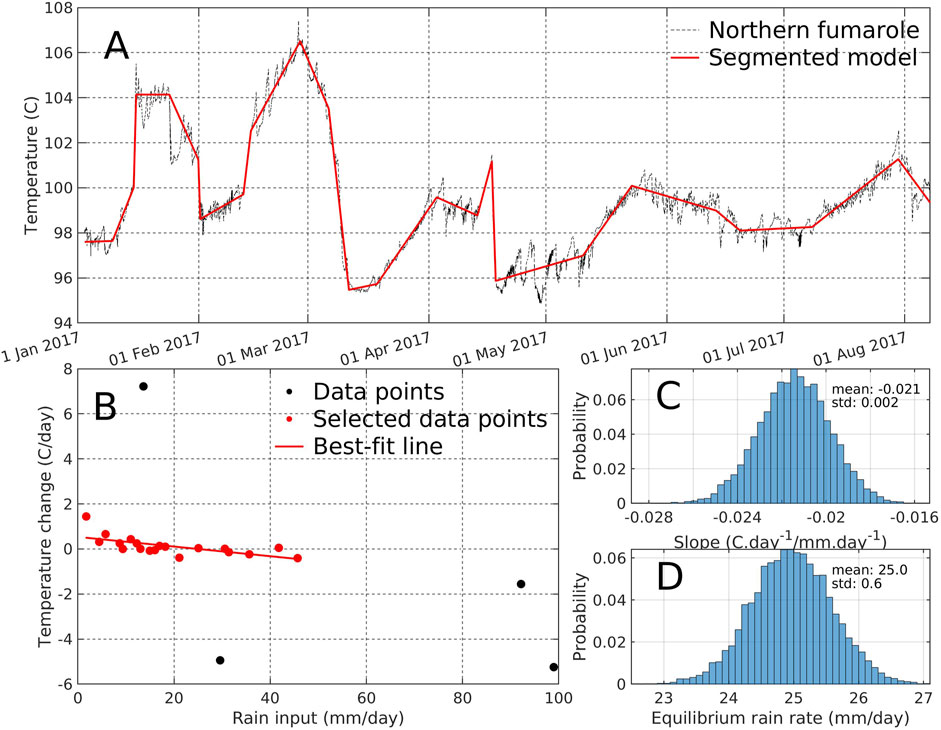
FIGURE 5. Correlation between long-period temperature variations at the NSC vent and the input of meteoric water (A) Temperature time series at NSC (thin black line) and its segmented optimal approximation (red solid line) (B) Correlation between the mean rain input during each linear segment of the red line in (A) and the temperature drift (i.e. slope of the linear segment). Outliers in black are not taken into account for calculating the best-fit line (C) Probability distribution of the bootstrapped slope of the best-fit line in B (D) Probability distribution of the bootstrapped intercept of the best-fit line in B with the horizontal axis. This “equilibrium rain rate” corresponds to the amount of meteoric water input required to obtain a constant steam temperature at the fumaroles.
Short-Period (days) Correlation Between Rain and NSC Temperature Time Series
A close inspection of the temperature curve at NSC (Figure 4C) shows that the temperature variations have a short time-scale saw-tooth appearance with sharp decreases followed by regular temperature increases. These saw-tooth patterns are of variable duration and amplitude. In order to document the relationship between the onset of saw-tooth events in the NSC temperature curve and rain events, we compute the finite-difference time-derivative,
where Δt = 1 day. The negative part of ΔTNSC(t) corresponds to temperature decreases and takes large values at occurrences of the sharp decreases in the saw-tooth patterns. When plotted against RCΔt(t) for Δt = 1 day (Figure 4F), we observe that all sharp decreases of the temperature fall in front of rain inputs.
The data analysis presented in Figure 4 shows the existence of a good correlation between the long-term variations of the temperature at NSC and rain input. However, we observe that the long-term variations of TNSC(t) are actually composed of sequences of successive saw-tooth like features whose initial sharp jumps are triggered by short-term rain inputs (Figure 4C). We may conclude that long-term temperature variations mainly result from clustering of rain events occurring at short time-scale. This behavior is also observed in the CSC and SSC temperature curves indicating that rain inputs, even of small amplitude, perturb the shallow hydrothermal system at all the three fumaroles of the South crater.
Periodicity in CSC Time Series
The centre fumarole temperature TCSC shows a particular behaviour (Figure 3) which is not observed in the other vents and thus deserves specific consideration. It oscillates between a high-temperature end-member, whose long-term variations are similar to the NSC temperature, and a low temperature end-member, close to the boiling temperature of water. This boiling temperature Tboil was estimated from measured pressure data P at the top of the dome, (ranging between 852 and 862 hPa, with an average value of 858 hPa) using the formula deduced from standard steam properties tables between 600 and 1,600 hPa
The TCSC variations show periodic fluctuations with varying period along time which we studied by measuring the periodicity between times when TCSC (the 1-Hz raw data being processed by a median filter to eliminate outliers) decreases by more than 0.1°C. This periodicity was averaged over a 24-h period and the results are shown in Figure 6. The red columns correspond to times where TCSC is less than Tboil which are also shown as hatched boxes in Figure 3. We clearly see that this corresponds to longer time-periods. The inset of Figure 6 shows that when TCSC is greater than Tboil (black symbols), the time-period is less than 3 h and that the oscillations are roughly correlated with TCSC. This observation is consistent with the experimental results obtained by Chen et al. (2015) (see their Fig. 17) who observed that the higher the heat flux supplied to a geysering system, the shorter its eruptive period. In our case, rain input temporarily captures a part of the heat flux coming from the deep hydrothermal reservoir, leaving the geysering system with less thermal energy to rebuild the steam pressure necessary to eject a pulse of hotter steam in the centre vent (also see Fig. 11 in Namiki et al., 2016).
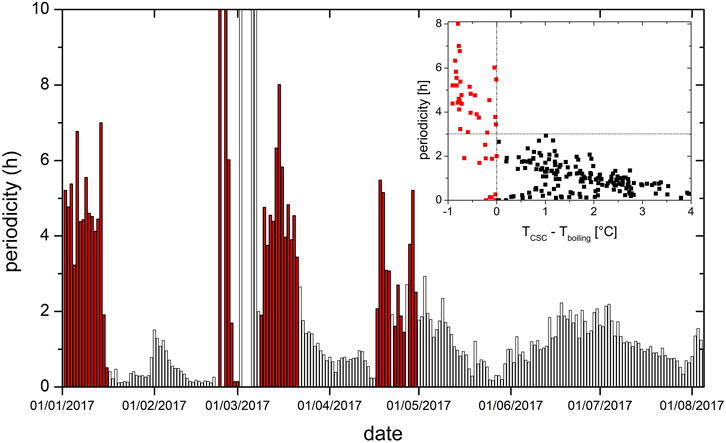
FIGURE 6. Time periodicity of the Centre fumarole temperature (CSC). Red columns correspond to periods when the centre fumarole temperature (TCSC) is less than the boiling temperature (Tboiling) (see Figure 3). Inset: periodicity vs overheating of the Centre fumarole.
Numerical Model of Heat and Mass Transfer Budget
Model Design
The linear dependence of the vent temperature variation with respect to the rate of meteoric water supplied to the system (Figure 5B) resembles a classical mixing between two reservoirs with different temperature. However, in the present instance, we must account for both phase change from liquid to vapor, and heating due to the deep hydrothermal system.
The fact that a rain rate of 25 ± 0.6 mm.day−1 maintains a constant vent temperature (Figure 5D) indicates that some regulation process is required to stop the increase of the steam pressure underground. This may be represented by a simple model where a reservoir of boiling liquid is connected to a high-permeability outlet representing the fumarole conduit and to an inlet formed by a low-permeability distributed fracture network draining the meteoric water (Figure 7). We assume that the temperature variations measured in the vents are due to changes of the steam pressure p which depends on the amount of steam production in the upper part of the reservoir (Figure 7).
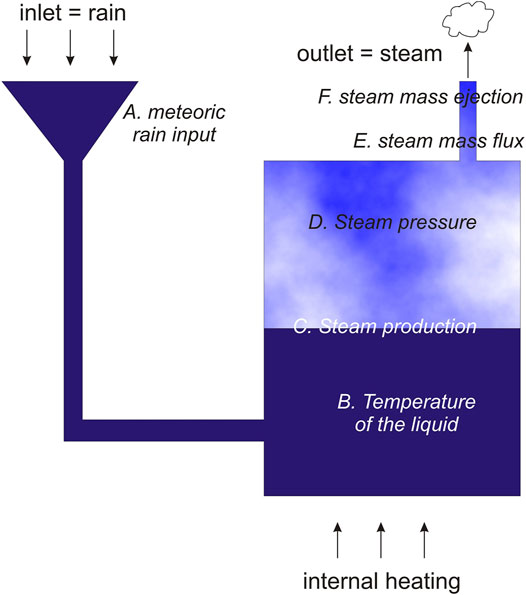
FIGURE 7. Main parts of the shallow hydrothermal system connected to the South Crater vents with indication of the main parameters of the numerical model whose results are shown in Figure 8.
The steam production depends on the balance between the energy necessary to warm-up the liquid receiving fresh meteoric water and the remaining energy available to produce steam. Clearly, this balance directly depends on the amount of meteoric water supplied to the reservoir. For high-level steam production, the pressure increase in the reservoir induces a rise of the boiling temperature and a reduction of the steam production follows. Meanwhile, the steam ejected at the outlet reduces the reservoir pressure and the boiling temperature decreases. Thus the steam production and the steam ejection respectively play the role of a negative and of a positive feedback able to induce sustained oscillations.
We constructed a simple numerical model comprising the elements of Figure 7 to illustrate the phenomenology associated with the processes described above and not to represent the real situation (i.e. thermal power, volume, etc.). The model is not made to represent the reality of the shallow hydrothermal system but aims at reproducing the main processes observed in the data, namely the forcing of rainfall on the fumarolic activity. The pressure and temperature dependence of latent heat are taken into account as well as the volume variation of the upper part of the reservoir in response to rain input and water evaporation. The simulation starts with a given amount of boiling liquid (1,000 kg) and the upper part of the reservoir (1 m3) filled with steam under pressure (1.05 bar). The atmospheric pressure is taken constant at 0.8 bar and the thermal power equals 10 kW. The mass and energy budget (i.e. meteoric water input, steam production, steam ejection, boiling energy, heating energy) is updated at each 1-s time step during which a small amount of meteoric water may be introduced into the reservoir. The fumarole vent is represented as a pipe for which the steam mass flux is proportional to the square root of the pressure difference at both ends (Menon, 2004).
Model Results
Figure 8 shows the output of the model for a sequence of six successive input rates of meteoric water labeled from one to six in Figure 8A. The adjustable parameters of the model are the heating power, the meteoric water input, the reservoir volume, the initial volume of liquid in the reservoir and the vent conduit diameter and length. Tens of trials were performed with different values of these parameters. In all cases, the models reached an equilibrium functioning point but, depending on the values chosen for the parameters, not all possible phenomena were observed. For instance, if the vent conduit diameter is too large, no increase of the steam pressure in the reservoir is observed. In the example we show here, we chose to only vary the rain input and keep the conduit geometry, the reservoir volume and the heating power constant in order to mimic the most probable situation on La Soufrière. The other plots of Figure 8 represent the liquid temperature (Figure 8B), and steam production (Figure 8C), pressure (Figure 8D), mass ejection (Figure 8E). Observe that the liquid temperature varies smoothly while, as expected, the steam properties strongly oscillate due to the interplay of the negative and positive feedback quoted above. We now briefly discuss the phenomenology observed for each meteoric water input:
1 Equilibrium inputs (labels one and 3): Points exist where steam production and ejection exactly compensate. In such cases, the liquid temperature, the steam pressure and the steam ejection are constant. The equilibrium state is stable provided the rain rate does not vary. Observe that the value of the equilibrium rate depends on the steam pressure: more water input is needed when the pressure is lower because the boiling temperature is lower and the steam production higher.
2 Moderate water input above the equilibrium rate (label 2): The liquid temperature gently decreases, inducing a decrease of steam production, pressure and ejection rate. For some rate values, an equilibrium state similar to those shown in Eq. 1, 3 may be reached.
3 No water input (label 4): The liquid temperature increases (Figure 8B) while steam is produced (Figure 8C) and the pressure in the reservoir increases steadily (Figure 8D). Because the transport capacity of the outlet is proportional to the square root of the pressure difference at its ends, the increase of steam ejection slightly slows down (Figure 8E). Because of the unbalance between steam production and steam ejection, the reservoir pressure increases and may reach high values able to break the reservoir structure. This is typically what occurs during steam blasts.
4 High water input (label 5): The thermal power supplied to the reservoir is unable to maintain the liquid temperature above the boiling temperature. After a sharp decrease that begins with the rain input, the steam production ceases and the pressure falls down to the atmospheric pressure.
5 No water input (label 6): After the end of the strong rain episode, the liquid temperature begins to augment until the boiling temperature is reached and the steam production restarts while the pressure linearly builds up. Because of the square root dependence of the steam ejection with respect to the pressure gradient, the steam ejection sharply increases at the very beginning of the boiling and progressively slows down as the steam pressure increases.
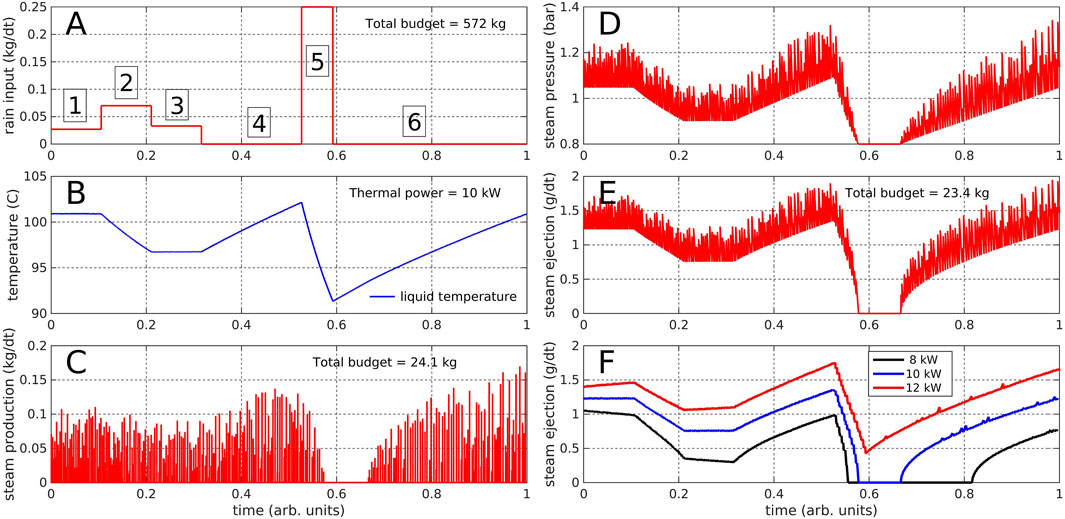
FIGURE 8. Results of the numerical model corresponding to Figure 7. (A) Meteoric rain input (B) Temperature of the liquid contained in the reservoir (C) Steam production in the reservoir (D) Steam pressure in the reservoir (E) Steam mass flux at the vent (F) Steam mass ejection. See text for a detailed discussion.
On Figure 8F we observe different concavities of the curve of the steam ejection, which depend on the steam temperature. This is particularly noticeable at t around 0.7, which corresponds to re-heating of the system after the important rain event labelled five in Figure 8A and where the liquid temperature is low and the steam ejection curves are strongly convex, in contrast with earlier times. Such a difference can also be observed in the northern fumarole temperatures. We selected two contrasted periods, a “hot” one (red box in Figure 3) and a “cold” one (blue box in Figure 3), both lasting about 23 days and separated by an important rainfall around the 18th of april (see blue curve on Figure 4F). Both periods are characterized by cyclic variations of the temperature with a period about 50 h on average (Figures 9A, B) and with contrasted concavity or convexity. We quantified this effect by fitting the temperature data with a polynomial function:
where the exponent c describes the concavity. During hot periods (Figure 9A) the temperature curves of the cycles are concave with exponents c greater than 1, whereas during “cold” periods (Figure 9B) the curves are convex with exponents less than 1. On Figure 9C we compare these concavity exponents with the initial temperatures of the segments (T0) and it clearly appears that the concavity is related with the temperature, in agreement with the results of the theoretical model.
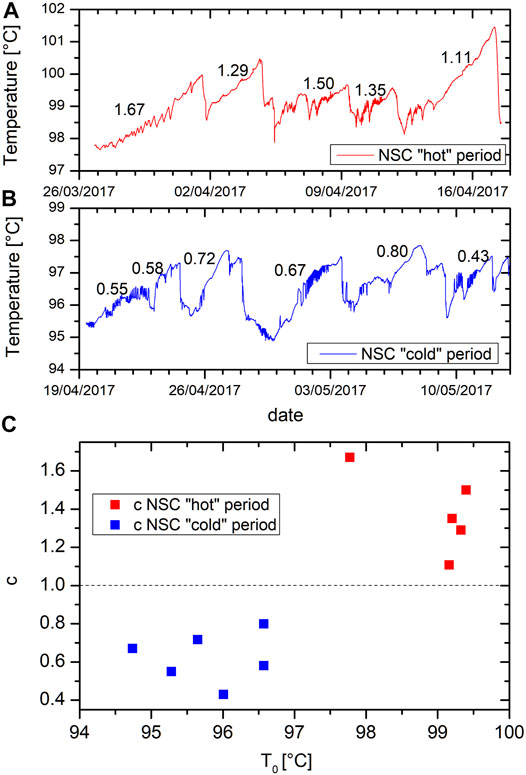
FIGURE 9. Contrasted shape of hot ((A), red box in Figure 3) vs cold periods ((B), blue box in Figure 3) in the northern fumarole. Numbers are the exponent of a polynomial fit quantifying the concavity (c > 1) or the convexity (c < 1) (C) influence of the fumarole temperature on the concavity.
Discussion
A first important result obtained in the present study is the good correlation found between long-period temperature variations measured in the vents and the rainfall cumulated over 18 days (Figure 5). The existence of such a correlation shows that forcing by meteoric water input may explain the main temperature variations observed in the Southern crater fumaroles (Figure 5). Consequently, and on the sole observation of temperature curves, it is difficult to interpret temperature changes in term of variations of state of the hydrothermal system like, for instance, variation of input heat power or progressive sealing driven by mineral deposition (Stix and de Moor, 2018), or changes in the pore pressure within the dome. To reach such an objective, it is necessary to jointly analyze rainfall and temperature variations to detect slope changes in the linear correlation of Figure 5B. This requires collecting data during a sufficiently long period of time with a wide range of rain intensity. In practice, depending on the season, the observation period may reach up to 6 months.
In most situations, a quantitative estimate of the amount of meteoric water entering the hydrothermal system is unavailable, and it is therefore impossible to determine the heating power coming from below. Despite these limitations, it remains possible to obtain a qualitative view – i.e. increase, decrease, stability – of the liquid mass versus heating power balance by analyzing the speed of both reheating and pressure build-up following a heavy-rain event able to decrease the temperature below the boiling point. Recall that in such a situation, the steam production ceases until a sufficient amount of thermal energy is supplied to the reservoir to restart boiling. Obviously, the time necessary to produce steam again depends on the energy, i.e. heat flux, coming from below. Figure 8F shows the time-variation of steam production at the vent for a given rain input history (Figure 8A) and different heating powers. As expected, the main differences between the different heating powers occur when the liquid temperature falls near or below the boiling temperature. It is observed that the lower the heating power, the longer the quiescent period during which no steam is produced and the faster the restart of steam ejection. In order to detect these changes, a careful analysis of the rain history during the preceding months must be performed to remove the forcing effects from the data. This may be accomplished by using long short-term memory (LSTM) models and will be the subject of a forthcoming study.
Short-time variations of the fumarole temperature may be more informative about the dynamics of the hydrothermal system. Such is the case of short-period oscillations of temperature analyzed by Le Gonidec et al. (2019) where temperature oscillations strongly correlate with seismic noise produced by a resonator located in the shallow hydrothermal system. In the context of rain forcing, sudden transient rainfall may act as impulse perturbations of the hydrothermal system whose response can be considered as some kind of “impulse responses”. In such cases, the temperature recovery brings information about the thermal power capacity and the pressure build-up of the system.
The temperature data (Figure 3) allow to propose a conceptual model for the hydrothermal system beneath the South Crater (Figure 10). The similar global envelope of the three fumaroles (Figure 3) suggests that they are all fed at depth by a common high-temperature reservoir mainly responding to the internal forcing caused by the magmatic system. SSC being the hottest, could mean that it is more directly connected to the high-T reservoir. Conversely, the lower average temperature of NSC, which could imply a lower pressure at the vent, could be explained by the presence of an intermediate reservoir, or a longer or more tortuous superficial feeding system. The case of CSC is different as the complexity of its oscillations between two states with different periodicities suggests a geyser-like behaviour (Hurwitz and Manga, 2017). This kind of fluctuations is frequently observed in the field (e.g. Munoz-Saez et al., 2015; Kiryukhin and Karpov, 2020) and has been reproduced in laboratory experiments (e.g. Vandemeulebrouck et al., 2005; Adelstein et al., 2014). We thus suggest that the CSC sub-system may be functioning like a bubble-trap (Rudolph et al., 2018) where an intermediate reservoir between the high-T source and the surface is periodically connected to a low-T reservoir fed by meteoric water. The connection of these two reservoirs may explain the periodic fluctuations of the CSC temperature. This model, where the three fumaroles of the southern crater, although separated by no more than about 25 m exhibit very different behaviors, is in good agreement with the conclusions of Namiki et al. (2016) who demonstrate that differences in subsurface plumbing geometry can lead to contrasted eruption style even for similar heat and water supplies. This could also help to interpret other hydrothermal fields where different fumaroles, although not far from each other, may show contrasted behaviors such as, for instance Mt Etna in Italy (Madonia et al., 2013), Lastarria volcano in Chile (Zimmer et al., 2017) or Mt Epomeo on Ischia Island, Italy (Della Seta et al., 2021).
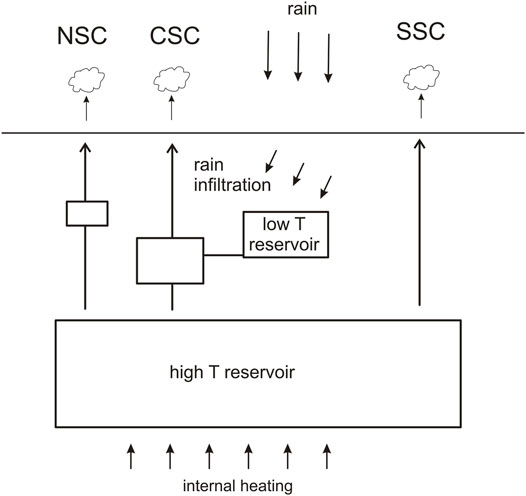
FIGURE 10. Conceptual model of the hydrothermal system beneath the South Crater area (see text for details.).
Conclusion
We perform here an analysis of temperature fluctuations in the three fumaroles of the South Crater at various time scales. During the January to August 2017 period considered here, the seismic activity was calm (Moretti et al., 2020); nevertheless a sustained hydrothermal activity was noticeable on the field (Le Gonidec et al., 2019; Jessop et al., 2020) and important temperature fluctuations in a range of more than 10°C, around an average value of about 99°C have been observed. We compare the temperature data to rainfall measurements during the same period and find a strong correlation between the two sets with important rainfall corresponding to lowering of the temperature.
As suggested by Gaudin et al. (2015) amongst others, the activity of the superficial hydrothermal system can be modified by the meteorological conditions, in particular the rainfalls, and most of the important variations in the fumaroles temperatures can be due to external forcing. A close and careful examination of these conditions is required to avoid erroneous estimations of the state of the volcanological system as even large temperature variations in fumaroles may be due to rain alone.
Data Availability Statement
The raw data supporting the conclusions of this article will be made available by the authors, without undue reservation.
Author Contributions
All authors listed have made a substantial, direct, and intellectual contribution to the work and approved it for publication.
Funding
This study is funded by the French Agence Nationale de la Recherche through the DIAPHANE (ANR-14-CE-04-0001) and MEGaMu (ANR-19-CE05-0033) projects.
Conflict of Interest
The authors declare that the research was conducted in the absence of any commercial or financial relationships that could be construed as a potential conflict of interest.
Publisher’s Note
All claims expressed in this article are solely those of the authors and do not necessarily represent those of their affiliated organizations, or those of the publisher, the editors and the reviewers. Any product that may be evaluated in this article, or claim that may be made by its manufacturer, is not guaranteed or endorsed by the publisher.
Acknowledgments
We are grateful to people at the Guadeloupe Volcano Observatory (OVSG) for assistance in the field and for providing meteorological data. We thank two reviewers, the guest associate editor SP and the chief editor Valerio Acocella for their comments that helped to improve the manuscript.
Footnotes
1https://donneespubliques.meteofrance.fr/?fond=donnee_libre&prefixe=BCA&extension=pdf&station=971&date=2017)
References
Adelstein, E., Tran, A., Saez, C. M., Shteinberg, A., and Manga, M. (2014). Geyser Preplay and Eruption in a Laboratory Model with a Bubble Trap. J. Volcanology Geothermal Res. 285, 129–135. doi:10.1016/j.jvolgeores.2014.08.005
Chen, J., Yang, S., Liao, S., and Cao, X. (2015). Experimental Investigation of Effective Parameters on Geyser Periodicity in a Vertical Heated System. Exp. Therm. Fluid Sci. 68, 163–176. doi:10.1016/j.expthermflusci.2015.04.005
Connor, C. B., Clement, B. M., Song, X., Lane, S. B., and West-Thomas, J. (1993). Continuous Monitoring of High-Temperature Fumaroles on an Active Lava Dome, Volcán Colima, Mexico: Evidence of Mass Flow Variation in Response to Atmospheric Forcing. J. Geophys. Res. 98, 19713–19722. doi:10.1029/93JB02169
Cyranoski, D. (2014). Why Japan Missed Volcano's Warning Signs. Nature. doi:10.1038/nature.2014.16022
Dakos, V., Scheffer, M., van Nes, E. H., Brovkin, V., Petoukhov, V., Held, H., et al. (2008). Slowing Down as an Early Warning Signal for Abrupt Climate Change. Proc. Natl. Acad. Sci. 105, 14308–14312. doi:10.1073/pnas.0802430105
Della Seta, M., Esposito, C., Fiorucci, M., Marmoni, G. M., Martino, S., Sottili, G., et al. (2021). Thermal Monitoring to Infer Possible Interactions between Shallow Hydrothermal System and Slope-Scale Gravitational Deformation of Mt Epomeo (Ischia Island, Italy). Geol. Soc. Lond. Spec. Publications 519, 131. doi:10.1144/sp519-2020-131
D’Errico, J. (2017). SLM - Shape Language Modelling. MATLAB Cent. File Exch. Available at: https://www.mathworks.com/matlabcentral/fileexchange/24443-slm-shape-language-modeling.
Diliberto, I. S. (2013). Time Series Analysis of High Temperature Fumaroles Monitored on the Island of Vulcano (Aeolian Archipelago, Italy). J. Volcanology Geothermal Res. 264, 150–163. doi:10.1016/j.jvolgeores.2013.08.003
Erfurt-Cooper, P. (2017). “Active Hydrothermal Features as Tourist Attractions,” in Observing the Volcano World: Volcano Crisis Communication. Editors C. J. Fearnley, D. K. Bird, K. Haynes, W. J. McGuire, and G. Jolly (Cham: Springer International Publishing), 85–105. doi:10.1007/11157_2016_33
Farquharson, J. I., and Amelung, F. (2020). Extreme Rainfall Triggered the 2018 Rift Eruption at Kīlauea Volcano. Nature 580, 491–495. doi:10.1038/s41586-020-2172-5
Fearnley, C. J., Bird, D. K., Haynes, K., McGuire, W. J., and Jolly, G. (2018). “Observing the Volcano World,” in Observing the Volcano World. Editors C. J. Fearnley, D. K. Bird, K. Haynes, W. J. McGuire, and G. Jolly (Cham: Springer International Publishing). doi:10.1007/978-3-319-44097-2
Feuillard, M., Allegre, C. J., Brandeis, G., Gaulon, R., Le Mouel, J. L., Mercier, J. C., et al. (1983). The 1975-1977 crisis of la Soufriere de Guadeloupe (F.W.I): A still-born magmatic eruption. J. Volcanology Geothermal Res. 16, 317–334. doi:10.1016/0377-0273(83)90036-7
Fritz, A. (2014). Lack of Warning in Japan’s Mt. Ontake Volcano Eruption Raises Questions. Wash. Post 2014, 9–10. https://www.washingtonpost.com/news/capital-weather-gang/wp/2014/09/30/lack-of-warning-in-japans-mt-ontake-volcano-eruption-raises-questions/
Gaudin, D., Finizola, A., Delcher, E., Beauducel, F., Allemand, P., Delacourt, C., et al. (2015). Influence of Rainfalls on Heat and Steam Fluxes of Fumarolic Zones: Six Months Records along the Ty Fault (Soufrière of Guadeloupe, Lesser Antilles). J. Volcanology Geothermal Res. 302, 273–285. doi:10.1016/j.jvolgeores.2015.06.015
Gaudin, D., Ricci, T., Finizola, A., Delcher, E., Alparone, S., Barde-Cabusson, S., et al. (2017). Heat flux-based strategies for the thermal monitoring of sub-fumarolic areas: Examples from Vulcano and La Soufrière de Guadeloupe. J. Volcanology Geothermal Res. 343, 122–134. doi:10.1016/j.jvolgeores.2017.06.021
Gunawan, H., Caudron, C., Pallister, J., Primulyana, S., Christenson, B., Mccausland, W., et al. (2017). New Insights into Kawah Ijen's Volcanic System from the Wet Volcano Workshop experiment. Geol. Soc. Lond. Spec. Publications 437, 35–56. doi:10.1144/SP437.7
Hurwitz, S., and Manga, M. (2017). The Fascinating and Complex Dynamics of Geyser Eruptions. Annu. Rev. Earth Planet. Sci. 45, 31–59. doi:10.1146/annurev-earth-063016-015605
Iole Serena, I. S. (2011). Long-term Variations of Fumarole Temperatures on Vulcano Island (Italy). Ann. Geophys. 54, 175–185. doi:10.4401/ag-5183
Jacob, T., Beauducel, F., David, J., Komorowski, J.-C., and Hammouya, G. (2005). “Ten Years of Extensometry at Soufrière of Guadeloupe: New Constranints on the Hydrothermal System.” in Soufrière Hills Volcano - Ten Years On International Workshop, July 24-30 2005, (Kingston, Jamaica: Seismic Research Unit, University of West Indies).
Jessop, D. E., Moune, S., Moretti, R., Gibert, D., Komorowski, J.-C., Robert, V., et al. (2021). A multi-decadal view of the heat and mass budget of a volcano in unrest: La Soufrière de Guadeloupe (French West Indies). Bull. Volcanol. 83, 16. doi:10.1007/s00445-021-01439-2
Kaneko, T., Maeno, F., and Nakada, S. (2016). 2014 Mount Ontake Eruption: Characteristics of the Phreatic Eruption as Inferred from Aerial Observations. Earth Planet. Sp 68, 1–11. doi:10.1186/s40623-016-0452-y
Kiryukhin, A. V., and Karpov, G. (2020). A CO2-Driven Gas Lift Mechanism in Geyser Cycling (Uzon Caldera, Kamchatka). Geosciences 10, 180. doi:10.3390/geosciences10050180
Komorowski, J.-C., Boudon, G., Semet, M., Beauducel, F., Anténor-Habazac, C., Bazin, S., et al. (2005). “Guadeloupe,” in Volcanic Hazard Atlas of the Lesser Antilles. Editors J. Lindsay, R. Robertson, J. Shepherd, and S. Ali, 65–102.
Le Gonidec, Y., Rosas-Carbajal, M., Bremond d’Ars, J. d., Carlus, B., Ianigro, J.-C., Kergosien, B., et al. (2019). Abrupt Changes of Hydrothermal Activity in a Lava Dome Detected by Combined Seismic and Muon Monitoring. Sci. Rep. 9, 3079. doi:10.1038/s41598-019-39606-3
Madonia, P., Rizzo, A. L., Diliberto, I. S., and Favara, R. (2013). Continuous Monitoring of Fumarole Temperatures at Mount Etna (Italy). J. Volcanology Geothermal Res. 257, 12–20. doi:10.1016/j.jvolgeores.2013.03.001
Mahmoudi, M., Fattahpour, V., Roostaei, M., Kotb, O., Wang, C., Nouri, A., et al. (2018). “An Experimental Investigation into Sand Control Failure Due to Steam Breakthrough in SAGD Wells,” in SPE Canada Heavy Oil Technical Conference, Calgary, Alberta, Canada. doi:10.2118/189769-MS
Mastin, L. G. (1993). Can Rain Cause Volcanic Eruptions. U.S. Geol. Surv. Open-File Rep. 1993-0445. Available at: https://pubs.usgs.gov/of/1993/0445/.
Menon, E. S. (2004). Piping Calculations Manual. NY, United States. McGraw-Hill Education.
Moretti, R., Komorowski, J.-C., Ucciani, G., Moune, S., Jessop, D., de Chabalier, J.-B., et al. (2020). The 2018 Unrest Phase at La Soufrière of Guadeloupe (French West Indies) Andesitic Volcano: Scrutiny of a Failed but Prodromal Phreatic Eruption. J. Volcanology Geothermal Res. 393, 106769. doi:10.1016/j.jvolgeores.2020.106769
Munoz-Saez, C., Manga, M., Hurwitz, S., Rudolph, M. L., Namiki, A., and Wang, C.-Y. (2015). Dynamics within Geyser Conduits, and Sensitivity to Environmental Perturbations: Insights from a Periodic Geyser in the El Tatio Geyser Field, Atacama Desert, Chile. J. Volcanology Geothermal Res. 292, 41–55. doi:10.1016/j.jvolgeores.2015.01.002
Namiki, A., Ueno, Y., Hurwitz, S., Manga, M., Munoz-Saez, C., and Murphy, F. (2016). An Experimental Study of the Role of Subsurface Plumbing on Geothermal Discharge. Geochem. Geophys. Geosyst. 17, 3691–3716. doi:10.1002/2016GC006472
National Academies of Sciences Engineering and Medicine (2017). “Volcanic Eruptions and Their Repose, Unrest, Precursors, and Timing,” in National Academies of Siences Engineering and Medicine (Washington, D.C.: National Academies Press). doi:10.17226/24650
Pearson, S. C. P., Connor, C. B., and Sanford, W. E. (2008). Rapid Response of a Hydrologic System to Volcanic Activity: Masaya Volcano, Nicaragua. Geol 36, 951–954. doi:10.1130/G25210A.1
Richter, G., Wassermann, J., Zimmer, M., and Ohrnberger, M. (2004). Correlation of Seismic Activity and Fumarole Temperature at the Mt. Merapi Volcano (Indonesia) in 2000. J. Volcanology Geothermal Res. 135, 331–342. doi:10.1016/j.volgeores.2004.03.006
Rouwet, D., Sandri, L., Marzocchi, W., Gottsmann, J., Selva, J., Tonini, R., et al. (2014). Recognizing and Tracking Volcanic Hazards Related to Non-magmatic Unrest: a Review. J. Appl. Volcanol. 3, 17. doi:10.1186/s13617-014-0017-3
Rudolph, M. L., Sohn, R. A., and Lev, E. (2018). Fluid Oscillations in a Laboratory Geyser with a Bubble Trap. J. Volcanology Geothermal Res. 368, 100–110. doi:10.1016/j.jvolgeores.2018.11.003
Sandri, L., Tonini, R., Rouwet, D., Constantinescu, R., Mendoza-rosas, A. T., Andrade, D., et al. (2017). “The Need to Quantify Hazard Related to Non-magmatic Unrest: From BET_EF to BET_UNREST,” in Volcanic Unrest. Editors J. Gottsmann, J. Neuberg, and B. Scheu (Berlin, Germany: Springer), 63–82. doi:10.1007/11157_2017_9
Scafetta, N., and Mazzarella, A. (2021). On the Rainfall Triggering of Phlegraean Fields Volcanic Tremors. Water 13, 154. doi:10.3390/w13020154
Scheffer, M., Carpenter, S. R., Lenton, T. M., Bascompte, J., Brock, W., Dakos, V., et al. (2012). Anticipating Critical Transitions. Science 80, 338. doi:10.1126/science.1225244
Stix, J., and de Moor, J. M. (2018). Understanding and Forecasting Phreatic Eruptions Driven by Magmatic Degassing. Earth Planets Space 70, 83. doi:10.1186/s40623-018-0855-z
Tamburello, G., Moune, S., Allard, P., Venugopal, S., Robert, V., Rosas-Carbajal, M., et al. (2019). Spatio-Temporal Relationships between Fumarolic Activity, Hydrothermal Fluid Circulation and Geophysical Signals at an Arc Volcano in Degassing Unrest: La Soufrière of Guadeloupe (French West Indies). Geosciences 9, 480. doi:10.3390/geosciences9110480
Urban, C., and Schlüter, M. (2014). Investigations on the Stochastic Nature of Condensation Induced Water Hammer. Int. J. Multiphase Flow 67, 1–9. doi:10.1016/j.ijmultiphaseflow.2014.08.001
Vandemeulebrouck, J., Stemmelen, D., Hurst, T., and Grangeon, J. (2005). Analogue Modeling of Instabilities in Crater lake Hydrothermal Systems. J. Geophys. Res. 110, 1–9. doi:10.1029/2003JB002794
Violette, S., de Marsily, G., Carbonnel, J. P., Goblet, P., Ledoux, E., Tijani, S. M., et al. (2001). Can rainfall trigger volcanic eruptions? A mechanical stress model of an active volcano: 'Piton de la Fournaise', Reunion Island. Terra Nova 13, 18–24. doi:10.1046/j.1365-3121.2001.00297.x
Vittecoq, B., Fortin, J., Maury, J., and Violette, S. (2020). Earthquakes and Extreme Rainfall Induce Long Term Permeability Enhancement of Volcanic Island Hydrogeological Systems. Sci. Rep. 10, 20231. doi:10.1038/s41598-020-76954-x
Zimmer, M., Walter, T. R., Kujawa, C., Gaete, A., and Franco-Marin, L. (2017). Thermal and Gas Dynamic Investigations at Lastarria Volcano, Northern Chile. The Influence of Precipitation and Atmospheric Pressure on the Fumarole Temperature and the Gas Velocity. J. Volcanology Geothermal Res. 346, 134–140. doi:10.1016/j.jvolgeores.2017.03.013
Keywords: Soufrière volcano, Guadeloupe, rainfall, fumarole temperature, external forcing, hydrothermal system, multiscale analysis, model
Citation: de Bremond d’Ars J and Gibert D (2022) Low-Temperature Hydrothermal Systems Response to Rainfall Forcing: An Example From Temperature Time Series of Fumaroles at La Soufrière de Guadeloupe Volcano. Front. Earth Sci. 9:772176. doi: 10.3389/feart.2021.772176
Received: 07 September 2021; Accepted: 17 December 2021;
Published: 12 January 2022.
Edited by:
Simona Petrosino, Istituto Nazionale di Geofisica e Vulcanologia, ItalyReviewed by:
Paolo Madonia, Istituto Nazionale di Geofisica e Vulcanologia (INGV), ItalyMicol Todesco, Istituto Nazionale di Geofisica e Vulcanologia (INGV), Italy
Copyright © 2022 de Bremond d’Ars and Gibert. This is an open-access article distributed under the terms of the Creative Commons Attribution License (CC BY). The use, distribution or reproduction in other forums is permitted, provided the original author(s) and the copyright owner(s) are credited and that the original publication in this journal is cited, in accordance with accepted academic practice. No use, distribution or reproduction is permitted which does not comply with these terms.
*Correspondence: Jean de Bremond d’Ars, YnJlbW9uZEB1bml2LXJlbm5lczEuZnI=