 Qin Hu
 Yong Zhao
 Anning Huang
 Pan Ma1
95% of researchers rate our articles as excellent or good
Learn more about the work of our research integrity team to safeguard the quality of each article we publish.
Find out more
ORIGINAL RESEARCH article
Front. Earth Sci. , 22 November 2021
Sec. Hydrosphere
Volume 9 - 2021 | https://doi.org/10.3389/feart.2021.770877
This article is part of the Research Topic The Adaptation to and Mitigation of Climate-Sensitive Natural Hazards View all 21 articles
Based on the output data from the Lagrangian flexible particle dispersion model (FLEXPART), we analyze the pathways of moisture to identify the moisture source areas for extreme precipitation in the summer half-year (April–September) over northern and southern Xinjiang, respectively. For both northern and southern Xinjiang, the local evaporation plays a decisive role for extreme precipitation in the summer half-year, of which contribution ratio accounts for 24.5% to northern Xinjiang and 30.2% to southern Xinjiang of all identified source areas. In addition, central Asia and northwestern Asia are the major moisture source areas as well and contribute similarly to extreme precipitation relative to local evaporation. For northern Xinjiang, central Asia surpasses northwestern Asia, and each of them contributes 24.1 and 18.8%, whereas northwestern Asia is somewhat more crucial than central Asia for southern Xinjiang, accounting 22.1 and 19.1%, respectively. Note that the three top-ranked moisture source areas make up a large proportion of total sources. Regarding the remaining source areas that also provide moisture, the contributions are entirely different for southern and northern Xinjiang. Originating from the North Atlantic Ocean, Europe, and the Mediterranean Sea, some water vapor enters northern Xinjiang and converge to precipitate, while this process is barely detectable for extreme precipitation over southern Xinjiang, which is affected by the westerly flow. On the contrary, the Arabian Sea, the Arabian Peninsula, and the Indian Peninsula contribute, even though slightly, to extreme precipitation over southern Xinjiang, which indicates that the meridional transport pathways from the Arabian Sea can carry moisture to this inland region.
Xinjiang province is located in the hinterland of the Asian continent, and it belongs to the temperate continental climate with limited precipitation. It is a challenge for the water vapor entering Xinjiang due to the long distance from the oceans and its unique geographical location. In the context of global warming, continental arid and semi-arid regions have become increasingly dry over the past 100 years around the world (IPCC, 2021). However, Xinjiang has shown a significant opposite trend of becoming warmer and wetter since the 1980s, especially in summer (Shi et al., 2007; Xu et al., 2010; Han et al., 2016; Li and Sun, 2016; Peng and Zhou, 2017). In Xinjiang, the amount of summer and annual precipitation is primarily determined by extreme rainfall in summer (Yang, 2003; Yang et al., 2011), which leads to flooding, mudslides, landslides, and other disasters that cause severe losses of human lives and property (Gong and Eltahir, 1996; Christensen and Christensen, 2003; Du et al., 2014). Therefore, it is of vital importance to examine the mechanism of extreme precipitation and relevant hydrological processes in summer to better comprehend the wetter trends in decades over Xinjiang, as well as to protect safety of the ecosystem and mitigate disasters. In addition, identifying where moisture comes from and how much it transports plays a crucial role in revealing extreme precipitation mechanisms.
Several studies have investigated into the features of moisture transport and relevant budget or mechanism in Xinjiang (e.g., Zhao et al., 2014, 2018; Huang et al., 2017; Yao et al., 2018, 2020; Zhou et al., 2019; Peng et al., 2020; Wang et al., 2020; Yao et al., 2021). The moisture transport pathways into Xinjiang are essentially recognized to originate from the local evaporation, central Asia, the Caspian Sea and the Black Sea area, the eastern Mediterranean, and eastern Europe and from the Arabian Ocean—the Indian Peninsula—the Pamirs Plateau (Aizen et al., 2006; Huang et al., 2017; Yao et al., 2018, 2020; Zhou et al., 2019; Peng et al., 2020; Wang et al., 2020; Yao et al., 2021), which inherently respond to the influence of the westerly flow and the Indian monsoon, respectively. In addition to these zonal moisture transport pathways in the mid-latitudes and meridional pathways in the low-latitudes, the Arctic Oceans is also considered as another contributor to the precipitation over Xinjiang (Li et al., 2008; Huang et al., 2017). Furthermore, the eastern Europe—the eastern Mediterranean—the Caspian Sea—the Black Sea—central Asia transport paths can be backtracked from the Atlantic Ocean along with the westerly flow (Yao et al., 2018; Zhou et al., 2019; Yao et al., 2021), signifying that the Atlantic Ocean is an indirect oceanic moisture suppler to precipitation over Xinjiang. Furthermore, in the inland areas, moisture ultimately originates from the oceans, and it goes through recycling processes of falling and rising in transit. These successive processes critically contribute to precipitate for inland areas due to the long distance with oceans (Brubaker et al., 1993; Numaguti, 1999).
It is noteworthy that the moisture transport and contributions of source areas vary with time scale and precipitation intensity (Wang and Chen, 2012; Hu et al., 2018b). The local-recycling evaporation generally provides moisture for small and moderate precipitation, while extreme precipitation is more dependent on distant water vapor transport (Newell et al., 1992; Trenberth et al., 2003).
Based on the above factors, it is of vital importance to determine moisture source areas and relevant contribution to extreme precipitation over Xinjiang in summer. Some studies have analyzed the moisture transport of extreme precipitation in Xinjiang or its surrounding regions like central Asia (Huang et al., 2017; Yao et al., 2018; Zhou et al., 2019), but mainly focused on case analysis. On the contrary, we aim to capture the statistical differences in the moisture sources between extreme and average precipitation from a climatologic perspective.
Recently, a Lagrangian flexible particle dispersion model (FLEXPART) was widely used to explore the moisture source areas and relevant contribution (Sodemann et al., 2008; Sodemann and Stohl, 2009; Gimeno et al., 2010; Drumond et al., 2011; Sun and Wang, 2015; Hu et al., 2018a, b, 2021; Fremme and Sodemann, 2019; Guo et al., 2019; Yao et al., 2021), particularly in Xinjiang and or its surrounding regions (Zhou et al., 2019; Peng et al., 2020; Yao et al., 2021). Unlike researches based on isotope data or Eulerian methods, which are usually not available for a long-term period or has limitation to trace moisture transport motion trajectory (Stohl and James, 2004), the FLEXPART can trace the moisture variation along transport pathways and has abilities to calculate quantitatively for the contribution of source areas to precipitation. Although there have been some studies focused on extreme precipitation over this region, it is insufficient to concern humidity variation for extreme precipitation in Xinjiang during a long-term period as climatological mean. Due to the obstruction of the Tianshan mountains, the climate varies between north and the south Xinjiang, especially in terms of precipitation (Figure 1B). Therefore, it would be preferable to discuss the corresponding issues on a separate regional perspective.
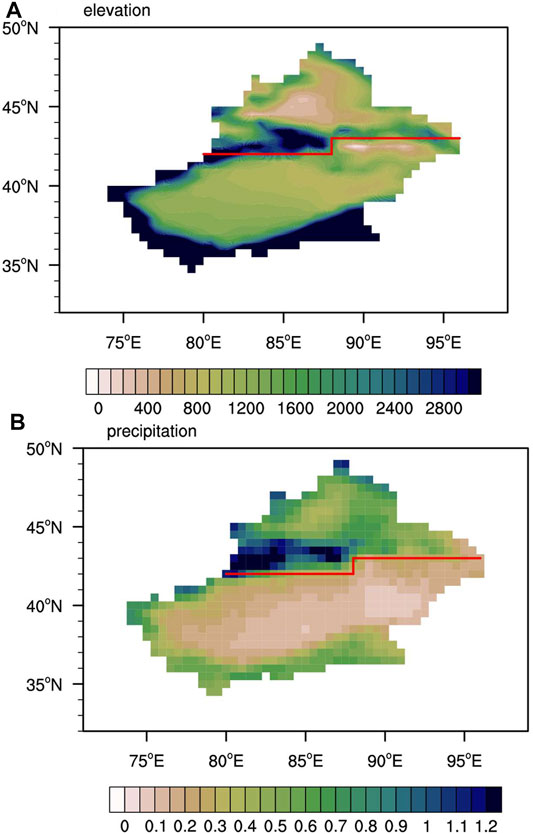
FIGURE 1. (A) The elevation of Xinjiang (units: m) and (B) averaged annual mean precipitation during 1979–2018 in Xinjiang from CN05.1 observation data (units: mm d−1). The red line divides northern and southern Xinjiang.
Based on the aforementioned considerations, we hope to resolve the following questions. How and by what pathways does moisture enter northern and southern Xinjiang, respectively, for relative extreme precipitation during the summer half-year? Additionally, what are the crucial moisture supply areas and corresponding quantitative contributions of each area for extreme precipitation over northern or southern Xinjiang during the summer half-year? In particular, how do the remote moisture source areas versus local evaporation contribution play shifty roles between precipitation in climatological mean and extreme precipitation in the summer half-year? The remainder of this article is organized as follows. The study area, data, model, and methods are introduced in Precipitation Over Northern and Southern Xinjiang. Precipitation distribution and moisture transport pathways for northern and southern Xinjiang in the summer-half year are analyzed in Moisture Transport and 4, respectively. Moreover, the moisture source areas and relevant contributions for extreme precipitation over northern and southern Xinjiang in the summer-half year are provided in Conclusion. Finally, the conclusions are summarized in section 6.
Xinjiang, located within 34°–49°N and 73°–96°E in the hinterland of Eurasia and northwest of China, is a typical arid and semi-arid climate region with limited annual precipitation and high evaporation throughout the whole year. With the Kunlun Mountains on the southern boundary and the Altai Mountains on the northern boundary, Xinjiang is spanned across by the Tianshan Mountains in the central section. In addition, the Tibetan Plateau and the Pamirs Plateau are located on south and southwest of Xinjiang, respectively. Therefore, the climate varies considerably in northern and southern Xinjiang. Southern Xinjiang, namely, the south region of the Tianshan Mountains, including the north part of the Kunlun Mountains, the Tarim Basin, and the Turpan Basin, is extremely drought. The largest desert in China, the Taklamakan Desert, is also located here. At the same time, northern Xinjiang is wetter than southern Xinjiang, including the north part of the Tianshan Mountains, the southwest part of the Altai Mountains, and the Junggar Basin.
Daily observed precipitation data were derived from the CN05.1 data set provided by the National Climate Center of China, with 0.5° × 0.5° horizontal resolution (Wu and Gao 2013). The 2.5° × 2.5° horizontal resolution NCEP/DOE Reanalysis-Ⅱ data were obtained as daily atmospheric data in this study (Kanamitsu et al., 2002). Additionally, the 0.5° × 0.5° horizontal resolution NCEP–CFSR 6-h data, including temperature, land cover, relative humidity, and winds at 42 levels, were used as input data of the FLEXPART model (Saha et al., 2010).
In this study, we operated a Lagrangian model—FLEXPART—to analyze moisture transport and determine the accurate source areas over northern and southern Xinjiang, which were extensively applied in moisture transport and source researches (e.g., Stohl and James, 2005; Sodemann et al., 2008; Gimeno et al., 2010; Drumond et al., 2011; Sun and Wang, 2015; Fremme and Sodemann, 2019; Guo et al., 2019; Hu et al., 2018a, b, 2021; Yao et al., 2021). This model is a particle dispersion model, and its physics theories are based on Lagrangian atmospheric motion equations and Langevin equations (Stohl and James, 2004). The FLEXPART (version 9.02) was run for 40 years from 1979 to 2018 in this study, releasing one million homogenized particles of equal mass. Those particles were scattered at first, but then proceeded to move unrestricted thereafter and could be retraced along movement trajectories. Lastly, we obtained the outputs of the model at 6 h intervals, which consisted of the particle identities, the particle mass, the specific humidity, the air density, and the position as defined in three dimensions.
This study initially explored the moisture source areas responsible for extreme precipitation over northern and southern Xinjiang by calculating the E−P values, and then the WaterSip method was employed to assess the contributions of moisture source areas. For diagnosing the net change of moisture content, the E−P values obtained from the Lagrangian water budget equation are widely used in many cases (e.g., Sodemann et al., 2008; Gimeno et al., 2010; Drumond et al., 2011; Sun and Wang, 2015; Hu et al., 2018a, b). Based on water budget equation in Lagrangian perspective e−p = m × dq/dt, by multiplying the specific humidity q varying with time t by mass m, we can deduce both the moisture precipitation p and evaporation e forward one particle pathway (Stohl and James, 2004, 2005). Furthermore, p and e of all the particles in the vertical atmospheric column above a target area can be added to get the precipitation rate P and evaporation rate E of the total area. Therefore, the E−P values depict the freshwater flux at the surface and can retrace them from a target area backward pathway to determine where net moisture uptake or sink. The E−P values are sensitive to retraced time and calculated by retracing 10 days before arriving at the target areas along pathways in this study, which is relevant to the mean atmospheric residence time of moisture (Numaguti, 1999). As a result, the E−P above 0 locations signify net moisture uptakes and are hence referred to as moisture source areas. On the contrary, moisture sink areas can be represented by the E−P below 0 locations, where precipitation might occur under appropriate meteorological circumstances. However, it should be noted that the E−P below 0 locations might release moisture to the final area, while moisture from the prior E−P above 0 locations might precipitate before getting to the destination as well.
Thus, to identify the contributions of moisture source areas quantitatively, based on the diagnosing of the E−P values, the WaterSip approach proposed by Sodemann et al. (2008) has also been applied in this paper, which is also broadly utilized (Baker et al., 2015; Läderach and Sodemann, 2016; Fremme and Sodemann, 2019; Hu et al., 2021; Yao et al., 2021). The WaterSip approach, unlike the E−P values, calculates the contributions of moisture source areas independent of the retraced time. More introduction on this approach is in Sodemann et al. (2008).
This study focused on the extreme precipitation over northern and southern Xinjiang, so how to define extreme precipitation was of prime importance. As Xinjiang is an arid climate region, it might not be ideal to use a fixed threshold method there, so the 95th percentile of daily precipitation in the target region for summer-half year was chosen as a threshold of extreme precipitation according to the recommendation by Expert Team for Climate Change Detection Monitoring and Indices (ETCCDI) (Zhang et al., 2011). In the summer half-year, the threshold values for northern, southern, and total Xinjiang are 3.4, 1.6, and 2.0 mm d−1 for regional averaged mean, respectively. From 1979 to 2018, the numbers of extreme precipitation days were 366 days, which was involved in subsequent calculations in this study.
Xinjiang, located in the hinterland of the Asian continent with the Kunlun Mountains in its south, the Tianshan Mountains in its middle, and the Altai Mountains in its north, is an arid continental climate region with sparse precipitation. The Tianshan Mountains separate northern and southern Xinjiang approximately in 42°N (Figure 1), and the average elevation of northern Xinjiang is lower than southern Xinjiang (Figure 1A). Northern and southern Xinjiang show different climatic characteristics, and more precipitation happens in northern Xinjiang, while southern Xinjiang has extremely low precipitation (Figure 1B). The average annual mean precipitation in most parts of southern Xinjiang is below 0.25 mm d−1 during 1979–2018. In contrast, in most parts of northern Xinjiang, the average annual mean precipitation is over 0.5 mm d−1 during 1979–2018, and the most substantial precipitation occurs in the western Tianshan Mountains. The regionally average annual precipitation over northern Xinjiang is 173.0 mm y−1 during 1979–2018 from CN05.1 observation data, whereas it is 93.6 mm y−1 over southern Xinjiang.
Figure 2A provides regionally average monthly precipitation over the total, northern, and southern Xinjiang from CN05.1 observation data during 1979–2018. Regardless of the regions, precipitation is characterized by distinct monthly variations and seasonal cycles. The primary precipitation occurs in the summer half-year, from April to September, and the most monthly precipitation appears in July. On the contrary, very limited precipitation occurs in the winter half-year, from October to March. Therefore, the moisture transport for northern and southern Xinjiang is focused on the summer half-year. The regionally averaged precipitation in the summer half-year over the total, northern, and southern Xinjiang from observed data during 1979–2018 is shown in Figure 2B. Apparently, over the total, northern, and southern Xinjiang, their time series of the regional average precipitation in summer half-year represent a clear increasing trend, indicating that precipitation has increased in recent decades. These trends are 3.4, 4.4, and 2.8 mm decade−1 for the total, northern, and southern Xinjiang, respectively. The variations of regionally averaged summer half-year precipitation in the three regions are very similar, and the rainy and drought years during 1979–2018 vary consistently over the total, northern, and southern Xinjiang.
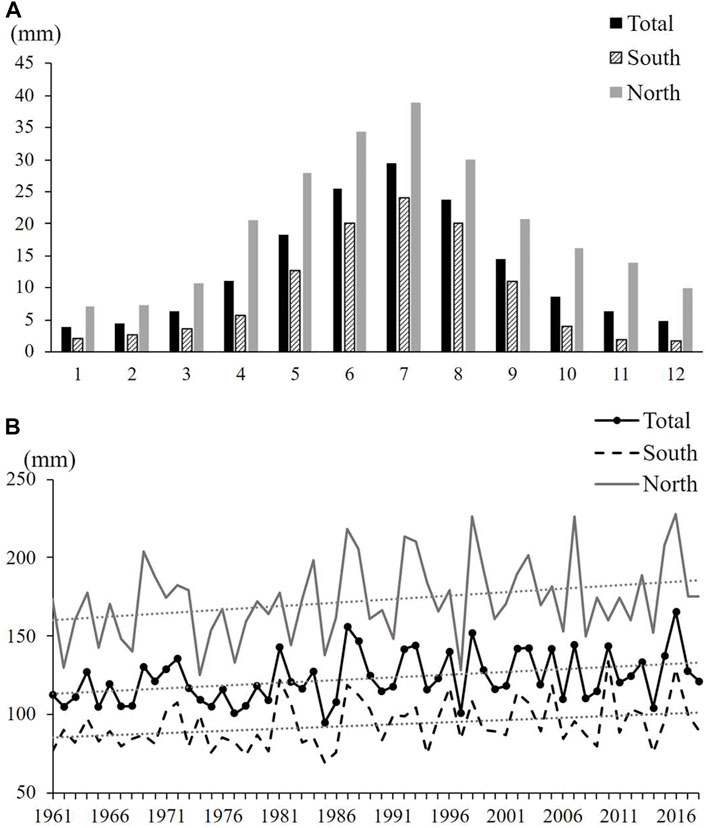
FIGURE 2. (A) Regionally averaged monthly precipitation and (B) regionally averaged precipitation in summer half-year (April–September) over the total, southern, and northern Xinjiang from CN05.1 observation data during 1979–2018 (units: mm).
For distinguishing the moisture transport for extreme precipitation over northern and southern Xinjiang from a large-scale perspective of atmospheric circulation, the vertically integrated moisture flux is calculated using the NCEP/DOE Reanalysis-Ⅱ data (Figure 3). Besides these two situations for extreme precipitation, the moisture transport for a climatological mean state is also illustrated for comparative analysis. Because almost all moisture exists in the lower troposphere, the moisture flux is integrated under the 300 hPa height surface. Generally, the vertically integrated moisture flux displays a small magnitude value over Xinjiang due to the arid continental climate. In either case, as shown in Figures 3A–C, the moisture transport over Xinjiang is evidently controlled by the Westerlies, with moisture coming from the northwest direction. In contrast to the climatological mean state, more moisture flux exists to the north of Xinjiang, located approximately within 47°–57°N and 47°–80°E, for extreme precipitation over northern Xinjiang. At the same time, moisture flux shows less in the similar position for another situation, namely, southern Xinjiang for extreme precipitation. However, in contrast to the climatological mean state, the moisture flux above northern Xinjiang has increased for both northern for extreme precipitation and southern Xinjiang for extreme precipitation. More importantly, the moisture flux above the Arabian Sea, the Indian Peninsula, the Bay of Bengal, and the Indochina Peninsula increases significantly in these two situations for extreme precipitation over Xinjiang, especially for southern Xinjiang, in contrast to the climatological mean state. This result suggests that although the dominant direction of moisture flux over Xinjiang is still the northwesterly flow, the moisture over the north Indian Ocean have huge differences between the situation that the extreme precipitation over Xinjiang and the climatological mean state.
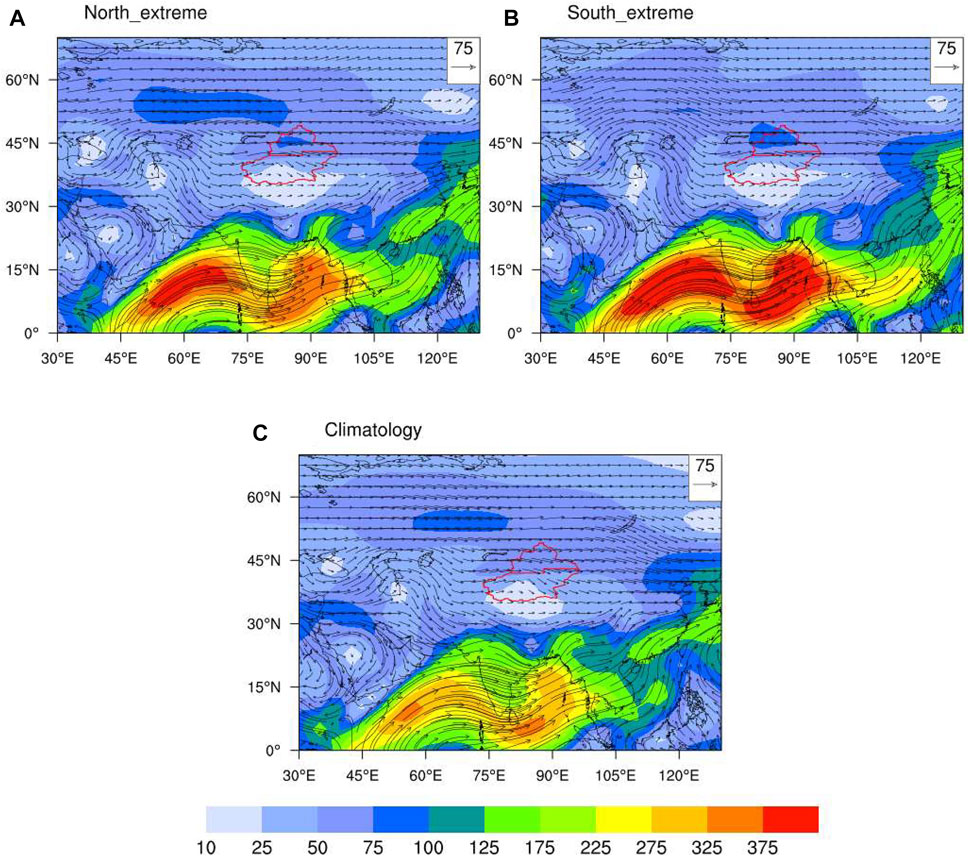
FIGURE 3. Vertically integrated moisture flux for (A) northern Xinjiang and (B) southern Xinjiang for extreme precipitation, and (C) precipitation climatology in summer half-year from the surface to 300 hPa height surface during the period of 1979–2018 (units: kg m−1 s−1).
Following this initial analysis of moisture transport fluxes, the outputs of the FLEXPART model are further used to explore the transport pathways of particles for extreme precipitation over northern and southern Xinjiang, respectively (Figure 4). The particles are traced from northern and southern Xinjiang for 10 days before each extreme precipitation event happen, using the model outputs of particle position. In order to portray the particle paths more clearly, a cluster analysis is adopted (Dorling et al., 1992) because the original paths surpass more than 7,000 trajectories, and the cluster numbers are set to 500. For extreme precipitation over northern Xinjiang, amounts of westerly trajectories come into northern Xinjiang from the upper troposphere of Eurasia, North Africa, and even north Atlantic. Additionally, a small number of particles, almost all of those at upper levels, come from the tropical Easterlies above North Indian Ocean, the Arabian Peninsula, and the Indian Peninsula and converge into the westerly route at mid-latitudes. In contrast, for extreme precipitation over southern Xinjiang, although there are also considerable amounts of westerly trajectories coming from the upper troposphere, the trajectories are increased notably from the tropical Easterlies. Moreover, at a lower level, trajectories from the Arabian Sea and the Bay of Bengal are evidently displayed, and the transport paths of the Somali trans-equatorial flow emerges clearly.
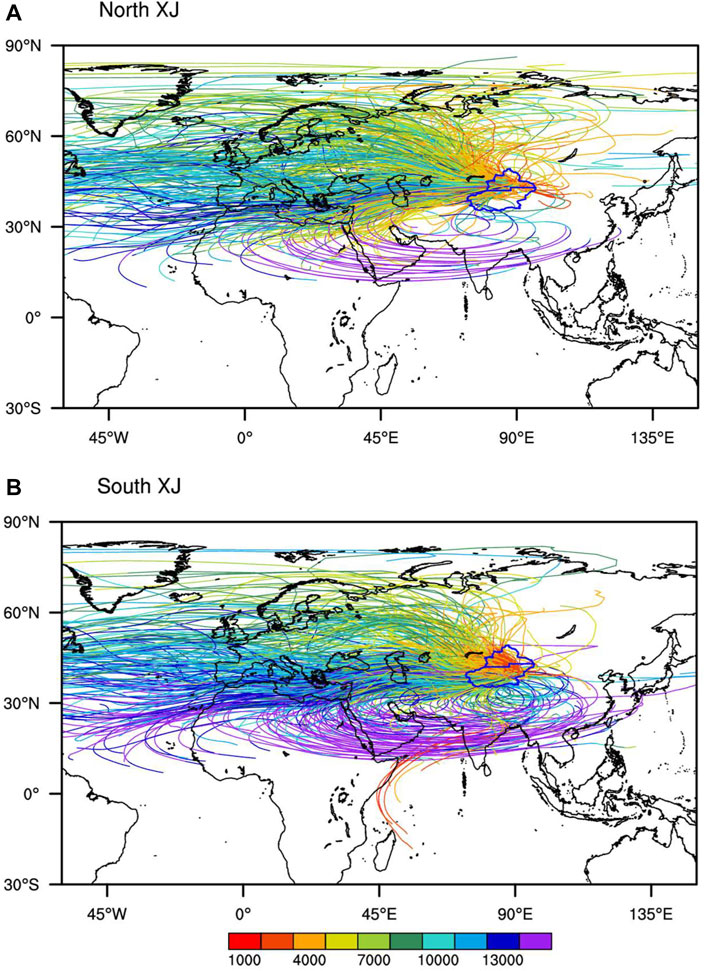
FIGURE 4. Cluster mean trajectories of particles for 10 days before arriving (A) northern Xinjiang and (B) southern Xinjiang for extreme precipitation in summer half-year during 1979–2018 (cluster numbers: 500, units: m AGL).
Noteworthy, the trajectory densities in Figure 4 do not demonstrate that those pathways actually bring strong precipitable water and finally contribute to precipitation over northern or southern Xinjiang because that moisture content varies en route with altitudes, latitudes, and longitudes. Thus, the mean moisture content of particles for 10 days before arriving in northern and southern Xinjiang for extreme precipitation in the summer half-year during 1979–2018 is also given (Figure 5), by using the model outputs of the particle mass, the specific humidity, and the air density, which can signify the potential water supply for precipitation.
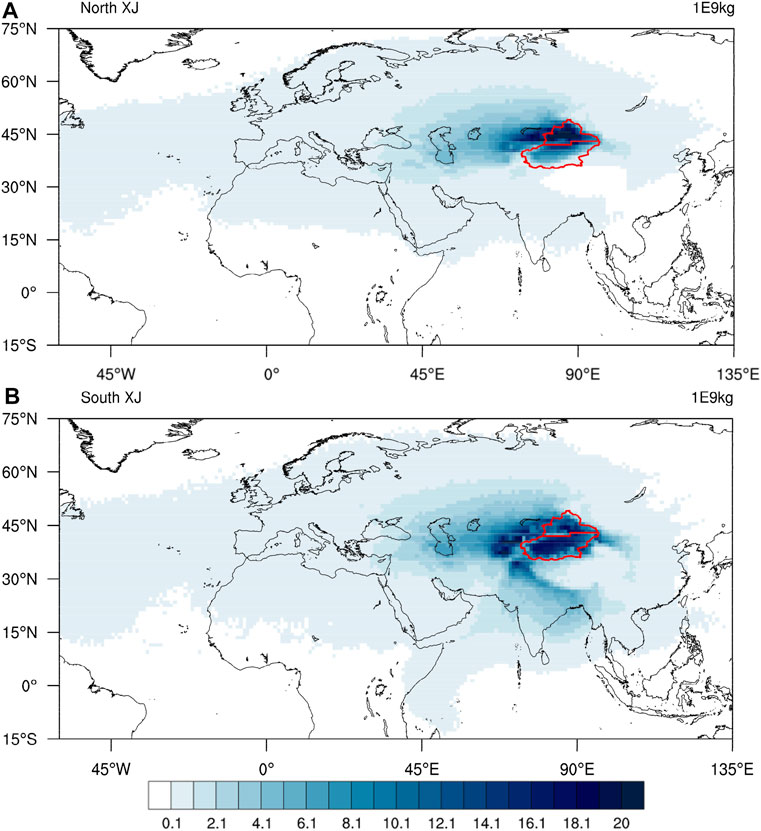
FIGURE 5. Mean moisture content of particles for 10 days before arriving in (A) northern and (B) southern Xinjiang for extreme precipitation in summer half-year during 1979–2018 (units: 109 kg).
For both northern and southern Xinjiang, the high moisture content values are concentrated incredibly over Xinjiang and the west areas adjacent to Xinjiang, providing the major precipitable water supply and reflecting the importance of evaporation and the local water cycle here (Figure 5). As related to the particle trajectories (Figure 4), the moisture content can be clearly perceived that most of them remarkably emanate from westerly paths, namely originating from north Atlantic and west of Eurasia. Meanwhile, a small quantity of moisture content comes from East Asia, North Africa, and North Indian Ocean. It is worth noting that the presence of the Tibetan Plateau prevents a large amount of moisture from entering Xinjiang through it. However, for southern Xinjiang extreme precipitation, the moisture transport from Somali trans-equatorial flow, originating from the Arabian Sea and the Bay of Bengal and even the South China Sea, reach Xinjiang via the south foothills of the Himalayas on the south edge of the Tibetan Plateau.
Corresponding to the moisture content sources described above, the precise location of the moisture source areas, along with the quantification of the amount of moisture from each source area carried into northern and southern Xinjiang, ought to be further determined and calculated.
Using the outputs of the FLEXPART model, the E−P values have retraced their trajectories for 10 days to present the moisture source and sink areas of northern and southern Xinjiang (Figure 6). For northern Xinjiang extreme precipitation (Figure 6A), the continental areas around Xinjiang, including central and northwest Asia, as well as the Arabian Peninsula and the eastern Mediterranean, are the primary moisture sources. Instead, Europe, the North Atlantic, the Indian Peninsula, and the Bay of Bengal are the major moisture sink areas retracing with the moisture pathways. On the contrary, the moisture predominately originates from central and northwest Asia, western China, the Arabian Sea, and the eastern Mediterranean. The Somali cross-equatorial flow also demonstrates the contribution as expected (Figures 4B, 5B). Meanwhile, the extent of the moisture sink areas is broadly consistent with that of northern Xinjiang extreme precipitation, although the magnitudes of the values are more significant, especially in the Indian Peninsula, the Indochina Peninsula, the east Bay of Bengal, and the Arabian Sea. This result is suggestive of a large amount of moisture migrating northward from the northern Indian Ocean but precipitating on the coastal land that is being blocked by the lofty terrain of the Tibetan Plateau.
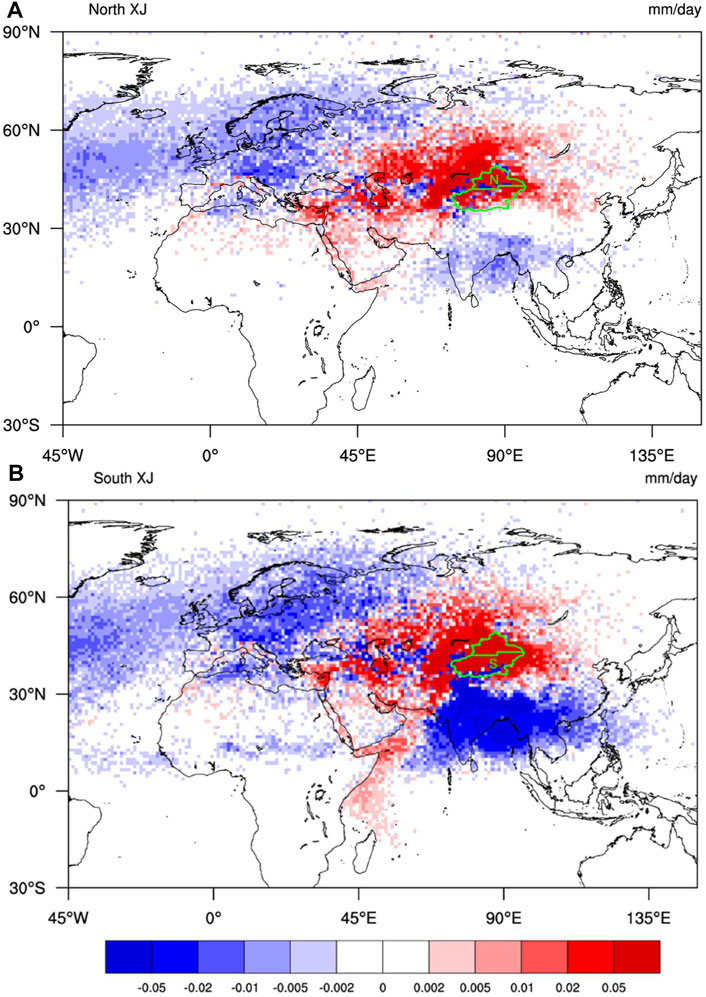
FIGURE 6. Mean E-P particles for the 10 days before arriving (A) northern and (B) southern Xinjiang for extreme precipitation in summer half-year during 1979–2018 (units: mm d−1).
In the Methods Part, it was stated that in one case of precipitation, abundant moisture arising from the moisture source areas might drop before reaching Xinjiang. Consequently, for the final precipitation of Xinjiang, these areas of the positive E−P values mentioned above cannot be considered as contributing source areas immediately, and areas of negative E−P values might have their own contribution. Thus, the WaterSip, a quantitative method, is applied to accurately calculate the contributions of all significant identified moisture source areas. Therefore, based on the approximate ranges of the E−P values and the general geographical divisions, 17 source areas for northern and southern Xinjiang are elected.
In Figure 7, the divisions of the moisture sources for extreme precipitation in summer half-year over Xinjiang during 1979–2018 are shown and numbered: 1 Xinjiang, 2 the Tibetan Plateau, 3 the Indian Peninsula, 4 the Indochina Peninsula, 5 the Arabian Sea, 6 the Bay of Bengal, 7 the South China Sea, 8 southern China, 9 northeastern Asia, 10 northwestern Asia, 11 central Asia, 12 Europe, 13 the Mediterranean Sea, 14 the North Africa, 15 the Arabian Peninsula, 16 the North Atlantic Ocean, and 17 the Arctic Ocean.
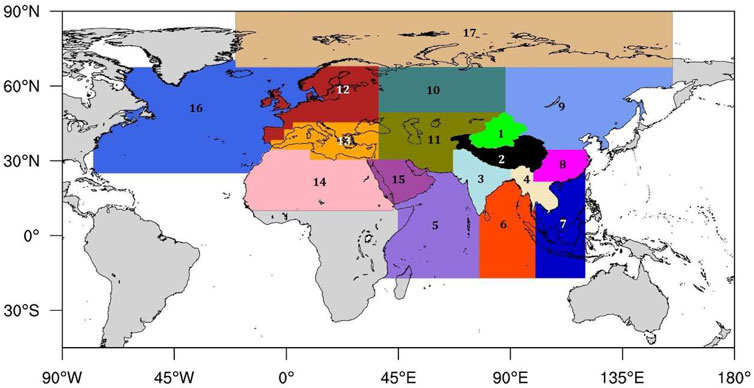
FIGURE 7. Divisions of the moisture sources for extreme precipitation in summer half-year over Xinjiang during 1979–2018. These numbers represent: 1 Xinjiang, 2 the Tibetan Plateau, 3 the Indian Peninsula, 4 the Indochina Peninsula, 5 the Arabian Sea, 6 the Bay of Bengal, 7 the South China Sea, 8 southern China, 9 northeastern Asia, 10 northwestern Asia, 11 central Asia, 12 Europe, 13 the Mediterranean Sea, 14 the North Africa, 15 the Arabian Peninsula, 16 the North Atlantic Ocean, and 17 the Arctic Ocean.
The contribution ratios of significant moisture source areas to extreme precipitation over northern and southern Xinjiang in the summer half-year during 1979–2018 are shown in Figure 8. Noteworthy, the evaporation of moisture source area greatly differs from the final contribution to precipitation in the target region due to the loss en route; therefore, the contribution ratios are given and analyzed here. Note that some areas contribute very limited, even negligible, so the contribution ratios are not displayed in the figure, such as the Indochina Peninsula, the Bay of Bengal, the South China Sea, southern China, the North Africa, and the Arctic Ocean. The 14.6% contribution ratios for northern Xinjiang and 9.8% for southern Xinjiang are from these ones and the area that are not identified in Figure 7, labelled as other in Figure 8. For both northern and southern Xinjiang, the local evaporation, Xinjiang itself plays a decisive role for extreme precipitation in the summer half-year, of which contribution ratio accounts for 24.5% to northern Xinjiang and 30.2% to southern Xinjiang of all source areas. In addition, central Asia and northwestern Asia are the significant moisture source areas as well and contribute similarly to extreme precipitation relative to local evaporation. For northern Xinjiang, central Asia surpasses northwestern Asia, each of them contributing 24.1 and 18.8%, whereas northwestern Asia is somewhat more crucial than central Asia for southern Xinjiang, accounting 22.1 and 19.1%, respectively. Note that the three top-ranked source areas account for almost 70% of total source areas, indicating the vital importance of short-distance moisture transport for Xinjiang. In contrast to climatologic mean precipitation, the contribution ratio of the sum of Xinjiang itself and Central Asia decreases about 10%, and the local contributions decrease about 20% (Yao et al., 2021).
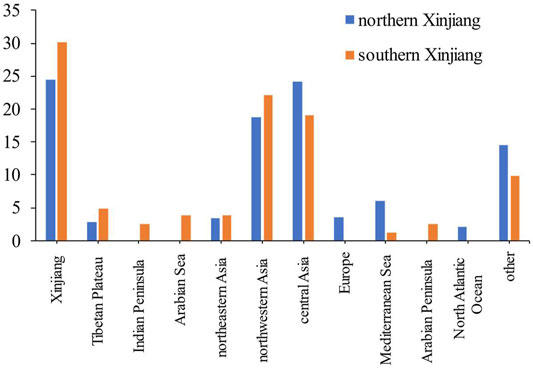
FIGURE 8. Contribution ratios of significant moisture source areas to extreme precipitation over northern and southern Xinjiang in summer half-year during 1979–2018 (units: %).
Regarding the remaining source areas that also provide moisture, the contributions are entirely different for southern and northern Xinjiang. For northern Xinjiang, the North Atlantic Ocean, Europe, and the Mediterranean Sea contribute 2.1, 3.5, and 6.1% for extreme precipitation, while the ratios of them are almost negligible for southern Xinjiang. It is demonstrated that long-distance moisture can be carried by the westerly flow to northern Xinjiang. In contrast, flux originating from the Arabian Sea, the Arabian Peninsula, and the Indian Peninsula can provide slight moisture to extreme precipitation over southern Xinjiang, accounting for 3.8, 2.5, and 2.5% of total source areas, respectively. Although these values of contributions are slight, they reveal the meridional transport pathways, affected by the Indian Monsoon, have somewhat ability to carry moisture into this inland region. Previous studies have noted that there are two routes to carry moisture into Xinjiang. One is the Arabian Ocean—the Indian Peninsula—the Pamirs Plateau—Xinjiang route, and another is eastern Europe—the eastern Mediterranean—the Caspian Sea—the Black Sea—central Asia—Xinjiang route (Aizen et al., 2006; Huang et al., 2017; Yao et al., 2018, 2020; Zhou et al., 2019; Peng et al., 2020; Wang et al., 2020; Yao et al., 2021), which inherently respond to the influence of the westerly flow and the Indian monsoon, respectively. In our study, it would be more accurate to say that these two routes are also represented, and the zonal mid-latitude route contributes effectively to extreme precipitation over northern Xinjiang, while the meridional low-latitude route carries moisture for southern Xinjiang extreme precipitation.
The Lagrangian model FLEXPART was employed to simulate the moisture source areas for extreme precipitation in the summer half-year over northern and southern Xinjiang, respectively. The contributions and magnitudes of moisture source areas are accessed by the WaterSip method, and the main findings are as follows.
1. For extreme precipitation in the summer half-year over Xinjiang, local evaporation is crucial, with a contribution ratio of 24.5% to northern Xinjiang and 30.2% to southern Xinjiang of all identified source areas. Central Asia and northwestern Asia also are significant, and three top-ranked source areas account for almost 70%, indicating the key importance of the proximity transport of water vapor for Xinjiang.
2. For northern Xinjiang, moisture can be traced back from the North Atlantic Ocean, whereas it is barely detectable for southern Xinjiang, signifying the importance of long-distance moisture carried by the westerly flow to northern Xinjiang.
3. For southern Xinjiang, the Arabian Sea, the Arabian Peninsula, and the Indian Peninsula contribute somewhat when extreme precipitation happens. It is indicated that the meridional transport pathways, affected by the Indian Monsoon, have ability to carry moisture into this inland region.
In contrast to previous researches (Huang et al., 2017; Yao et al., 2018; Zhou et al., 2019), we have clarified and quantified the different impacts of the Arabian Ocean—the Indian Peninsula—the Pamirs Plateau—Xinjiang moisture transporting route and the eastern Europe—the eastern Mediterranean—the Caspian Sea—the Black Sea—central Asia—Xinjiang route on northern and southern Xinjiang, respectively. In addition, comparing for the precipitation for climatological mean precipitation in summer-half year over Xinjiang (Yao et al., 2021), the results quantitatively reveal the contribution of long-distance moisture source areas to extreme precipitation in this region, whereas these contributions are almost non-existent. However, this study is mainly concerned to moisture sources that directly contribute to extreme precipitation in Xinjiang. As the result has shown, the oceanic moisture source areas, which provide water vapor ultimately, play an entirely limited role for this inland region, especially for northern Xinjiang. Further study is needed to determine the indirect moisture source transport mechanism and to calculate the amount of water vapor that carried from long-distance sources by indirect ways, such as moisture recycling processes in the continental region, which would better comprehend the mechanisms of precipitation over Xinjiang.
The original contributions presented in the study are included in the article/Supplementary Materials, further inquiries can be directed to the corresponding author.
The authors declare that they have no conflict of interest. QH contributed in model simulation, data analysis, plotting major figures, and drafting the manuscript; YZ contributed in conceptualization, experiment design, and drafting; AH performed the experiment validation and revising the manuscript; PM and JM assisted with calculation and plotting figures.
This work was joint supported by the National Natural Science Foundation of China (Grant Nos. U1903113, 41875102), the Sichuan Science and Technology Program (Grant No. 2020JDJQ0050), the Second Tibetan Plateau Scientific Expedition and Research (STEP) program (2019QZKK010203), and the Scientific Research Foundation of Chengdu University of Information Technology (KYTZ201812).
The authors declare that the research was conducted in the absence of any commercial or financial relationships that could be construed as a potential conflict of interest.
All claims expressed in this article are solely those of the authors and do not necessarily represent those of their affiliated organizations, or those of the publisher, the editors, and the reviewers. Any product that may be evaluated in this article, or claim that may be made by its manufacturer, is not guaranteed or endorsed by the publisher.
We thank the reviewers for their insightful comments and suggestions that helped improve the manuscript. We acknowledge Andreas Stohl and other developers for providing the FLEXPART model. We are grateful to Jia Wu and her coauthor, and NCEP for providing us observation and reanalysis data.
Aizen, V. B., Aizen, E. M., Joswiak, D. R., Fujita, K., Takeuchi, N., and Nikitin, S. A. (2006). Climatic and Atmospheric Circulation Pattern Variability from Ice-Core Isotope/geochemistry Records (Altai, Tien Shan and Tibet). Ann. Glaciol. 43, 49–60. doi:10.3189/172756406781812078
Baker, A. J., Sodemann, H., Baldini, J. U. L., Breitenbach, S. F. M., Johnson, K. R., van Hunen, J., et al. (2015). Seasonality of westerly Moisture Transport in the East Asian Summer Monsoon and its Implications for Interpreting Precipitation δ18O. J. Geophys. Res. Atmos. 120, 5850–5862. doi:10.1002/2014jd022919
Brubaker, K. L., Entekhabi, D., and Eagleson, P. S. (1993). Estimation of continental Precipitation Recycling. J. Clim. 6, 1077–1089. doi:10.1175/1520-0442(1993)006<1077:eocpr>2.0.co;2
Christensen, J. H., and Christensen, O. B. (2003). Severe Summertime Flooding in Europe. Nature 421, 805–806. doi:10.1038/421805a
Dorling, S. R., Davies, T. D., and Pierce, C. E. (1992). Cluster Analysis: A Technique for Estimating the Synoptic Meteorological Controls on Air and Precipitation Chemistry-Method and Applications. Atmos. Environ. A. Gen. Top. 26, 2575–2581. doi:10.1016/0960-1686(92)90110-7
Drumond, A., Nieto, R., and Gimeno, L. (2011). Sources of Moisture for China and Their Variations during Drier and -Wetter Conditions in 2000−2004: a Lagrangian Approach. Clim. Res. 50, 215–225. doi:10.3354/cr01043
Du, H., Xia, J., and Zeng, S. (2014). Regional Frequency Analysis of Extreme Precipitation and its Spatio-Temporal Characteristics in the Huai River Basin, China. Nat. Hazards. 70, 195–215. doi:10.1007/s11069-013-0808-6
Fremme, A., and Sodemann, H. (2019). The Role of Land and Ocean Evaporation on the Variability of Precipitation in the Yangtze River valley. Hydrol. Earth Syst. Sci. 23, 2525–2540. doi:10.5194/hess-23-2525-2019
Gimeno, L., Drumond, A., Nieto, R., Trigo, R. M., and Stohl, A. (2010). On the Origin of continental Precipitation. Geophys. Res. Lett. 37, a–n. doi:10.1029/2010GL043712
Gong, C., and Eltahir, E. (1996). Sources of Moisture for Rainfall in West Africa. Water Resour. Res. 32, 3115–3121. doi:10.1029/96wr01940
Guo, L., van der Ent, R. J., Klingaman, N. P., Demory, M.-E., Vidale, P. L., Turner, A. G., et al. (2019). Moisture Sources for East Asian Precipitation: Mean Seasonal Cycle and Interannual Variability. J. Hydrometeorol. 20, 657–672. doi:10.1175/JHM-D-18-0188.1
Han, X., Xue, H., Zhao, C., and Lu, D. (2016). The Roles of Convective and Stratiform Precipitation in the Observed Precipitation Trends in Northwest China during 1961-2000. Atmos. Res. 169, 139–146. doi:10.1016/j.atmosres.2015.10.001
Hu, Q., Jiang, D., and Lang, X. (2018b). Sources of Moisture for Different Intensities of Summer Rainfall over the Chinese Loess Plateau during 1979-2009. Int. J. Climatol 38, e1280–e1287. doi:10.1002/joc.5416
Hu, Q., Jiang, D., Lang, X., and Xu, B. (2018a). Moisture Sources of the Chinese Loess Plateau during 1979-2009. Palaeogeogr. Palaeoclimatol. Palaeoecol. 509, 156–163. doi:10.1016/j.palaeo.2016.12.030
Hu, Q., Jiang, D., Lang, X., and Yao, S. (2021). Moisture Sources of Summer Precipitation over Eastern China during 1979-2009: A Lagrangian Transient Simulation. Int. J. Climatol. 41, 1162–1178. doi:10.1002/joc.6781
Huang, W., Chang, S.-Q., Xie, C.-L., and Zhang, Z.-P. (2017). Moisture Sources of Extreme Summer Precipitation Events in North Xinjiang and Their Relationship with Atmospheric Circulation. Adv. Clim. Change Res. 8, 12–17. doi:10.1016/j.accre.2017.02.001
IPCC (2021). Climate Change 2021: The Physical Science Basis. Cambridge and New York: Cambridge University Press.
Kanamitsu, M., Ebisuzaki, W., Woollen, J., Yang, S.-K., Hnilo, J. J., Fiorino, M., et al. (2002). NCEP-DOE AMIP-II Reanalysis (R-2). Bull. Am. Meteorol. Soc. 83, 1631–1643. doi:10.1175/bams-83-11-1631(2002)083<1631:nar>2.3.co;210.1175/Bams-83-11-1631,
Läderach, A., and Sodemann, H. (2016). A Revised Picture of the Atmospheric Moisture Residence Time. Geophys. Res. Lett. 43, 924–933. doi:10.1002/2015GL067449
Li, W., Wang, K., Fu, S., and Jiang, H. (2008). The Interrelationship between Regional westerly index and the Water Vapor Budget in Northwest China. J. Glaciol. Geocryol. 30, 28–34. (in Chinese). doi:10.3724/SP.J.1047.2008.00014
Li, Y., and Sun, C. (2016). Impacts of the Superimposed Climate Trends on Droughts over 1961-2013 in Xinjiang, China. Theor. Appl. Climatol 129, 977–994. doi:10.1007/s00704-016-1822-x
Newell, R. E., Newell, N. E., Zhu, Y., and Scott, C. (1992). Tropospheric Rivers? - A Pilot Study. Geophys. Res. Lett. 19, 2401–2404. doi:10.1029/92GL02916
Numaguti, A. (1999). Origin and Recycling Processes of Precipitating Water over the Eurasian Continent: Experiments Using an Atmospheric General Circulation Model. J. Geophys. Res. 104, 1957–1972. doi:10.1029/1998JD200026
Peng, D., and Zhou, T. (2017). Why Was the Arid and Semiarid Northwest China Getting Wetter in the Recent Decades. J. Geophys. Res. Atmos. 122, 9060–9075. doi:10.1002/2016JD026424
Peng, D., Zhou, T., and Zhang, L. (2020). Moisture Sources Associated with Precipitation during Dry and Wet Seasons over Central Asia. J. Clim. 33, 10755–10771. doi:10.1175/JCLI-D-20-0029.1
Saha, S., Moorthi, S., Pan, H.-L., Wu, X., Wang, J., Nadiga, S., et al. (2010). The NCEP Climate Forecast System Reanalysis. Bull. Amer. Meteorol. Soc. 91, 1015–1058. doi:10.1175/2010BAMS3001.1
Shi, Y., Shen, Y., Kang, E., Li, D., Ding, Y., Zhang, G., et al. (2007). Recent and Future Climate Change in Northwest China. Climatic Change 80, 379–393. doi:10.1007/s10584-006-9121-7
Sodemann, H., Schwierz, C., and Wernli, H. (2008). Interannual Variability of Greenland winter Precipitation Sources: Lagrangian Moisture Diagnostic and North Atlantic Oscillation Influence. J. Geophys. Res. 113, D03107. doi:10.1029/2007JD008503
Sodemann, H., and Stohl, A. (2009). Asymmetries in the Moisture Origin of Antarctic Precipitation. Geophys. Res. Lett. 36, L22803. doi:10.1029/2009GL040242
Stohl, A., and James, P. (2004). A Lagrangian Analysis of the Atmospheric branch of the Global Water Cycle. Part I: Method Description, Validation, and Demonstration for the August 2002 Flooding in central Europe. J. Hydrometeor 5, 656–678. doi:10.1175/1525-7541(2004)005<0656:alaota>2.0.co;2
Stohl, A., and James, P. (2005). A Lagrangian Analysis of the Atmospheric Branch of the Global Water Cycle. Part II: Moisture Transports between Earth's Ocean Basins and River Catchments. J. Hydrometeorol. 6, 961–984. doi:10.1175/JHM470.1
Sun, B., and Wang, H. (2015). Analysis of the Major Atmospheric Moisture Sources Affecting Three Sub-regions of East China. Int. J. Climatol 35, 2243–2257. doi:10.1002/joc.4145
Trenberth, K. E., Dai, A., Rasmussen, R. M., and Parsons, D. B. (2003). The Changing Character of Precipitation. Bull. Am. Meteorol. Soc. 84, 1205–1218. doi:10.1175/BAMS-84-9-1205
Wang, H., and Chen, H. (2012). Climate Control for southeastern China Moisture and Precipitation: Indian or East Asian Monsoon. J. Geophys. Res. 117, a–n. doi:10.1029/2012jd017734
Wang, W., Li, H., Wang, J., and Hao, X. (2020). Water Vapor from Western Eurasia Promotes Precipitation during the Snow Season in Northern Xinjiang, a Typical Arid Region in Central Asia. Water 12, 141. doi:10.3390/w12010141
Wu, J., and Gao, X. J. (2013). A Gridded Daily Observation Dataset over China Region and Comparison with the Other Datasets. Chin. J. Geophys. 56, 1102–1111. (in Chinese). doi:10.6038/cjg20130406
Xu, C., Chen, Y., Yang, Y., Hao, X., and Shen, Y. (2010). Hydrology and Water Resources Variation and its Response to Regional Climate Change in Xinjiang. J. Geogr. Sci. 20, 599–612. doi:10.1007/s11442-010-0599-6
Yang, L. M. (2003). Climate Change of Extreme Precipitation in Xinjiang. Acta Geogr. Sin. 58, 577–583. (in Chinese). doi:10.11821/xb200304012
Yang, L. M., Li, X., and Zhang, G. X. (2011). Some Advances and Problems in the Study of Heavy Rain in Xinjiang. Clim. Environ. Res. 16, 188–198. (in Chinese). doi:10.3878/j.issn.1006-9585.2011.02.08
Yao, J., Chen, Y., Zhao, Y., Guan, X., Mao, W., and Yang, L. (2020). Climatic and Associated Atmospheric Water Cycle Changes over the Xinjiang, China. J. Hydrol. 585, 124823. doi:10.1016/j.jhydrol.2020.124823
Yao, J., Li, M., and Yang, Q. (2018). Moisture Sources of a Torrential Rainfall Event in the Arid Region of East Xinjiang, China, Based on a Lagrangian Model. Nat. Hazards. 92, 183–195. doi:10.1007/s11069-018-3386-9
Yao, S., Jiang, D., and Zhang, Z. (2021). Lagrangian Simulations of Moisture Sources for Chinese Xinjiang Precipitation during 1979-2018. Int. J. Climatol. 41, 216–232. doi:10.1002/joc.6679
Zhang, X., Alexander, L., Hegerl, G. C., Jones, P., Tank, A. K., Peterson, T. C., et al. (2011). Indices for Monitoring Changes in Extremes Based on Daily Temperature and Precipitation Data. Wires Clim. Change 2, 851–870. doi:10.1002/wcc.147
Zhao, Y., Huang, A., Zhou, Y., Huang, D., Yang, Q., Ma, Y., et al. (2014). Impact of the Middle and Upper Tropospheric Cooling over Central Asia on the Summer Rainfall in the Tarim Basin, China. J. Clim. 27, 4721–4732. doi:10.1175/JCLI-D-13-00456.1
Zhao, Y., Yu, X., Yao, J., Dong, X., and Li, H. (2018). The Concurrent Effects of the South Asian Monsoon and the Plateau Monsoon over the Tibetan Plateau on Summer Rainfall in the Tarim Basin of China. Int. J. Climatol. 39, 74–88. doi:10.1002/joc.5783
Keywords: moisture sources, FLEXPART, extreme precipitation, northern xinjiang, southern xinjiang
Citation: Hu Q, Zhao Y, Huang A, Ma P and Ming J (2021) Moisture Transport and Sources of the Extreme Precipitation Over Northern and Southern Xinjiang in the Summer Half-Year During 1979–2018. Front. Earth Sci. 9:770877. doi: 10.3389/feart.2021.770877
Received: 05 September 2021; Accepted: 28 October 2021;
Published: 22 November 2021.
Edited by:
Jun Niu, China Agricultural University, ChinaReviewed by:
Xiaodong Liu, Institute of Earth Environment (CAS), ChinaCopyright © 2021 Hu, Zhao, Huang, Ma and Ming. This is an open-access article distributed under the terms of the Creative Commons Attribution License (CC BY). The use, distribution or reproduction in other forums is permitted, provided the original author(s) and the copyright owner(s) are credited and that the original publication in this journal is cited, in accordance with accepted academic practice. No use, distribution or reproduction is permitted which does not comply with these terms.
*Correspondence: Yong Zhao, emhhb3k2MDhAY3VpdC5lZHUuY24=
Disclaimer: All claims expressed in this article are solely those of the authors and do not necessarily represent those of their affiliated organizations, or those of the publisher, the editors and the reviewers. Any product that may be evaluated in this article or claim that may be made by its manufacturer is not guaranteed or endorsed by the publisher.
Research integrity at Frontiers
Learn more about the work of our research integrity team to safeguard the quality of each article we publish.