 Susan E. Hough
- Earthquake Science Center, United States Geological Survey, Pasadena, CA, United States
In a recent study, Hough and Martin (2021) considered the extent to which socioeconomic factors influence the numbers and distribution of contributed reports available to characterize the effects of both historical and recent large earthquakes. In this study I explore the question further, focusing on analysis of widely felt earthquakes near major population centers in northern and southern California since 2002. For most of these earthquakes there is a correlation between average household income in a postal ZIP code and the population-normalized rate of responses to the DYFI system. As past studies have demonstrated, there is also a strong correlation between DYFI participation and the severity of shaking. This first-order correlation can obscure correlations with other factors that influence participation. Focusing on five earthquakes between 2011 and 2021 that generated especially uniform shaking across the greater Los Angeles, California, region, response rate varies by two orders of magnitude across the region, with a clear correlation with demographics, and consistent spatial patterns in response rate for earthquakes 10 years apart. While there is no evidence that uneven DYFI participation in California impacts significantly the reliability of intensity data collected, the results reveal that DYFI participation is significantly higher in affluent parts of southern California compared to economically disadvantaged areas.
Introduction
Seismologists have long relied on eyewitness accounts of earthquake effects on people and the built environment to characterize earthquakes and the ground motions they generate (Mallet, 1857; Ambraseys, 1971; Bakun and Wentworth, 1997; Gasperini et al., 2010; Sbarra et al., 2020). Typically, accounts of shaking are used to determine numerical intensity values reflecting the severity of shaking in at each location (e.g., Mallet, 1857). Even in recent times, intensity data produced by online systems from contributed eyewitness reports provides a valuable source of information to characterize earthquake shaking (Wald et al., 1999; Atkinson and Wald, 2007; Hough, 2012; Bossu et al., 2015; Bossu et al., 2017; Van Noten et al., 2017). In a recent study, Hough and Martin (2021; hereinafter HM21) explored the extent to which both historical and modern intensity data can be limited by socioeconomic factors that influence the likelihood that eyewitnesses’ experiences will be available for scientific analysis (also see Hough and Martin, 2021a; Wald, 2021). Considering three damaging earthquakes in California, HM21 explored a possible correlation between response rate to the “Did You Feel It?” (DYFI) system (Wald et al., 1999), and average household income in postal ZIP codes. They showed that, while some correlation between response rate for California earthquakes and household income is suggested, the DYFI data for the three events are primarily controlled by a correlation between response rate and shaking severity. This result was consistent with the conclusions reached by Mak and Schorlemmer (2016), who concluded that, to first order, DYFI participation correlates with population density and shaking severity.
In this study I further explore the interplay between household income and participation in the DYFI system, the primary tool for collection of macroseismic data for earthquakes in the United States (Wald et al., 1999). Developed in 1999, the system allows individuals to report their observations using a standard questionnaire to determine numerical intensity values. DYFI uses an algorithm to determine Community Decimal Intensity (CDI) value; the algorithm was developed to match the modified Mercalli intensity (MMI) values (Wood and Neumann, 1931) that would be determined based on traditional interpretations of intensity questionnaires (e.g., Dengler and Dewey, 1998; Wald et al., 1999).
The DYFI system proved enormously successful in gathering information about earthquake effects for events in the United States (Quitoriano and Wald, 2020). Whereas a spatially rich traditional intensity data set for an especially impactful historical or recent earthquake might include on the order of 1,000 individual reports gleaned from archival or media sources (e.g., Boatwright and Bundock, 2005; Martin et al., 2015), the DYFI system now collects tens of thousands of reports even for moderate earthquakes (Quitoriano and Wald, 2020). Studies have demonstrated a strong consistency between DYFI intensities and instrumental ground motion parameters such as peak ground acceleration (PGA). (Atkinson and Wald, 2007; Worden et al., 2012). DYFI data have thus proved useful beyond expectation to characterize earthquake effects, for myriad reasons including scientific investigations (e.g., Hough, 2012), development of earthquake early warning (e.g., Saunders et al., 2020), and earthquake response (Earle and Wald, 2007).
Whereas HM21 included analysis of DYFI data from three large earthquakes in California, in this study I consider a larger data set, focusing on earthquakes that were widely felt in the greater Los Angeles and greater San Francisco metropolitan areas between 2002 and 2021. Because these events generated low-to-moderate shaking intensities over wide areas, they provide an opportunity to explore further how DYFI data sets may be shaped by underlying socioeconomic factors. I specifically consider average household income, which Census data shows varies considerably among racial groups (see Data and Resources). I focus on earthquakes in California, which has two densely populated metropolitan areas across which there are marked socioeconomic differences, and from where large volumes of DYFI data have been collected.
Data and Analysis
The data set for this study primarily comprises moderate earthquakes since 2002 in California for which at least 20,000 responses were received by the DYFI system (Table 1; see Data and Resources). To include more events from the early part of this time period, when the DYFI system was less well-known, I also analyze data from seven events between 2002–2012 for which at least 15,000 responses were received, and an earthquake in 2021 that was widely felt within the greater Los Angeles area. Five of the events that meet the threshold for DYFI responses generated especially uniform shaking across the greater Los Angeles region (see Data and Resources). Detailed analysis of these events is useful to explore the correlation of DYFI response with socioeconomic factors (i.e., household income) with data for which the key variable of shaking intensity is largely controlled.
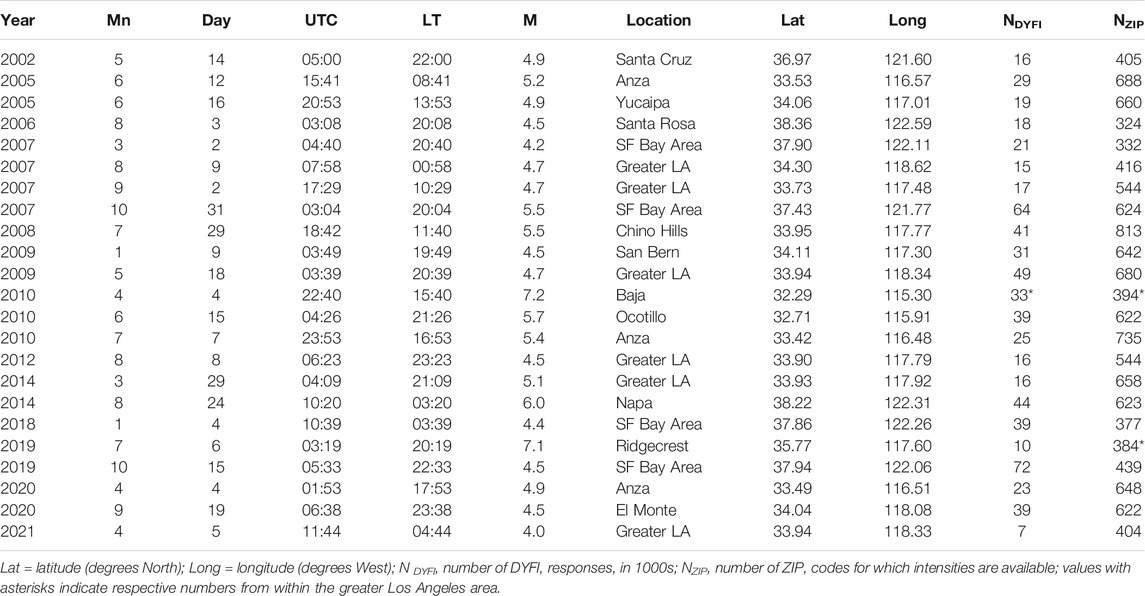
TABLE 1. Events analyzed.
A total of 21 moderate events are analyzed, with moment magnitudes, M, between 4.0 and 6.0. I also consider DYFI data from two large regional earthquakes that were widely felt across the greater Los Angeles area: the 4 April 2011 M 7.2 Baja (El Major Cucapah) earthquake the 6 July 2019 M 7.1 Ridgecrest earthquake. Coincidentally, the Baja earthquake occurred at 3:40 p.m. local time (LT) on a widely observed religious holiday (Easter Sunday) and the Ridgecrest mainshock occurred at 8:19 p.m. LT on the Friday of the July 4th holiday weekend. Shaking from both events was widely felt across the greater Los Angeles area with intensities close to 4.
The DYFI questionnaire includes no demographic questions. When the system was introduced in 1999 locations were determined from ZIP code, which was required, with an option to add street addresses. Over time, geocoded locations have been increasingly determined automatically using web services (Quitoriano and Wald, 2020). While the accuracy of geocoded locations and the volume of geocoded data have increased over the years, ZIP-code-based data sets were larger for earlier events. Following HM21, I consider DYFI intensities averaged within ZIP codes, CDIZIP, for all events. DYFI data for all events can be accessed from U.S. Geological Survey web pages (see Data and Resources).
I calculate the response rate, RRZIP, by dividing the number of DYFI responses by the population within each ZIP code (see Data and Resources). To consider socioeconomic factors, I use average household income within ZIP codes, INZIP (see Data and Resources). Consideration of aggregated data within ZIP codes provides an admittedly coarse treatment of socioeconomic factors. Throughout the Los Angeles and San Francisco metropolitan areas, however, ZIP code boundaries can represent sharp divides in average affluence. For example, the average household income in ZIP code 90,035 (Beverlywood) is over $89,000, while in adjacent Central LA (ZIP code 90,019) it is $56,000, and in the next ZIP code to the east (90,006) it is $37,000. Census data show that other examples abound. Although the use of ZIP-code-based data is clearly not ideal, this approach will reveal whether or not there are systematic differences in DYFI participation at a ZIP-code level.
Figure 1 (B,D) and Figure 2 (B,D) confirm that all of the events analyzed in this study generated average intensities around 3 in the Los Angeles or San Francisco region. For the events analyzed, the number of ZIP codes for which data are available ranges from 325 to 737. Visual inspection of results (Figures 1, 2) from individual earthquakes perhaps suggests a stronger correlation between RRZIP and INZIP for earthquakes before 2015 than for earthquakes between 2018–2020, with generally consistent trends between the two regions. There are, however, few events in either region since 2018, and trends for any individual events may be controlled by the established first-order correlation between DYFI participation and shaking severity.
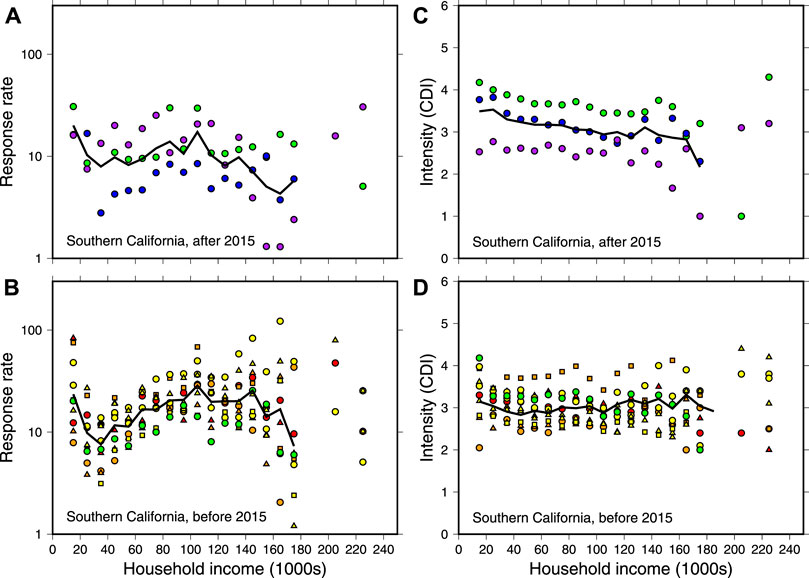
FIGURE 1. (A, top left) Response rate (scaled by 10,000) in individual ZIP codes versus average household income for earthquakes in southern California after 2015. Colored symbols show response rates for individual events bin-averaged over incomes +/−$10,000, with each event shown with a different symbol. In this and other panels, black line shows bin-averages for household incomes below $200,000 (averages not shown for higher incomes, for which there are few data). (B, top right) Bin-averaged average intensity versus average household income for earthquakes in southern California after 2015. Results for different events are shown with different colored symbols. (C, bottom left) Bin-averaged scaled response rate for earthquakes in Southern California before 2015. Symbols for individual events are plotted with different colors. (D, bottom right) Bin-averaged intensity data for earthquakes in southern California before 2015.
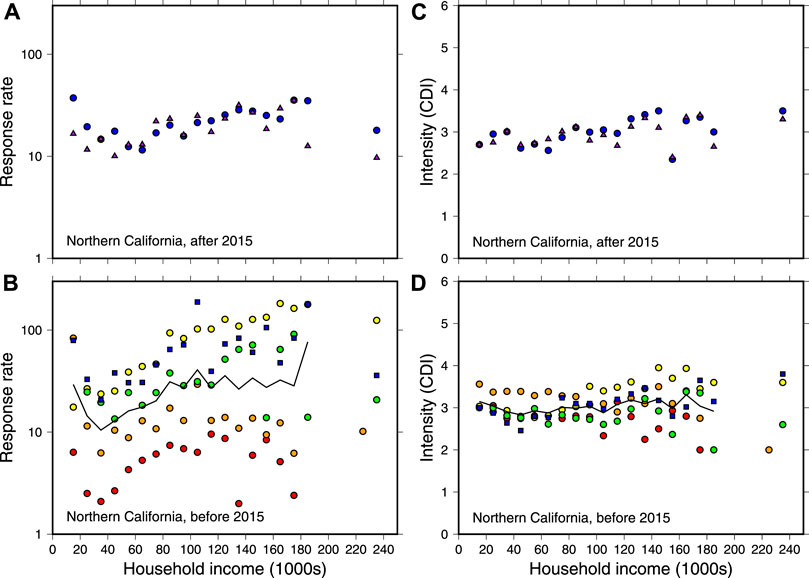
FIGURE 2. (A, top left) Response rate (scaled by 10,000) in individual ZIP codes versus average household income for earthquakes in northern California after 2015. Colored symbols show response rates for individual events bin-averaged over incomes +/−$10,000, with each event shown with a different symbol. Averages not shown in (A,B) because each dataset includes only two events. (B, top right) Bin-averaged average intensity versus average household income for earthquakes in northern California after 2015. Results for different events are shown with different colored symbols. (C, bottom left) Bin-averaged scaled response rate for earthquakes in northern California before 2015. Symbols for individual events are plotted with different colors. (D, bottom right) Bin-averaged intensity data for earthquakes in northern California before 2015.
The earthquakes considered in this study collectively generated very little strong shaking, i.e., with intensities higher than 5. While this should obviate to some extent the possibility of biases between response rate and intensity level (e.g., Mak and Schorlemmer, 2016; Boatright and Phillips, 2017; Hough and Martin, 2021a), those biases are expected to persist even at low shaking levels. One might even suppose the biases are stronger, since, for intensities below 5, the percentage of people who feel shaking at all is a key indicator for assessing intensity level. Figures 1 and 2 also show CDIZIP vs INZIP for southern and northern California, respectively (not including averages for incomes above $200,000, for which there are few data). Figures 1B and 2B reveal correlations between RRZIP and INZIP for recent events in both regions. In northern California, intensities tend to increase with INZIP for recent events, reflecting the fact that the earthquakes occurred in the generally affluent San Francisco Bay area. In contrast, in southern California, average intensity has had a weak negative correlation with household income for events since 2015, while response rate shows less of a correlation. This suggests that DYFI participation in southern California still correlates to some extent with socioeconomic factors.
For some events especially, the correlation between RRZIP and INZIP reverses for INZIP below $40,000. This appears to suggest that people in less affluent areas might be more inclined than individuals in more affluent regions to report observations to the DYFI system. Upon closer inspection, however, the events with the strongest “hooks” at low income levels tend to be those that occurred between 9:00 a.m. and 5:00 p.m. LT notably the 2008 M 5.4 Chino Hills earthquake, which occurred mid-morning LT on a weekday. For earthquakes during standard working hours, some DYFI reports will be submitted from work or school locations, which may not be the same as home ZIP codes. Figure 3 shows RRZIP for three earthquakes that occurred during standard workday hours and results for a M 5.1 event that occurred near Brea, east of Los Angeles, around 9:00pm LT. For each event Figure 3 also shows the scaled response rate for ZIP code 90,089, the ZIP code for the University of Southern California (USC) campus, including on-campus housing. The RRZIP for 90,089 is low for the 2007 event, which generated weak shaking at USC (estimated CDI = 2.7), but notably high for the daytime events and the one evening event. In Figure 3B, I show the ratio between RRZIP for 90,089 alone and RRZIP for all ZIP codes with average household income below $20,000, defined as the USC factor, plotted against time of day (LT). The USC Factor tends to be high earthquakes in the data set that occurred between 11:00 a.m. and 5:00 p.m. LT, and to a lesser extent for earthquakes that occur in the evening. Interestingly, one of the earthquakes analyzed in this study occurred late at night (11:38 p.m. LT) on 19 September 2020, a time when on-campus activities were sharply curtailed due to the COVID-19 pandemic. Although this earthquake was widely felt in the greater Los Angeles area, it is the only southern California earthquake in the dataset for which no DYFI responses were received for ZIP code 90,089. It is reasonable to conclude that, in areas with a large university or downtown commercial center, some individuals experience earthquakes and report their observations from the ZIP code where they work rather than the ZIP code where they live.
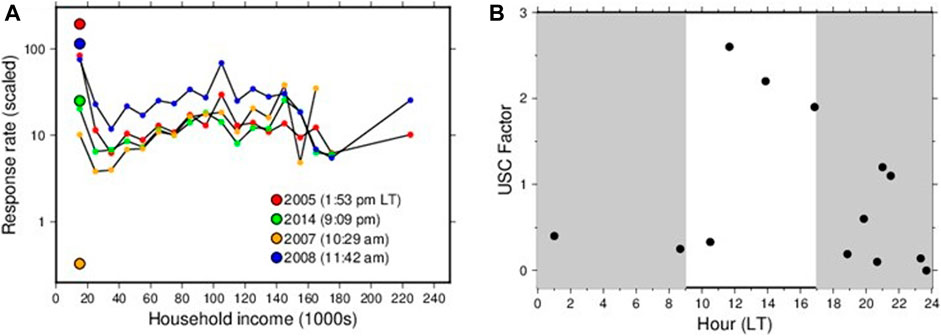
FIGURE 3. (A, left) Bin-averaged normalized response rate versus average household income in each ZIP code for four earthquakes, three that occurred between 9:00am and 5:00 pm local time (blue, red, and orange symbols), and one that occurred around 9:00pm (LT) (green symbols). The large dot shows the normalized response rate in ZIP code 90,089 for all four earthquakes (B, right) The USC Factor, for each event in southern California, defined by the ratio between RRZIP for the ZIP code corresponding to the University of Southern California and average RR for all ZIP codes with average household income below $20,000, plotted versus time of day (local time). Unshaded region indicates standard work-day hours: 9:00am–5:00pm (LT).
The potential disconnect between where people live and where they experience earthquakes is among the factors that could tend to obscure an underlying correlation between coarsely aggregated demographic data and DYFI participation. The standard 40 h workweek is, however, only about ¼ of the total number of hours in a week. Of the 20 earthquakes considered in this study, only three occurred between 9:00 a.m. and 5:00 p.m. Further, although it is a temporary situation, DYFI responses are more likely to come from people’s home locations during the COVID-19 pandemic. For this reason, the 2020 South El Monte earthquake, which occurred not only late at night but also when area universities and many businesses were closed, may offer a uniquely ideal opportunity to consider the correlation between response rate and socioeconomic factors.
Lastly I consider the spatial distribution of RRZIP across the greater Los Angeles metropolitan area for the five earthquakes in the data set that were widely felt in this region with especially consistent intensity levels (Figures 4A–E, respectively) (see Data and Resources). The response rate results are plotted with a logarithmic scale, such that the warmest colors on the map are about two orders of magnitude larger than the coolest colors.
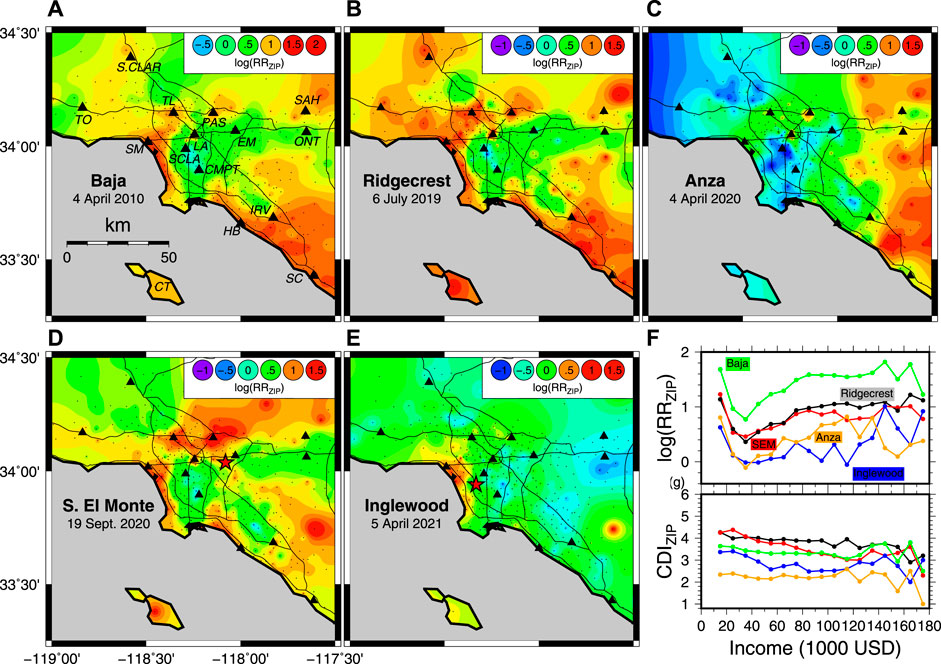
FIGURE 4. (A, top left) Contoured normalized response rate (logarithmic scale) across the greater Los Angeles area for the 2011 M 7.2 Baja earthquake. Small black dots show ZIP code centroids; light black lines in (A)–(E) indicate major highways; triangles indicate cities (LA: Downtown Los Angeles, PAS: Pasadena, SM: Santa Monica; TO: Thousand Oaks; HB: Huntington Beach; SCLA: South-Central Los Angeles; SC: San Clemente; TL: Toluca Lake; S. CLAR: Santa Clara; SAH: San Antonio Heights). (B, top middle) similar plot for 6 July 2019 M 7.1 Ridgecrest mainshock. In (B)–(D) the same color scale is used, and triangles indicate locations of cities labeled in (A); (C, top right) similar plot for 2010 M 4.9 Anza earthquake; (D, bottom left) similar plot for 2020 M 4.5 South El Monte earthquake (red star indicates epicenter); (E, bottom middle) similar plot for 2021 M 4.0 Inglewood earthquake (red star indicates epicenter; different color scale, as indicated); (F, bottom right). Top panel shows log-averaged binned RRZIP values versus household income for ZIP codes within map area shown in (A)–(E). Results for individual events are plotted with different colors, as labeled; bottom panel shows bin-averaged CDIZIP values for same events, same color conventions.
For the South El Monte earthquake, RRZIP is elevated at some locations near the epicenter (Figure 4D), as expected. Overall, however, the spatial patterns are strikingly consistent among all five events, with low values of RRZIP along a central corridor from South-Central Los Angeles and Compton, a corridor northwest of Irvine, and an area southeast of El Monte, areas that are generally disadvantaged economically (see Data and Resources). The similarity in spatial patterns between the 2011 Baja and 2019 Ridgecrest earthquakes is notable, given that these two large regional earthquakes occurred eight years apart, with different back-azimuths, and the overall response rate was appreciably higher for the earlier event. Spatial patterns are also notably similar for the two events that occurred during the pandemic (2020 EL Monte and 2021 Inglewood) and other events, suggesting that, overall, DYFI participation does correlate with local socioeconomic factors, notwithstanding the identified USC effect. For all events, a sharp difference in RRZIP is observed across the westernmost interstate highway in the region, the I-405 freeway, which in some areas represents a sharp demarcation line between highly coveted coastal property to the west and less affluent areas to the east (see Hough and Martin, 2021b). Areas with low response rate are also generally areas where non-Hispanic whites are in the minority. For example, the non-Hispanic white population in South-Central Los Angeles, Compton, Santa Ana, and South El Monte is, respectively, 1.2, 0.8, 9.4, and 5.1%. In contrast, RRZIP is consistently high in a number regions that are affluent and more predominantly non-Hispanic white, including Pasadena (39.1% white), Toluca Lake (72% white), and a swath along the coast from Santa Monica (71% white) to San Clemente (76% white).
To further demonstrate the visual correlations evident in Figures 4A–E, in Figure 4F I plot log-averaged RRZIP data for the five events from ZIP codes within the map area shown in panels (a)-(e). Apart from high RRZIP values at the lowest income levels, Figure 4F shows the consistent correlation between RRZIP and household income for incomes between $30,000 and about $100,000, with a similar correlation for relatively more- and less-widely reported events. At the highest income levels (above $100,000), RRZIP appears to level off, but more work would be needed to explore the significance of this observation, given that these results are constrained by relatively few ZIP codes. For all five events, average CDIZIP is either level or decreases slightly with INZIP across the region. Thus, if anything, the weak, negative correlation between RRZIP and CDIZIP predicts that RRZIP will decrease with INZIP for all five events.
Discussion and Conclusion
The results of Hough and Martin (2021a) confirmed the result of past studies (e.g., Mak and Schorlemmer, 2016), that, apart from very strong shaking that may not be reported (Bossu et al., 2018), the likelihood that an individual will report their observations to the DYFI system depends strongly on the severity of shaking they experienced. Focusing on moderate earthquakes provides the opportunity to explore further the extent to which participation in the DYFI system may have been shaped over time by average household income.
Without question, the DYFI system has been successful beyond expectations, broadening the size of the overall pool of individuals whose observations of US earthquakes are available for science (Quitoriano and Wald, 2020). The results of this study confirm the conclusion of HM21, that in contrast to India, where basic literacy remains uneven and DYFI data are strongly limited by socioeconomic factors, in California the DYFI system is generally successful in characterizing the distribution of shaking in less-as well as more-affluent regions. Assuming the results of (Dengler and Dewey 1998) are applicable to internet-based intensities as well, average CDI estimates within a given community (ZIP code or geocoded cell) are expected to be stable and reliable with on the order of 20 responses. The results of this study further suggest that DYFI participation in California may be becoming more inclusive with time. The introduction of a Spanish-language DYFI questionnaire in 2006, and again in 2018 after a 4 years hiatus following a 2014 redesign of the site, likely improved accessibility in a State where Spanish is the primary language in over ¼ of all households (see Data and Resources). In their earlier telephone survey following the Northridge earthquake, (Dengler and Dewey 1998) brought in bilingual students after discovering quickly that some of the people they called spoke only Spanish, and did not understand English-speaking callers (L. Dengler, written communication, 2021).
The results of this study do, however, suggest that socioeconomic factors continue to shape DYFI participation in California. Although the USC factor defined in this study provides a cautionary note about using average income data aggregated within postal ZIP codes, it also suggests that DYFI participation may correlate with educational level. The spatial distribution of response rate for the five earthquakes that generated especially consistent shaking levels across the region reveals a clear and in some cases dramatic correlation with household affluence across the greater Los Angeles region (Figure 4). As noted, areas with low response rates are not only economically disadvantaged, but also regions where non-Hispanic whites are a small minority of the population (see Data and Resources). More in-depth analysis of demographic data would be useful to explore the extent to which DYFI participation correlates with factors other than average household income, as well as changes in DYFI participation over time.
In California, 84% of households had access to broadband internet service at home in 2019 (see Data and Resources), although the rate is lower (79 and 81%) among households that identify as Latino and African-American, respectively. Over half of all Californians have a smartphone that they use to access the internet. The ability to access the internet at home does correlate with socioeconomic factors including income and education. As Levine, (2020) notes, a “digital divide” between low- and high-income groups has remained virtually unchanged over the past decade. It is thus not surprising that DYFI participation will correlate with average household income.
Given that participation in California is still high enough to characterize felt shaking across diverse socioeconomic regions, one might ask, does it matter that some socioeconomic groups do not participate as much as others? There is no direct benefit to DYFI participation; people may use it because they find it interesting to learn what intensity they felt, or gratifying to contribute to science. If we focus on citizen (or community) science as a potential benefit to science (e.g., Silvertown, 2009; Hand, 2010), uneven participation may not necessarily be problematic.
As, however, the world beyond seismology is motivated to address systemic socioeconomic disparities, it is timely to consider whether representation issues come into play in our own field. Citizen science does not only benefit science; it also provides benefits to participants (Bonney et al., 2015). Such engagement may be especially valuable with earthquakes, since they pose an immediate concern to anyone who lives in an earthquake-prone region. It would be an interesting sociological question to explore in a future study, whether preparedness actions correlate with DYFI participation. Dengler et al. (2008) analyzed data from surveys conducted between 1993 and 2013 and showed that people in Humboldt County who had sought out information about earthquakes were more likely to have taken preparedness actions.
The analysis presented in this study considers DYFI participation in more detail than HM21, but remains data-limited, and much more could be done–much of it the purview of sociology, not seismology-to understand both whether and why people choose to submit reports to DYFI.
Since its inception, the DYFI system has been promoted via articles published in technical journals (e.g., Wald et al., 1999), publications aimed at a broader scholarly audience (e.g., Quitoriano and Wald, 2020) and, increasingly, via conventional media and social media after significant felt earthquakes. Public awareness of the system has, however, largely grown organically. Individuals who seek out information about an earthquake may notice and respond to the DYFI link on an event page. If they do not seek out information, they are unlikely to know that DYFI exists. The system is clearly popular among users (see Quitoriano and Wald, 2020). To the extent that the system provides an opportunity to raise awareness of earthquakes and earthquake hazard, uneven participation suggests that some Californians may have been effectively underserved by current outreach programs. This suggests that further work would be useful to explore whether targeted promotion of the DYFI system might not only increase participation in the system, but also to improve overall engagement with and outreach to communities that remain underserved in general by outreach efforts to raise awareness of earthquakes.
Data and Resources
Statistics about internet access in California can be found at: https://www.ppic.org/publication/californias-digital-divide/(last accessed 1 March 2021).
Average household income within California ZIP codes, estimated from 2010–2014 U.S. census data, is available at http://www.usa.com/rank/california-state--median-household-income--zip-code-rank.htm (last accessed 31 August 2020). The distribution of incomes throughout the state is discussed at https://lao.ca.gov/2000/0800_inc_dist/0800_income_distribution.html (last accessed 16 November 2020). The racial disparities in income are evident in Census data, e.g., http://www.laalmanac.com/social/so722.php (last accessed 21 July 2021).
A map showing the distribution of racial majorities across the Los Angeles region can be accessed at: https://scalar.usc.edu/works/historic-central-avenue-los-angeles/race-ethnic-majority-map-los-angeles-county-2000--highlighting-central-avenue (last accessed 10 March 2021).
Did You Feel It? Data, and information about all of the earthquakes analyzed in this study, can be accessed via the USGS Comprehensive Earthquake Catalog site, which includes links to DYFI data on each event page: https://earthquake.usgs.gov/earthquakes/search/(last accessed 1 March 2021). Did You Feel It? Maps for the 5 earthquakes shown in Figure 4 can be found, respectively, at https://earthquake.usgs.gov/earthquakes/eventpage/ci14607652/dyfi/zip (Baja); https://earthquake.usgs.gov/earthquakes/eventpage/ci38457511/dyfi/zip (Ridgecrest); https://earthquake.usgs.gov/earthquakes/eventpage/ci39126079/dyfi/zip (Anza); https://earthquake.usgs.gov/earthquakes/eventpage/ci38695658/dyfi/zip (South El Monte); and https://earthquake.usgs.gov/earthquakes/eventpage/ci39838928/dyfi/zip (Inglewood) (all last accessed 12 November 2021). Geocoded maps for the same events can also be found on the event page for each events.
Data Availability Statement
Publicly available datasets were analyzed in this study. This data can be found here: http://earthquake.usgs.gov.
Author Contributions
The author confirms being the sole contributor of this work and has approved it for publication.
Conflict of Interest
The author declares that the research was conducted in the absence of any commercial or financial relationships that could be construed as a potential conflict of interest.
Publisher’s Note
All claims expressed in this article are solely those of the authors and do not necessarily represent those of their affiliated organizations, or those of the publisher, the editors and the reviewers. Any product that may be evaluated in this article, or claim that may be made by its manufacturer, is not guaranteed or endorsed by the publisher.
Acknowledgments
Constructive reviews from Anne Wein, Lori Dengler, and two reviewers, as well as feedback from Justin Rubinstein and Shane Detweiler, are acknowledged with appreciation. The author also expresses appreciation to the Bureau Approving Official, Michael Diggles, for his conscientious handling of this and other manuscripts. Figures were generated using Generic Mapping Tools (Wessel and Smith, 2014).
References
Ambraseys, N. N. (1971). Value of Historical Records of Earthquakes. Nature 232 (5310), 375–379. doi:10.1038/232375a0
Atkinson, G. M., and Wald, D. J. (2007). "Did You Feel it?" Intensity Data: A Surprisingly Good Measure of Earthquake Ground Motion. Seism. Res. Lett. 78 (3), 362–368.
Bakun, W. H., and Wentworth, C. M. (1997). Estimating Earthquake Location and Magnitude from Seismic Intensity Data. Bull. Seism. Soc. Am. 87 (6), 1502–1521.
Boatright, J., and Phillips, E. (2017). Exploiting the Demographics of “Did You Feel it?” Responses to Estimate the Felt Area of Moderate Earthquakes in California. Seism. Res. Lett. 88 (2A), 335–341.
Boatwright, J., and Bundock, H. (2005). Modified Mercalli Intensity Maps for the 1906 San Francisco Earthquake Plotted in ShakeMap Format, US Geological Survey Open-File Rep. 2005-1135. Version 1.0. Menlo Park, CA: U.S. Geological Survey, 345 Middlefield Rd.
Bonney, R., Phillips, T. B., Ballard, H. L., and Enck, J. W. (2015). Can Citizen Science Enhance Public Understanding of Science? Public Underst Sci. 25 (1), 2–16. doi:10.1177/0963662515607406
Bossu, R., Landès, M., Roussel, F., and Steed, R. (2018). Felt Reports for Rapid Mapping of Global Earthquake Damage: The Doughnut Effect? Seism. Res. Lett. 89 (1), 138–144. doi:10.1785/0220170129
Bossu, R., Landès, M., Roussel, F., Steed, R., Mazet‐Roux, G., Martin, S. S., et al. (2017). Thumbnail‐Based Questionnaires for the Rapid and Efficient Collection of Macroseismic Data from Global Earthquakes. Seismological Res. Lett. 88 (1), 72–81. doi:10.1785/0220160120
Bossu, R., Laurin, M., Mazet-Roux, G., Roussel, F., and Steed, R. (2015). The Importance of Smartphones as Public Earthquake-Information Tools and Tools for the Rapid Engagement with Eyewitnesses: A Case Study of the 2015 Nepal Earthquake Sequence. Seismological Res. Lett. 86 (6), 1587–1592. doi:10.1785/0220150147
Dengler, L. A., and Dewey, J. W. (1998). An Intensity Survey of Households Affected by the Northridge, California, Earthquake of 17 January 1994. Bull. Seism. Soc. Am. 88 (2), 441–462. doi:10.1785/bssa0880020441
Dengler, L., Nicolini, T., Larkin, D., and Ozaki, V. (2008). “Building Tsunami-Resilient Communities in Humboldt County, California,” in Solutions to Coastal Disasters 2008 – Tsunamis. Editors L. Wallendorf, L. Ewing, C. Jones, and B. Jaffe (Reston, VA: Amer. Soc. Civil Engineers), 178–191. doi:10.1061/40978(313)17
Earle, P., and Wald, D. J. (2007). PAGER – Rapid Assessment of an Earthquake’s Impact. Washington, DC: U.S. Geological Survey Fact Sheet 2007-3101.
Gasperini, P., Vannucci, G., Tripone, D., and Boschi, E. (2010). The Location and Sizing of Historical Earthquakes Using the Attenuation of Macroseismic Intensity with Distance. Bull. Seismological Soc. America 100 (5A), 2035–2066. doi:10.1785/0120090330
Hough, S. E. (2012). Initial Assessment of the Intensity Distribution of the 2011 Mw 5.8 Mineral, Virginia, Earthquake. Seismological Res. Lett. 83 (4), 649–657. doi:10.1785/0220110140
Hough, S. E., and Martin, S. S. (2021a). Which Earthquake Accounts Matter? Seism. Res. Lett. 92, 1069–1084. doi:10.1785/0220200366
Hough, S. E., and Martin, S. S. (2021b). Reply to, “Comment on, ‘Which earthquake accounts matter?’, by S.E. Hough and S.S. Martin”. Seism. Res. Lett. 92, 5. (in press).
Levine, L. (2020). Broadband Adoption in Urban and Suburban California: Information-Based Outreach Programs Ineffective at Closing the Digital divide. Jices 183, 431–459. doi:10.1108/JICES-04-2020-0041
Mak, S., and Schorlemmer, D. (2016). What Makes People Respond to "Did You Feel it?"? Seismological Res. Lett. 87 (1), 119–131. doi:10.1785/0220150056
Mallet, R. (1857). Report of the Earthquake-Expedition to Naples. London, United Kingdom: Royal Society. Royal Soc. Proc. 10/12.
Martin, S. S., Hough, S. E., and Hung, C. (2015). Ground Motions from the 2015Mw 7.8 Gorkha, Nepal, Earthquake Constrained by a Detailed Assessment of Macroseismic Data. Seismological Res. Lett. 86 (6), 1524–1532. doi:10.1785/0220150138
Quitoriano, V., and Wald, D. J. (2020). USGS "Did You Feel It?"-Science and Lessons from 20 Years of Citizen Science-Based Macroseismology. Front. Earth Sci. 8. doi:10.3389/feart.2020.00120
Saunders, J. K., Aagaard, B. T., Baltay, A. S., and Minson, S. E. (2020). Optimizing Earthquake Early Warning Alert Distance Strategies Using the July 2019 Mw 6.4 and Mw 7.1 Ridgecrest, California, Earthquakes. Bull. Seism. Soc. Am. 110 (4), 1872–1886. doi:10.1785/0120200022
Sbarra, P., Tosi, P., De Rubeis, V., and Sorrentino, D. (2020). Quantification of Earthquake Diagnostic Effects to Assess Low Macroseismic Intensities. Nat. Hazards 104, 1957–1973. doi:10.1007/s11069-020-04256-6
Silvertown, J. (2009). A New Dawn for Citizen Science. Trends Ecol. Evol. 24 (9), 467–471. doi:10.1016/j.tree.2009.03.017
Smith, A. (2014). African Americans and Technology Use – A Demographic Portrait. Pew Res. Cent. Rep. 419, 4500.
Van Noten, K., Lecocq, T., Sira, C., Hinzen, K.-G., and Camelbeeck, C. (2017). Path and Site Effects Deduced from Merged Transfrontier Internet Macroseismic Data of Two Recent M4 Earthquakes in Northwest Europe Using a Grid Cell Approach. Solid Earth 8, 453–477. doi:10.5194/se-8-453-2017
Wald, D. J. (2021). “Comment on, “Which Earthquake Accounts Matter?”,”. Seism. Res. Lett. Editors S. E. HoughS. S. Martin, 92, 5. (in press).
Wald, D. J., Quitoriano, V., Dengler, L., and Dewey, J. W. (1999). Utilization of the Internet for Rapid Community Intensity Maps. Seism. Res. Lett. 70 (6), 680–693.
Wood, H. O., and Neumann, F. (1931). Modified Mercalli Intensity Scale of 1931. Bull. Seismological Soc. America 21 (4), 277–283. doi:10.1785/bssa0210040277
Keywords: earthquakes, felt reports, community science, participation bias, outreach
Citation: Hough SE (2021) Contributed Reports of Widely Felt Earthquakes in California, United States: If They Felt it, Did They Report it?. Front. Earth Sci. 9:770445. doi: 10.3389/feart.2021.770445
Received: 03 September 2021; Accepted: 01 November 2021;
Published: 06 December 2021.
Edited by:
Max Rudolph, University of California, Davis, United StatesReviewed by:
Gianfranco Vannucci, Istituto Nazionale di Geofisica e Vulcanologia (INGV), ItalyAndrea Tertulliani, Istituto Nazionale di Geofisica e Vulcanologia (INGV), Italy
Copyright © 2021 Hough. This is an open-access article distributed under the terms of the Creative Commons Attribution License (CC BY). The use, distribution or reproduction in other forums is permitted, provided the original author(s) and the copyright owner(s) are credited and that the original publication in this journal is cited, in accordance with accepted academic practice. No use, distribution or reproduction is permitted which does not comply with these terms.
*Correspondence: Susan E. Hough, aG91Z2hAdXNncy5nb3Y=