 Qian Huang
 Xinyu Yin
 Suxiang Yao
95% of researchers rate our articles as excellent or good
Learn more about the work of our research integrity team to safeguard the quality of each article we publish.
Find out more
ORIGINAL RESEARCH article
Front. Earth Sci. , 16 November 2021
Sec. Interdisciplinary Climate Studies
Volume 9 - 2021 | https://doi.org/10.3389/feart.2021.770253
This article is part of the Research Topic The Adaptation to and Mitigation of Climate-Sensitive Natural Hazards View all 21 articles
Summer precipitation in East Asia has significant quasi-biweekly (10–30-day) oscillation characteristics. By using gauge-based precipitation and ERA-Interim reanalysis data, the basic mode of the quasi-biweekly oscillation of summer precipitation in East Asia and the related circulation from 1979 to 2012 were analyzed. It was found that the middle and lower reaches of the Yangtze River and its south in China were among the key areas for the 10- to 30-day oscillation of summer precipitation. After selecting typical summer precipitation events with 10- to 30-day oscillation characteristics in key areas and conducting composite analysis, it is found that in the dry (wet) phase of quasi-biweekly precipitation in southern China, it is controlled by quasi-biweekly anticyclone (cyclone) at 500 hPa above the key area. During the evolution of quasi-biweekly precipitation, the ridge of the Northwest Pacific Subtropical High is located between 20 and 22°N latitude, and there is no significant variability in the large-scale background circulation. Furthermore, composite analysis of the precursory signal at 500 hPa during quasi-biweekly precipitation in southern China found that there was an obvious quasi-biweekly geopotential height anomaly over the North Atlantic Ocean almost 30 days before the peak day of quasi-biweekly precipitation. While the quasi-biweekly geopotential height anomaly at 500 hPa in the North Atlantic propagates eastward, it also leads the cold air to transport southward. Cold air from high latitudes and warm air from low latitudes converge in southern China, which affects the quasi-biweekly oscillation of precipitation. Hysteresis synthesis of precipitation based on 500 hPa geopotential height’s quasi-biweekly oscillation events over the North Atlantic Ocean comes to almost the same conclusion. Therefore, the 500 hPa geopotential height quasi-biweekly anomaly in the North Atlantic may have important prediction significance for an extended-range forecast of summer rainfall in China.
Located in the East Asian monsoon region, China has complicated weather and climatic characteristics and frequent meteorological disasters. The summer precipitation process in southern China and the corresponding drought and flood events have always been the focus of meteorologists’ research. With the development of numerical weather prediction technology and seasonal dynamic forecasting systems, medium- and short-term deterministic forecasts (several hours to a week) and climate (monthly, seasonal to interannual) probability prediction capabilities have been continuously improved (Jung and Vitart, 2006; Amador and Lovejoy, 2021; Yang et al., 2021). However, there are still large uncertainties in the field of 10–30 days extended-range forecasting (or subseasonal forecasting), which has long been considered to be a predictable desert (Vitart et al., 2012; Robertson et al., 2015). Understanding the predictability sources of extended-range forecasting is a major challenge in the frontier of meteorological research (Robertson et al., 2018), and it is particularly important to extract the precursory signals of the weather processes which lead to disasters.
Previous studies have shown that persistent severe weather processes are closely related to atmospheric low-frequency activities, and summer precipitation in China has obvious characteristics of intraseasonal oscillation (ISO) (Chen et al., 2015; Hsu et al., 2016; Li and Mao, 2019; Hong et al., 2021). For example, the two persistent heavy rainfall disaster events that occurred in the Yangtze River basin in 1998 were both in the active phase of the rainfall ISO (Zhu et al., 2003; Ju et al., 2005; Sun et al., 2016). Similarly, Meiyu in 2016 also has typical quasi-biweekly oscillation (QBWO) characteristics (Huang et al., 2020). In addition to the aforementioned typical events, the results of the climate statistics also confirm that China’s precipitation has significant ISO characteristics, including QBWOs and 30- to 60-day oscillations (Mao et al., 2010; Yang et al., 2010; Yin et al., 2011; Liu et al., 2018; Xia et al., 2021; Zhou et al., 2021).
The ISO of summer precipitation in China is the result of the coordinated control of atmospheric circulation at different latitudes, including the northward and northwestward propagation from low-latitude (Hsu et al., 2000; Shen et al., 2016; Liu et al., 2020) and the regulation of mid-high-latitude ISO signals (Wei et al., 2015; Lu et al., 2007; Buhe et al., 2008; Ren et al., 2020). Previous studies have also shown that the QBWO of precipitation is significantly affected by the Eurasian wave train (Mao et al., 2010; Ren et al., 2015; Liu et al., 2020). The midlatitude low-frequency Rossby wave trains propagate from Eurasia to East Asia and the North Pacific along the Westerlies, impacting the key circulation systems of Meiyu, such as the South Asian High and the Northwest Pacific Subtropical High, and ultimately influencing the QBWO characteristics of precipitation (Ren et al., 2015). However, most of the aforementioned studies have focused on the circulation evolution in the same period with quasi-biweekly precipitation and did not discuss too much about the precursory signals of low-frequency precipitation events. Therefore, while analyzing the QBWO of precipitation in southern China, this article pays more attention to the quasi-biweekly characteristics of atmospheric circulation more than 10 days in advance, hoping to find the precursory signals of precipitation and provide a reference for the extension period prediction of precipitation.
In this study, 0.5° daily precipitation data (gauge) constructed from more than 2,400 stations over China Mainland from 1979 to 2012 were used to clarify the QBWO events. In addition, we also chose the 1.5° ERA-Interim reanalysis products (Dee et al., 2011) at 6-h intervals to analyze the circulation characteristics. The summer defined in this article refers to the months June to August. In this study, the daily value is obtained by averaging the 6-h data before the whole analysis.
The power spectrum analysis was used to find the dominant period of precipitation. The Butterworth band-pass filter was used to get the QBWO signal of a meteorological element. The 10- to 30-day filtered precipitation greater than or equal to 1.5 standard deviations is defined as a typical QBWO event of precipitation. We conduct EOF techniques to obtain the basic modes of 10- to 30-day oscillation of the North Atlantic 500 hPa geopotential height. The first principal component (PC) of the EOF analysis of 10- to 30-day filtered 500hPa geopotential height in the North Atlantic Ocean is greater than 1.5 standard deviations, which is defined as a typical QBWO event of geopotential height. Based on the typical QBWO events obtained before, the synthesis analysis and Student’s test are carried out.
First, the characteristics of East Asian summer monsoon precipitation were analyzed by using the gauge-based observation (Figure 1A). The summer precipitation in China shows the distribution characteristics of more in the south and less in the north. In southern China, the precipitation intensity is more than 7 mm/d and more than 9 mm/d over some areas in summer. The spatial distribution of the mean square deviation presents similar characteristics to the total precipitation (Figure 1B). In southern China (the black box in Figure 1B, 24–32°N, 108–122°E), the mean square deviation of precipitation exceeds 13 mm/d and even the central maximum value reaches 17 mm/d, far exceeding the other regions in China. In addition, the mean square deviation of the precipitation is much higher than that of the mean precipitation.
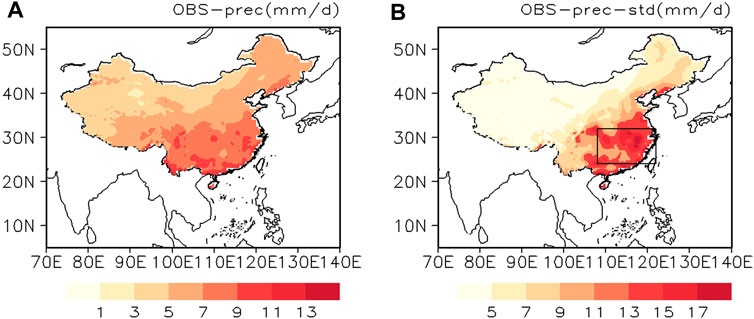
FIGURE 1. Observed summer mean precipitation (A) and the mean square deviation (B) in China from 1979 to 2012, unit: mm/d. The black box in (B) represents southern China (24–32°N, 108–122°E).
In order to verify the characteristics of the dominant period of summer precipitation, we carried out the power spectrum analysis over southern China (Figure 2A). As shown in Figure 2, precipitation in boreal summer has significant periodic oscillation characteristics of 10–30 days on a subseasonal scale, which has passed the 0.05 significance test. The mean square deviation of the 10- to 30-day precipitation and the fractional variance are shown in Figure 2B. It is found that the quasi-biweekly mean square deviation of precipitation in the middle and lower reaches of the Yangtze River and its south is about 5–7 mm/d, and the fractional variance results show that the 10- to 30-day oscillation precipitation can explain more than 40% of the total variance. All the previous analysis indicates that summer precipitation in the middle and lower reaches of the Yangtze River and south of it has a very significant 10- to 30-day oscillation.
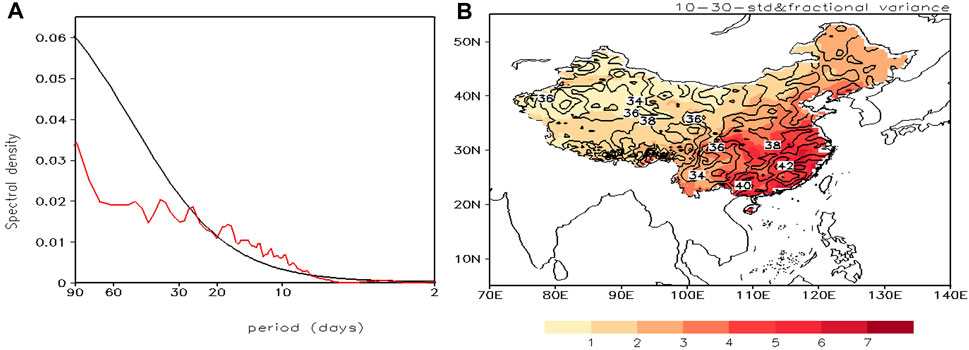
FIGURE 2. Power spectrum diagram of summer rainfall (A) in southern China (24–32°N, 108–122°E) from 1979 to 2012; the mean square deviation [(B), shaded, unit: mm/d] and the fractional variance [(B), contoured, unit: %] of 10–30-day filtered precipitation. In (A), the red line is the power spectral density, and the black line indicates the values of 95% confidence level.
From the previous analysis, it can be concluded that southern China (24–32°N, 108–122°E) is the key center of the 10- to 30-day oscillation of summer precipitation on the East Asian continent. Using the observation data and definition criteria for precipitation oscillation events described in Data and Method, a total of 75 typical precipitation QBWO events (listed in Table 1) occurred in southern China from 1979 to 2012, nearly 2 cases per year. We conducted the composite analysis of 75 selected typical events, and the results are shown in Figure 3. The peak day of quasi-biweekly precipitation is defined as day 0, day -1 represents 1 day before the peak day, day 1 represents 1 day after the peak day, and so on. In a typical event, the synthetic analysis results show that the regional average precipitation intensity can reach 4 mm/d or more, and quasi-biweekly precipitation occurs 3 days before the peak and lasts for about 6 days. From the interruption phase to the active phase and then to the interruption one, the entire cycle takes about 15 days, showing typical QBWO characteristics.
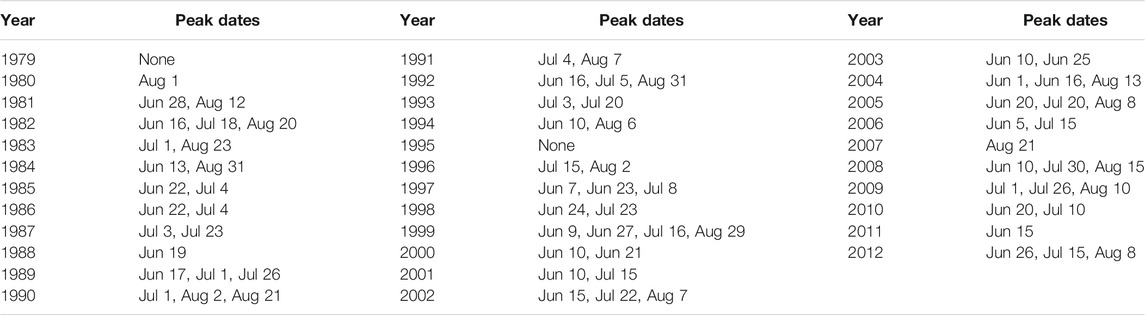
TABLE 1. Date of the quasi-biweekly peak rainfall in southern China.
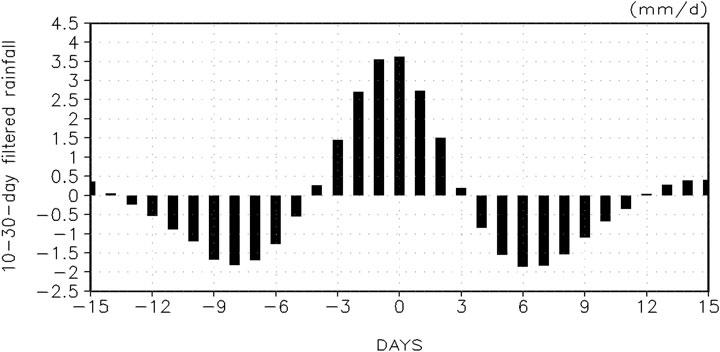
FIGURE 3. Composite evolution of the 10- to 30-day filtered precipitation in southern China (24–32°N, 108–122°E) during the rainfall QBWO events from day -15 to day 15, unit: mm/d.
Figure 4 shows the spatial distribution and temporal evolution of quasi-biweekly precipitation in different phases from day -7 to day 7. On day -7 (Figure 4A), southern China is in the dry phase. From day -7 to day -5 (Figures 4A,B), the dry phase of precipitation in southern China slowly weakened. Southern China turned to the wet phase at day -3 (Figure 4C), after which the precipitation intensity kept increasing and reached a peak of about 8 mm/d from day -1 to day 1 (Figures 4D,E). Subsequently, the precipitation in Southern China began to decrease at day 3 (Figure 4F), and finally the entire region was converted to the dry phase again (Figures 4G,H) from day 5 to day 7.
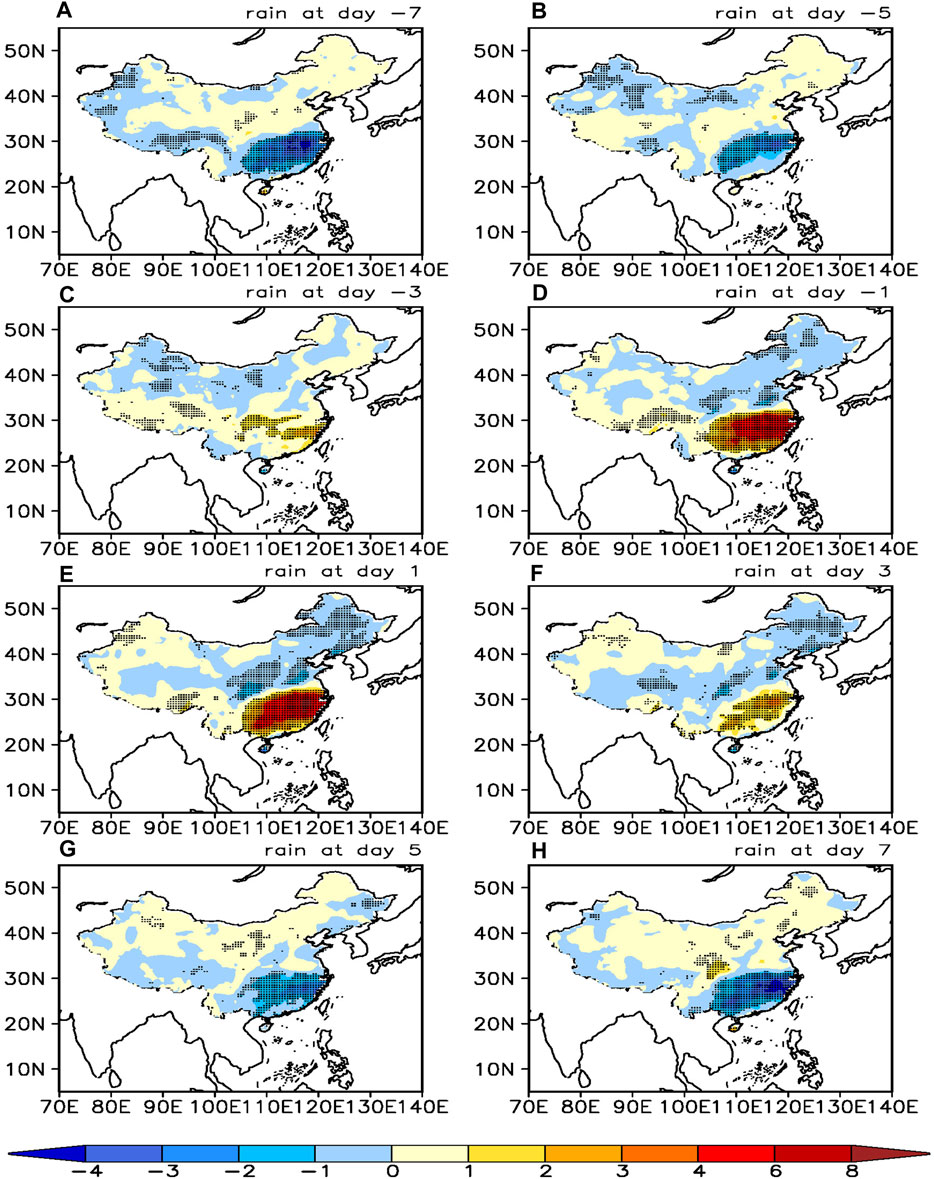
FIGURE 4. Composite distribution of 10- to 30-day filtered precipitation during the rainfall QBWO events (unit: mm/d); the dotted area indicates that it has passed the 95% confidence test. (A–H) represent day -7 to day 7, with 2-day interval.
The circulation corresponding to the quasi-biweekly precipitation evolution is further analyzed (Figure 5). The ridge of subtropical high over the northwest Pacific Ocean at 500 hPa level is located at 20–22°N. The midlatitudes are controlled by zonal westerly airstream, and there is no significant variability in the large-scale background circulation during the quasi-biweekly precipitation evolution. In the 10- to 30-day scale, the results show that during the dry phase of quasi-biweekly precipitation in southern China, 500 hPa over the key area is controlled by abnormal quasi-biweekly anticyclone, and 850 hPa wind field also shows obvious anticyclonic circulation (Figures 5A,B,G,H). In the wet phase of precipitation (from day -3 to day 3), easterly and westerly winds prevail in the areas north and south of the Yangtze River Basin, respectively, under the control of abnormal cyclone at 500 hPa height (Figures 5C–F). Both easterly wind and southwesterly wind transport water vapor from the ocean to precipitation areas. Meanwhile, the abnormal anticyclone located near Lake Baikal brings cold air to the south, and the intersection of cold and warm air flow causes heavy precipitation. The response of 850hPa wind field reaches the strongest from day -1 to day 1 (Figures 5D,E). During the intermittent and active periods of quasi-biweekly precipitation in southern China, the characteristics of the 500 hPa geopotential height field are mainly manifested in the anti-phase distribution over southern China and its north and south sides at different latitudes. It should be noted that the quasi-biweekly geopotential anomalies at 500 hPa, 700 hPa, and 850 hPa have almost the same distribution characteristics (figure omitted). Meanwhile, weather systems that affect precipitation, such as subtropical high, blocking high, trough, and ridge, are usually analyzed at 500 hPa, so this article focuses on the geopotential height anomaly at 500 hPa.
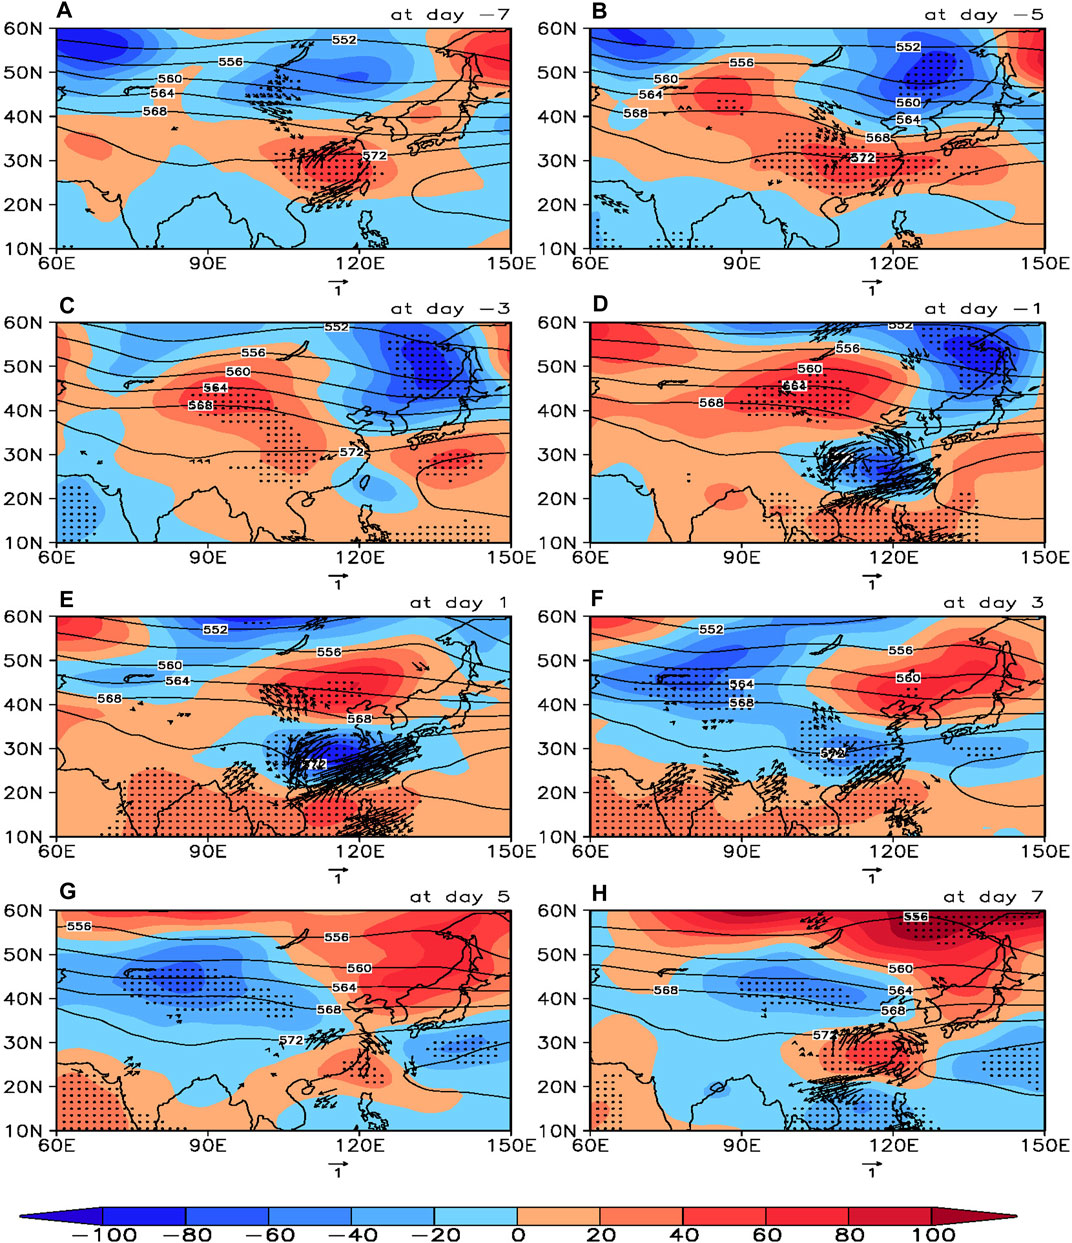
FIGURE 5. Composite distribution of geopotential height (contoured, unit: dagpm), 10- to 30-day filtered geopotential height (color shaded, unit: gpm) at 500 hPa and the 10- to 30-day filtered wind at 850 hPa (vector, unit: m/s; only locally statistically significant (>95%) vectors are shown) during the rainfall QBWO events, the dotted area indicates that it has passed the 95% confidence test. (A–H) represent day -7 to day 7, with 2-day interval.
The aforementioned research analyzes the variation of circulation during QBWO of precipitation. In order to figure out the precursory signal of the precipitation oscillation process, it is necessary to further analyze the circulation characteristics before the precipitation of QBWO events. Figure 6 shows the evolution of the quasi-biweekly geopotential height in the northern hemisphere from 30 days before the peak of quasi-biweekly precipitation in southern China to the peak day. From day -30 to day -10 (Figures 6A–E), there are obvious quasi-biweekly geopotential height abnormalities in the North Atlantic. At day -30 (Figure 6A), there is a significant positive geopotential height anomaly in the North Atlantic Ocean south of Greenland, negative anomalies on the east and west sides, and obvious wave trains in the mid-high latitudes. The distributions of geopotential height tendency show that the wave train has the characteristics of eastward shifting. The east side of the center of the positive geopotential height anomaly usually shows positive tendency
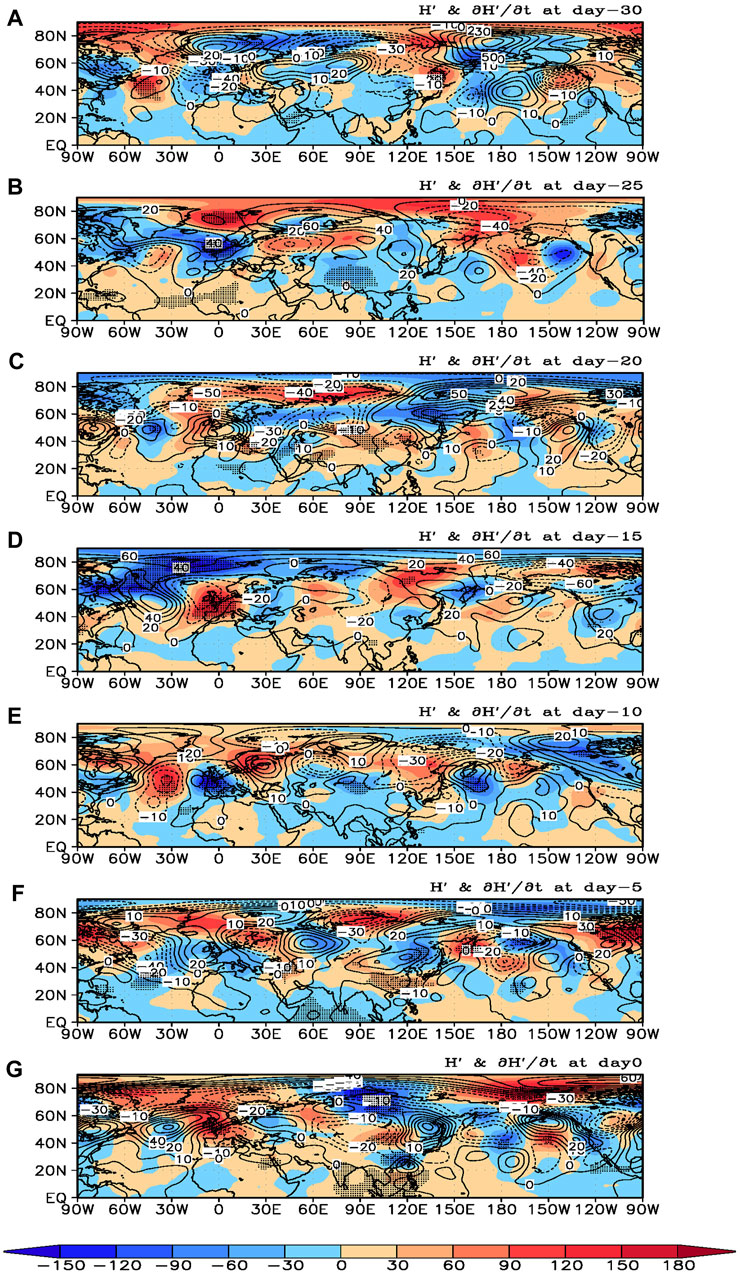
FIGURE 6. Composite quasi-biweekly geopotential height (shaded, unit: gpm) and its tendency distribution at 500hPa (contoured, unit: gpm/d) in the northern hemisphere from day -30 to day 0, the dotted area indicates that it has passed the 95% confidence test. (A–G) represent day -30 to day 0, with 5-day interval.
To reveal the propagation characteristics of the geopotential height anomaly, the time–longitude profile of the average quasi-biweekly geopotential height between 40°N and 60°N is further analyzed (Figure 7). At day −30, an anomalous positive center is located near about 50°W, that is, over the North Atlantic south of Greenland, with negative anomalies on the left and right sides. Both the positive and negative anomaly centers move eastward day by day. At day 0, the positive anomaly center propagates to 60°E near the Ural Mountains, and the zonal propagation velocity is about 3–3.5° longitude per day. About 10 days before the peak day of quasi-biweekly precipitation, the signal of the geopotential anomaly center began to weaken, and after the peak day, there was no obvious propagation characteristic. Combined with the evolution of the quasi-biweekly geopotential height in the northern hemisphere (Figure 6) and the 850 hPa wind field (Figure 5), the Ural Mountains are controlled by abnormal anticyclone during the active period of quasi-biweekly precipitation. To the east of the Ural Mountains, the geopotential height anomaly distribution characteristics of “−” “+” “−” “+” are formed from high to low latitude. The north of Lake Baikal is controlled by an abnormal low pressure system, indicating that the polar vortex is moving southward, while the abnormal anticyclone near Lake Baikal guides the cold air from the high latitude to southern China. At the same time, southwest and southeast winds transport the warm and humid air from the South China Sea and the Western Pacific to southern China, where the cold and warm air meet and form precipitation.
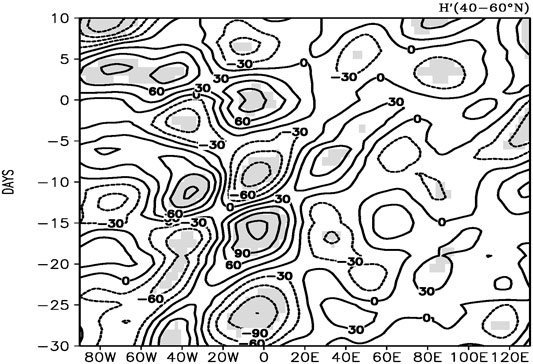
FIGURE 7. Composite temporal-longitude profile of quasi-biweekly geopotential height averaged from 40°N to 60°N at 500 hPa from day -30 to day 0 (unit: gpm), the shadowed area indicates that it has passed the 95% confidence test.
Furthermore, the midlatitude North Atlantic geopotential height is selected for EOF analysis for its main modes. The first mode (EOF1, Figure 8A) is mainly characterized by anomalous geopotential height of the North Atlantic Ocean south of Greenland and its opposite phases on its east and west sides, and the variance contribution of EOF1 is 16.4%. The distribution of EOF1 is similar to the quasi-biweekly circulation pattern at 500 hPa over the North Atlantic 20 days before the peak day of precipitation QBWO events (Figure 6C), and it is opposite to the pattern over the previous 30 days (Figure 6A). Will the abnormal geopotential height in the previous period lead to the response of precipitation in southern China? To answer this question, we first selected typical events of abnormal geopotential height at 500 hPa over the North Atlantic according to the method described in the Data and Method and found that a total of 63 typical QBWO events of geopotential height occurred in the North Atlantic region. A composite analysis of these events found that the wet phase of quasi-biweekly precipitation in southern China appeared at a lag of about 20 days (Figure 8B), while the quasi-biweekly dry phase appeared at a lag of about 30 days (Figure 8C). This is consistent with the previous conclusions and further confirms that the quasi-biweekly geopotential height anomaly over the North Atlantic Ocean can be used as the precursory signal of the quasi-biweekly precipitation in southern China.
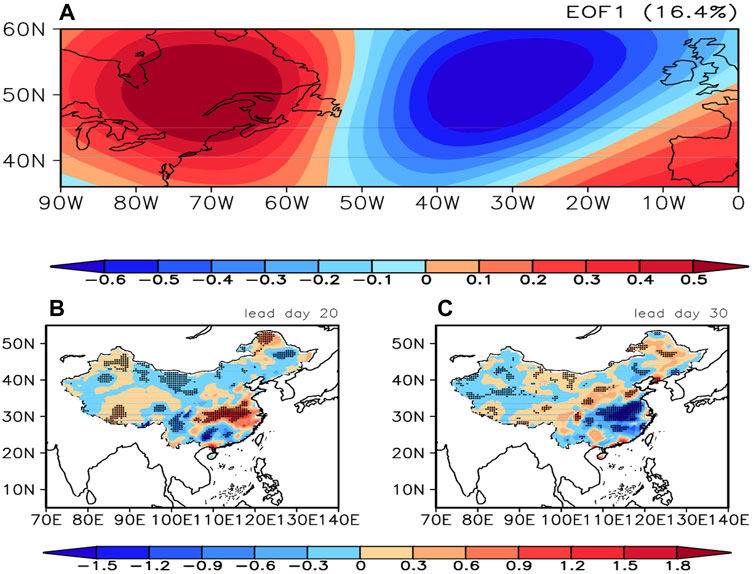
FIGURE 8. First mode [EOF1, (A)] of the EOF analysis of 10–30-day filtered geopotential height at 500hPa over the North Atlantic Ocean and the composition of quasi-biweekly precipitation (unit: mm/d) based on the geopotential height QBWO events with 20-day lag (B) and 30-day lag (C).
This article reveals the basic characteristics of the 10- to 30-day oscillation of summer precipitation in southern China and points out that the 500 hPa quasi-biweekly geopotential height anomaly over the North Atlantic Ocean can be used as the precursory signal of the quasi-biweekly precipitation process. This meaningful conclusion can provide an important theoretical basis for the extended forecast of precipitation process in southern China. Regarding the influence of the North Atlantic Ocean on the weather and climate characteristics of East Asia, previous studies have mostly analyzed its influence on the interannual and interdecadal scales from the perspective of atmospheric teleconnection (Sung et al., 2006; Wu et al., 2012; Feng and Sun, 2013; Liu et al., 2015; Zhou et al., 2020). This article focuses on the process of North Atlantic geopotential height anomaly affecting quasi-biweekly precipitation in China at the intraseasonal scale, which is a significant difference from other studies.
Persistent disaster weather events are closely related to the quasi-biweekly activity of the atmosphere, and the summer precipitation in the Asian monsoon region has significant ISO characteristics. Based on observation data, it is found that southern China is a key area of precipitation QBWO in the monsoon region. There is no significant change in the large-scale circulation background with the quasi-biweekly evolution of precipitation. However, on the quasi-biweekly scale, there are obvious anomalies of the geopotential height, which shows the characteristics of eastward propagation in the midlatitude and the northward propagation in the low latitude. During the active period of the precipitation QBWO events, the quasi-biweekly cyclone controls southern China. The southwesterly wind and southeasterly wind carry water vapor from the South China Sea and northwest Pacific to southern China, respectively, which is conducive to the generation of precipitation.
By analyzing the precursory of the precipitation QBWO events, it is found that 500 hPa geopotential heights over the North Atlantic south of Greenland is obviously the positive anomaly, and it is the negative anomaly on both east and west sides 30 days before the peak day of precipitation. The wave train propagates eastward slowly. When the quasi-biweekly rainfall occurs in southern China, the geopotential height from the North Atlantic moves to the vicinity of the Ural Mountains. The negative quasi-biweekly geopotential height anomaly occurs in the high latitude area of the Asian continent ahead of the wave train, and the positive geopotential height anomaly occurs in Lake Baikal. This circulation situation leads the high latitude cold air southward and joins with the south warm and humid air flow to form persistent precipitation.
Publicly available datasets were analyzed in this study. These data can be found here: 1. ERA-Interim reanalysis data: https://www.ecmwf.int/en/forecasts/datasets/reanalysis-datasets/era-interim 2. gauge-observed precipitation in China: http://data.cma.cn/.
QH and SY conceived the idea, conducted the data analysis and prepared the figures. QH, XY, and SY discussed the results and wrote the manuscript.
This research was funded by the National Key R&D Program of China (Grant no. 2018YFC1505802) and the National Natural Science Foundation of China (Grant nos. 41930969, 41775096, and 42030612).
The authors declare that the research was conducted in the absence of any commercial or financial relationships that could be construed as a potential conflict of interest.
All claims expressed in this article are solely those of the authors and do not necessarily represent those of their affiliated organizations, or those of the publisher, the editors, and the reviewers. Any product that may be evaluated in this article, or claim that may be made by its manufacturer, is not guaranteed or endorsed by the publisher.
The authors acknowledge European Centre for Medium-Range Weather Forecasts (ECMWF) and China Meteorological Administration (CMA) to provide the data in the article.
Amador, L. D. R., and Lovejoy, S. (2021). Using Regional Scaling for Temperature Forecasts with the Stochastic Seasonal to Interannual Prediction System (StocSIPS). Clim. Dyn. doi:10.21203/rs.3.rs-326161/v1
Buhe, C. L., Shi, N., Ji, L. R., Wei, J., and Tao, S. (2008). Features of the EAP Events on the Medium-Range Evolution Process and the Mid- and High-Latitude Rossby Wave Activities during the Meiyu Period. Chin. SCI. Bull. 53, 610–623.
Chen, J, P., Wen, Z. P., Wu, R. G., Chen, Z. S., and Zhao, P. (2015). Influences of Northward Propagating 25–90-day and Quasi-Biweekly Oscillations on Eastern China Summer Rainfall. Clim. Dyn. 45, 104–124. doi:10.1007/s00382-014-2334-y
Dee, D. P., Uppala, S. M., Simmons, A. J., Berrisford, P., Poli, P., Kobayashi, S., et al. (2011). The ERA-Interim Reanalysis: Configuration and Performance of the Data Assimilation System. Q.J.R. Meteorol. Soc. 137, 553–597. doi:10.1002/qj.828
Feng, J., and Sun, C. (2013). Impact of Preceding Summer North Atlantic Oscillation on Early Autumn Precipitation over central China. Atmos. Oceanic Sci. Lett. 6, 417–422. doi:10.1080/16742834.2013.11447118
Hong, J., Ke, Z., Yuan, Y., and Shao, X. (2021). Boreal Summer Intraseasonal Oscillation and its Possible Impact on Precipitation over Southern China in 2019. J. Meteorol. Res. 35 (4), 571–582. doi:10.1007/s13351-021-0189-9
Hsu, H. H., and Weng, C. H. (2000). Northwestward Propagation of the Intraseasonal Oscillation in the Western North Pacific during the Boreal Summer: Structure and Mechanism. J. Clim. 14 (18), 3834–3850. doi:10.1175/1520-0442(2001)014<3834:npotio>2.0.co;2
Hsu, P. C., Lee, J. Y., and Ha, K. J. (2016). Influence of Boreal Summer Intraseasonal Oscillation on Rainfall Extremes in Southern China. Int. J. Climatol. 36 (4), 1403–1412. doi:10.1002/joc.4433
Huang, Z., Li, S. L., and Zhang, C. (2020). A Comparison of Intraseasonal Rainfall Features over the Middle and Lower Reaches of Yangtze River during Summers of 1991,1998 and 2016. Atmos. Oceanic Sci. Lett. 36, 13–24. (in Chinese).
Ju, J. H., Qian, C., and Cao, J. (2005). The Intraseasonal Oscillation of East Asian Summer Monsoon. Chin. J. Atmos. Sci. 29 (2), 187–194. (in Chinese).
Jung, T., and Vitart, F. (2006). Short-Range and Medium-Range Weather Forecasting in the Extratropics during Wintertime with and without an Interactive Ocean. Mon. Wea. Rev. 134 (7), 1972–1986. doi:10.1175/mwr3206.1
Li, J. Y., and Mao, J. Y. (2019). Impact of the Boreal Summer 30-60-day Intraseasonal Oscillation over the Asian Summer Monsoon Region on Persistent Extreme Rainfall over Eastern China. Chin. J. Atmos. Sci. 4, 796–812. (in Chinese).
Liu, F., Ouyang, Y., Wang, B., Yang, J., Ling, J., and Hsu, P.-C. (2020). Seasonal Evolution of the Intraseasonal Variability of China Summer Precipitation. Clim. Dyn. 54, 4641–4655. doi:10.1007/s00382-020-05251-0
Liu, H.-B. (2018). Dominant Variation Modes Associated with Yangtze-Huai River Basin Summer Heavy Rainfall Events. Atmos. Oceanic Sci. Lett. 11, 464–471. doi:10.1080/16742834.2018.1526620
Liu, H., Duan, K., Li, M., Shi, P., Yang, J., Zhang, X., et al. (2015). Impact of the North Atlantic Oscillation on the Dipole Oscillation of Summer Precipitation over the central and Eastern Tibetan Plateau. Int. J. Climatol. 35, 4539–4546. doi:10.1002/joc.4304
Lu, R., Ding, H., Ryu, C.-S., Lin, Z., and Dong, H. (2007). Midlatitude Westward Propagating Disturbances Preceding Intraseasonal Oscillations of Convection over the Subtropical Western North Pacific during Summer. Geophys. Res. Lett. 34, L21702. doi:10.1029/2007gl031277
Mao, J., Sun, Z., and Wu, G. (2010). 20-50-day Oscillation of Summer Yangtze Rainfall in Response to Intraseasonal Variations in the Subtropical High over the Western North Pacific and South China Sea. Clim. Dyn. 34, 747–761. doi:10.1007/s00382-009-0628-2
Ren, X. J., Fang, J. B., and Yang, X. Q. (2020). Characteristics of Intra-seasonal Oscillation of Summer Precipitation in Eastern China and its Related Low Frequency Atmospheric Circulation. J. Meteorol. Sci. 40 (5), 686–696. (in Chinese).
Ren, X., Yang, D., and Yang, X.-Q. (2015). Characteristics and Mechanisms of the Subseasonal Eastward Extension of the South Asian High. J. Clim. 28, 6799–6822. doi:10.1175/jcli-d-14-00682.1
Robertson, A. W., Camargo, S. J., Sobel, A., Vitart, F., and Wang, S. (2018). Summary of Workshop on Sub-seasonal to Seasonal Predictability of Extreme Weather and Climate. Npj Clim. Atmos. Sci. 1. doi:10.1038/s41612-017-0009-1
Robertson, A. W., Kumar, A., Pena, M., and Vitart, F. (2015). Improving and Promoting Subseasonal to Seasonal Prediction. Bull. Am. Meteorol. Soc. Es49–es53 96 (3), ES49–ES53. doi:10.1175/bams-d-14-00139.1
Shen, Y. Y., Ren, H. L., Li, W. J., Zhang, Y. J., and Zuo, J. Q. (2016). Relationship between Summer Low-Frequency Rainfall over Southern China and Propagation of Tropical Intraseasonal Oscillation. J. Trop. Meteorol. 32 (1), 31–41. doi:10.1029/2007gl031962
Sun, X. G., Jiang, G. X., Ren, X. J., and Yang, X. Q. (2016). Role of Intraseasonal Oscillation in the Persistent Extreme Precipitation over the Yangtze River Basin during June 1998. J. Geophys. Res. Atmos. 121, 10453–10469. doi:10.1002/2016jd025077
Sung, M.-K., Kwon, W.-T., Baek, H.-J., Boo, K.-O., Lim, G.-H., and Kug, J.-S. (2006). A Possible Impact of the North Atlantic Oscillation on the East Asian Summer Monsoon Precipitation. Geophys. Res. Lett. 33, L21713. doi:10.1029/2006gl027253
Vitart, F., Robertson, A. W., and Anderson, D. (2012). Subseasonal to Seasonal Prediction Project: Bridging the gap between Weather and Climate. WMO Bull. 61, 23–28.
Wei, X. W., Liang, P., He, J. H., and Mu, H. Z. (2015). The Relationship between Large-Scale Persistent Heavy Rainfall Processes and 30-60 Day Low-Frequency Rainfall and its Forecasting Index. J. Trop. Meteorol. 31, 63–70. (in Chinese).
Wu, Z., Li, J., Jiang, Z., He, J., and Zhu, X. (2011). Possible Effects of the North Atlantic Oscillation on the Strengthening Relationship between the East Asian Summer Monsoon and ENSO. Int. J. Climatol. 32, 794–800. doi:10.1002/joc.2309
Xia, Y., Huang, Q., Yao, S., and Sun, T. (2021). Multiscale Causes of Persistent Heavy Rainfall in the Meiyu Period over the Middle and Lower Reaches of the Yangtze River. Front. Earth Sci. 9. doi:10.3389/feart.2021.700878
Yang, B., Wang, Y., and Nan, S. (2021). Joint Influence of Anomalous Medium‐ and Small‐scale Circulations on Short‐term Heavy Rainfall Events over Beijing. Int. J. Climatol. 41, 1002–1023. doi:10.1002/joc.6720
Yang, J., Wang, B., Wang, B., and Bao, Q. (2010). Biweekly and 21-30-Day Variations of the Subtropical Summer Monsoon Rainfall over the Lower Reach of the Yangtze River Basin. J. Clim. 23, 1146–1159. doi:10.1175/2009jcli3005.1
Yin, Z. C., Wang, Y. F., and Yuan, D. M. (2011). Analysis of the Interannual Variability of the Meiyu Quasi-Biweekly Oscillation and its Previous strong Influence Signal. Trans. Atmos. Sci. 34, 297–304. (in Chinese).
Zhou, N. F., Li, Y., and Jia, X. L. (2021). Relationship between Heavy Precipitation and Atmospheric Wave with Different Time Scales during Meiyu Period in Yangtze-Huai River Region. J. Trop. Meteorol. 37, 14–24. (in Chinese).
Zhou, X., Lang, X., and Jiang, D. (2020). Teleconnections between the Atlantic Multidecadal Oscillation and Eastern China Summer Precipitation during the Medieval Climate Anomaly and Little Ice Age. The Holocene 30 (8), 1694–1705. doi:10.1177/0959683620950413
Keywords: summer precipitation, quasi-biweekly oscillation, geopotential anomaly, Atlantic, precursory signal
Citation: Huang Q, Yin X and Yao S (2021) The Quasi-Biweekly Oscillation of Summer Rainfall in Southern China and Its Relationship With the Geopotential Height Anomaly Over the North Atlantic Ocean. Front. Earth Sci. 9:770253. doi: 10.3389/feart.2021.770253
Received: 03 September 2021; Accepted: 22 October 2021;
Published: 16 November 2021.
Edited by:
Anning Huang, Nanjing University, ChinaReviewed by:
Jing Yang, Beijing Normal University, ChinaCopyright © 2021 Huang, Yin and Yao. This is an open-access article distributed under the terms of the Creative Commons Attribution License (CC BY). The use, distribution or reproduction in other forums is permitted, provided the original author(s) and the copyright owner(s) are credited and that the original publication in this journal is cited, in accordance with accepted academic practice. No use, distribution or reproduction is permitted which does not comply with these terms.
*Correspondence: Suxiang Yao, eWFvc3hAbnVpc3QuZWR1LmNu
Disclaimer: All claims expressed in this article are solely those of the authors and do not necessarily represent those of their affiliated organizations, or those of the publisher, the editors and the reviewers. Any product that may be evaluated in this article or claim that may be made by its manufacturer is not guaranteed or endorsed by the publisher.
Research integrity at Frontiers
Learn more about the work of our research integrity team to safeguard the quality of each article we publish.