 Dajian Li1†
 Jiayu Ruan
95% of researchers rate our articles as excellent or good
Learn more about the work of our research integrity team to safeguard the quality of each article we publish.
Find out more
BRIEF RESEARCH REPORT article
Front. Earth Sci. , 29 November 2021
Sec. Economic Geology
Volume 9 - 2021 | https://doi.org/10.3389/feart.2021.767738
This article is part of the Research Topic Advances in Multi-scale Multi-physics Geophysical Modelling and Fluid Transport in Unconventional Oil and Gas Reservoir View all 15 articles
Due to the extensive development of fractures and serious heterogeneity in fractured reservoirs, it is difficult for the traditional numerical simulation method to invert its geology, which greatly limits the efficiency and accuracy of simulation and cannot realize the real-time optimization of production scheme. The connectivity model can only consider the two characteristic parameters of conductivity and connectivity volume, which does not involve complex and rigorous geological modeling. It can quickly and accurately reflect the state of the real reservoir, greatly reducing the simulation time, and is suitable for real-time production performance prediction of the reservoir. Due to the large difference in conductivity of fractured reservoirs, the difficulty of fitting increases. In this paper, the connectivity model is first applied to fractured reservoirs to realize the production dynamic simulation of fractured reservoirs. The optimization principle is used to optimize the injection-production scheme with the economic net present value as the objective function. In order to verify the method, the connectivity model is applied to Mu 30 of Changqing Oilfield in this paper. The results show that this method can effectively reflect the real production situation of the oilfield and the connectivity of the reservoir, and the simulation time is relatively fast. After optimization, the cumulative oil production of the reservoir increases by 8.1%, the cumulative water injection decreases by 2.3%, and the rising rate of water cut decreases by 58.8%, indicating that the connectivity model can realize the real-time production optimization of the reservoir.
With the progress of global, low permeability reservoir exploration and fracturing technology, the development of fractured reservoirs has become more and more common. The BP2030 World Energy Outlook report shows the world’s tight oil reservoir development prospects. The tight oil resources in North America are about 100 × 108 t, and those in Asia-Pacific region are about 90 × 108 t. Almost half of the current increase in global oil production is expected to come from tight oil reservoirs by 2030, which will meet 5–9% of global demand (Li, 2013). Most of the exploitation of tight oil needs fracturing, so it can be said that fractured reservoirs are the main theme of future reservoir exploitation.
A fractured reservoir is a reservoir where fractures have an important impact on fluid flow or effective permeability of porous media (Xu, 2017). It is a manifestation of reservoir permeability and porosity heterogeneity. Fractured reservoirs are more complex than ordinary sandstone reservoirs due to the extensive development of fractures and serious heterogeneity. Since the large-scale development of fractured reservoirs in 1970s, the development of most fractured reservoirs has been unsatisfactory. Even if fractured reservoirs are successfully economically exploited, the recovery factor is generally only 13–15%, which remains to be improved. One of the reasons for this situation is the lack of understanding of fracture identification, distribution law and fluid flow dynamics in fractures (Xu et al., 2021).
Fracture is the main channel of oil and gas seepage in fractured reservoirs, and its location distribution and characteristics are crucial to the productivity of oil and gas reservoirs (Sheng et al., 2019). Therefore, it is of great significance to accurately simulate the fracture seepage characteristics of oil and gas reservoirs. Interwell connectivity research is an important tool for reservoir description and dynamic analysis (Liu et al., 2003; Yang, 2004; Tang et al., 2008). Common connectivity methods, such as tracer, well test, and interwell micro seismic, are complex in implementation, long in interpretation cycle, and affect normal production. Therefore, the application range is limited, and it is difficult to meet the needs of rapid understanding of reservoirs (Liao et al., 2002; Yang et al., 2002; Du and Yang, 2007). The reservoir is a dynamic system. The fluctuation of liquid production caused by the change of injection volume is the characteristic reflection of the connection between oil and water wells, and the fluctuation range of liquid production is also related to the degree of connection (Zhao et al., 2010). Therefore, using injection-production data to study interwell connectivity becomes a very important method.
On the connectivity between wells, scholars have done much research, Yousef et al. (2006) based on the principle of hydropower similarity and material balance equation, introduced capacitance and reactance two parameters, established a data-driven model based on injection well production data--capacitance resistance model (CRM), using fitting and inversion algorithm, inversion of well connectivity. Subsequently, in order to consider the effects of well logging, shut-in, capillary force and other functions, and accelerate the calculation speed of the model, many scholars have improved the CRM (Kaviani et al., 2008; Sayarpour, 2008; Sayarpour et al., 2010; Nguyen et al., 2011; Salazar-Bustamante et al., 2012). Because CRM is difficult to consider the physical properties of reservoir and fluid in the process of seepage, the long-term prediction effect is poor. Therefore, Gherebati et al. (2016) simplified the reservoir into a series of connected networks of injection and production wells by using well location information and production data of injection and production wells. According to the principle of seepage mechanics and material balance equation, the connectivity conductivity between wells was calculated by inversion of production data of injection and production, and then a data-driven reservoir connected network model was formed. All kinds of data-driven models proposed by the above scholars have basically realized the prediction of production performance and the evaluation of interwell connectivity, but there are some shortcomings, such as the model is too ideal, the consideration factors are less, the inversion parameters are lack of clear geological significance, the oil-water two-phase data cannot be predicted and fitted, the water content cannot be predicted, and the volume of dominant channels cannot be obtained. In view of the shortcomings of the above methods, Hui et al. (2015) first created a Physics-Based Data-Driven Model with clear physical meaning, which was named INSIM (Interwell Numerical Simulation Model). The data-driven model uses parameters such as interwell conductivity and connected volume to reflect the entire reservoir. The reservoir is simplified into a series of connected units. Taking the connected unit as the object, the material balance equation can be established and the pressure can be calculated. At the same time, the shock wave theory is introduced to track the saturation front, so as to obtain the dynamic data such as injection-production well pressure and production, and realize the rapid simulation and prediction of oil and water wells. This method is the first to achieve the goal of production prediction and optimization decision of water flooding reservoir using actual production data. The method uses historical fitting and optimization algorithm to solve the model, inverses the conductivity and connectivity volume between wells, and identifies connectivity. It quantitatively reveals the dominant connectivity direction, water injection splitting effect, water intrusion, etc. The interwell connectivity method only considers two characteristic parameters of conductivity and connectivity volume, which does not involve complex and rigorous geological modeling. It can quickly and accurately reflect the state of the real reservoir, greatly shortening the simulation time, and is suitable for real-time production performance prediction of the reservoir.
At present, the INSIM model has been widely used in reservoirs such as single medium, and it has not been applied to fractured reservoirs. In this paper, the INSIM model is first applied to fractured reservoirs to realize the production dynamic simulation of fractured reservoirs, and the injection-production scheme is optimized by using the optimization principle with the economic net present value as the objective function. In order to show that the method is suitable for fractured reservoirs, the method is applied to Mu 30 of Changqing Oilfield with prominent fracture development. The results show that the method can effectively reflect the real production and connectivity of the reservoir, and the simulation time is relatively rapid.
The development layer of Mu 30 is Chang 8. The geology of Chang 8 is dominated by sandy debris flow deposits, followed by semi-deep lake and deep lake mud microfacies. The sand body connectivity is good, and the sand body is plane distribution. The natural fractures in the reservior are prominent, mostly in the northeast-southwest direction. Sand body thickness is 13.4 m, average porosity is 10.10%, average permeability is 0.79 × 10⁻³ μm2, average surface crude oil viscosity is 5.59 mPa s, average reservoir thickness is 10.9 m, original formation pressure is 19.89 Mpa, formation pressure maintains 79.4%. Mu 30 has been put into production since January 2010. As of March 2021, the reservoir has been put into production for 4,108 days. At present, there are 143 wells (81 horizontal wells and 62 vertical wells) and 106 injection wells in Mu 30. The daily liquid production level of the reservoir is 537 t (440 t for horizontal wells), the daily oil production level is 263 t (217 t for horizontal wells), the comprehensive water cut is 51.0% (50.6% for horizontal wells), the recovery degree is 2.41%, the oil-bearing area is 74 km2, the geological reserves are 2,965 × 104 t, the recoverable reserves are 542.19 × 10⁴ t, and the calibration recovery rate is 18.3%. The development of five-spot well pattern and seven-spot well pattern is given priority. The well spacing is 600 × 150 m. There are 30 five-spot well pattern, 755 m horizontal section, 23 seven-spot well pattern, 850 m horizontal section, 16 seven-spot to five-spot, 802 m horizontal section, 12 irregular well pattern and 1166 m horizontal section. Fractures in Mu30 are prominent. At present, there is no scientific injection-production scheme to guide mining, resulting in a rapid increase in water content and low recovery in this reservoir. Although the traditional numerical simulation can carry out geological inversion and simulation, and then get a more suitable injection and production scheme, the production cycle of Mu 30 is too long, the traditional numerical simulation fitting is difficult, the efficiency is too low, and it cannot be quickly and accurately optimized in real time.
The interwell connectivity model takes well points as the basic unit, and simplifies the complex geological description between well points into two important characteristic parameters: the interwell conductivity Tij and the connected volume Vpi, The interwell connectivity model takes well points as the basic unit, and simplifies the complex geological description between well points into two important characteristic parameters: the interwell conductivity Tij and the connected volume Vpi. The former represents the seepage velocity under unit pressure difference, which can better reflect the average seepage capacity and dominant conduction direction between wells. The latter represents the material basis of the connected unit, which can reflect the control range and volume of water flooding between wells.
Setting i well as production well and j well as injection well, taking injection-production unit composed of i well and j well as reference, considering only oil-water two-phase flow and ignoring the influence of temperature, regardless of gravity and viscosity, the material balance equation is established as follows (Zhao et al., 2016):
Where i, j represents well number; Nw is the total number of wells; Tij represents the average conductivity of wells i and j, m3/(d⋅MPa); n is time step; pin and pjn represent the average reservoir pressure at time n in well i and well j, respectively, MPa; qin is the flow rate of the well i at the time n, water injection is positive, oil production is negative, m3/d; Ct is the reservoir comprehensive compression coefficient, MPa−1; Δt is time interval, d; Vpi is the connected volume of the drainage area of the well i, m3.
The pressure of the above equation is solved to obtain the bottom hole flow pressure of each node. On this basis, the saturation is tracked, and the saturation equation is obtained as follows:
For multiple perforation points of the horizontal well, the pressure loss in the horizontal section is ignored in flow simulation, and the horizontal well is represent as multiple connected virtual well points. Taking into the original material balance equation can be solved to obtain oil production rate, water content and other related production index function.
When establishing the model, the initial value of conductivity and connectivity volume is assigned based on the physical properties of each well point in the reservoir, so that the initial connectivity model is consistent with the reservoir. Since there are too many perforation points in horizontal wells in the reservoir, in order to facilitate the analysis and judgment of the established connectivity model, the perforation points of each horizontal well are simplified into four. After simplification, the number of summary points in the reservoir is 492. In order to accurately reflect the actual situation of the reservoir, it is necessary to conduct historical fitting. The oil production of a single well and reservoir is used as the fitting index, and the conductivity and connected volume of the connectivity model are automatically, historically fitted. The reservoir fitting results are shown in Figure 1, and the inversion results of characteristic parameters are shown in Figure 2.
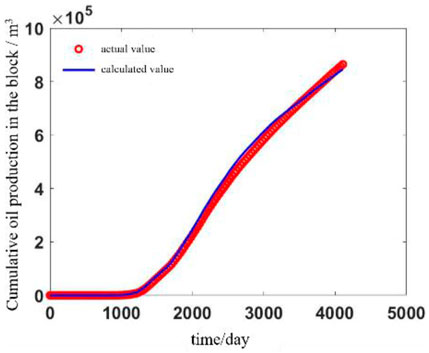
FIGURE 1. Fitting results.
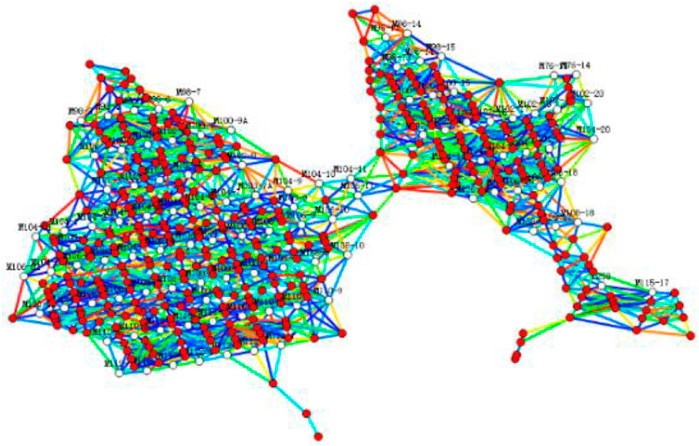
FIGURE 2. Inversion of connected parameter.
The fitting results show that the overall fitting rate reaches more than 80%, and the oil-water dynamic fitting results of the reservoir and single well are relatively accurate, which can better reflect the real geological conditions of the reservoir. It is worth noting that the automatic historical fitting stage of the model takes about 48 hours, which is greatly shortened compared with the traditional numerical simulation software ECLIPSE fitting 7–14 days. It can be seen that the model has good application effect for actual reservoirs and can provide help for real-time production optimization strategy formulation.
Based on the fitted reservoir model, the production optimization control model is established considering various constraints, so as to realize the dynamic optimization of injection-production measures. The production optimization of reservoirs usually uses the economic net present value NPV as the optimization objective function to establish a mathematical model. The three-dimensional three-phase reservoir simulator is used to describe the reservoir development and production system, and the economic net present value (NPV) during the production period is used as the performance index function to evaluate the economic benefits. The expression is:
Where
In actual production, it is necessary to implement certain restrictions on the operation of wells, that is, the control variables need to meet certain constraints. The constraint conditions are mainly linear or nonlinear, including equality, inequality and boundary constraints. Equation constraints such as reservoir overall liquid production or injection volume is a certain value. Inequality constraints usually require liquid production and injection volume of the reservoir to be limited by the working capacity of oilfield equipment.
The constraint conditions can be expressed as follows:
Where
After the optimization model is established, it is necessary to solve the model. Since the model has many dimensions and constraints, and the optimization gradient is difficult to calculate, the gradient-free random disturbance algorithm is selected for solving.
The gradient-free stochastic perturbation algorithm, also known as SPSA (Simultaneous Perturbation Stochastic Approximation), is a perturbation method similar to the finite difference method, which was first proposed by Spall et al., in 1992. The characteristic of SPSA algorithm is that random variables are used to disturb all control variables at the same time in an iterative step, so that the computational cost of gradient solution is greatly reduced. The SPSA algorithm can quickly find the local optimal solution of the complex model, which is suitable for solving the problems that the model has, its many dimensions, many constraints and the when the optimization gradient is difficult to calculate.
As can be seen from the formula (3), if ro = 1, rw = 0, b = 0, rwi = 0, the objective function is changed from economic net present value to cumulative oil production. In this way, we can take the improvement of cumulative oil production as the optimization objective and the single well water injection rate as the optimization object. The final water injection and liquid production simulation for 1 year are used as the original scheme, and the automatic algorithm is used to optimize the scheme with 30 days as the time step. Finally, the production optimization scheme obtained. Table 1 shows the injection-production optimization scheme of MP 91 well group in Mu 30. In order to ensure the feasibility of field implementation, the optimization constraint conditions limit the upper and lower boundaries of oil well liquid production and water injection, so that the liquid production and water injection fluctuate by 20% in the current system. However, the current liquid production of the oil well is very small, so the liquid production of the oil well does not change much.
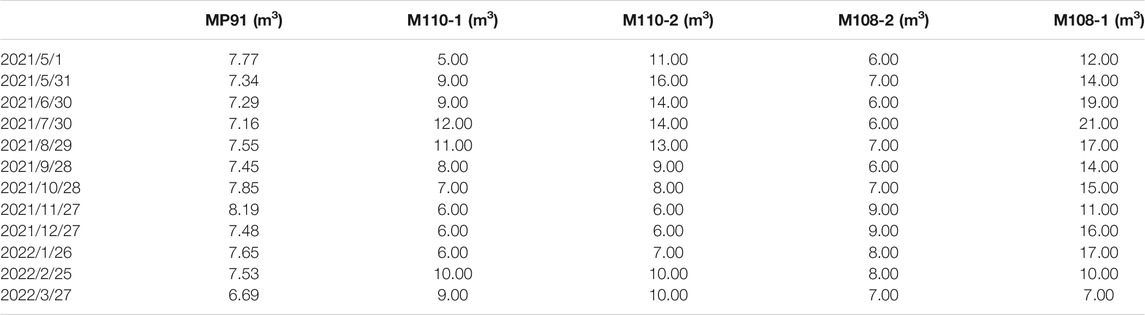
TABLE 1. Optimizing production measures.
The cumulative oil production in the following year increased by 8.5% from 59,800 to 64,900 m3. The cumulative water injection decreased by 3.3% from 4.181 to 4.043 million m3. It can be seen from Figure 3 that the water content in the historical stage of the reservoir has been increasing. The water content in the last year has increased by 0.46%. After 1 year of optimization, the water content began to decline, and the water content decreased by 0.13%. Compared with the previous year of optimization, the water content increased by 58.8%.

FIGURE 3. Optimization results.
1) The INSIM model is used to simulate and match the history of fractured reservoirs. The simulation results show that the model can effectively reflect the real production and connectivity of fractured reservoirs, and the simulation time is relatively fast, which can lay the foundation for real-time production optimization of reservoirs.
2) According to the optimization principle, the economic net present value NPV is used as the optimization objective function, and the upper and lower limits of single well production or water injection are used as the constraint conditions to establish the optimization mathematical model. The model is solved by the gradient-free stochastic disturbance automatic optimization algorithm. The results show that the cumulative oil production of the optimized reservoir increases by 8.1%, the cumulative water injection decreases by 2.3%, and the water cut increase rate decreases by 58.8%. The gradient-free intelligent optimization method based on interwell connectivity used in this paper can realize the real-time production optimization of fractured reservoirs.
The original contributions presented in the study are included in the article/Supplementary Material, further inquiries can be directed to the corresponding author.
DL: Conceptualization, Methodology, Data analysis, Project administration, ZZ: Conceptualization, Investigation, Visualization BW: Supervision, Data processing HY: Supervision, Investigation WC: Supervision, Investigation JR: Conceptualization, Methodology, Project implementation.
Authors DL, ZZ, BW, HY, and WC are employed by the company PetroChina.
The remaining authors declare that the research was conducted in the absence of any commercial or financial relationships that could be construed as a potential conflict of interest.
All claims expressed in this article are solely those of the authors and do not necessarily represent those of their affiliated organizations, or those of the publisher, the editors and the reviewers. Any product that may be evaluated in this article, or claim that may be made by its manufacturer, is not guaranteed or endorsed by the publisher.
Du, Juan., and Yang, S. M. (2007). Analysis to the Field Application Effect of Inner Well Micro Seismic Monitoring Technique [J]. petroleum geology. oilfield development daqing (04), 120–122. doi:10.3969/j.issn.1000-3754.2007.04.030
Gherabati, S. A., Hughes, R. G., Zhang, H., and White, C. D., (2016). A Large Scale Network Model to Obtain Interwell Formation Characteristics. Paper presented at the SPE Western Regional Meeting, Bakersfield, CA, March 2012. doi:10.2118/153386-MS
Hui, Z., Kang, Z., and Zhang, X. (2015). INSIM: A Data-Driven Model for History Matching and Prediction for Waterflooding Monitoring and Management with a Field Application: Spe Reservoir Simulation Symposium. Houston, TX. https://doi.org/SPE-173213-MS
Kaviani, D., Jensen, J. L., and Lake, L. W. (2008). Estimation of Interwell Connectivity in the Case of Fluctuating Bottomhole Pressures: Abu Dhabi International Petroleum Exhibition and Conference. Paper presented at the Abu Dhabi International Petroleum Exhibition and Conference, Abu Dhabi, United Arab Emirates, November, 2008. doi:10.2118/117856-MS
Li, X. Y. (2013). Unconventional Resources Will Affect Global Energy Pattern - - Interpretation of BP2030 World Energy Outlook [J]. Int. Petreleum Econ. 21 (04), 17–24. doi:10.3969/j.issn.1004-7298.2013.04.003
Liao, H., Wang, C., and Zuo, D. (2002). Applying Transient Testing to the Judgment of Inter-well Connectivity [J]. Pet. Exploration Dev. 29 (4), 87–89. doi:10.3321/j.issn:1000-0747.2002.04.027
Liu, Z., and Zeng, Z. (2003). Study on Connectivity of Low-Permeability Reservoirs with Pulse-Testing Method [J]. Acta Petrolei Sinica 24 (01), 73–77. doi:10.3321/j.issn:0253-2697.2003.01.014
Nguyen, A. P., Kim, J. S., and Lake, L. W. (2011). Integrated Capacitance Resistive Model for Reservoir Characterization in Primary and Secondary Recovery[J]. Denver, CO: Society of Petroleum Engineers.
Salazar-Bustamante, M., Gonzalez-Gomez, H., and Matringe, S. F. (2012). Combining Decline-Curve Analysis and Capacitance/Resistance Models to Understand and Predict the Behavior of a Mature Naturally Fractured Carbonate Reservoir under Gas Injection[J]. Paper presented at the SPE Latin America and Caribbean Petroleum Engineering Conference, Mexico, April, 2012. doi:10.2118/153252-MS
Sayarpour, M. (2008). Development and Application of Capacitance-Resistive Models to Water/carbon Dioxide floods[M]. Austin, TX: The University of Texas at Austin. http://hdl.handle.net/2152/15357
Sayarpour, M., Kabir, S., and Sepehrnoori, K. (2010). Probabilistic History Matching with the Capacitance-Resistance Model in Waterfloods: A Precursor to Numerical Modeling. Paper presented at the SPE Improved Oil Recovery Symposium, Tulsa, OK, April, 2010. doi:10.1016/j.petrol.2011.05.005
Sheng, G., Su, Y., and Wang, W. (2019). A New Fractal Approach for Describing Induced-Fracture Porosity/permeability/Compressibility in Stimulated Unconventional Reservoirs. J. Pet. Sci. Eng. 179, 855–866. doi:10.1016/j.petrol.2019.04.104
Tang, L. (2008). Study on Connectivity of Injection - Production System [J]. J. Oil Gas Techn. (J.JPI) 30 (04), 134–136. doi:10.3969/j.issn.1000-9752.2008.04.030
Xu, C. (2017). Discrete Fracture Modeling of Fractured Reservoirs [D]. Wuhan, China: University of Science and Technology of China.
Xu, Y., Sheng, G., Zhao, H., Hui, Y., Zhou, Y., Ma, J., et al. (2021). A New Approach for Gas-Water Flow Simulation in Multi-Fractured Horizontal wells of Shale Gas Reservoirs. J. Pet. Sci. Eng. 199, 108292. doi:10.1016/j.petrol.2020.108292
Yang, H., Wang, D., Huang, M., Jie, L. M., Zhuang, W. G., and Li, L. (2002). A Case of Using Water Soluble Tracer to Investigate Inter-well Connectivity at Fault Block Y8 [J]. Oilfield Chem. 19 (4), 343–345. doi:10.3969/j.issn.1000-4092.2002.04.016
Yang, M. (2004). Interwell Connectivity of Karst Fractured-Vuggy Carbonate Reservoirs in Block 4 of Tahe Oilfield [J]. Xinjiang Geology. 22 (02), 196–199. doi:10.3969/j.issn.1000-8845.2004.02.015
Yousef, A. A., Gentil, P. H., Jensen, J. L., and Lake, L. W. (2006). A Capacitance Model to Infer Interwell Connectivity from Production and Injection Rate Fluctuations. SPE Reservoir Eval. Eng. 9 (06), 630–646. doi:10.2118/95322-pa
Zhao, H., and Kang, Z. (2016). An Interwell Connectivity Inversion Model for Waterflooded Multilayer Reservoirs [J]. Petroleum Exploration Development 43 (01), 99–106. doi:10.1016/s1876-3804(16)30012-x
Keywords: fractured reservoir, connectivity model, optimization, horizontal well, gradient-free algorithm
Citation: Li D, Zhao Z, Wang B, Yang H, Cui W, Ruan J, Zhang Y and Wang F (2021) Study on Production Optimization Method of Fractured Reservoir Based on Connectivity Model. Front. Earth Sci. 9:767738. doi: 10.3389/feart.2021.767738
Received: 31 August 2021; Accepted: 06 October 2021;
Published: 29 November 2021.
Edited by:
Wenhui Song, China University of Petroleum (Huadong), ChinaReviewed by:
Shiyuan Zhan, Chengdu University of Technology, ChinaCopyright © 2021 Li, Zhao, Wang, Yang, Cui, Ruan, Zhang and Wang. This is an open-access article distributed under the terms of the Creative Commons Attribution License (CC BY). The use, distribution or reproduction in other forums is permitted, provided the original author(s) and the copyright owner(s) are credited and that the original publication in this journal is cited, in accordance with accepted academic practice. No use, distribution or reproduction is permitted which does not comply with these terms.
*Correspondence: Jiayu Ruan, c3ByaXRlbGVtb250ZWFAMTYzLmNvbQ==
†These authors contributed to the work equally and should be regarded as co-first authors
Disclaimer: All claims expressed in this article are solely those of the authors and do not necessarily represent those of their affiliated organizations, or those of the publisher, the editors and the reviewers. Any product that may be evaluated in this article or claim that may be made by its manufacturer is not guaranteed or endorsed by the publisher.
Research integrity at Frontiers
Learn more about the work of our research integrity team to safeguard the quality of each article we publish.