 Marzieh Baes
 Robert J. Stern
 Scott Whattam4
- 1Institute of Geology, Leibniz University Hannover, Hannover, Germany
- 2GFZ German Research Center for Geosciences, Potsdam, Germany
- 3Geosciences Department, University of Texas at Dallas, Richardson, TX, United States
- 4Department of Geosciences, College of Petroleum Engineering and Geosciences, King Fahad University of Petroleum and Minerals, Dhahran, Saudi Arabia
- 5Department of Earth Sciences, ETH-Zurich, Zurich, Switzerland
- 6Institute of Geosciences, University of Potsdam, Potsdam, Germany
Subduction initiation induced by a hot and buoyant mantle plume head is unique among proposed subduction initiation mechanisms because it does not require pre-existing weak zones or other forces for lithospheric collapse. Since recognition of the first evidence of subduction nucleation induced by a mantle plume in the Late Cretaceous Caribbean realm, the number of studies focusing on other natural examples has grown. Here, we review numerical and physical modeling and geological-geochemical studies which have been carried out thus far to investigate onset of a new subduction zone caused by impingement of a mantle plume head. As geological-geochemical data suggests that plume-lithosphere interactions have long been important - spanning from the Archean to the present - modeling studies provide valuable information on the spatial and temporal variations in lithospheric deformation induced by these interactions. Numerical and physical modeling studies, ranging from regional to global scales, illustrate the key role of plume buoyancy, lithospheric strength and magmatic weakening above the plume head on plume-lithosphere interactions. Lithospheric/crustal heterogeneities, pre-existing lithospheric weak zones and external compressional/extensional forces may also change the deformation regime caused by plume-lithosphere interaction.
1 Introduction
In the mid-20th century, new technologies like sonar and magnetometers provided the ability to map the seafloor and its magnetic anomalies, the basis of observations which led to the theory of plate tectonics. According to this theory, Earth’s uppermost layer (lithosphere) is divided into a mosaic of plates which move with respect to each other and the underlying mantle. Oceanic subduction zones play a key role in plate tectonics because about 90% of plate tectonic driving forces arise from slab pull (e.g., Lithgow-Bertelloni and Richards, 1998). Deformation, igneous activity, and natural disasters occur mainly at plate boundaries; however, igneous and tectonic activity also occurs within the plates. Examples are hotspot volcanoes above rising mantle plumes like Hawai’i and Yellowstone. The idea of a mantle plume was first proposed to describe the migration of the Pacific Plate over a hotspot in the mantle to explain the Hawai’i-Emperor volcano-island-seamount (Wilson, 1963). Following Wilson’s proposal, many studies have been carried out to refine this idea. An important recent hypothesis is that the impingement of a new mantle plume head on the base of the lithosphere can sometimes cause a new subduction zone to form (plume-induced subduction initiation, PISI, Whattam and Stern, 2015 and references therein). Numerical and observational evidence have shown that sinking of lithosphere into mantle induced by plume head is irrelevant to the nature of the overlying plate, it can be oceanic or continental lithosphere (e.g., Ueda et al., 2008; Burov and Cloetingh, 2009; Burov and Cloetingh, 2010; Gerya et al., 2015). Plume-induced sinking of intracontinental lithospheric mantle has been reviewed by Cloetingh et al. (2021). Here, we focus on plume-induced oceanic subduction initiation and briefly revisit plume-induced sinking of intracontinental lithospheric mantle. Formation of a new subduction zone as a result of plume-lithosphere interplay can also address the earliest subduction and the beginning of plate tectonics on Earth (Gerya et al., 2015).
Different mechanisms of subduction initiation have been proposed including onset of a new subduction zone along lithospheric weaknesses like transform faults zones (e.g., McKenzie, 1977; Mueller and Phillips, 1991; Hall et al., 2003; Lebrun et al., 2003; Gurnis et al., 2004; Stern 2004; Stern and Gerya, 2018), conversion of passive margins into active plate boundaries (e.g., Wilson 1966; Regenauer-Lieb et al., 2001; Nikolaeva et al., 2010; Duarte et al., 2013; Zhou et al., 2020), subduction initiation induced by pre-existing plate forces (e.g., Kemp and Stevenson, 1996; Baes et al., 2011; Levy and Jaupart, 2012; Zhong and Li, 2019) and subduction initiation induced by mantle suction flow (e.g., Lu et al., 2015; Baes and Sobolev, 2017; Baes et al., 2018). These mechanisms all depend on pre-existing plate tectonic forces and/or pre-existing lithospheric weak zones which are products of plate tectonics. PISI does not require such forces or weaknesses. For this reason, Whattam and Stern (2015) and Gerya et al. (2015) suggested that plume-lithosphere interaction may have initiated Earth’s first subduction zone, triggering the modern regime of plate tectonics.
Modeling studies (Ueda et al., 2008; Gerya et al., 2015; Baes et al., 2016, 2020a and, 2020b; Davaille et al., 2017; Lu et al., 2015; Crameri and Tackley, 2016) and geological and geochemical observations (Whattam and Stern, 2015; Davaille et al., 2017; Gao et al., 2019; Stern and Dumitru, 2019; Gülcher et al., 2020; Li et al., 2020; Yang et al., 2020; Rodriguez et al., 2021; van Hinsbergen et al., 2021) have advanced our understanding of plume-lithosphere interplay and its role in forming new subduction zones. Here, we revisit models and natural examples of oceanic PISI. We first explain mantle plumes and their role in plate tectonics. Then, we briefly explore previous studies of plume-induced sinking of intracontinental lithospheric mantle. This is followed by a review of numerical modeling studies of oceanic PISI in greater detail. Then, we revisit proposed sites of PISI on Earth and finally, we end with discussion and conclusions. A short video overview of PISI can be watched at https://www.youtube.com/watch?v=Hb47L8S7fMU&t=5s.
2 Plumes in Plate Tectonics
Mantle plumes are zones of upwelling hot mantle whose surface manifestations include linear volcanic chains, plateaus, large igneous provinces and continental flood basalts. Thinking about mantle plumes goes back to the early 1960’s. Wilson (1963) proposed the hotspot theory based on observations of the Hawaiian Islands which formed “within-plate,” far from any plate boundary. He argued that motion of the Pacific Plate over a “hotspot,” which represented a long-lasting exceptionally hot region in the mantle, generated the chain of Hawaiian Islands. The main evidence for this proposal was the progressive aging of the islands towards the NW. Wilson proposed that if lithosphere moves over a relatively fixed magma source—possibly the source is within the relatively stagnant center of a mantle convection cell—it would produce a chain of volcanoes like the Hawaiian Islands (Figure 1A). He noted that the rising mantle plume is not necessarily stationary but may move slower than the overlying plate. Morgan (1971) refined Wilson’s idea, stating that hotspots are stationary hot mantle plumes which originate from the core-mantle boundary. He proposed that these hotspots are expressions of lower mantle convection. Wilson (1973) indicated that surface expressions of mantle plumes in the oceans are: 1) uplift, 2) active volcanoes (producing alkaline basalts, rhyolite and tholeiite basalts), 3) high gravity anomalies, 4) extension, and 5) high heat flow. He documented more than thirty plumes, most of which lie close to mid-oceanic ridges and a few which are within the plate, producing isolated chains of seamounts and islands. The Wilson-Morgan hypothesis has advanced in the last 5 decades. Duncan and Richards (1991) noted that fixed hotspots on Earth can serve as a convenient reference frame for plate motion, through the orientations and age distributions of volcanic trails. They argued that plate motions in two reference frames of plume-supported hotspot and paleomagnetic reference frames reveal small but systematic differences. As hotspots are the upward flow of a long-lived, stable pattern of whole mantle convection (Figure 1B) these differences indicate whole-mantle motion relative to the Earth’s spin axis.
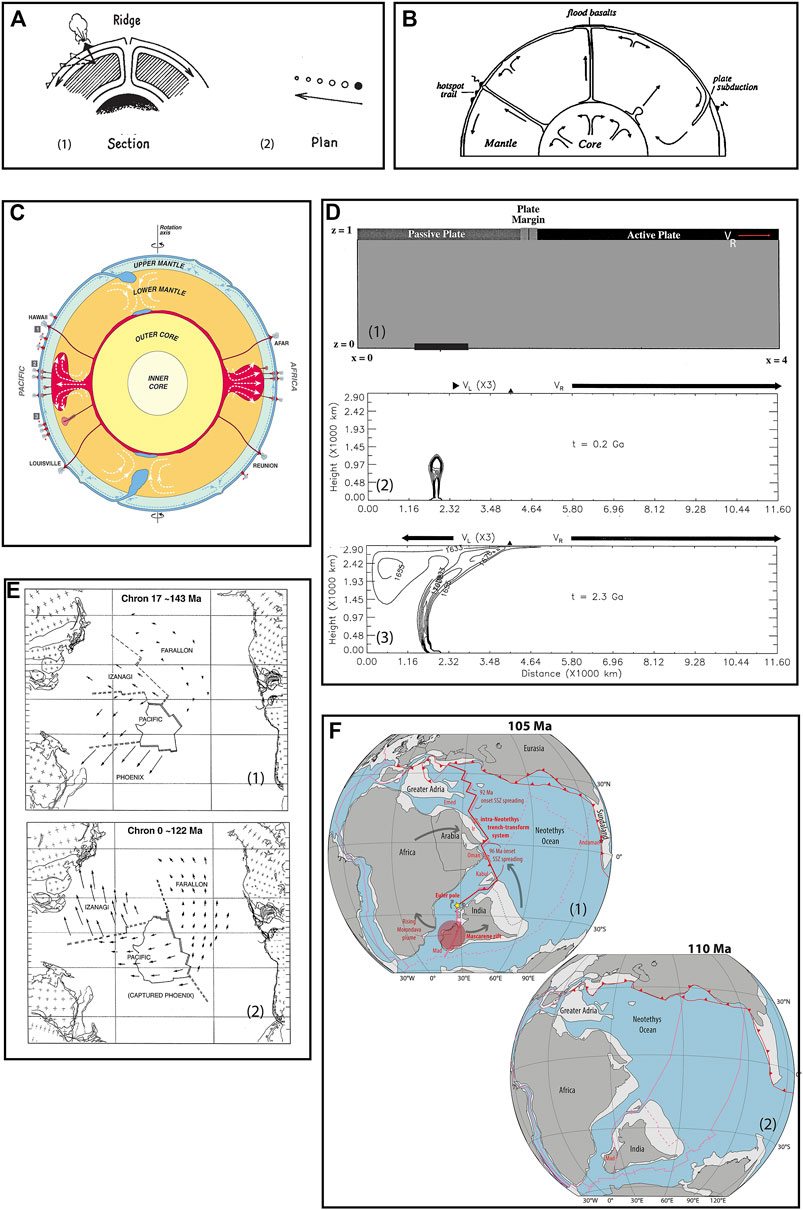
FIGURE 1. (A) Wilson’s hypothesis for the development of the Hawaiian-Emperor chain. Moving lithosphere over a quasi-stationary magma source results in formation of a chain of volcanoes (figure is adapted from Wilson, 1963). (B) Schematic illustration of mantle convection by Duncan and Richards (1991). Plates form and separate at spreading ridges and disappear in subduction zones. Gravitationally unstable hot mantle plumes may originate from near the core-mantle boundary. Partial melting of a rising plume head at the base of the lithosphere generates flood basalts and long-lived plume tails form hotspot trails (chain of seamounts and islands) as plates move across them (Figure is adapted from Duncan and Richards, 1991). (C) Types of hotspots based on Courtillot et al. (2003): (1) primary plumes are deep-rooted, coming from the core-mantle boundary, (2) secondary plumes originate at the transition zone above two superplumes beneath Africa and Pacific, and (3) tertiary or Andersonian plumes which are the passive response of plate-related stresses (figure is adapted from Courtillot et al., 2003). (D) Numerical model setup (panel 1) and results (panels 2,3) of Ratcliff et al. (1998) to investigate the effect of rising plume head on plate decoupling. (1): In the initial model setup, an active plate moves towards the right, pushing the passive plate with it. (2,3): Results show that a rising mantle plume head can decouple passive from active plates and change the direction of its motion. Figure is obtained from Ratcliff et al. (1998). (E) Reconstruction of the Pacific Plate and its neighboring plates, based on Ratcliff et al. (1998), showing plate reorganization due to arrival of the Ontong-Java plume at ∼122 Ma. (F) Plate reconstruction model of Van Hinsbergen et al. (2021) showing formation of a long plate boundary following arrival of a mantle plume beneath Madagascar-India. Figure is obtained from van Hinsbergen et al. (2021).
There are different views about the origin of mantle plumes. One is that these are deep-rooted, uprising hot mantle rocks which come from the core-mantle boundary (primary plumes of Courtillot et al. (2003) and shown as Type 1 plumes in Figure 1C). Burke and Torsvik (2004) indicated that these plumes mainly form at the margins of LLSVPs (Large Low Shear wave Velocity Provinces which are also known as Sub-African and Sub-Pacific regions (Figure 1C) or TUZO and JASON (Burke, 2011)), which are approximately stable through time. It has been proposed that these two LLSVPs in the deep mantle beneath Africa and the South-Central Pacific which cover ∼20% of the core–mantle boundary and extend up to ∼1,000 km above it (e.g., Dziewonski, 1984; Davies et al., 2015), have higher density than the surrounding mantle, indicating that they are chemically different (e.g., Becker and Boschi, 2002; Cottaar and Lekic, 2016). The second type of plumes are those that come from the transition zone at the top of the superplumes of the two LLSVPs (called secondary plumes by Courtillot et al. (2003) and shown as Type 2 plumes in Figure 1C). Anderson (2000) challenged the role of the deep mantle in forming plumes (Type 3 plumes in Figure 1C). Based on geophysical data such as bathymetry, subsidence rates, heat flow, global plate motion modeling, depths to mantle phase changes and seismic velocities, he suggested that lateral variations of temperature in the asthenosphere is ∼200°C, which is in the range of estimated plume-excess temperatures (e.g., Herzberg and Gazel, 2009). He argued that upwelling of asthenosphere through the melting zones are responsible for excess magmatism, not deep-rooted hot mantle plumes. Anderson (2005) proposed that plumes are asthenospheric features which form due to stress- and crack-controlled magmatism, mechanisms that are associated with plate tectonics.
Plumes rise towards the surface due to their buoyancy, which depends on plume temperature, composition and size. The plume excess temperature with respect to ambient mantle has been estimated to be 200–350 K (White and McKenzie, 1995; Herzberg and Gazel, 2009). Montelli et al. (2004) presented tomographic evidence for the existence of deep-mantle plumes having diameters of several hundred kilometers. They mentioned that because of the limitations in estimating plume diameters in the lower mantle where tomographic data has low resolution, the actual plume size may be much smaller. Some studies suggest that plumes might include a denser component with different composition than ambient mantle (e.g., Deschamps et al., 2012). According to these studies, recycling subducted materials (e.g., continental crust (Willbold and Stracke, 2006) or subducted oceanic crust (Hofmann and White, 1982)) within the mantle is required to explain the geochemical variability in hotspot lavas. In contrast, some scientists believe that plumes are purely thermal features (e.g., Schuberth et al., 2009).
The role of mantle plumes in plate tectonics and the causes of plate reorganization has been previously studied (e.g., Ratcliff et al., 1998; Gerya et al., 2015; Van Hinsbergen et al., 2021). Using 2D numerical models, Ratcliff et al. (1998) showed that a rising mantle plume head can decouple a passive plate (a plate whose speed and direction of motion are driven by its adjacent active plate) from an active plate (Figure 1D). Their modeling results showed that following plume-lithosphere interaction, the passive plate changed its motion from eastward (Figure 1D2) to westward (Figure 1D3). They argued that this scenario is applicable for the tectonic evolution of the Pacific Plate and its neighboring plates during ∼143–122 Ma (Figure 1E). The Pacific, Izanagi and Farallon plates were likely all pulled to the southwest but with different velocities, due to the southwest-ward motion of the Phoenix plate prior to 122 Ma (Figure 1E1). There was no subduction around the Pacific Plate and the only mature subduction zone was the Phoenix Plate beneath what is now New Zealand and New Caledonia (i.e., Zealandia, Mortimer et al., 2017). Flood basalt eruption around 122 Ma to form the Ontong-Java plateau decoupled the Pacific, Izanagi and Farallon plates from the Phoenix’s mantle traction and led to plate reorganization (Figure 1E2). Recently, van Hinsbergen et al. (2021) proposed that a rising mantle plume below Madagascar-India around 105 Ma formed a >12,000 km long plate boundary between the Indian and African plates with subduction segments in the eastern Mediterranean and a ridge between India and Madagascar (Figure 1F). According to this study, plume-lithosphere interaction near a mid-oceanic ridge can cause plate rotation which may form a new subduction zone and/or rift. Subduction initiation induced by impingement of a mantle plume on lithosphere is another scenario which illustrates the importance of plumes in plate tectonics (e.g., Ueda et al., 2008; Gerya et al., 2015; Whattam and Stern, 2015). Plume-induced subduction initiation (PISI), because it doesn’t require any pre-existing lithospheric weaknesses and/or plate forces, can explain the development of initial subduction on Earth, which could have triggered the onset of plate tectonics (Gerya et al., 2015; Whattam and Stern, 2015).
3 Plume-Induced Sinking of Intracontinental Lithospheric Mantle
Impingement of a mantle plume on continental lithosphere differs in terms of rheological and mechanical properties from plume-oceanic lithosphere interaction. Using numerical models, (Burov and Cloetingh, 2009; Burov and Cloetingh, 2010) investigated plume-induced sinking of intracontinental lithospheric mantle. They showed that arrival of a mantle plume below continental lithosphere eroded mantle lithosphere and allowed the plume to intrude into the crust. Brittle failure of the upper crust and detachment of mantle lithosphere forms a subduction-like motion (Figure 2A). Gravitationally unstable mantle lithosphere and the stratified structure of continental lithosphere plays a key role in causing a subduction-like process in this situation (Burov and Cloething, 2009; Burov and Cloething, 2010). One of the critical issues in these studies is the assumption of extremely high plume temperatures of 2,300°C. As indicated in the previous section, observations show that plume excess temperature with respect to ambient mantle can be 200–350°C. Recently, Cloetingh et al. (2021) revisited plume-induced sinking of intracontinental lithospheric mantle. They used the same model setup as Burov and Cloetingh. (2009) and Burov and Cloetingh. (2010) but with various continental lithospheric ages and different plume temperatures. Their 2D numerical models revealed that horizontal intrusion of a plume may occur at different levels of the continental lithosphere depending on lithosphere age and internal structure. Plume intrusion into buoyant continental crust and attendant sinking of continental mantle lithosphere occurs only if continental lithosphere is young (60–150 Myr) and plume is extremely hot (Figure 2B). In the case of older continental lithosphere, lithospheric strength prohibits penetration of plume material through the lithosphere and as a result plume-lithosphere interaction causes downthrusting of only the lowermost lithospheric mantle (Figure 2C). Cloetingh et al. (2021) carried out numerical experiments with more realistic plume excess temperature of ∼350 K. Regardless of lithosphere age, plume-lithosphere interaction in these models resulted only in sinking of the lowermost lithosphere into the asthenosphere (Figure 2D). It should be noted, however, that no melt-induced weakening of the lithosphere (e.g., Sobolev et al., 2011; Gerya et al., 2015; Gulcher et al., 2020) has been applied in these models.
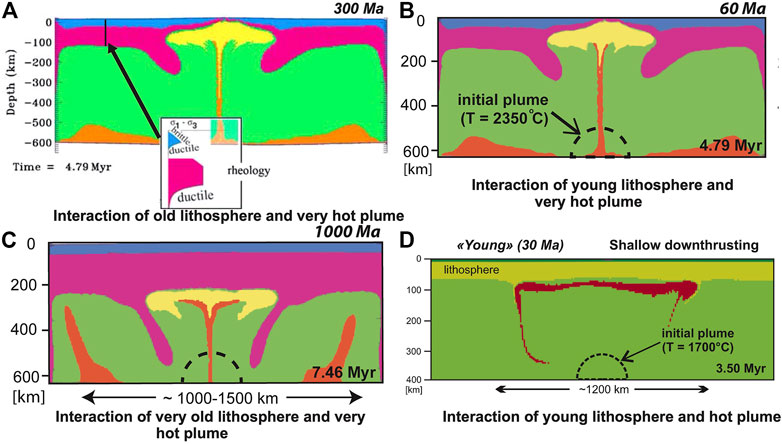
FIGURE 2. Plume-continental lithosphere interaction. (A) Numerical modeling results of interaction of an extremely hot plume with a homogeneous, strong 300 Myr continental plate, showing intrusion of plume in continental crust and decoupling of mantle lithosphere from the crust, leading to sinking of continental lithospheric mantle (adapted from Burov and Cloetingh, 2010). (B,C) Numerical modeling results of an impinging very hot plume head with (B) young and (C) old continental lithosphere which leads to sinking of lithospheric mantle and underthrusting of lower parts of the lithospheric mantle, respectively. (D) Numerical modeling results of interaction of a plume head (with a more realistic temperature) with young lithosphere which causes foundering of the lowermost lithospheric mantle (Panels (B–D) are adapted from Cloetingh et al., 2021).
Evidence of subduction-like sinking of continental lithosphere associated with upwelling of hot mantle is documented in Anatolia, the Caucasus, Central Asia, NE China, Iberia, Central Europe and the Colorado Plateau (Memiş et al., 2020; Cloetingth et al., 2021 and references therein). Seismic data commonly show a negative velocity anomaly—reflecting upwelling mantle material- and one or two areas with positive seismic anomalies—indicating sinking of continental lithosphere.
4 Plume-Induced Oceanic Subduction Initiation
PISI has been the focus of several studies. In this section, we first review modeling studies that explore plume-induced subduction initiation. Then, we revisit works which document geologic evidence of subduction initiation triggered by a hot mantle plume head.
4.1 Modeling Studies
Despite more and more studies, our understanding of different geological and geophysical Earth phenomenon is still incomplete. Modeling, which complements observations, provides a uniquely valuable approach for interpreting and analyzing the kinematics and dynamics of solid Earth phenomenon. Modeling methods include numerical, analogue (or physical), theoretical and hypothetical models. In recent years, numerical modeling has received more attention due to advances in computer processing power and modeling techniques. Most modeling studies of plume-induced subduction initiation are based on numerical methods except for one analogue modeling study. Below, we review these studies.
The first modeling study of plume-induced subduction initiation was based on 2D thermo-mechanical numerical models (Ueda et al., 2008). The model consisted of uniform oceanic lithosphere which contained crust and mantle lithosphere, a spherical plume and asthenosphere to a depth of 200 km (Figure 3A). Plume was defined as a thermal and/or chemical buoyant body with respect to ambient mantle. Magmatic weakening above the plume head was implemented by lowering the effective internal friction angle and effective viscosity. The reference model results showed that partially molten plume material may penetrate the lithosphere (Figure 3B). This is followed by spreading of plume material atop two broken segments (proto-slabs) of the lithosphere, resulting in a slightly downward motion of the proto-slabs (Figure 3C). This downward movement leads to initiation of two self-sustaining retreating subduction zones (Figure 3D). Subduction ceases due to slab break-off after about 500 km of lithospheric subduction (Figures 3E,F). Slab break-off is due to subduction of young (10 Myr old and younger) and hence weak lithosphere; the strength of young lithosphere is overcome by stresses induced by slab pull resulting in slab break-off and cessation of subduction. Sensitivity analysis of model parameters in this study revealed four different regimes: stable subduction, no subduction, critical subduction initiation and slab fragmentation (Figure 3G). If the plume size is too small, or the lithosphere is too old (thus too strong), no subduction occurs. In this case, the plume head spreads symmetrically beneath the lithosphere. Critical subduction initiation—in which subduction develops asymmetrically—happens within a range of parameters close to the boundary between stable and no subduction regimes (Figure 3G). Interaction of a large plume head with young lithosphere leads to more complex and multi-fold patterns of plume material rise and lithosphere fragmentation. Ueda et al. (2008) indicated that the ability of the plume to pass through the entire lithosphere is one of the main parameters in plume-induced subduction initiation. Plume penetration can be achieved if plume buoyancy exceeds the local strength of the lithosphere:
where
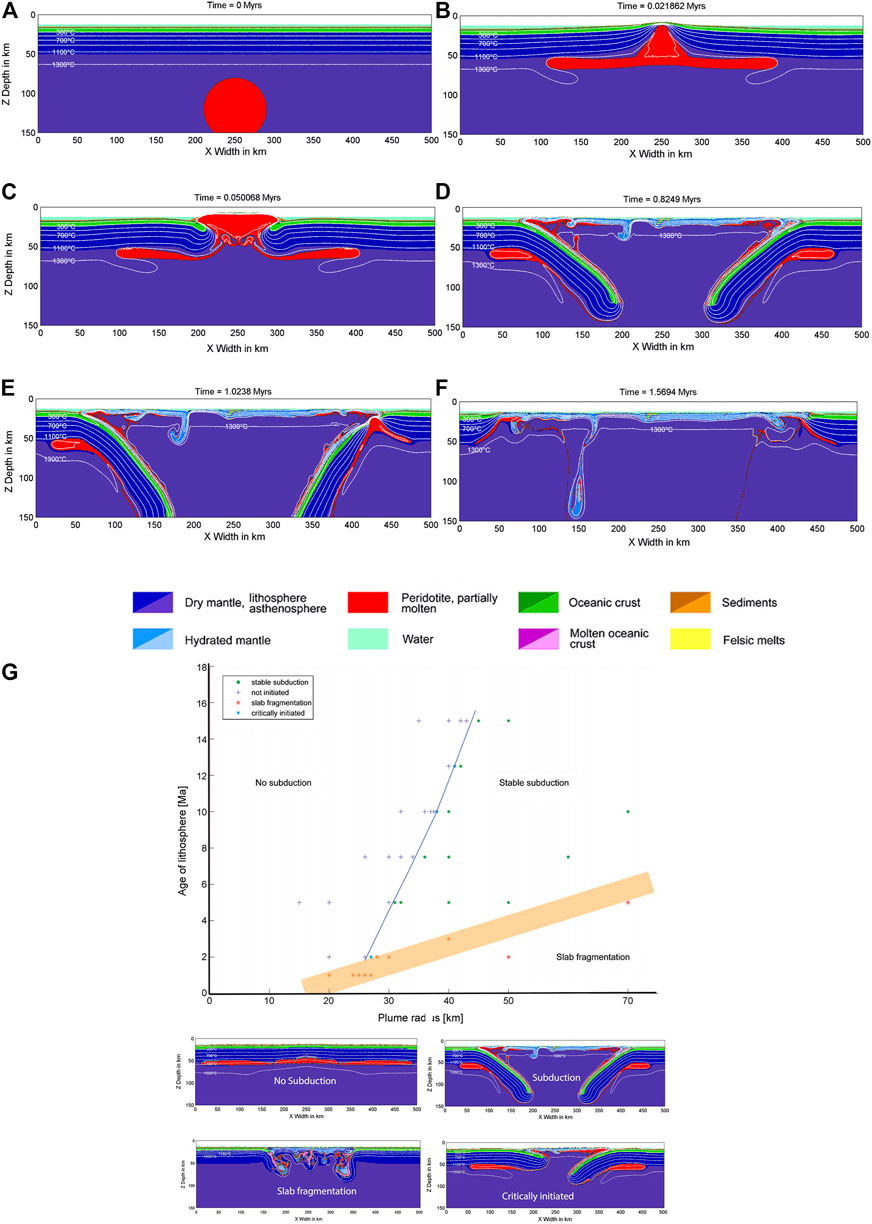
FIGURE 3. (A–F) Model setup and results of Ueda et al. (2008). (A) Initial setup, (B) Rising plume head spreads at the base of the lithosphere and a partially molten plume passes through the lithosphere, (C) Plume material starts to spread atop the lithosphere, (D) Subduction initiates and continues to be self-sustaining and retreating, (E) The shallow slab breaks off, and (F) New ocean floor forms above the plume. (G) Model results summary of Ueda et al., 2008. Lower panels in (G) show one example of each of the different deformation regimes (modified from Ueda et al., 2008).
This reveals that local weakening of the lithosphere above a plume head depends on plume volume, plume buoyancy and lithosphere thickness (hence, strength). According to Ueda et al. (2008), the other important parameter for starting stable subduction is the presence of water in the sinking lithospheric slab. Water is required to lower the friction angle of lithosphere which can lead to plume penetration. Furthermore, when a slab forms, water helps lubricate the plate interface. Later, once the slab dehydrates in the upper mantle, its density increases, facilitating subduction of oceanic lithosphere to greater depths.
Ueda et al. (2008) argued that in the Archean, the response of plume head-lithosphere interaction was local underplating and fragmentation, due to thinner, weaker lithosphere and hotter plumes enriched in water. They also speculated that in 3D models the development of a subduction zone would have the shape of a ring or funnel which could simulate ring-shaped subduction-like features called coronae on Venus.
Single or stagnant lid convection, which occurs in most active silicate planets with strongly temperature dependent viscosity such as Venus and Mars, has been proposed for Archean time (Sleep, 2000; Stern, 2007). Transformation from a stagnant-lid phase to plate tectonics demands breaking the lid to initiate subduction. Using 2D numerical models, Lu et al. (2015) investigated subduction initiation from an initial stagnant lid without pre-existing weak zones or kinematic boundary conditions. Their model consisted of a lithospheric lid, asthenosphere and a high temperature anomaly at the bottom-left of the model, which is introduced by imposing a high-temperature boundary condition (Figure 4A). Shear heating was employed as the mechanism for shear localization. Four deformation regimes were observed in their simulations: an un-necking mode, an asymmetric-subduction mode, a symmetric-subduction mode and a stagnant-lid mode (Figures 4B–E). These depend on the age and friction angle of the lid (Figure 4F). When lithosphere is too young and weak, un-necking occurs because lithospheric-scale shear zones do not form. In the case of lithosphere that is too old, the driving force induced by mantle flow is insufficient to break it, resulting in a stagnant-lid mode. Subduction initiation, which starts with formation of a shear zone cutting through the lithosphere, occurs when lithosphere is neither too young or too old (Figure 4F). For a dry friction angle of 30°, subduction initiates when the lithosphere is 20–60 Myr. Low friction angles favor symmetric subduction. This is consistent with model results of Ueda et al. (2008) in which magmatic weaking lowers lithospheric strength and friction angle, resulting in development of a symmetric subduction zone.
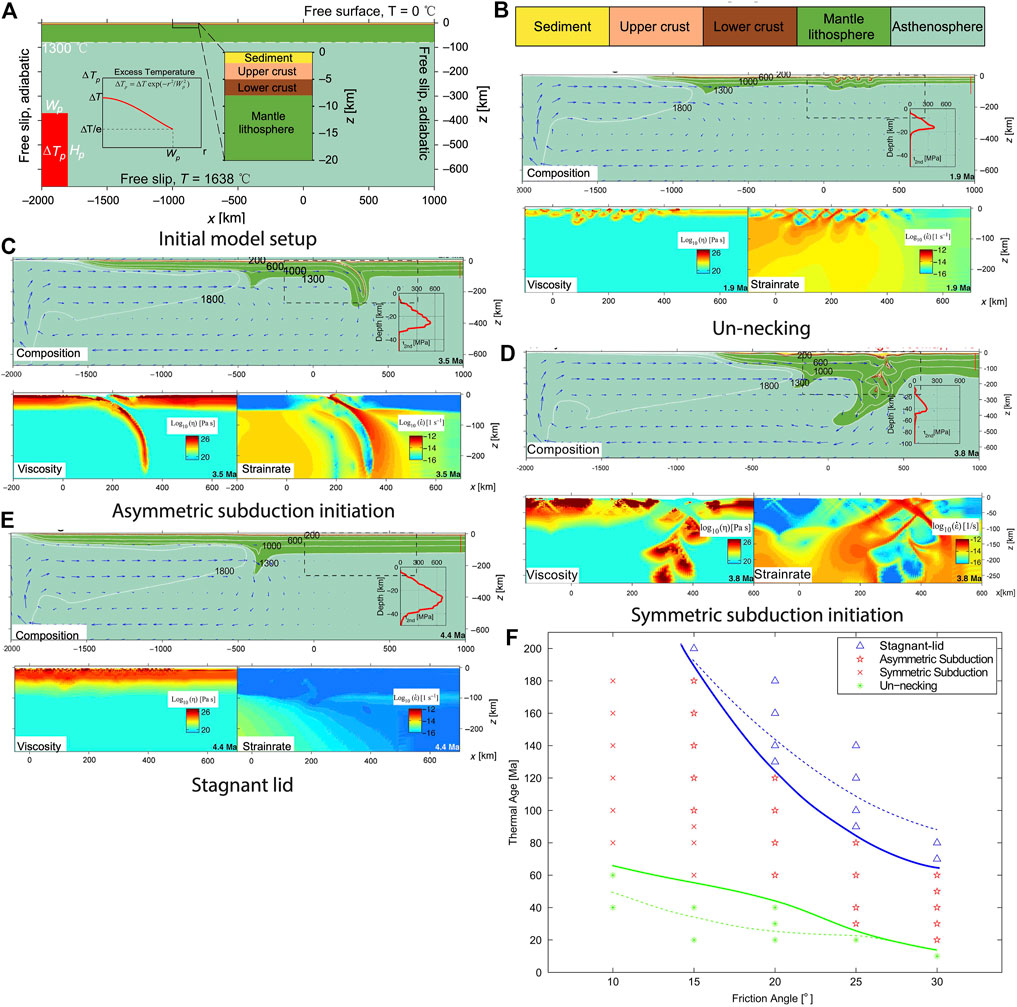
FIGURE 4. Modeling results of Lu et al., 2015. (A) Initial model setup and (B–E) four different regimes resulting from the modeling experiments: (B) un-necking, (C) asymmetric subduction initiation, (D) symmetric subduction initiation, and (E) stagnant lid. In (A–E) the upper panels show the compositional field and the lower panels illustrate viscosity and strain rate. (F) Summary of modeling experiments (modified from Lu et al., 2015).
Similarly, using time-dependent numerical modelling of mantle convection, Crameri and Tackley (2016) studied subduction initiation within a stagnant lid. They set up 3D spherical models to explore subduction initiation at the global scale. Their modeling results showed that in experiments with free surface, subduction initiates spontaneously after a period of stagnant-lid mode (Figure 5). In these experiments, rising narrow plumes (which originate from the core-mantle boundary; Figure 5A) impinging on the base of intact lithosphere heat and weaken it (Figure 5B). Local lithospheric thinning increases LAB (lithosphere-asthenosphere boundary) topography (Figure 5C). Further plume upwelling causes spreading of hot materials at the base of the thinned lithosphere, further weakening it (Figure 5D). Subsequently, the plate breaks and decouples thick and thin parts of lithosphere (Figure 5E) and the thick part sinks into the asthenosphere (Figure 5F). Subduction begins and becomes self-sustaining when the plate sinks deeper with time (Figures 5G,H). After subduction initiation, global deformation evolves either to plate tectonics or to an episode of global overturn, which may have happened on Venus. Crameri and Tackley (2016) concluded that, for an episodic lid to happen, a fast sinking slab is required to prevent the new plate from cooling and becoming negatively buoyant. If this happens, subduction stops after sinking of the initial stagnant lid and the system returns to a stagnant lid mode.
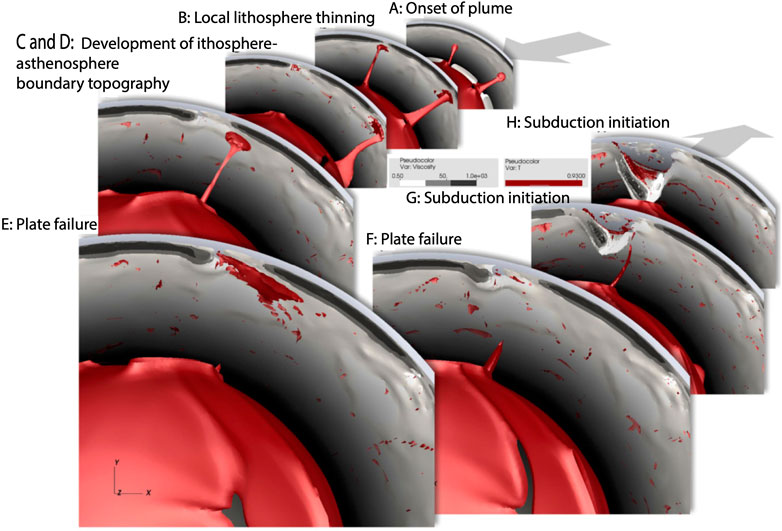
FIGURE 5. Plume-induced subduction initiation in the global convection model of Crameri and Tackley (2016). (A) Onset of plume, (B) local lithosphere thinning, (C,D) development of strong lithosphere-asthenosphere boundary topography, (E,F) plate failure, and finally (G,H) self-sustaining subduction initiation. Plates and mantle plumes are shown in grey and red, respectively (from Crameri and Tackley 2016).
Recognition of the geochemical-geological evidence of plume-induced subduction in the Caribbean region in the Late Cretaceous (Whattam and Stern, 2015) encouraged Gerya et al. (2015) to explore whether a similar mechanism might have started the first subduction event on Earth and hence, the onset of the tectonics in the Precambrian (>542 Myr ago). The mechanism of starting subduction on Earth must have been different from modern subduction initiation due to the dependence of the latter on driving forces induced from neighboring plates and/or pre-existing lithospheric weakness zones, which are both consequences of plate tectonics. As plume-induced subduction initiation is independent of any prerequisites related to plate tectonics, plume-lithosphere interaction could have caused the first subduction event, triggering the onset of plate tectonics. Using high-resolution three-dimensional numerical magmatic-thermomechanical modelling Gerya et al. (2015) tested this scenario. The model evolution for an experiment based on modern conditions showed the following stages (Figure 6A): 1) development of an oceanic plateau by arrival of a mantle plume head; 2) formation of an incipient trench and descent of a nearly cylindrical slab at the plateau margins; 3) tearing of the cylindrical slab; 4) formation of several self-sustained retreating subduction zones; and 5) formation of a mosaic of cooling small, young, non-subducting plates, which are separated by spreading centres (ridges), triple junctions and transform faults, between retreating slabs (Figure 6B). These results indicate that plume head impingement on stagnant lithosphere can result in the development of a multi-slab subduction system and a rudimentary plate mosaic, both of which are required to begin modern-style plate tectonics. Results of models with early-Earth (Archean) conditions—which had thicker crust and higher mantle temperature—showed that interaction of a plume with a young, warm, buoyant and weak plate results in formation of an oceanic plateau, followed by nearly circular sheet-like lithospheric drips (Figure 6C), whereas impingement of a plume with older Archean lithosphere (>60–70 Myr) causes subduction initiation (Figure 6D). The authors indicated the key role of the following factors in Self-sustained subduction initiation: 1) strong (old), negatively buoyant oceanic lithosphere; 2) lithospheric magmatic weakening above the plume head; and 3) lubrication of the slab interface by hydrated crust.
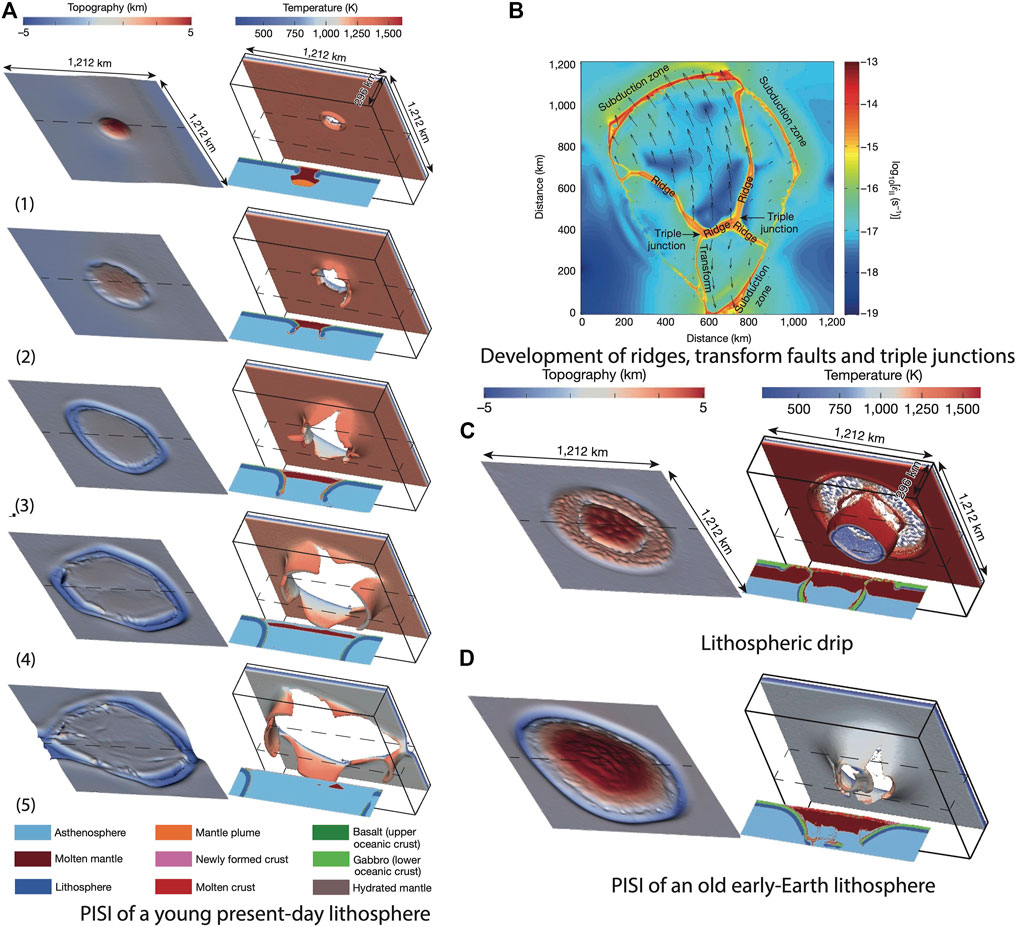
FIGURE 6. Modeling results of Gerya et al. (2015). (A) Model evolution of plume-induced subduction initiation under present-day mantle temperature conditions. (1) Oceanic plateau development, (2) formation of an incipient trench and a nearly cylindrical slab, (3) tearing of the cylindrical slab, (4) formation of retreating subduction zones and (5) development of spreading centres and transform boundaries. Left and right columns show topography and subducted lithosphere morphology with projected slab surface temperature, respectively. Dashed lines indicate positions of the 2D cross-sections (colour code is at the bottom of the figure). (B) Spatial distribution of second strain rate invariant at a depth of 20 km, illustrating formation of a mosaic of plates separated by spreading centres (ridges), triple junctions and transform faults at the latest stage of plume-induced subduction. Arrows show horizontal velocities of individual, young, non-subducting plates moving towards retreating subducting slabs. (C,D) Plume–lithosphere interaction for hotter mantle and thicker oceanic crust–indicating early-Earth conditions-for: (C) a 20-Myr-old oceanic plate and (D) a 80-Myr-old oceanic plate. Description of panels are similar to (A) (from Gerya et al., 2015).
In a follow-up study, Baes et al. (2016) investigated modern plume-lithosphere interaction in more detail. From numerical modeling results, four deformation regimes were recognized: 1) self-sustaining subduction initiation, in which subduction persists for a long time; 2) frozen subduction initiation, in which subduction stops at shallow depths; 3) slab break-off, in which the subducting cylindrical slab breaks off soon after forming; and 4) plume underplating, in which the plume does not pass through the lithosphere and instead spreads beneath it (Figure 7A). These lithospheric responses to the arrival of a plume depend on various parameters such as the size, composition, and temperature of the plume, the brittle/plastic strength and age of the oceanic lithosphere, and the presence/absence of lithospheric heterogeneities. As the first step in initiating subduction is penetration of the plume head into the lithosphere, it is important to investigate the conditions required for a plume head to break the lithosphere. Following Ueda et al. (2008), Baes et al. (2016) defined a non-dimensional factor Brat, as:
where
where
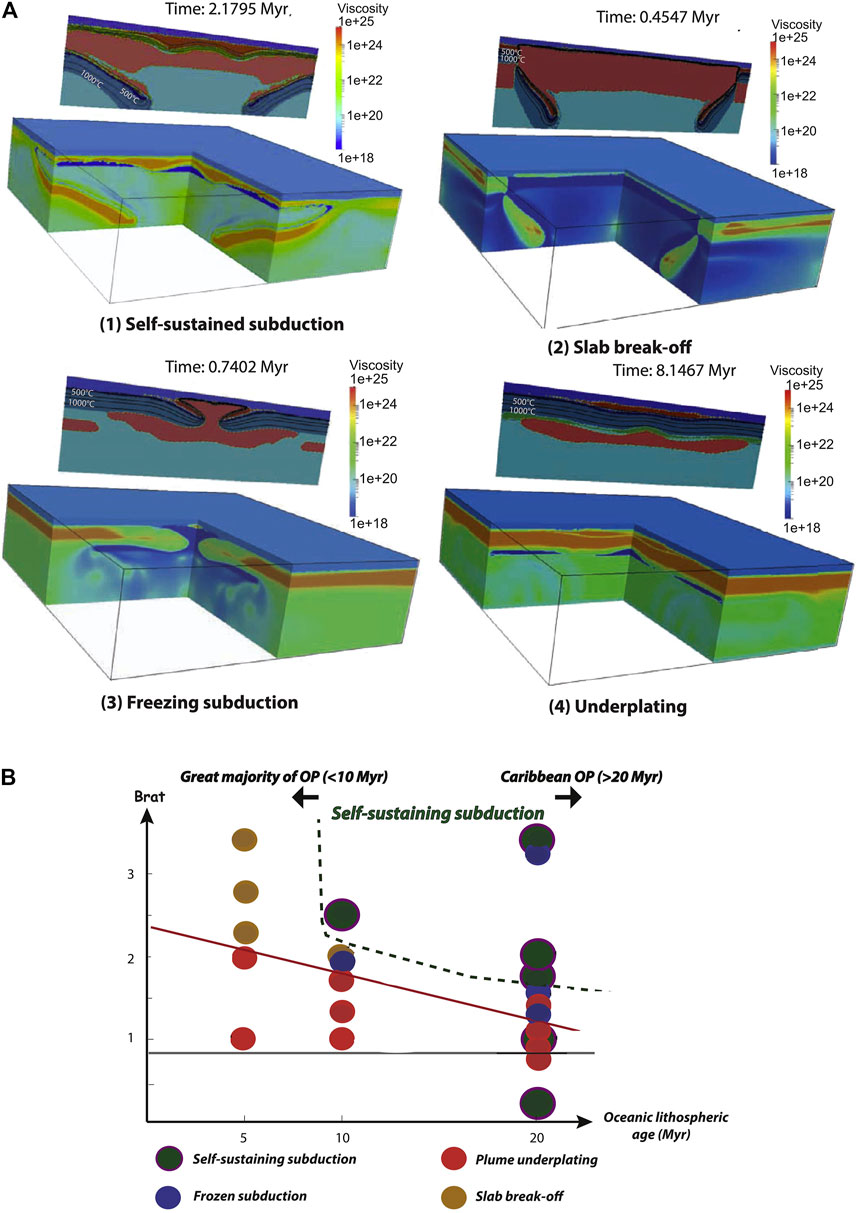
FIGURE 7. (A) Four different deformation regimes resulting from plume-lithosphere interaction based on numerical models of Baes et al. (2016). The 2D cross-sections show the evolution of the lithological structure (color codes are shown in the right side of figure). Black lines show isotherms of 200°C, 500°C, 700°C, and 1,000°C. The 3D panels show the evolution of the viscosity structure. (B) Dependence of four different responses to plume–lithosphere interaction on oceanic lithospheric age (horizontal axis) and Brat number (i.e., the non-dimensional ratio of plume buoyancy and lithospheric strength, vertical axis). Each circle illustrates the result of one of the experiments. Different colors represent different responses to plume–lithosphere interaction. Gray and red lines show optimum values of the Brat number for a plume to penetrate through the lithosphere, based on the results of Ueda et al. (2008) and Baes et al. (2016), respectively. OP stands for oceanic plateau. The green dashed curve shows the domain with a high probability of self-sustaining subduction initiation. The large black arrows on top of the figure indicate that most oceanic plateaus form on lithosphere younger than 10 Myr. In contrast, the Caribbean plateau is among the few oceanic plateaus that formed on older than 20 Myr lithosphere (obtained from Baes et al., 2016).
Baes et al. (2020a) investigated the conditions affecting the number and shape of slabs formed by plume-lithosphere interaction. Using 3-D thermomechanical models they showed that formation of a single-slab or multi-slab subduction regime depends on several factors such as oceanic lithosphere age, thickness of the crust and the large-scale lithospheric extension rate. On Earth today, multi-slab plume-induced subduction is likely only if the oceanic lithosphere is young (<30–40 Myr, but >10 Myr) and the crust has a typical thickness of 8 km (Figures 8A1,B1). Initiation of single-slab subduction is facilitated by older lithosphere (Figures 8A2,B1). In early Earth, plume-lithosphere interactions could have triggered either episodic short-lived cylindrical subduction (Figures 8A3,B2) for young oceanic lithosphere or multi-slab subduction for old lithosphere (Figure 8B2). Extension above the plume head aids subduction initiation caused by plume-lithosphere interaction. This can be inferred from Figure 8B3: subduction initiation failed in models with thick oceanic crust; however, extensional thinning and weakening of lithosphere favors subduction initiation. Baes et al. (2020b) further investigated plume-lithosphere interaction by exploring the effect of large lithospheric heterogeneities, such as a buoyant plateau, in proximity to a rising plume head. Two cases were considered: 1) when a plume head penetrates normal oceanic lithosphere near a plateau, and 2) when a plume head interacts with plateau close to oceanic lithosphere. When plume-lithosphere interaction occurs within an oceanic plate, the dominant deformation regime is subduction initiation (Figure 8C1). Exceptions are when plume heads impinge young oceanic lithosphere at a distance larger than the plume head diameter. In these cases, both oceanic plate and plateau subduct to form a circular oceanic-plateau trench. In contrast, if a plume head interacts with a plateau, oceanic subduction initiation happens only if oceanic lithosphere is young and the plume head is near the plateau-oceanic crust margin (Figure 8C2).
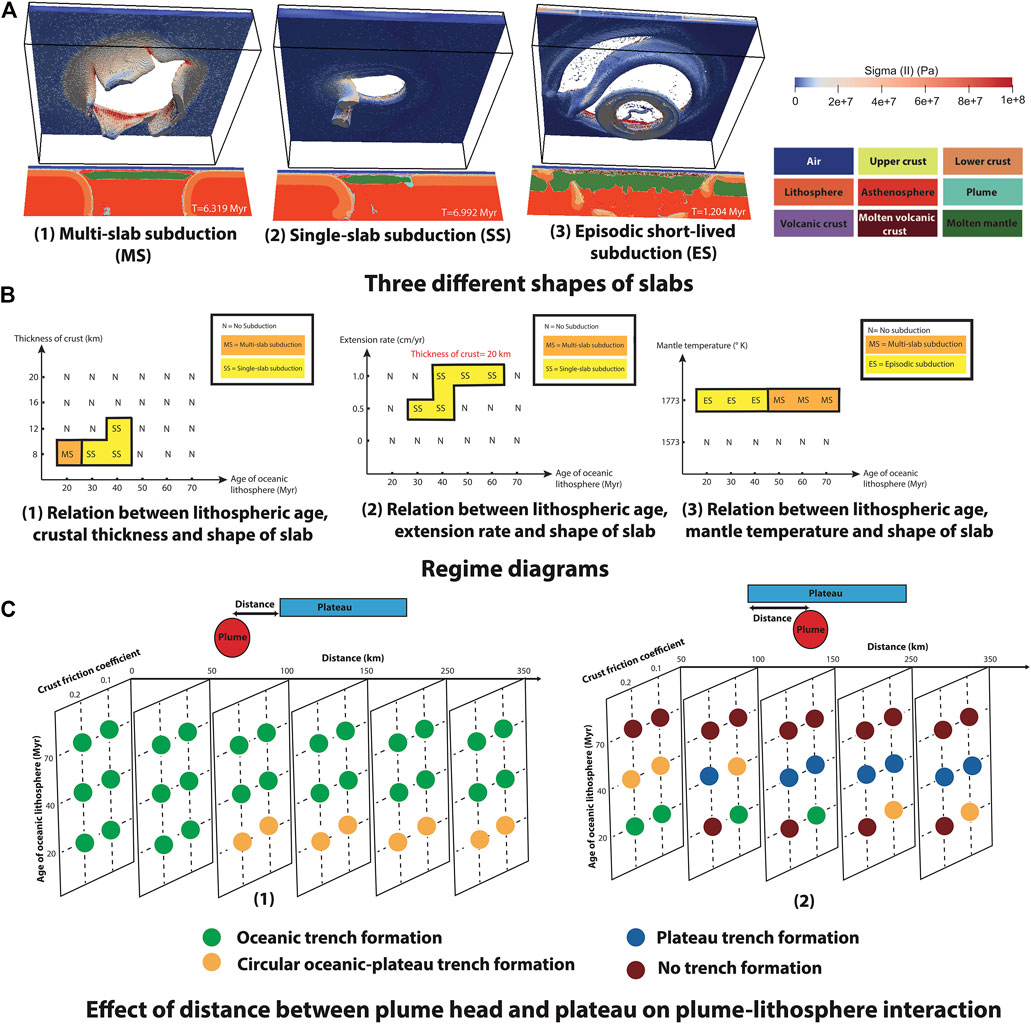
FIGURE 8. (A,B) Modeling results of Baes et al. (2020a) exploring controlling factors in the shape and number of slabs. (A) Three different styles of subduction initiation induced by plume-lithosphere interaction: (1) multi-slab subduction, (2) single-slab subduction, (3) episodic short-lived subduction. The 2D cross-section shows the material phases at a cross-section through the middle of the model (color codes are shown on the right). The 3D figures illustrate the second invariant of stress tensor of the lithospheric part of the model. (B) Summary of results: diagrams show the dependency of the number of slabs formed due to plume-lithosphere interaction on (1) lithospheric age and crust thickness, (2) lithospheric age and extension rates, (3) lithospheric age and plume temperature. Diagrams shown in (2) and (3) demonstrate results of models with 20 km thick crust. In all diagrams SS, MS and ES stand for single-slab, multi-slab and episodic subduction initiation, respectively. (C) Model results of Baes et al. (2020b) in which the effect of distance between plume head and plateau was investigated. Figure shows that the main controlling factors in deformation regimes are the relative locations of plateau and plume head and age of oceanic lithosphere. In these experiments the buoyancy of the plume, which can be another governing factor, was constant.
Because previous studies of plume-lithosphere interaction in which lithospheric magmatic weakening was considered ignored the effect of plate motion, Baes et al. (2021) explored the effect of plate motion on the interaction of plume and lithosphere. Results of a reference model illustrate that when a plume interacts with a moving plate, it breaks the plate and rising plume material atop the lithosphere pushes portions of the adjacent plate deeper into the mantle (Figures 9A,B). Due to plate motion, which causes asymmetrical flow of the plume head, the slab breaks off on one side of the circular trench (Figure 9C). Subduction continues on the other side where the downgoing slab is still attached to the surface plate (Figure 9D). Outcomes of a similar model but with a stationary plate show that plume-lithosphere interaction leads to multi-slab subduction initiation (Figures 9E–H). In the case of older, stronger plates, a more buoyant plume is required to break the lithosphere and initiate subduction (a more buoyant plume was modelled by considering higher plume temperature). Interaction of more buoyant plume with older lithosphere causes asymmetric cylindrical subduction (Figure 9I). Sensitivity analysis of model parameters show that where subduction does not start, the effect of plate motion is still recognizable because this changes the shape of the newly formed plateau from circular to ellipsoidal.
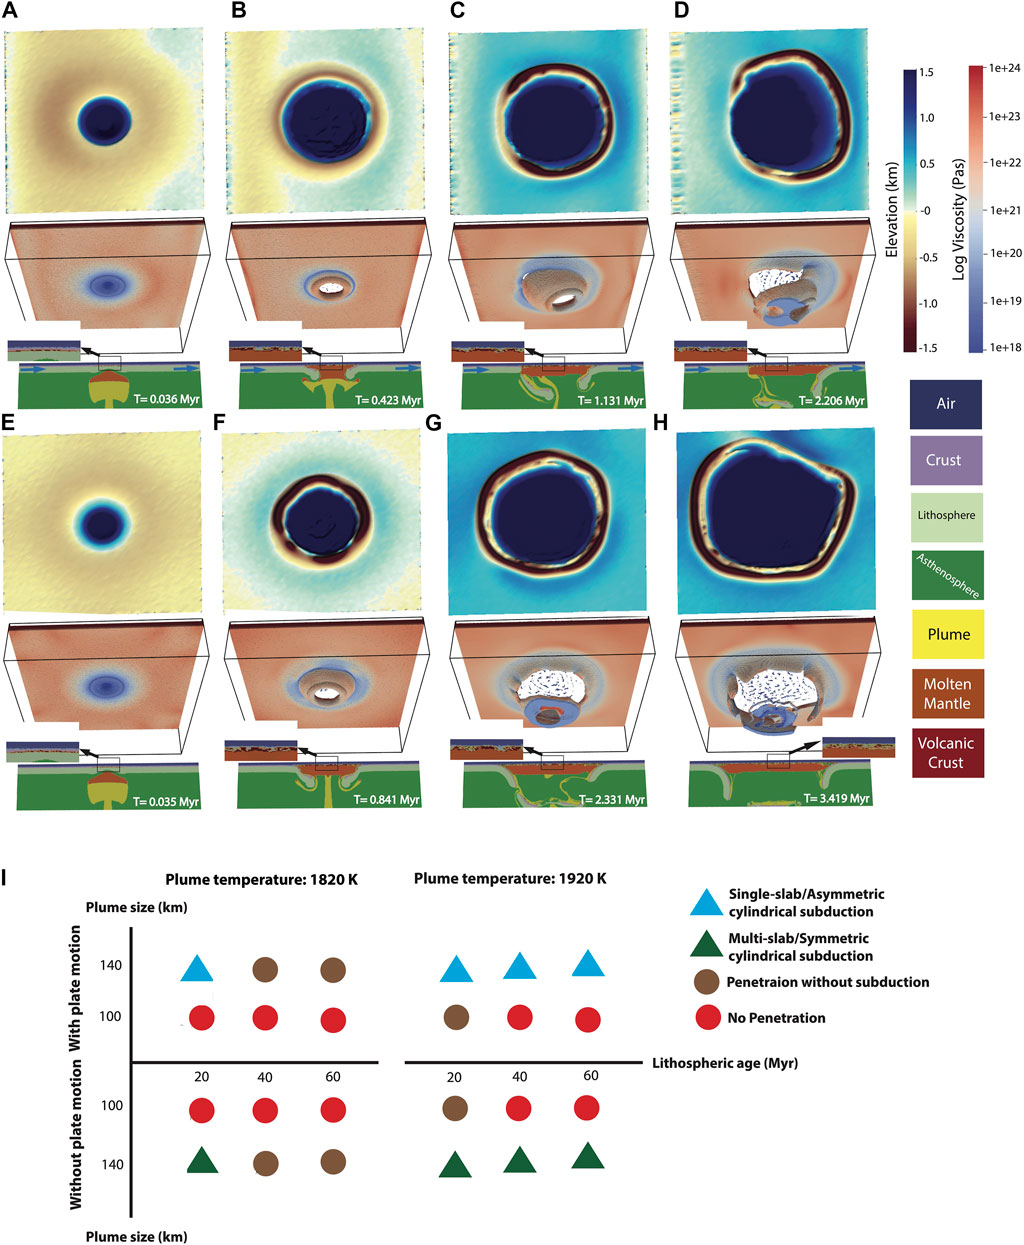
FIGURE 9. Effect of plate motion on plume-lithosphere interaction (Baes et al., 2021). (A–D) Results of reference model of Baes et al. (2021) with 20 Myr oceanic lithosphere and a plume head with temperature excess of 200 K and head size of 140 km. This model shows that plate motion can cause asymmetric flow of the rising plume which causes slab break-off from one side of the circular trench. (E–H) Results of a model which is similar to that in (A–D) but without moving plate. The upper, middle and lower panels stand for surface topography (top view), viscosity field of lithosphere and compositional field (color codes as shown on the bottom-right side of figure) of a 2D cross-section through the model center, respectively. Insets zoom in on the uppermost lithosphere above the plume head. Blue arrows in lower panels of (A–D) indicate the direction of plate motion. (I) Summary of model results of Baes et al. (2021) showing that plate motion can cause either single-slab or asymmetrical cylindrical subduction.
Using 3D spherical modeling of mantle convection self-generating plate-like tectonics, Rodriguez et al. (2021), investigated plume-induced subduction initiation at the global scale. Their results reveal that PISI occurs about every 100 Myr on average. They identified three favorable conditions for PISI: 1) arrival of a plume head below an asymmetrically spreading ridge can promote instability due to preferential thermal erosion of one plate by the plume head (Figure 10A). 2) interaction of a mantle plume head with young but subductable oceanic lithosphere near the ridge can further thin the oceanic lithosphere to trigger subduction (Figure 10B). 3) impingement of a mantle plume head on thick lithosphere (away from a mid-oceanic ridge) can locally weaken the lithosphere to trigger a new subduction zone (Figure 10C). Rodriguez et al. (2021) indicated that curved trenches associated with either single or multiple slabs retreat at a rate of ∼5–10 cm/yr. The lifetime of these new subduction zones varies between a few to more than 100 Myr. The authors noted that two different interactions of subduction with a mantle plume head are recognized in their models: 1) when a retreating slab interacts with a pre-existing plume, the slab splits into two segments, allowing the plume to continue to rise (Figure 10D). 2) when plume-induced subduction is so fast that it hinders plume upwelling for ∼10 Myr, this is followed by slab segmentation (Figure 10E).
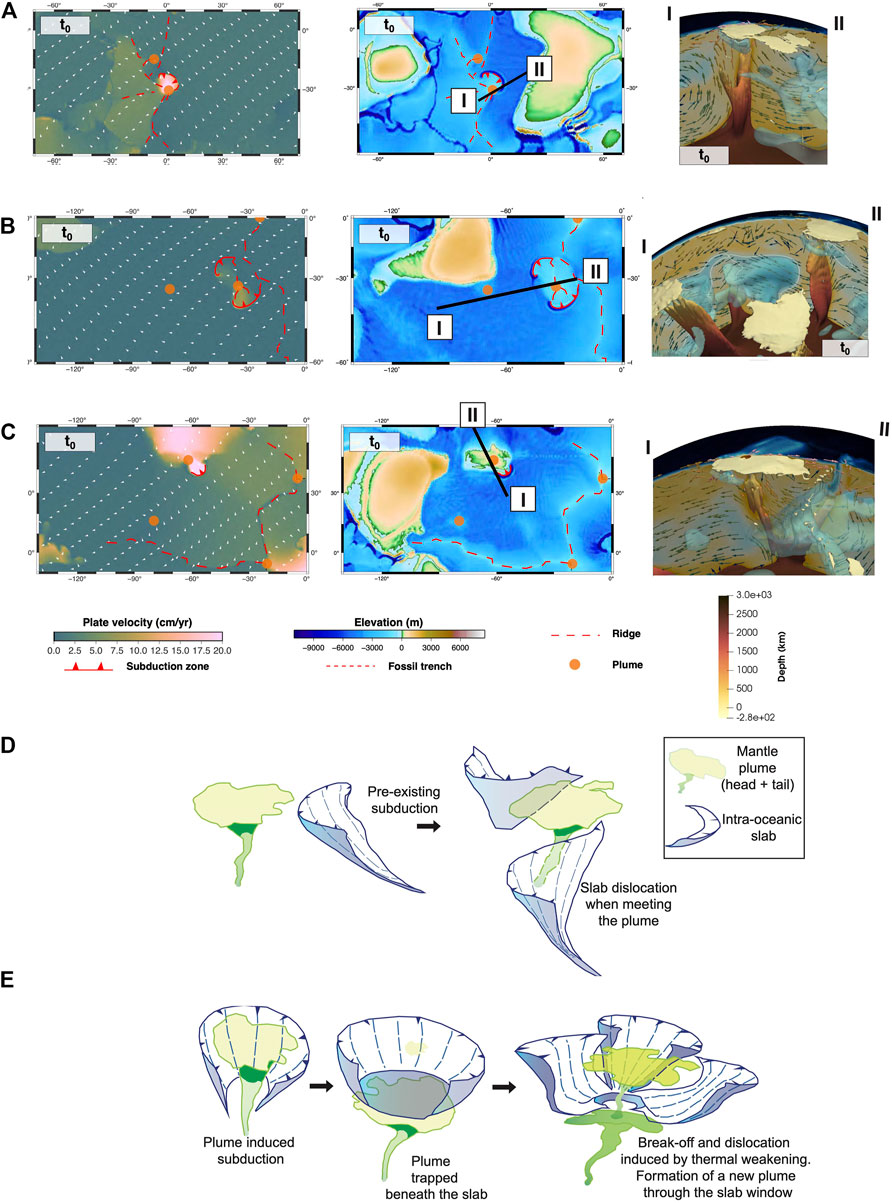
FIGURE 10. Model results of Rodriguez et al. (2021). (A–C) Three facilitating conditions for plume-induced subduction initiation obtained from 3D mantle convection models: (A) interaction of a plume head with young oceanic lithosphere close to an asymmetric spreading ridge results in initiation of semi-circular subduction, (B) impingement of a plume head on young and thin lithosphere near a ridge initiates two-lobe-shaped subduction, (C) a one-sided arcuate trench initiates near a plume head located away from a plate-boundary. In all panels (A–C), (1) shows surface velocity map, (2) illustrates surface view of plate boundary configurations and (3) displays 3D cross sections of the plume-induced subduction system. (D–E) Schematic illustration of two different interactions between plume and subduction: (D) when subduction hits a plume, the slab splits into several segments, and (E) plume-induced subduction can hinder the plume from rising for a few million years which is followed by division of the subducted slab into several segments in order to allow resumption of plume upwelling. Figures are modified from Rodriguez et al. (2021).
Plume-induced subduction on Venus was investigated using analogue modeling by Davaille et al. (2017). By drying colloidal solutions from above, simulating lithospheric cooling, a skin of denser layer compared to the underlaying materials formed which resembled lithosphere. The tank of colloidal fluid was heated from below to form upwelling plumes. Similar to numerical modeling results, the analogue models show formation of several retreating slab segments around the circular plume head rim (Figures 11A–D). The models showed that following plume head rise, the lithosphere flexes upwards, causing extension (Figure 11E1). Lithosphere breaks due to its reduced strength in tension, leading to rifting and development of radial fractures (Figure 11E2). Buoyant plume mantle and melts upwell through the fractures (Figure 11E3) causing bending and sinking of the plate into the mantle (Figure 11E4). In these experiments, subduction stops when plume upwelling ceases; subsequently, the slab is left dangling which may break off due to rehydration. The authors argued that the plume head diameter and duration of the whole process (from subduction initiation until slab dangling) could reach 500–2,500 km and 20–200 Myr, respectively. Comparing the experimental results with topography and gravitational data of two coronas on Venus, Davaille et al. (2017) concluded that their model results match well with Venusian observations, illustrating evidence of subduction initiation induced by mantle plumes on Venus.
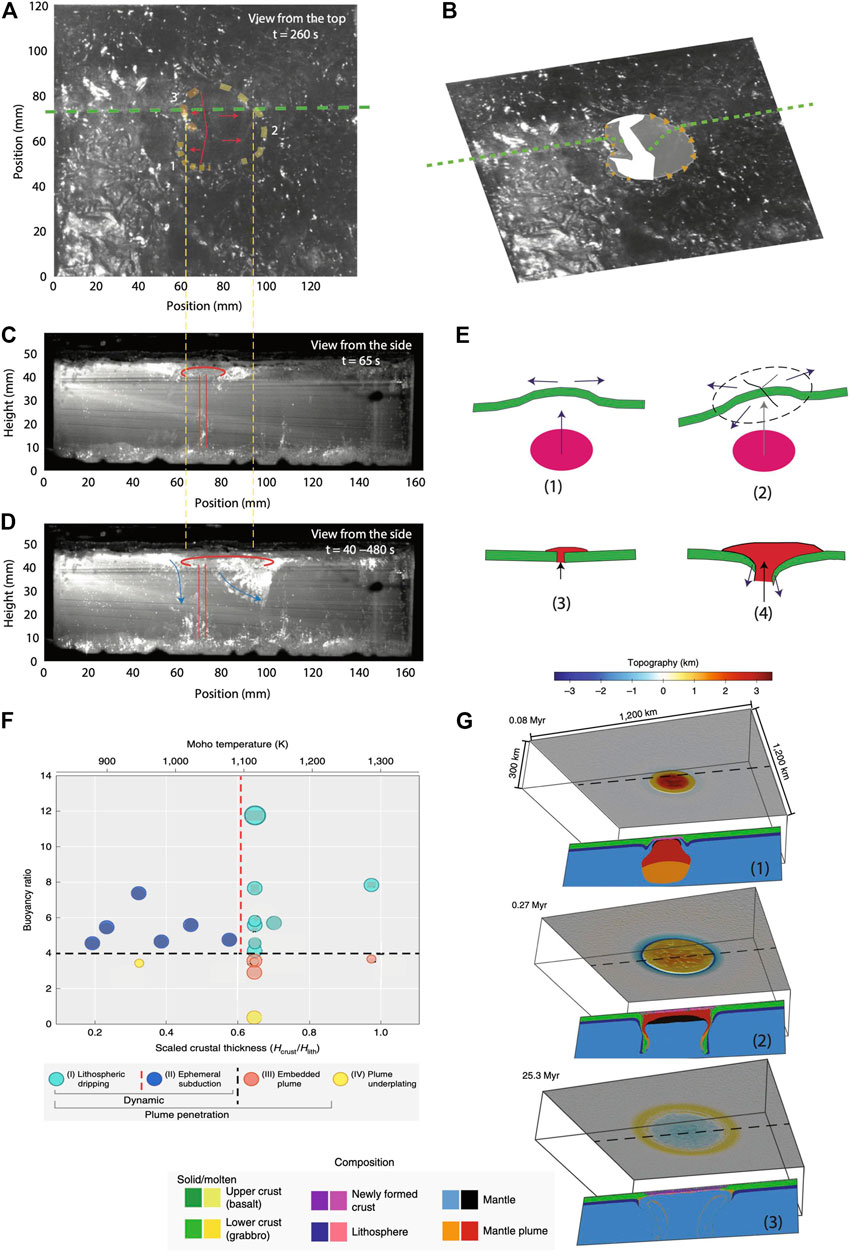
FIGURE 11. (A–E) Analogue modeling of plume-induced subduction initiation (adapted from Davaille et al., 2017). (A,B) Top views and (C,D) side views (the location of cross-section is shown by a green dashed line in (A,B)) of experimental results at different times. The red lines illustrate the plume. The numbers in (A) stand for location of three bulges which form in the model due to development of three slabs. Slabs are shown by white color in (A, C,D). The shape of three slabs which form due to plume-lithosphere interaction are shown in (C)—light grey areas. (D) The composite of 12 superimposed images taken every 40 s. (E) Schematics showing the development of plume-induced subduction. (F,G) Modeling results of Gülcher et al. (2020). (F) Dependence of different regimes on the buoyancy ratio (non-dimensional ratio of the plume buoyancy and lithospheric strength) and the scaled crustal thickness (non-dimensional ratio of crustal thickness (Hcrust) over lithospheric thickness (Hlith)). The scaled crustal thickness is analogous to the Moho temperature (top axis). Circles refer to the numerical experiments, and their relative sizes represent their relative initial plume head size. The black dashed line (buoyancy ratio of 4) separates the plume penetration regimes from regimes of no penetration, whereas the red dashed line (Tmoho ≈ 1,100 K) separates a lithospheric dripping regime from an ephemeral subduction one (in the latter, the presence of a subducting slab >0.25 Myr is required). (G) Evolution of a corona-forming model involving a lithospheric dripping regime. In (G) the upper and lower panels show surface topography and a cross-section illustrating composition taken in the center of the model (dashed line). The color codes are shown in the left bottom of the figure.
Using 3D thermomechanical numerical simulations of impingement of a thermal mantle plume on the Venusian lithosphere, Gülcher et al. (2020) studied the origin and diversity of large Venusian coronae. They systematically varied plume size and temperature, lithospheric strength, intensity of magmatic weakening and crustal thickness in their models. Their results revealed four deformation regimes: 1) lithospheric dripping, 2) ephemeral subduction, 3) embedded plume and 4) plume underplating, which all depend on plume buoyancy and the lithospheric and crustal configuration (Figure 11F). According to the results shown in Figure 11F, whether lithospheric dripping or ephemeral subduction occurs depends on crustal thickness; thinner oceanic crust could result in short-lived subduction initiation. The topographic features of these models are similar, showing initial development of an uplifted region above the plume head and formation of an outer rise surrounding the deep trench (Figure 11G shows the evolution of a model illustrating a lithospheric dripping regime). The uplifted region inverts into subsidence following dripping or slab break-off. Dripping or slab break-off is facilitated by young and warm (hence, weak) lithosphere. Plume underplating occurred in cases where the plume buoyancy was not enough to overcome lithospheric strength (Figure 11F). In these cases, the plume could not pierce the lithosphere but spreads laterally under it, resulting in lithospheric thinning and development of a plateau above the plume head without any rim or trench. In an embedded plume regime, the mantle plume partially penetrates the lithosphere but cannot cause lithosphere to sink into the mantle. The authors suggest that their results reveal dependency of different corona morphologies on various plume–lithosphere interactions as well as different stages in evolution.
4.2 Observational Evidence
4.2.1 Venusian Coronae
Venus is the most Earth-like planet in the Solar System in terms of estimated composition (Taylor, 1992), mean radius (Nimmo, 2002), partially molten iron core (Konopliv and Yoder, 1996), average surface age and volcanic and deformation features (Herrick et al., 2012). However, despite these similarities there are differences. The main differences between Venus and the present Earth are lack of water and the high surface temperature which indicates lower viscosity of the Venusian lithosphere. The average surface temperature on Venus is much higher (about 740 K) than on modern Earth (Basilevsky and Head, 2003). It is proposed that present Venus tectonics are similar to early Earth tectonics (e.g., Ueda et al., 2008 and references therein). Lack of modern plate tectonics, high surface temperature and the presence of magma layers at shallow depth in the early Earth (Harris and Bédard, 2014) are similar to modern Venus features. There are likely some differences between Venus and early Earth. For instance, estimates of surface temperature of Archean Earth range from 243 K (Eyles and Young, 1994) to 343 K (Morse and Mackenzie, 1998.) which are much less than modern Venusian surface temperatures. Localized subduction and high temperature on Venus and early Earth inhibit formation of continuous plate boundaries, possibly due to quick healing of damage along shear zones (Bercovici and Ricard, 2014).
Coronae, which are volcano-tectonic features on Venus, have an oval outline and are broadly distributed on the Venusian surface; more than 500 have been mapped. These unique features, which have diameters ranging from 60 to more than 1,000 km (e.g., Gülcher et al., 2020 and references therein), are characterized by volcanism, topographic relief and radial faults (Figure 12A). Different mechanisms have been proposed as driving mechanisms for coronae formation including small-scale upwelling (Stofan et al., 1991), delamination at the edges of upwelling or downwelling mantle (Smrekar and Stofan, 1997; Piskorz et al., 2014), pressure-release melting (Dombard et al., 2007), volcanic loading (McGovern et al., 2013), Rayleigh–Taylor instabilities (Piskorz et al., 2015) and plume-lithosphere interaction (Gerya, 2014; Gülcher et al., 2020; Davaille et al., 2017). Observations show that incipient subduction-like sites on Venus are located along arcuate trenches at the edges of the largest coronae. Numerical and analogue modeling studies show that plume-lithosphere interaction can simulate the development of Venusian coronae reasonably well (e.g., Davaille et al., 2017, Gülcher et al., 2020; Figure 12A shows observations compared with model results of Gülcher et al. (2020)). Using 3D models, Gülcher et al. (2020) showed that different corona structures may represent different styles of plume–lithosphere interactions or/and different stages in coronae evolution. They classified Venusian coronae into active and inactive (Figure 12B). An active corona is characterized by an outer trench and rise, which implies marginal subduction around an elevated interior supported by plume buoyancy. An inactive corona shows an inverted topographic profile of outer rim and inner depression linked to a thinned lithosphere. Since observations indicate young surface age, early studies on Venus tectonics proposed episodic resurfacing (e.g., Sandwell and Schubert, 1992). However, recent studies, on the basis of modeling results constrained by observations, suggest continuous as opposed to episodic resurfacing (e.g., Davaille et al., 2017; Gülcher et al., 2020).
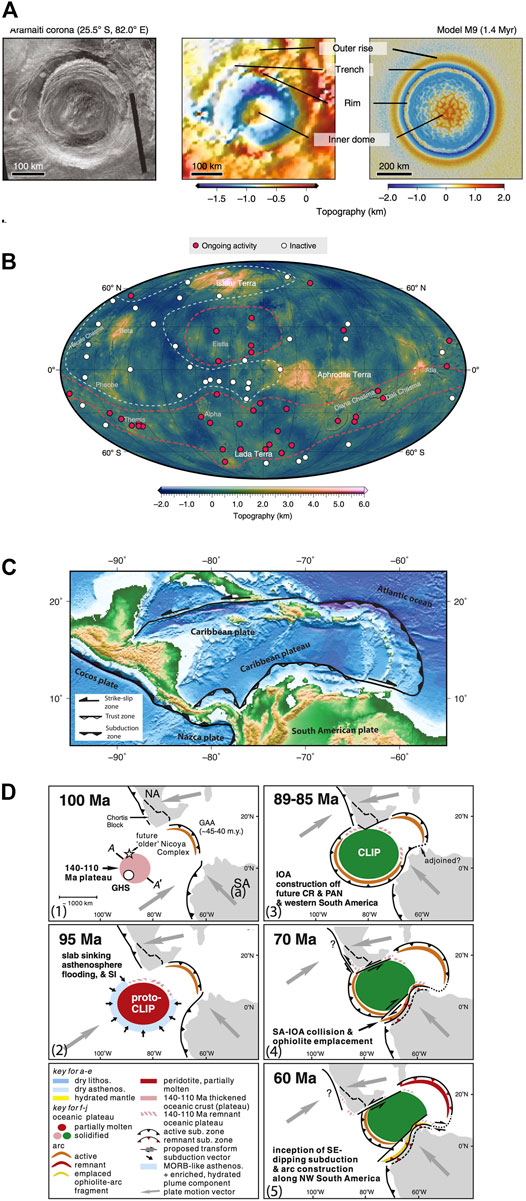
FIGURE 12. (A) Observation and numerical modeling of Venusian coronae. A typical coronae imaged by synthetic aperture radar (left), observed topography (middle) and simulated topography by numerical modeling (right). (B) Global distribution of coronae classified as inactive or active. The red and white dashed line contours represent areas of plume activity and inactivity, respectively. Panels in (A,B) are adapted from Gülcher et al. (2020). (C) Present tectonic setting of Caribbean region (adapted from Baes et al., 2020b). (D) Reconstruction of Whattam and Stern (2015). (1) Rising mantle plume beneath the Farallon plate at 140 Ma formed a small oceanic plateau at 140–110 Ma. (2) Interaction of the mantle plume with lithosphere formed a new plateau (proto Caribbean large igneous province (CLIP)). (3) Plume-induced subduction initiation led to arc construction along future Costa Rica and Panama, western South America in Ecuador and Colombia and the Leeward Antilles (Aruba and Curacao). (4,5) Collision of South America with the arc off of western South America emplaced intra-oceanic arc ophiolitic fragments (dark yellow) in Colombia and Ecuador (adapted from Whattam and Stern, 2015).
4.2.2 Caribbean
The first natural example of plume-induced subduction initiation on Earth was recognized in the Late Cretaceous Caribbean region by Whattam and Stern (2015), whom also proposed that this mechanism may have been responsible for the onset of plate tectonics on Earth. The Caribbean Plate is surrounded by the North American plate to the north and west, the South American plate to the south and east, and the Cocos and Nazca plates to the west (Figure 12C). In the east, the North and South American plates subduct under the Lesser Antilles island arc (Molnar and Sykes, 1969) whereas in the west, the Cocos plate subducts at the Middle American trench. The north and southeast plate boundaries are now mainly strike-slip. In the south and southwest, the Caribbean plate subducts under South America.
The tectonic evolution of the Caribbean region is controversial. Among the controversial issues is the origin and timing of subduction initiation to the west of the Caribbean plate. Pindell et al. (2005) proposed that this NE-dipping subduction zone initiated in an intra-oceanic environment in the Late Albian. Pindell and Kennan (2009) suggested an age of 88–80 Ma for initiation of subduction. Boschman et al. (2014) argued that most subduction zones surrounding the Caribbean plate initiated at transform faults and subduction zones in NW South American margins evolved diachronously as a result of migrating trench–trench–transform triple junctions. Using geochemical, geochronological, and isotope data, Whattam and Stern (2015) argued that the arrival of a large plume head at about 100–95 Ma formed the Caribbean Large Igneous Province (CLIP) which induced a new arcuate subduction zone along the southern, western and eastern margins of the CLIP (Figure 12D). The authors indicated that the main evidence for plume-induced subduction initiation in the Caribbean is the Cretaceous magmatic record, including overlapping isotopic compositions of post- 100 Ma plume and arc rocks in the oldest sequences. On the basis of radiometric ages of Hoernle et al. (2004) and others, Whattam and Stern (2015) noted that the Caribbean region was subject to several episodes of plume-lithosphere interaction (Figure 12D). At ∼140–110 Ma, a plume head impinged oceanic lithosphere of the Farallon Plate to form a small plateau relative to the CLIP (Figure 12D1); it is not yet clear if this event triggered a new subduction zone. The next and strongest episode began at ∼100 Ma. At this time, the rising plume-head weakened the lithosphere when it arrived at its base, leading to PISI (Figures 12D2,3). The proposed PISI model in the Caribbean (Whattam and Stern, 2015) is consistent with numerical geodynamic experiments (e.g., Ueda et al., 2008; Gerya et al., 2015). The main difference between geologic observations and numerical modeling results is that in modelling studies subduction initiates along the entire periphery of the newly formed plateau, whereas geologic observations indicate that subduction nucleated only on one side of the plume, the reason being that subduction to the SE at the Greater Antilles Arc may have been ongoing since about 120 Ma (Jolly et al., 2001). Recent numerical modeling studies suggest different causes for single-slab subduction in the Caribbean: 1) extensional regime (Baes et al., 2020a), 2) arrival of a plume head beneath the lithosphere close to the plateau-oceanic crust margin (Baes et al., 2020b) and 3) eastward motion of the Farallon plate in Late Cretaceous time (Baes et al., 2021).
4.2.3 Cascadia Subduction Zone
The Cascadia subduction zone is a ∼1,300 km long plate boundary between the Juan de Fuca, Gorda and North American plates (Figure 13A). The denser Juan de Fuca and Gorda oceanic plates subduct beneath the North American plate. Duncan (1982) proposed that subduction ceased in Eocene time, after entrance of a large oceanic plateau called Siletzia into the east-dipping Cordilleran subduction zone. This was followed by accretion of Siletzia to North America, formation of a new subduction zone to the west and initiation of a new east-dipping Cascadia subduction zone outboard of Siletzia. This scenario suggests that Cascadia subduction formed by transference (Stern, 2004) in Eocene time. Siletzia consists of a lower unit of tholeiitic basalt and upper unit of alkali basalt, extending over ∼100,000 km2 with an estimated volume of 1,700,000–2,600,000 km3. Siletzia is an example of a LIP (Large Igneous Provinces) (Wells et al., 2014) although significantly smaller than CLIP. A key question in the tectonic evolution of Siletzia is whether the plume and hotspot that created this oceanic plateau was originally offshore and then was tectonically accreted to North America (e.g., Duncan, 1982), or was magmatically emplaced in about its present position relative to western North America (Stern and Dumitru, 2019). Based on geological, petrological and geophysical data, Stern and Dumitru (2019) proposed a new hypothesis for Cascadia subduction initiation (Figure 13B). At about 65 Ma, the Farallon plate was subducting beneath the western margin of North America (Figure 13B1). Arrival of the ∼1,000 km diameter Yellowstone plume head at ∼55 Ma weakened the Farallon plate, leading to widespread extension above the plume head, cessation of Farallon plate subduction and formed Siletzia in situ on the North American margin (Figure 13B2). Lithospheric weakening on the west side of the plume head caused collapse of the Farallon plate to start the Cascadia subduction zone at 52 Ma (Figure 13B3). In this scenario, the plume head interacted with a continent-ocean boundary which is similar to models of Baes et al. (2020b). The authors suggest that magmatism above the plume head was very active at 55–50 Ma which was followed by a 30 Myr plume magmatic hiatus. They argued that such a magmatic gap could be explained by disruption of the mantle plume due to interaction with the newly subducted slab which interrupted plume upwelling and melting (Figures 13C1,2). As the new convergent plate margin became increasingly separated from the position of the Yellowstone plume—due to west-southwestward motion of North America—the plume resumed upwelling and partial melting to generate the Columbia River Basalt Group by about 17 Ma (Figures 13C3,4). Stern and Dumitru (2019) argued that their plume-induced subduction initiation hypothesis provides an integrated framework for understanding Siletzia, the Challis-Kamloops belt, Eocene core complexes from Idaho (U.S.) to British Columbia (Canada), underplated mafic rocks beneath Oregon and Washington (U.S.), post–17 Ma manifestations of the Yellowstone plume, and geophysical characteristics of the lithosphere beneath the Pacific Northwest.
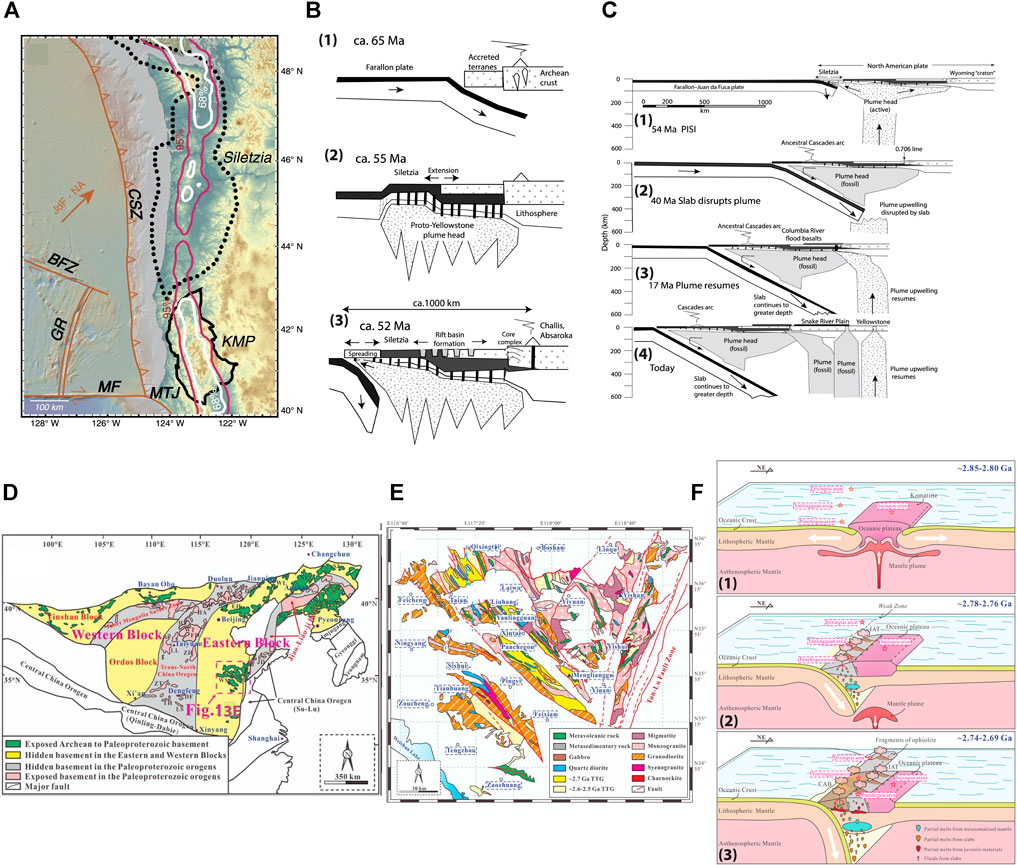
FIGURE 13. (A) Present-day tectonic setting of the Cascadia region. Klamath Mountains province (KMP) and Siletzia are shown by solid and dotted black outlines, respectively. Plate boundaries are illustrated in orange. Abbreviations: CSZ—Cascadia subduction zone, MF—Mendocino fault, GR—Gorda Ridge, BFZ—Blanco fracture zone, MTJ—Mendocino triple junction; JdF—Juan de Fuca; NA—North America (adapted from Piotraschke et al., 2015). (B) Schematic scenario of Cascadia plume-induced subduction initiation. (1) At ∼65 Ma, the Farallon plate was subducting beneath the western margin of North America, comprising Archean crust of the Wyoming craton and accreted terranes to the west. (2) Interaction of the ∼1,000 km diameter Proto-Yellowstone plume head with overlying lithosphere weakened the Farallon plate, leading to cessation of subduction and widespread extension above the plume head at ∼55 Ma. Lithospheric weakening on the western side of the plume head resulted in collapse of the Farallon plate and (3) initiation of the Cascadia subduction zone. (C) Schematic illustration of the evolution of the Cascadia margin and the Siletzia- Yellowstone plume. This panel shows freezing of plume upwelling between ∼50 and 20 Ma, due to interplay of the plume and subducting slab. Plume upwelling resumed when the slab and plume separated sufficiently due to westward motion of North America. Panels in (B,C) are adapted from Stern and Dumitru, (2019). (D) Geological map of the North China Craton. The dashed pink rectangle shows the location of (E). (E) Geological map of the Western Shandong Terrane. TTG stands for tonalitic-trondhjemitic-granodioritic pluton. (F) Schematic tectonic model of Gao et al. (2019) illustrating the tectonic evolution of the Western Shandong Terrane from (1) extension at ∼2.85–2.8 Ga (during the early stage of plume-lithosphere interaction) to (2) compression at ∼ 2.78 Ga leading to subduction initiation and (3) development of a self-sustaining subduction zone. IAT and CAB stand for island arc tholeiite and calc-alkaline basalt, respectively. Panels in (D,E) are adapted from Gao et al. (2019).
4.2.4 Eastern North China Craton
The Western Shandong terrane (WST), located in the south-eastern margin of the North China craton and western segment of the Jiao-Liao-Ji tectonic belt (Figure 13D) is the largest exposed tract of Archean crystalline basement in China (Gao et al., 2019). Observations in the NW-SE-trending Qixingtai-Yanlingguan-Panchegougranite-greenstone belt (QYPGB; Figure 13E) in the central WST reveal a komatiite-tholeiite sequence consisting of ∼2.85–2.8 Ga komatiites and ∼2.78–2.71 Ga basaltic and andesitic to dacitic volcanic rocks (Gao et al., 2019). Gao et al. (2019) argued that these volcanic rocks were derived from fractional crystallization of a parental magma formed by the partial melting of metasomatized subarc mantle wedge as well as the descending slab. They also argued that the QYPGB was under extension at ∼2.85–2.8 Ga, most likely caused by plume emplacement. Based on geological and petrological observations, Gao et al. (2019) proposed a plume-induced subduction initiation scenario for the tectonic evolution of eastern NE China at ∼2.85–2.8 Ga (Figure 13F). Arrival of a mantle plume below oceanic lithosphere at ∼2.85–2.8 Ga led to lithospheric weakening above the plume head and extensional deformation. Eruption of plume-derived komatiites and low-K tholeiites caused local crust thickening to form a large oceanic plateau (Figure 13F1). This was followed by plume-induced initiation of a SW-dipping subduction close to the location of the mantle plume (in the Panchegou and Yanlingguan areas) between ∼2.78 and 2.76 Ga (Figure 13F2). Evidence of subduction initiation include eruptions of numerous island arc tholeiites in the Panchegou and Yanlingguan areas and conversion of regional extension to shortening at ∼2.78 and 2.76 Ga. Subduction was sustained with sinking of the slab to greater depth which was accompanied by trench retreat and spreading in the back-arc (Figure 13F3). This is verified by a series of lithological assemblages of mafic cumulates, normal mid-ocean ridge basalt-like tholeiites, and island arc tholeiites, very similar to those of supra subduction zone-type ophiolites (Gao et al. (2019). One alternative scenario for subduction in this region proposes that a new eastward–dipping subduction zone on the western side of the Central Orogenic Belt formed following the arc–continent collision which led to subduction polarity reversal (Ning et al., 2020).
4.2.5 Junggar Ocean in Northwest China
The Central Asian Orogenic Belt (CAOB) is the largest accretionary orogenic belt in the world and is located between four cratons: the East European craton in the NW, the Siberian craton in the north, the Tarim craton in the S and the North China craton in the SE (Figure 14A). The CAOB formed by long-lived subduction of the Paleo-Asian Ocean (PAO) which was active from the Neoproterozoic to Early Mesozoic (Khain et al., 2003; Xiao et al., 2019; Yang et al., 2020). Using geological, geochronological and geochemical observations, Yang et al. (2020) investigated the timing and mechanism of subduction initiation in the PAO. They explored Early Paleozoic ophiolitic mélanges, calc-alkaline intrusions, and subduction-related metamorphism in southern West Junggar in eastern Kazakhstan and adjacent areas. The authors proposed that the cause of subduction initiation in the PAO was interaction of a plume with lithosphere in the Early Cambrian. According to their tectonic model, arrival of a mantle plume beneath the Junggar Ocean in the Early Cambrian weakened the overlying oceanic lithosphere and generated an oceanic plateau (Figure 14B1). A new subduction zone formed due to magmatic weakening and density contrasts between the oceanic plateau and oceanic lithosphere (Figure 14B2). Continued subduction and slab penetration deeper into the mantle was followed by underplating of mafic magmas at the base of the oceanic plateau, and metamorphism in the Middle Cambrian (Figure 14B3). Another proposed scenario for subduction initiation of the Paleo-Asian Ocean indicates that this began at ∼336 Ma along a mid-oceanic transform fault/fracture zone (Li et al., 2020).
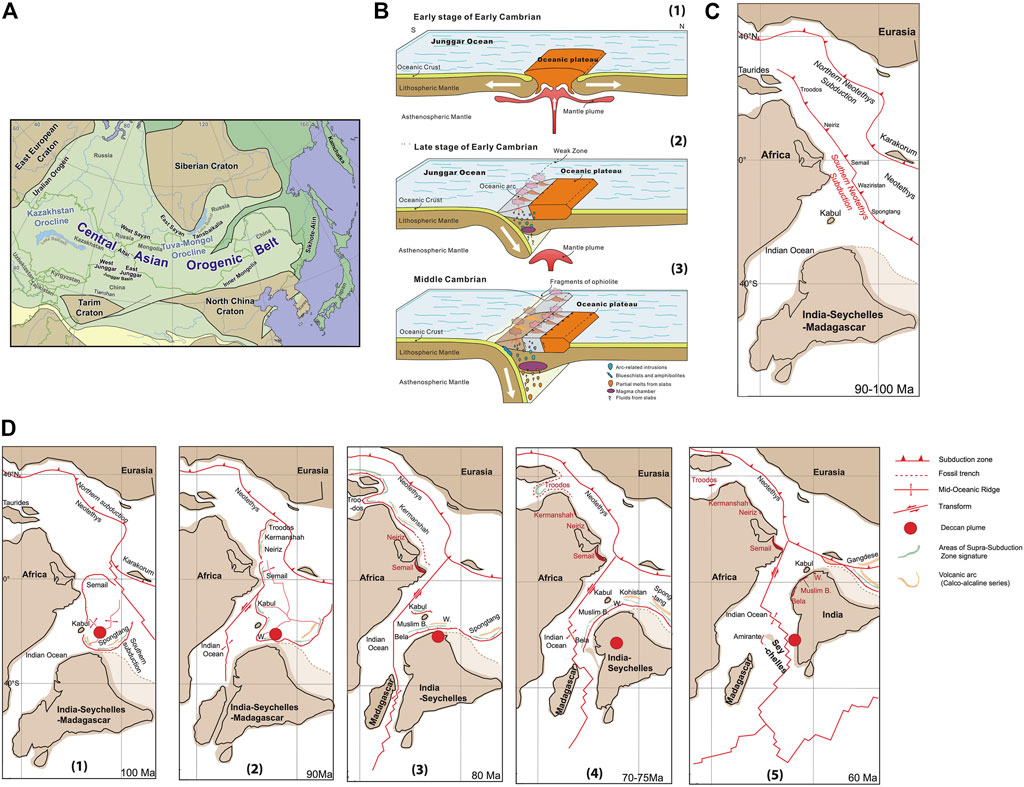
FIGURE 14. (A) Present-day tectonic setting of the Central Asian Orogenic Belt (CAOB) (adapted from Windley and Xiao, 2018). (B) Model of Yang et al., 2020 illustrating the tectonic evolution of the Junggar Ocean in the Early-Middle Cambrian. (1) Arrival of a mantle plume beneath the Junggar Ocean led to lithospheric weakening and generation of an oceanic plateau. (2) Density differences between the newly formed plateau and normal Junggar oceanic lithosphere caused initiation of a new subduction zone. (3) Subsequently, self-sustaining subduction developed (adapted from Yang et al., 2020). (C,D) Reconstruction of the Neotethys Ocean and the configuration of the Southern Neotethys Subduction (adapted from Rodriguez et al., 2021). (C) Neotethys Ocean was subducted along perhaps two major subduction zones in the north and south. (D) (1) Southern Neotethys subduction at 100 Ma, 5 Myrs after initiation induced by the Deccan Plume. (2,3) Southern Neotethys subduction at 90–80 Ma. Interactions with the Kabul Block and the India-Africa transform boundary segmented the subduction zone into three independent slabs. (3,4) Southern Neotethys at 70–60 Ma. All three subduction branches deactivated after ophiolite emplacement.
4.2.6 Neotethys Realm
The Neotethys Ocean, which was located between Laurasia and Gondwana during the Mesozoic (Gibbons et al., 2015) was subducted along perhaps two major subduction zones in the north and south (Figure 14C). Subduction initiation for the northern subduction zones does not seem to have been caused by PISI (Hu and Stern, 2020; Stern et al., 2021), but subduction initiation for the southern subduction zones (if they existed) is unclear. Different scenarios such as subduction nucleation along a mid-oceanic transform fault (Van Hinsbergen et al., 2019) and subduction initiation triggered by the Cretaceous super-plume event and its increased convective movements (Jolivet et al., 2016) have been proposed for onset of southern Neotethys subduction. Initiation of southern Neotethys subduction at ∼110–100 Ma was coeval with several important tectonic events such as cessation of eastern Gondwana subduction and the beginning of the mid-Cretaceous super-plume event (Jolivet et al., 2016; Rodriguez et al., 2021). Combining evidence from the geological record of Neotethys subduction in the Late Cretaceous with 3D spherical mantle convection modeling, Rodriguez et al. (2021) proposed that southern Neotethys subduction initiated as a result of interaction of the pre-Deccan plume with Neotethys at ∼110–100 Ma. This proposal was based on evidence of oceanic island basalt (OIB) within ophiolites that formed above the southern Neotethys subduction zone and thermal anomalies recorded in metamorphic soles below the ophiolites. Agreement between observations and modelling led Rodriguez et al. (2021) to reconstruct Neotethys subduction between 105 and 47 Ma (Figures 14C,D). According to this model, plume-induced southern Neotethys subduction zone initiated at ∼110–100 Ma (Figure 14D1). After subduction zone formation, the slab retreated with a rate of ∼5–15 cm/yr. The ring-shaped subduction then split into different segments which were subsequently redistributed within Neotethys (Figures 14D2,3). Slab segmentation may have been facilitated by slab interactions either with the Kabul block, which was a micro-continent isolated during the earliest stages of the Indian Ocean’s opening in the Jurassic (Gaina et al., 2015), or with the India-Africa transform boundary, which was active since 100–90 Ma (Rodriguez et al., 2020). Rodriguez et al. (2021) proposed that segmentation resulted in at least three independent branches of southern Neotethys subduction: 1) subduction that propagated westward along Arabia and triggered the diachronous obduction of the Semail, Kermansha-Neiriz and eventually Troodos ophiolites during the Late Cretaceous (Maffione et al., 2017), 2) subduction which retreated eastward along India and was active until the Late Paleocene–Early Eocene with the obduction of the Spongtang and Nidar ophiolites (Buckman et al., 2018) and 3) subduction zone propagation southwards between India and Kabul, which formed supra subduction zones recorded in the ophiolitic belt in a large area extending from Waziristan to Bela. These three subduction segments would have shared a common history during the first 15 Myrs of their lifetime which was followed by distinct evolutions after their separation. Rodriguez et al. (2021) suggested that segmentation of plume-induced trenches and their distribution within the Neotethys ocean acted as a driving mechanism for the 73–63 Ma plate reorganization event (Figures 14D4,5).
5 Discussion
Recent studies based on modeling and geological-geochemical observations increasingly support the importance of plume-lithosphere interactions in plate tectonics. When the first modeling study of plume-induced subduction initiation was carried out by Ueda et al. (2008) there was no support from terrestrial geological evidence. At that time, the only observational evidence was those of Venusian coronae. However, after recognition of the first strong geologic evidence for plume-induced subduction initiation in the Caribbean region by Whattam and Stern (2015), the number of studies identifying examples of plume-induced subduction initiation has been growing. The main geological observation of PISI is the magmatic record. Overlapping isotopic compositions of post plume-lithosphere interaction and arc rocks can serve as key evidence for PISI. We note that the uncertainties in observations increase in the case of ancient sites of PISI (e.g., Eastern North China craton) due to overprinting of geological records.
The PISI hypothesis highlights the ability of rising plume heads to: 1) create new subduction zones, which can evolve into new plate boundaries on modern Earth (e.g., Ueda et al., 2008; Baes et al., 2016) and 2) may have triggered the onset of plate tectonics on Earth (Gerya et al., 2015). It is generally accepted that a plume head arriving at the base of the lithosphere partially melts to produce enormous volumes of magma. These flood basalt events can break the lithosphere to start a new subduction zone. It should be noted that only the plume head rather than its thinner tail is capable of triggering the onset of new subduction zones. Even then, the plume head must be unusually powerful and other conditions must be satisfied for a new subduction zone to form. This explains the rare nature of plume-induced subduction initiation events in the geologic record (Baes et al., 2016; Rodriguez, et al., 2021).
Numerical studies provide valuable information on facilitating and hindering factors involved in plume-induced subduction initiation (Figure 15). As the first step in PISI is penetration of plume into the lithosphere, the main difficulty in the earliest stage is to reduce and overcome lithospheric strength and break the plate across a region that is broad enough to allow adjacent portions to flex down. At this stage, flexural bending, strength (age) of the lithosphere, and thickness and strength of the crust are the hindering factors. Aging of the lithosphere has a dual effect; older lithosphere is stronger, hindering subduction initiation, but it is also a facilitating factor because it is denser and thus more unstable. Plume buoyancy is a critical driving force in the PISI process. Hotter and bigger plumes ease lithosphere breakage and onset of subduction. Gravitational forces due to overriding of the plume rocks is another factor helping to bend and sink the lithosphere into the mantle. Other facilitating parameters are far-field extensional or compressional forces from neighboring plates. Pre-existing lithospheric weaknesses and particularly magmatic weakening are also critically required for plume penetration. As lithosphere breaks and sinks into the mantle, water plays a key role in lubricating the plate interface to decouple subducting and overriding plates.
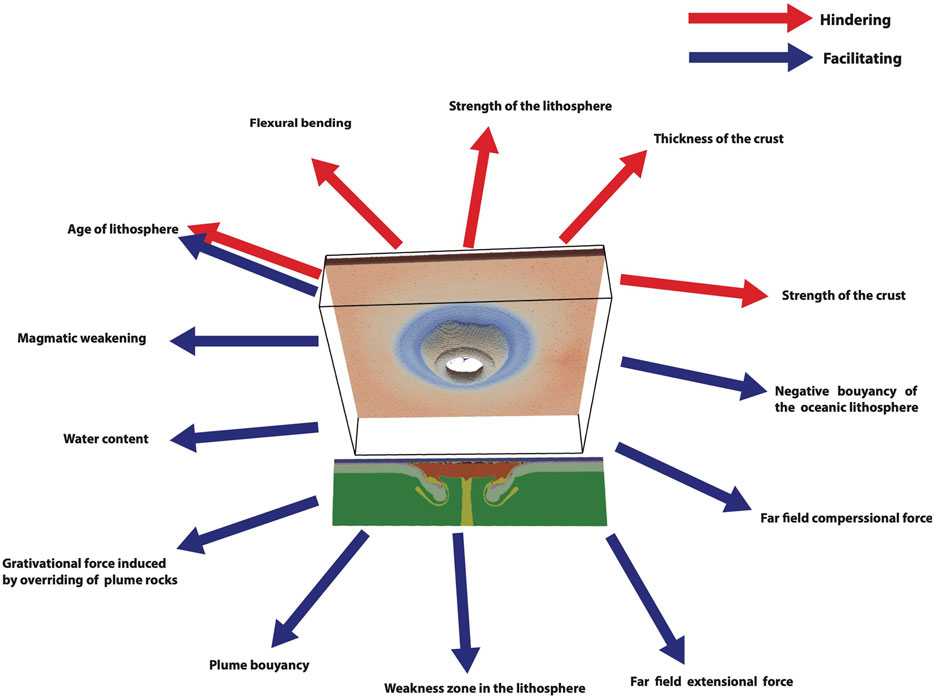
FIGURE 15. Synopsis of hindering and facilitating parameters in plume-induced subduction initiation. Note that aging of the lithosphere has a dual effect; aging increases lithospheric strength, which hinders subduction initiation, but it can also facilitate subduction initiation because it increases lithospheric density.
To investigate interaction of mantle plumes with lithosphere, two types of models have been employed: regional (e.g., Gerya et al., 2015) and global (e.g., Crameri and Tackley, 2016). Both regional and global PISI models show that subduction can be initiated in an extensional regime, similar to the result of Kemp and Stevenson (1996). It should be noted that in PISI regional models, there might be some artificial compressive stresses due to boundary conditions but they have secondary effects as the main driving force to start subduction in a PISI scenario is extension induced by plume head uprising. This can also be seen in experiments with extensional regimes which show even faster subduction initiation (e.g., Baes et al., 2020a).
Regional and global models have different strengths and weaknesses. The advantages of regional models are their higher resolution, more complex geometries and more appropriate material properties and physics (rheological stratification) of the lithosphere. The main weakness of these models are the assumed initial conditions. As these models simulate a piece of the whole Earth, caution is needed to appropriately define their initial conditions. In PISI regional models, which are the pioneering models, plume head size, shape and temperature are specified as initial conditions. These parameters should be defined based on observations or outcomes of global convection models. The other closely related weakness of these models is artificial compressive stresses due to closed box which have secondary-order effects on the results. Global 3D spherical models of convection have advantages of self-organized properties and structures of tectonic features like plumes, subduction zones and mid-oceanic ridges. As they simulate the whole Earth, they enable us to include interaction of different tectonic features in one model. This is in contrast to regional models which are able to simulate specific tectonic (not the whole) features of the Earth. The disadvantages of 3D spherical models are their lower resolution, refinement of the lithospheric rheology and lack of rheological stratification and minimal physics of the lithosphere compared to regional models. The other disadvantage of these models is that, due to self-organised tectonic structures and collective behavior, it is not easy to distinguish the effect of an individual feature on the resultant deformation regime. Despite the aforementioned differences, both regional and 3D spherical models to investigate PISI showed common results illustrating formation of a new subduction due to penetration of a plume head into the lithosphere and sinking of negatively buoyant lithosphere into the mantle.
It should be pointed out that although previous modeling studies have advanced our understanding about the central role of mantle plumes on formation of new converging plate boundaries, there is still room for further investigations. For instance, based on the model of Whattam and Stern (2015), in the Caribbean region a subduction had been ongoing along the northeastern margin of the Caribbean plateau for about 20 Myr when the Galapagos plume began to interact with the lithosphere at about 100 Ma. In modeling studies the effect of pre-existing subduction was only implicitly investigated by considering extensional regimes above the plume head associated with back-arc extension of this pre-existing subduction. Similarly, in the scenario of Stern and Dumitru (2019) the interaction of a plume head with lithosphere led to cessation of pre-existing subduction. The interaction of a plume head with a subducting slab was not studied in modeling studies. Therefore, more sophisticated modeling studies are required to address these and other unexplored cases.
There are several lines of evidence indicating that plume-lithosphere interaction was more common in the Precambrian than today (e.g., Gerya et al., 2015; Gao et al., 2019). One of the characteristics of the Precambrian is the likely existence of hotter plumes and thinner lithosphere. Geochemical observations of Precambrian greenstone belts suggest close relations between plume activity and subduction initiation (Puchtel et al., 1999; Moyen and Van Hunen, 2012; Gerya et al., 2015). Numerical models reveal that, depending on lithospheric strength and plume buoyancy, plume-lithosphere interaction in the Precambrian could have led to either plume-induced self-sustained subduction or plume-induced episodic drips (Gerya et al., 2015; Baes et al., 2020a). In either case, these were likely short-lived events (Gerya et al., 2015). These short-lived subduction zones or lithospheric drips may have facilitated lithospheric damage to start plate tectonics in accordance with Bercovici and Ricard (2014). Gerya et al. (2015) suggested that the transition from short-lived Archaean plume–induced self-sustained subduction or episodic drips to modern-style plate tectonics, which may have required secular cooling of the upper mantle, began with thickening and strengthening of the lithosphere. They also proposed that PISI could have started the first self-sustained subduction zone, triggering the onset of plate tectonics. Sobolev and Brown (2019) suggested that multiple PISI events might have dominated the tectonic regime before establishing global plate tectonics, causing episodic regional resurfacing at the Earth and production of the proto-continental crust. An alternative scenario for beginning plate tectonics was proposed by Rey et al. (2014), who suggested that gravitational spreading of continents at passive margins kick-started global plate tectonics. One of the uncertainties of this scenario is whether buoyant continental crust could have formed without plate tectonics.
The initiation of subduction alone is not necessarily indicative of the beginning of plate tectonics as modern plate tectonics is defined by the interaction of a mosaic of plates, which diverge from each other at mid-oceanic ridges and move towards each other at convergent plate margins. Numerical models show that trench retreat following PISI can produce a mosaic of new oceanic lithosphere in the back-arc region, indicating that a mantle plume could have started plate tectonics (Gerya et al., 2015). As plate tectonics began, an increasing number of plate tectonic features such as subduction zones, mid-oceanic ridges, transform faults, large-igneous provinces and plateaus created more complexity. Despite a long debate about whether lithospheric forces or mantle convection drives plate tectonics, there is common agreement among solid Earth scientists that slab pull and slab suction provide the most important driving force in the plate tectonics. This speaks to the importance of continued investigations of modeling and other studies of subduction processes from beginning to end.
Data Availability Statement
The datasets presented in this study can be found in online repositories. The names of the repository/repositories and accession number(s) can be found in the articles/Supplementary Materials of the reviewed papers in this study.
Author Contributions
MB contributed to conception and design of the study and wrote the first draft of the manuscript. RS, SW, TG, and SS helped writing the manuscript, provided comments and suggestions, and revised the manuscript.
Funding
This study was partially funded by the German Science Foundation (DFG) (Project BA 6613/2-1).
Conflict of Interest
The authors declare that the research was conducted in the absence of any commercial or financial relationships that could be construed as a potential conflict of interest.
Publisher’s Note
All claims expressed in this article are solely those of the authors and do not necessarily represent those of their affiliated organizations, or those of the publisher, the editors and the reviewers. Any product that may be evaluated in this article, or claim that may be made by its manufacturer, is not guaranteed or endorsed by the publisher.
Acknowledgments
This is UTD Geosciences contribution # 16xx. We thank Nicolas Coltice and Valentina Magni for their helpful comments that improved this manuscript.
References
Anderson, D. L. (2000). The thermal State of the Upper Mantle; No Role for Mantle Plumes. Geophys. Res. Lett. 27 (22), 3623–3626. doi:10.1029/2000GL011533
Anderson, D. L. (2005). “Scoring Hotspots: The Plume and Plate Paradigms,” in Plates, Plumes and Paradigms. Editors G. R. Foulger, J. H. Natland, D. C. Presnall, and D. L. Anderson (Boulde: Geological Society of America Special Paper), 388, 31–54. doi:10.1130/2005.2388(04)
Baes, M., Gerya, T., and Sobolev, S. V. (2016). 3-D Thermo-Mechanical Modeling of Plume-Induced Subduction Initiation. Earth Planet. Sci. Lett. 453, 193–203. doi:10.1016/j.epsl.2016.08.023
Baes, M., Govers, R., and Wortel, R. (2011). Subduction Initiation along the Inherited Weakness Zone at the Edge of a Slab: Insights from Numerical Models. Geophys. J. Int. 184, 991–1008. doi:10.1111/j.1365-246X.2010.04896.x
Baes, M., Sobolev, S., Gerya, T., Stern, R., and Brune, S. (2021). Plate Motion and Plume-Induced Subduction Initiation. Gondwana Res. 98, 277–288. doi:10.1016/j.gr.2021.06.007
Baes, M., Sobolev, S. V., Gerya, T. V., and Brune, S. (2020a). Plume-inducedsubduction Initiation: Single-Slab Ormulti-Slab Subduction. Geochemistry,Geophysics, Geosystems 21, e2019GC008663. doi:10.1029/2019GC008663
Baes, M., Sobolev, S. V., Gerya, T. V., and Brune, S. (2020b). Subduction Initiation by Plume-Plateau Interaction: Insights from Numerical Models. Geochemistry,Geophysics, Geosystems 21, e2020GC009119. doi:10.1029/2020GC009119
Baes, M., and Sobolev, S. V. (2017). Mantle Flow as a Trigger for Subduction Initiation: A Missing Element of the Wilson Cycle Conceptflow as a Trigger for Subduction Initiation: A Missing Element of the Wilson Cycle Concept. Geochem. Geophys. Geosyst. 18, 4469–4486. doi:10.1002/2017GC006962
Baes, M., Sobolev, S. V., and Quinteros, J. (2018). Subduction Initiation in Mid-ocean Induced by Mantle Suction Flow. Geophys. J. Int. 215 (3), 1515–1522. doi:10.1093/gji/ggy335
Basilevsky, A. T., and Head, J. W. (2003). The Surface of Venus. Rep. Prog. Phys. 66, 1699–1734. doi:10.1088/0034-4885/66/10/r04
Becker, T. W., and Boschi, L. (2002). A Comparison of Tomographic and Geodynamic Mantle Models. Geochemistry, Geophysics,. Geosystems 3, 2001GC000168. doi:10.1029/2001gc000168
Bercovici, D., and Ricard, Y. (2014). Plate Tectonics, Damage and Inheritance. Nature 508, 513–516. doi:10.1038/nature13072
Boschman, L. M., van Hinsbergen, D. J. J., Torsvik, T. H., Spakman, W., and Pindell, J. L. (2014). Kinematic Reconstruction of the Caribbean Region since the Early Jurassic. Earth-Science Rev. 138, 102–136. doi:10.1016/j.earscirev.2014.08.007
Buckman, S., Aitchison, J. C., Nutman, A. P., Bennett, V. C., Saktura, W. M., Walsh, J. M. J., et al. (2018). The Spongtang Massif in Ladakh, NW Himalaya: an Early Cretaceous Record of Spontaneous, Intra-oceanic Subduction Initiation in the Neotethys. Gondwana Res. 63, 226–249. doi:10.1016/j.gr.2018.07.003
Burke, K. (2011). Plate Tectonics, the Wilson Cycle, and Mantle Plumes: Geodynamics from the Top. Annu. Rev. Earth Planet. Sci. 39, 1–29. doi:10.1146/annurev-earth-040809-152521
Burke, K., and Torsvik, T. H. (2004). Derivation of Large Igneous Provinces of the Past 200 Million Years from Long-Term Heterogeneities in the Deep Mantle. Earth Planet. Sci. Lett. 227, 531–538. doi:10.1016/j.epsl.2004.09.015
Burov, E., and Cloetingh, S. (2010). Plume-like Upper Mantle Instabilities Drive Subduction Initiation. Geophys. Res. Lett. 37, L03309. doi:10.1029/2009GL041535
Burov, E., and Cloetingh, S. (2009). Controls of Mantle Plumes and Lithospheric Folding on Modes of Intraplate continental Tectonics: Differences and Similarities. Geophys. J. Int. 178, 1691–1722. doi:10.1111/j.1365-246x.2009.04238.x
Cloetingh, S., Koptev, A., Kovács, I., Gerya, T., Beniest, A., Willingshofer, E., et al. (2021). Plume-induced Sinking of Intra-continental Lithospheric Mantle: An Overlooked Mechanism of Subduction Initiation. Geochem. Geophys. Geosystems 22, e2020GC009482. doi:10.1029/2020gc009482
Cottaar, S., and Lekic, V. (2016). Morphology of Seismically Slow Lower-Mantle Structures. Geophys. J. Int. 207, 1122–1136. doi:10.1093/gji/ggw324
Courtillot, V., Davaille, A., Besse, J., and Stock, J. (2003). Three Distinct Types of Hotspots in the Earth's Mantle. Earth Planet. Sci. Lett. 205, 295–308. doi:10.1016/s0012-821x(02)01048-8
Crameri, F., and Tackley, P. (2016). Subduction Initiation from a Stagnant Lid and Global Overturn: New Insights from Numerical Models with a Free Surface. Prog. earth Planet. Sci. 3, 30. doi:10.1186/s40645-016-0103-8
Davaille, A., Smrekar, S. E., and Tomlinson, S. (2017). Experimental and Observational Evidence for Plume-Induced Subduction on Venus. Nat. Geosci 10, 349–355. doi:10.1038/ngeo2928
Davies, D. R., Goes, S., and Lau, H. C. P. (2015). Thermally Dominated Deep Mantle LLSVPs: A Review. Springer: The earth's heterogeneous mantle, 441–477. doi:10.1007/978-3-319-15627-9_14
Deschamps, F., Cobden, L., and Tackley, P. J. (2012). The Primitive Nature of Large Low Shear-Wave Velocity Provinces. Earth Planet. Sci. Lett. 349-350, 198–208. doi:10.1016/j.epsl.2012.07.012
Dombard, A. J., Johnson, C. L., Richards, M. A., and Solomon, S. C. (2007). A Magmatic Loading Model for Coronae on Venus. J. Geophys. Res. 112, E04006. doi:10.1029/2006je002731
Duarte, J. C., Rosas, F. M., Terrinha, P., Schellart, W. P., Boutelier, D., Gutscher, M.-A., et al. (2013). Are Subduction Zones Invading the Atlantic? Evidence from the Southwest Iberia Margin. Geology 41, 839–842. doi:10.1130/G34100.1
Duncan, R. A. (1982). A Captured Island Chain in the Coast Range of Oregon and Washington. J. Geophys. Res. 87, 10827–10837. doi:10.1029/JB087iB13p10827
Duncan, R. A., and Richards, M. A. (1991). Hotspots, Mantle Plumes, Flood Basalts, and True Polar Wander. Rev. Geophys. 29, 31–50. doi:10.1029/90rg02372
Dziewonski, A. M. (1984). Mapping the Lower Mantle-Determination of Lateral Heterogeneity in P-Velocity up to Degree and Order-6. J. Geophys. Res. 89, 5929e5942. doi:10.1029/jb089ib07p05929
Eyles, N., and Young, G. M. (1994). “Geodynamic Controls on Glaciation in Earth History,” in Intern. Geol. Correl. Program Project 260 Earth’s Glacial Record. Editors M. Deynoux, J. M. G. Miller, E. W. Domack, N. Eyles, I. J. Fairchild, and G. M. Young, (Cambridge: Cambridge Univ. Press), 1–28. doi:10.1017/cbo9780511628900.002
Gaina, C., van Hinsbergen, D. J. J., and Spakman, W. (2015). Tectonic Interactions between India and Arabia since the Jurassic Reconstructed from marine Geophysics, Ophiolite Geology, and Seismic Tomography. Tectonics 34, 875–906. doi:10.1002/2014TC003780
Gao, L., Liu, S., Zhang, B., Sun, G., Hu, Y., and Guo, R. (2019). A Ca. 2.8‐Ga Plume‐Induced Intraoceanic Arc System in the Eastern North China Craton. Tectonics 38, 1694–1717. doi:10.1029/2018tc005432
Gerya, T. V. (2014). Plume-induced Crustal Convection: 3D Thermomechanical Model and Implications for the Origin of Novae and Coronae on Venus. Earth Planet. Sci. Lett. 391, 183–192. doi:10.1016/j.epsl.2014.02.005
Gerya, T. V., Stern, R. J., Baes, M., Sobolev, S. V., and Whattam, S. A. (2015). Plate Tectonics on the Earth Triggered by Plume-Induced Subduction Initiation. Nature 527, 221–225. doi:10.1038/nature15752
Gibbons, A. D., Zahirovic, S., Müller, R. D., Whittaker, J. M., and Yatheesh, V. (2015). A Tectonic Model Reconciling Evidence for the Collisions between India, Eurasia and Intra-oceanic Arcs of the central-eastern Tethys. Gondwana Res. 28, 451–492. doi:10.1016/j.gr.2015.01.001
Gülcher, A. J. P., Gerya, T. V., Montési, L. G. J., and Munch, J. (2020). Corona Structures Driven by Plume-Lithosphere Interactions and Evidence for Ongoing Plume Activity on Venus. Nat. Geosci. 13, 547–554. doi:10.1038/s41561-020-0606-1
Gurnis, M., Hall, C., and Lavier, L. (2004). Evolving Force Balance during Incipient Subduction. Geochem. Geophys. Geosyst. 5, 1–31. doi:10.1029/2003GC000681
Hall, C. E., Gurnis, M., Sdrolias, M., Lavier, L. L., and Müller, R. D. (2003). Catastrophic Initiation of Subduction Following Forced Convergence across Fracture Zones. Earth Planet. Sci. Lett. 212, 15–30. doi:10.1016/s0012-821x(03)00242-5
Harris, L. B., and Bédard, J. H. (2014). “Crustal Evolution and Deformation 9 in a Non-plate-tectonic Archaean Earth: Comparisons with Venus,” in Evolution of Archean Crust and Early Life, Modern Approaches in Solid Earth Sciences. Editors Y. Dilek, and H. Furnes (Springer), 7. doi:10.1007/978-94-007-7615-9_9
Herrick, R. r., Stahlke, D. L., and Sharpton, V. L. (2012). Fine-scale Venusian Topography from Magellan Stereo Data. Eos,Transactions Am. Geophys. Union. 93, 125–126. doi:10.1029/2012eo120002
Herzberg, C., and Gazel, E. (2009). Petrological Evidence for Secular Cooling in Mantle Plumes. Nature 458, 619–622. doi:10.1038/nature07857
Hoernle, K., Hauff, F., and Bogaard, P. v. d. (2004). 70 m.Y. History (139-69 Ma) for the Caribbean Large Igneous Province. Geol 32, 697–700. doi:10.1130/g20574.1
Hofmann, A. W., and White, W. M. (1982). Mantle Plumes from Ancient Oceanic Crust. Earth Planet. Sci. Lett. 57, 421–436. doi:10.1016/0012-821x(82)90161-3
Hu, H., and Stern, R. J. (2020). Early Cretaceous Subduction Initiation beneath Southern Tibet Caused the Northward Flight of India. Geosci. Front. 11, 1123–1131. doi:10.1016/j.gsf.2020.01.010
Jolivet, L., Faccenna, C., Agard, P., Frizon de Lamotte, D., Menant, A., Sternai, P., et al. (2016). Neo-Tethys Geodynamics and Mantle Convection: from Extension to Compression in Africa and a Conceptual Model for Obduction. Can. J. Earth Sci. 53, 1190–1204. doi:10.1139/cjes-2015-0118
Jolly, W. T., Lidiak, E. G., Dickin, A. P., and Wu, T. -W. (2001). Secular Geochemistry of Central Puerto Rican Island Arc Lavas: Constraints on Mesozoic Tectonism in the Eastern Greater Antilles. J. Pet. 42, 2197–2214. doi:10.1093/petrology/42.12.2197
Kemp, D. V., and Stevenson, D. J. (1996). A Tensile, Flexural Model for the Initiation of Subduction. Geophys. J. Int. 125, 73–93. doi:10.1111/j.1365-246x.1996.tb06535.x
Khain, E., Bibikova, E. V., Salnikova, E. B., Kröner, A., Gibsher, A. S., Didenko, A. N., et al. (2003). The Palaeo-Asian Ocean in the Neoproterozoic and Early Palaeozoic: New Geochronologic Data and Palaeotectonic Reconstructions. Precambrian Res. 122, 329–358. doi:10.1016/s0301-9268(02)00218-8
Konopliv, A. S., and Yoder, C. F. (1996). Venusiank2tidal Love Number from Magellan and PVO Tracking Data. Geophys. Res. Lett. 23, 1857–1860. doi:10.1029/96gl01589
Lebrun, J.-F., Lamarche, G., and Collot, J.-Y. (2003). Subduction Initiation at a Strike-Slip Plate Boundary: The Cenozoic Pacific-Australian Plate Boundary, South of New Zealand. J. Geophys. Res. 108, 2453. doi:10.1029/2002JB002041
Lévy, F., and Jaupart, C. (2012). The Initiation of Subduction by Crustal Extension at a continental Margin. Geophys. J. Int. 188, 779–797. doi:10.1111/j.1365-246X.2011.05303.x
Li, D., Chen, Y., Xue, G., Kang, H., Yu, Y., Geng, J., et al. (2020a). Initiation of Modern-Style Subduction in the Neoarchean: From Plume to Subduction with Frequent Slab Break-Off. GSA Bull. 132, 2119–2134. doi:10.1130/B35522.1
Li, Y., Wang, G., Santosh, M., Wang, J., Dong, P., and Li, H. (2020b). Subduction Initiation of the SE Paleo-Asian Ocean: Evidence from a Well Preserved Intra-oceanic Forearc Ophiolite Fragment in central Inner Mongolia, North China. Earth Planet. Sci. Lett. 535, 116087. doi:10.1016/j.epsl.2020.116087
Lithgow-Bertelloni, C., and Richards, M. A. (1998). The Dynamics of Cenozoic and Mesozoic Plate Motions. Rev. Geophys. 36, 27–78. doi:10.1029/97rg02282
Lu, G., Kaus, B. J. P., Zhao, L., and Zheng, T. (2015). Self-consistent Subduction Initiation Induced by Mantle Flow. Terra Nova 27, 130–138. doi:10.1111/ter.12140
Maffione, M., van Hinsbergen, D. J. J., de Gelder, G. I. N. O., van der Goes, F. C., and Morris, A. (2017). Kinematics of Late Cretaceous Subduction Initiation in the Neo-Tethys Ocean Reconstructed from Ophiolites of Turkey, Cyprus, and Syria. J. Geophys. Res. Solid Earth 122, 3953–3976. doi:10.1002/2016JB013821
McGovern, P. J., Rumpf, M. E., and Zimbelman, J. R. (2013). The Influence of Lithospheric Flexure on Magma Ascent at Large Volcanoes on Venus. J. Geophys. Res. Planets 118, 2423–2437. doi:10.1002/2013je004455
McKenzie, D. P. (1977). “The Initiation of Trenches: A Finite Amplitude Instability,” in Island Arcs, Deep Sea Trenches and Back-Arc basinsAmerican Geophysical Union. Editors M. Talwani, and W. Pitman (New York, NY: Maurice Ewing Series), 1, 57–61. doi:10.1029/me001p0057
Memiş, C., Göğüş, O. H., Uluocak, E. S., Pysklywec, R., Keskin, M., Şengör, A. M. C., et al. (2020). Long Wavelength Progressive Plateau Uplift in Eastern Anatolia since 20 Ma: Implications for the Role of Slab Peel Back and Break off. Geochem. Geophys. Geosystems 212, e2019GC008726. doi:10.1029/2019GC008726
Molnar, P., and Sykes, L. R. (1969). Tectonics of the Caribbean and Middle America Regions from Focal Mechanisms and Seismicity. Geol. Soc. America Bull. 80, 1639–1684. doi:10.1130/0016-7606(1969)80[1639:totcam]2.0.co;2
Montelli, R., Nolet, G., Dahlen, F. A., Masters, G., Engdahl, E. R., and Hung, S.-H. (2004). Finite-frequency Tomography Reveals a Variety of Plumes in the Mantle. Science 303, 338–343. doi:10.1126/science.1092485
Morgan, W. J. (1971). Convection Plumes in the Lower Mantle. Nature 230, 42–43. doi:10.1038/230042a0
Morse, J. W., and Mackenzie, F. T. (1998). Hadean Ocean Carbonate Geochemistry. Aquat. Geochem. 4 (3-4), 301–319. doi:10.1023/a:1009632230875
Mortimer, N., Campbell, H. J., Tulloch, A. J., King, P. R., Stagpoole, V. M., Wood, R. A., et al. (2017). Zealandia: Earth's Hidden Continent. Gsat 27, 27–35. doi:10.1130/GSATG321A.1
Moyen, J.-F., and Van Hunen, J. (2012). Short-term Episodicity of Archaean Plate Tectonics. Geology 40, 451–454. doi:10.1130/g322894.1
Mueller, S., and Phillips, R. J. (1991). On the Initiation of Subduction. J. Geophys. Res. 96, 651–665. doi:10.1029/90jb02237
Nikolaeva, K., Gerya, T. V., and Marques, F. O. (2010). Subduction Initiation at Passive Margins: Numerical Modeling. J. Geophys. Res. 115. doi:10.1029/2009JB006549
Nimmo, F. (2002). Why Does Venus Lack a Magnetic Field. Geol 30, 987–990. doi:10.1130/0091-7613(2002)030<0987:wdvlam>2.0.co;2
Ning, W., Kusky, T., Wang, J., Wang, L., Deng, H., Polat, A., et al. (2020). From Subduction Initiation to Arc-Polarity Reversal: Life Cycle of an Archean Subduction Zone from the Zunhua Ophiolitic Mélange, North China Craton. Precambrian Res. 350, 105868. doi:10.1016/j.precamres.2020.105868
Pindell, J., and Kennan, L. (2009). “Tectonic Evolution of the Gulf of Mexico, Caribbean and Northern South America in the Mantle Reference Frame: an Update,” in The Geology and Evolution of the Region between North and South America. Editors K. James, M. A. Lorente, and J. Pindell (London: Geological Society of London, Special Publication). doi:10.1144/sp328.1
Pindell, J., Kennan, L., Maresch, W. V., Stanek, K.-P., Draper, G., and Higgs, R. (2005). “Plate-kinematics and Crustal Dynamics of Circum-Caribbean Arc-Continent Interactions: Tectonic Controls on basin Development in Proto-Caribbean Margins,” in Caribbean–South American Plate Interactions, Venezuela. Editors H. G. Avé-Lallemant, and V. B. Sisson (Boulder: Geological Society of America), 394, 7–52. Special Paper. doi:10.1130/0-8137-2394-9.7
Piotraschke, R., Cashman, S. M., Furlong, K. P., Kamp, P. J. J., Danišík, M., and Xu, G. (2015). Unroofing the Klamaths-Blame it on Siletzia. Lithosphere 7, 427–440. doi:10.1130/L418.1
Piskorz, D., Elkins-Tanton, L. T., and Smrekar, S. E. (2014). Coronae Formation on Venus via Extension and Lithospheric Instability. J. Geophys. Res. Planets 119, 2568–2582. doi:10.1002/2014je004636
Puchtel, I. S., Hofmann, A. W., Amelin, Y. V., Garbe-Schönberg, C.-D., Samsonov, A. V., and Shchipansky, A. A. (1999). Combined Mantle Plume-Island Arc Model for the Formation of the 2.9 ga Sumozero-Kenozero Greenstone belt, Se baltic Shield: Isotope and Trace Element Constraints. Geochimica et Cosmochimica Acta 63, 3579–3595. doi:10.1016/s0016-7037(99)00111-8
Ratcliff, J. T., Bercovici, D., Schubert, G., and Kroenke, L. W. (1998). Mantle Plume Heads and the Initiation of Plate Tectonic Reorganizations. Earth Planet. Sci. Lett. 156, 195–207. doi:10.1016/s0012-821x(98)00016-8
Regenauer-Lieb, K., Yuen, D. A., and Branlund, J. (2001). The Initiation of Subduction: Criticality by Addition of Water. Science 294, 578–580. doi:10.1126/science.1063891
Rodriguez, M., Arnould, M., Coltice, N., and Soret, M. (2021). Long-term Evolution of a Plume-Induced Subduction in the Neotethys Realm. Earth Planet. Sci. Lett. 561, 116798. doi:10.1016/j.epsl.2021.116798
Rodriguez, M., Huchon, P., Chamot-Rooke, N., Fournier, M., Delescluse, M., Smit, J., et al. (2020). Successive Shifts of the India-Africa Transform Plate Boundary during the Late Cretaceous-Paleogene Interval: Implications for Ophiolite Emplacement along Transforms. J. Asian Earth Sci. 191, 104225. doi:10.1016/j.jseaes.2019.104225
Sandwell, D. T., and Schubert, G. (1992). Evidence for Retrograde Lithospheric Subduction on Venus. Science 257, 766–770. doi:10.1126/science.257.5071.766
Schuberth, B. S. A., Bunge, H. P., and Ritsema, J. (2009). Tomographic Filtering of High-Resolution Mantle Circulation Models: Can Seismic Heterogeneity Be Explained by Temperature Alone. Geochem. Geophys. Geosyst. 10, Q05W03. doi:10.1029/2009gc002401
Sleep, N. H. (2000). Evolution of the Mode of Convection within Terrestrial Planets. J. Geophys. Res. 105, 17563–17578. doi:10.1029/2000je001240
Smrekar, S. E., and Stofan, E. R. (1997). Corona Formation and Heat Loss on Venus by Coupled Upwelling and Delamination. Science 277, 1289–1294. doi:10.1126/science.277.5330.1289
Sobolev, S. V., and Brown, M. (2019). Surface Erosion Events Controlled the Evolution of Plate Tectonics on Earth. Nature 570, 52–57. doi:10.1038/s41586-019-1258-4
Sobolev, S. V., Sobolev, A. V., Kuzmin, D. V., Krivolutskaya, N. A., Petrunin, A. G., Arndt, N. T., et al. (2011). Linking Mantle Plumes, Large Igneous Provinces and Environmental Catastrophes. Nature 477, 312–316. doi:10.1038/nature10385
Stern, R. J., and Dumitru, T. A. (2019). Eocene Initiation of the Cascadia Subduction Zone: A Second Example of Plume-Induced Subduction Initiation. Geosphere 15, 659–681. doi:10.1130/ges02050.1
Stern, R. J., and Gerya, T. (2018). Subduction Initiation in Nature and Models: A Review. Tectonophysics 746, 173–198. doi:10.1016/j.tecto.2017.10.014
Stern, R. J., Moghadam, H. S., Pirouz, M., and Mooney, W. (2021). The Geodynamic Evolution of Iran. Annu. Rev. Earth Planet. Sci. 49, 9–36. doi:10.1146/annurev-earth-071620-052109
Stern, R. J. (2007). When and How Did Plate Tectonics Begin? Theoretical and Empirical Considerations. Chin. Sci Bull 52, 578–591. doi:10.1007/s11434-007-0073-8
Stern, R. (2004). Subduction Initiation: Spontaneous and Induced. Earth Planet. Sci. Lett. 226, 275–292. doi:10.1016/s0012-821x(04)00498-4
Stofan, E. R., Bindschadler, D. L., Head, J. W., and Parmentier, E. M. (1991). Corona Structures on Venus: Models of Origin. J. Geophys. Res. 96, 20933–20946. doi:10.1029/91je02218
Taylor, S. R. (1992). Solar System Evolution: A New Perspective. New York: Cambridge University Press, 307.
Ueda, K., Gerya, T., and Sobolev, S. V. (2008). Subduction Initiation by thermal-chemical Plumes: Numerical Studies. Phys. Earth Planet. Interiors 171, 296–312. doi:10.1016/j.pepi.2008.06.032
Van Hinsbergen, D. J. J., Maffione, M., Koornneef, L. M. T., and Guilmette, C. (2019). Kinematic and Paleomagnetic Restoration of the Semail Ophiolite (Oman) Reveals Subduction Initiation along an Ancient Neotethyan Fracture Zone. Earth Planet. Sci. Lett. 518, 183–196. doi:10.1016/j.epsl.2019.04.038
Van Hinsbergen, D. J. J., Steinberger, B., Guilmette, C., Maffione, M., Gürer, D., Peters, K., et al. (2021). A Record of Plume-Induced Plate Rotation Triggering Subduction Initiation. Nat. Geosci. 14, 626–630. doi:10.1038/s41561-021-00780-7
Wells, R., Bukry, D., Friedman, R., Pyle, D., Duncan, R., Haeussler, P., et al. (2014). Geologic History of Siletzia, a Large Igneous Province in the Oregon and Washington Coast Range: Correlation to the Geomagnetic Polarity Time Scale and Implications for a Long-Lived Yellowstone Hotspot. Geosphere 10, 692–719. doi:10.1130/GES01018.1
Whattam, S. A., and Stern, R. J. (2015). Late Cretaceous Plume-Induced Subduction Initiation along the Southern Margin of the Caribbean and NW South America: The First Documented Example with Implications for the Onset of Plate Tectonics. Gondwana Res. 27 (1), 38–63. doi:10.1016/j.gr.2014.07.011
White, R. S., and McKenzie, D. (1995). Mantle Plumes and Flood Basalts. J. Geophys. Res. 100, 17543–17585. doi:10.1029/95jb01585
Willbold, M., and Stracke, A. (2006). Trace Element Composition of Mantle End-Members: Implications for Recycling of Oceanic and Upper and Lower continental Crust. Geochem. Geophys. Geosyst. 7, a–n. doi:10.1029/2005GC001005
Wilson, J. T. (1963). A Possible Origin of the Hawaiian Islands. Can. J. Phys. 41, 863–870. doi:10.1139/p63-094
Wilson, J. T. (1966). Did the Atlantic Close and Then Re-open. Nature 211, 676–681. doi:10.1038/211676a0
Wilson, J. T. (1973). Mantle Plumes and Plate Motions. Tectonophysics 19, 149–164. doi:10.1016/0040-1951(73)90037-1
Windley, B. F., and Xiao, W. (2018). Ridge Subduction and Slab Windows in the Central Asian Orogenic Belt: Tectonic Implications for the Evolution of an Accretionary Orogen. Gondwana Res. 61, 73–87. doi:10.1016/j.gr.2018.05.003
Xiao, W. J., Song, D. F., Windley, B. F., Li, J., Han, C., Wan, B., et al. (2019). Research Progresses of the Accretionary Processes and Metallogenesis of the Central Asian Orogenic Belt. Sci. China Earth Sci. 63 (3), 329–361. doi:10.1007/s11430-019-9524-6
Yang, G., Li, Y., Tong, L., Wang, Z., and Si, G. (2020). An Early Cambrian Plume-Induced Subduction Initiation Event within the Junggar Ocean: Insights from Ophiolitic Mélanges, Arc Magmatism, and Metamorphic Rocks. Gondwana Res. 88, 45–66. doi:10.1016/j.gr.2020.07.002
Zhong, X., and Li, Z. H. (2019). Forced Subduction Initiation at Passive Continental Margins: Velocity‐Driven versus Stress‐Driven. Geophys. Res. Lett. 46, 11054–11064. doi:10.1029/2019GL084022
Keywords: plume head, lithospheric weakening, plume-induced subduction initiation, modeling studies, geological observations
Citation: Baes M, Stern RJ, Whattam S, Gerya TV and Sobolev SV (2021) Plume-Induced Subduction Initiation: Revisiting Models and Observations. Front. Earth Sci. 9:766604. doi: 10.3389/feart.2021.766604
Received: 29 August 2021; Accepted: 15 October 2021;
Published: 15 November 2021.
Edited by:
Fabio Crameri, University of Oslo, NorwayReviewed by:
Nicolas Coltice, École Normale Supérieure, FranceValentina Magni, University of Oslo, Norway
Copyright © 2021 Baes, Stern, Whattam, Gerya and Sobolev. This is an open-access article distributed under the terms of the Creative Commons Attribution License (CC BY). The use, distribution or reproduction in other forums is permitted, provided the original author(s) and the copyright owner(s) are credited and that the original publication in this journal is cited, in accordance with accepted academic practice. No use, distribution or reproduction is permitted which does not comply with these terms.
*Correspondence: Marzieh Baes, YmFlc0BnZW93aS51bmktaGFubm92ZXIuZGU=