 Mingjun Zhou
 Zhenming Shi1,2
 Kahlil Fredrick E. Cui
 Ming Peng
- 1Key Laboratory of Geotechnical and Underground Engineering of Ministry of Education, Tongji University, Shanghai, China
- 2Department of Geotechnical Engineering, College of Civil Engineering, Tongji University, Shanghai, China
- 3Key Laboratory of Mountain Hazards and Earth Surface Process, Institute of Mountain Hazards and Environment, Chinese Academy of Sciences, Chengdu, China
- 4University of Chinese Academy of Sciences, Beijing, China
Research on the factors and mechanisms that influence outburst floods are essential for estimating outflow hydrographs and the resulting inundation. In this study, large flume tests are conducted to investigate the effects of the upstream inflow and the presence of loose erodible deposits on the breaching flow and the subsequent outburst floods. Experimental results reveal that hydrographs of the breaching flow and outburst flood can be divided into three stages where each stage is separated by inflection points and peak discharges. It is found that the larger the inflow discharge, the larger the peak discharge of the outburst flood and the shorter the time needed to reach the peak and inflection discharges of the outburst flood. The breaching flow decreases along the longitudinal direction at rates that increase with the inflow discharge. The ratio between the length of the upstream dam shoulder and the dam width is inversely related to the ratio of the outburst discharge to inflow discharge. We also show that the presence of loose deposits at the dam toe can amplify the peak discharge of outburst flood by increasing the solids content of the water flow.
Introduction
Landslide dams are massive blockages of river channels resulting from mass Earth movements (Costa and Schuster, 1988; Casagli et al., 2003) including earthquakes (Zheng H et al., 2021). The structural failure of these dams, oftentimes due to overtopping (Shen et al., 2020a; Shen et al., 2020b; Zheng Y et al., 2021), result to flooding that can lead to casualties and destroy downstream infrastructures (King et al., 1989; Cui et al., 2013; Zhou et al., 2013; Xiong et al., 2020). Outburst flooding events are also agents of large-scale geomorphic change (Fan et al., 2019; Liu et al., 2019; Fan et al., 2020) that influence river evolution over timescales of 104–105 years in mountain terrains, e.g., Baimakou landslide dam (Korup, 2006; Korup et al., 2010; Walsh et al., 2012; van Gorp et al., 2016; Liu et al., 2018). A better understanding of the flooding induced by landslide dam failure is important for the prediction and mitigation this mountain disaster.
Previous statistical analysis have found that the outburst discharge of landslide dam failure is a function of the dam geometry (dam height) and dammed lake properties (water level, lake volume) (e.g., Kirkpatrick, 1977; Singh and Snorrason, 1984; Costa, 1985; Webby, 1996; Pierce et al., 2010; Peng and Zhang, 2012; Liu et al., 2019). However, landslide dam failure events often occur in mountainous areas where field measurement data are difficult to obtain. This is why predictions of outburst flood discharge in the downstream area by statistical analysis significantly deviate (at times in orders of hundreds) from measured data (Zhou M.J. et al., 2019). In order to supplement our knowledge on the mechanisms of landslide dam breaching and its outburst flooding, well-controlled experiments of landslide dam breaching are conducted to understand the effects of the dam geometry (e.g., Davies et al., 2007; Cao et al., 2011; Chen et al., 2012; Walder et al., 2015; Yang et al., 2015; Jiang and Wei, 2020; Zhu et al., 2020), soil material characteristics (e.g., Cao et al., 2011; Jiang et al., 2018b; Xiong et al., 2018; Zhu et al., 2020), initial moisture content (e.g., Chen S.C. et al., 2015; Jiang et al., 2020) and river channel slopes (e.g., Jiang et al., 2020; Zhu et al., 2020). Recently, external boundary effects such as seismic perturbations (e.g., Shi et al., 2014), surging (e.g., Peng et al., 2019) and cascading failures (e.g., Zhou et al., 2013; Shi et al., 2015; Zhou et al., 2015), etc. on landslide dam outburst have also been investigated. However, despite the recent advances in the research of landslide dam breaching, our understanding of the influence of parameters such as the upstream inflow and the presence of loose deposit (Zhou G.G.D. et al., 2019; Zhou M.J. et al., 2019; Jiang et al., 2020) remain incomplete. Field evidence from the Hsialin landslide dam failure (Dong et al., 2011; Li et al., 2011) and Zhouqu landslide dam cascading failure (Cui et al., 2013) suggest that both of the abovementioned parameters may have important impacts on the peak discharge in the downstream area.
The influence of inflow discharge on the outburst flood cannot be separated from the breaching flow. Breaching flow refers to the water flow at the top of the dam and along the dam’s surface while the outburst flood is the flow that reaches the downstream area of the dam. In previous studies, the breaching flow is assumed to be uniform and steady so as to facilitate the rapid assessment of landslide dam disasters (e.g., Chang and Zhang, 2010; Wu, 2013; Chen Z.Y. et al., 2015; Zhong et al., 2018; Zhang et al., 2020; Zhong et al., 2020). In such cases, the change in the flow rate in the dammed reservoir is equivalent to the outburst flood and it will not change along the dam longitudinal direction. In reality however, local blockages resulting from dam surface instabilities may hinder the upstream flow to proceed further downstream (Figure 1). This consequently results to inhomogeneous discharge measurements at different points along the dam surface. Furthermore, recent field observations and physical modelling tests also reveal that dam breaching flow are not steady but are turbulent and unsteady (Jiang et al., 2017; Jiang et al., 2020). These observations indicate that the overtopping flow cannot be consistent throughout the entire dam body. Therefore, it is still unclear how the upstream inflow affects the spatial evolution of the breaching discharge as well as the downstream outburst flood.
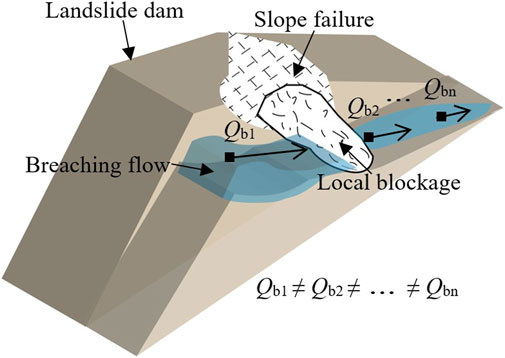
FIGURE 1. The sketch of the variation of dam breaching discharge along the longitudinal direction during side slope failures.
The flooding further downstream can also be affected by the presence of loose deposits behind the dam. There are two main ideas on the influence of loose deposit on the outburst discharge. One of which suggests that the loose deposits behind landslide dams serve as a rough contact surface which dissipates the kinetic energy of the water flow, effectively providing resistance to the flow motion thereby slowing it down (Bellos et al., 1992; Wu, 2007; Wu, 2013). Another reasoning is that the entrained loose granular materials increase the flood volume and potential energy, consequently improving the mobility of the solid-fluid mixture flow (Fannin and Wise, 2001; Wang et al., 2003; Breien et al., 2008). Although, bed-sediment entrainment by dry granular avalanches are often accompanied by increased flow-front speeds and further run-out distances (Mangeney et al., 2007), they have limited relevance to sediment flows (Iverson et al., 1997; Iverson et al., 2010) and outburst floods from landslide dam failures. Therefore, it is still unclear how loose deposits behind the dam affects the resulting outburst flood.
In this work, a series of large flume tests are conducted to give a comprehensive perspective of the outburst discharge of landslide dams due to overtopping failure. Specifically, we aim to 1) study the longitudinal evolution of the breach discharge and 2) investigate the effects of different upstream inflows and the presence of loose deposits on the outburst floods. In the succeeding sections, we first detail our experimental set-up, using which we are able to capture a three stage evolution of landslide dam failure. We then present the mechanisms in which the inflow discharge affects the evolution of the breaching flow as well as the influence of the presence of loose deposits, located at the dam toe, on the outburst floods. Results of this work are expected to improve the estimation of outflow hydrographs which are useful for early warning and risk mitigation in mountainous areas.
Materials and Methods
Experimental Setup and Instrumentation
Experimental landslide dams are constructed in a large flume in the Dongchuan Debris Flow Observation and Research Station (DDFORS), Dongchuan District, Yunnan Province, China (N 26°14′30″, E103°08′11″). Two sets of tests are conducted: in the first group the inflow discharge is varied from 2.0

TABLE 1. Test program.
The flume is a straight concrete channel, inclined at 12° from the horizontal (Figure 2A) At one side of the dam, a glass window is installed that allows the observation of the longitudinal dam breach evolution (Figure 2B). The glass window is divided into sections with 6 reference lines labelled I, J, K, L, M and N (Figure 2C) where Introduction Section is 0.2 m away from the upstream dam crest. Each subsequent section is 0.2 m away from the previous section. At the lower end of the flume is a manual collection area which is 5 m away from downstream dam toe (Figure 2A). A water container, with a capacity of 12 m3, is connected to the top of the flume through a channel with rows of saw-teeth which serve to minimize turbulence and provide steady inflow for the tests (Figure 2A).
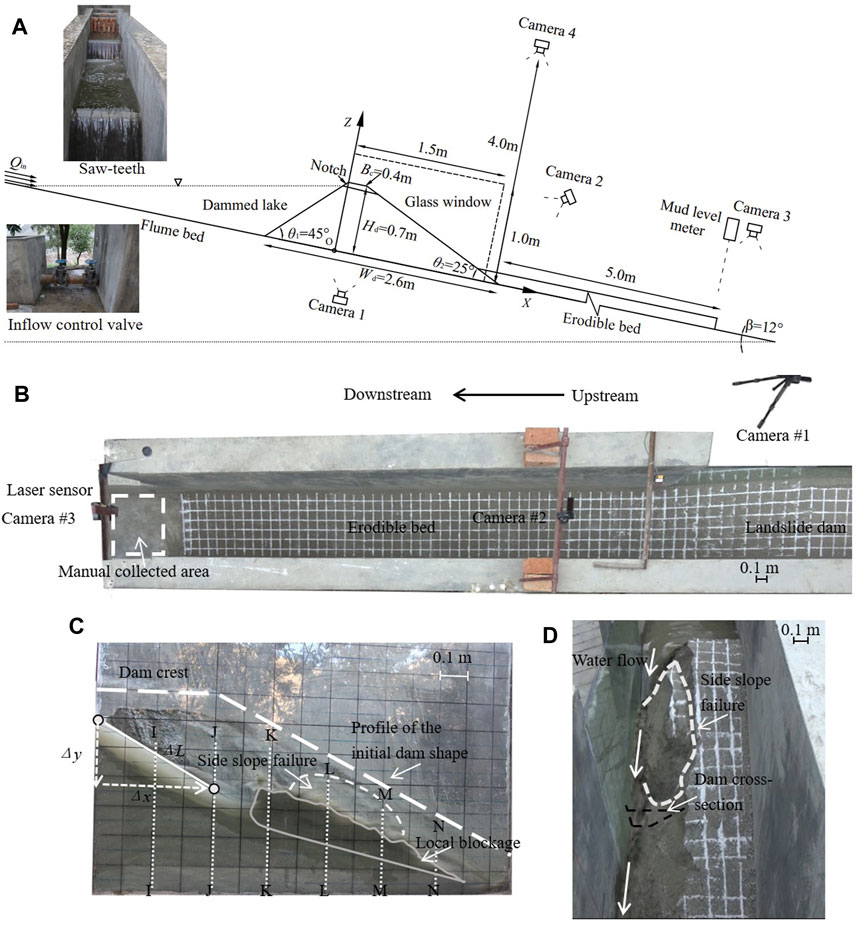
FIGURE 2. (A) Schematic diagram of the model dam with the exact dimensions (B) an illustration of the large debris flow flume in DDFORS (10 m long, 0.7 m wide and 1.4 m deep, inclined at 12° to the horizontal) as viewed from camera #4 (C) a side-view from of the model dam as viewed from the side region of the flume from the vantage point of camera #1 (D) A front view of the model dam as viewed from the downstream region of the flume by camera #2. The dam, which is built on a concrete floor, is confined by walls 0.7 m apart and 1.4 m high. In erodible bed tests, a 0.2 m thick, 5 m long flat pile is connected to the dam toe.
To capture the landslide dam breaching and outburst process, four digital video cameras (SONY FDR-AX40, 1440 × 1080 pixels, 25 fps) and a laser sensor (Leuze, ODSL 30/V-3V0 M-S12) with a resolution of ±1 mm are installed above the channel. The velocity of a tracer particle is measured as the total distance it has travelled within a pre-defined frame of reference
where the subscript
Model Design
Scaling laws play a crucial role in designing physical model tests (Iverson, 2015). For better understanding of the landslide dam failure process which involves grain-fluid mixtures, Peng and Zhang (2012) proposed a set of dimensionless numbers -
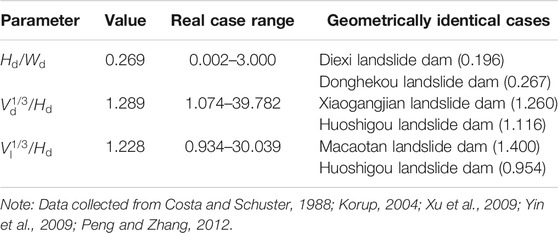
TABLE 2. Geometric characteristics of the model landslide dams.
Granular Material Used in Flume Model Test
To emulate the poorly-sorted soils of natural landslide dams, the granular materials in the Jiangjia Ravine near DDFORS, are used to construct the modeled landslide dams. Particles with diameters larger than 20 mm are removed in all tests (Figure 3). The diameters of fine particles (< 0.25 mm) are measured using a Malvern Mastersizer 2000. This device is designed to measure the size of small particles and the distribution of these sizes within a sample using laser diffraction and on known particle size distribution statistics (Malvern Instruments Ltd, 2007). Sediment samples in all experimental sets have mean grain diameters of d50 = 0.85 mm (Figure 3). The spread of the grain-size distribution is measured to be
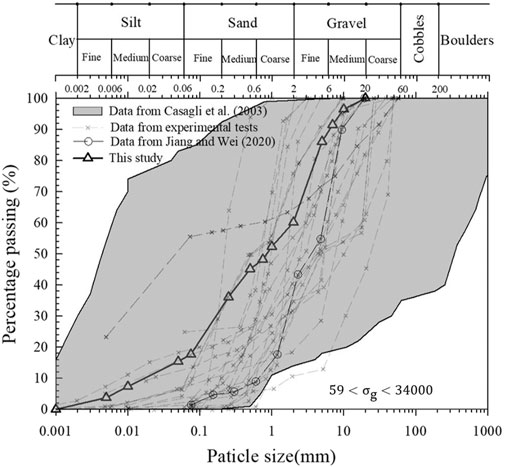
FIGURE 3. The shaded region is the cumulative grain size distribution of 42 landslide dams in the Northern Apennines (Casagli et al., 2003) and the data points marked as crosses are data from the experimental tests of Yan and Cao, 2009; Cao et al., 2011; Xu et al., 2013; Shi et al., 2014; Yang et al., 2015; Zhou et al., 2015; Jiang et al., 2017; Jiang et al., 2018a; Jiang et al., 2018b; Xiong et al., 2018; Jiang and Wei, 2020; Jiang et al., 2020; Zhu et al., 2020. The solid line represents the grain-size distribution of the modeled landslide dams.
Dam Construction
The landslide dams are constructed as follows: granular materials are well-mixed and poured from the same height onto the sloping channel. Manual compaction is done to ensure that the void ratio (0.79–0.82) of each layer is consistent with field conditions which are usually in the range of 0.59–1.11 (Chang and Zhang, 2010; Chang et al., 2011). This process is repeated until the desired dam geometry is achieved. The same material, construction process and void ratio are employed for the erodible bed which is 0.2 m thick. After the dam crest was smoothed and leveled, a rectangular notch (h0 × w0 = 0.05 m × 0.1 m) is excavated on the dam crest, adjacent to the glass side-wall. This ensures that the overtopping failure starts at the same place every time, guaranteeing the repeatability of the experiments (Hakimzadeh et al., 2014).
A gridded pattern (0.1 m × 0.1 m) is drawn on the dam body using white powder (Figure 2A) which helps quantify the development of breaching, downstream erosion and deposition. After dam construction, all the instruments are simultaneously switched on. The water valve is opened and the upstream flow enters the dammed lake. To reduce the effects of seepage or piping on the dam failure process, the water in the reservoir is filled rapidly. After it is filled to the crest, the inflow is adjusted to a fixed discharge value. As the water starts to flow over the dam crest, tracer particles are dropped into the dammed lake reservoir, throughout the entire failure process, to capture the velocity of the outburst flood as well as the breaching flow. In addition, continuous sampling was adopted during the tests to calculate the changes of the outburst flood density. The density is calculated from the weight and volume of the sampled outburst floods.
Results
General Observations
The rapid change of the hydrodynamic conditions during landslide dam breach makes the process of dam failure very complex. Figure 4 shows a series of aerial views of test No. E-Q3.0 from Camera 4. The initial time of dam breaching t = 0 s is when water starts to travel along the initial notch and eventually reaches the downstream dam shoulder, Point A (Figure 4A). This is where the overtopping failure of the landslide dam initially occurs. At this stage, the water flow is insufficient to erode the soil and most of the sediment are transported only up to the downstream dam slope face, developing into an alluvial fan that advances toward the toe of the dam (Figure 4B). The stream eventually incises the alluvial fan, forming a narrow channel which allows the incoming water to flow through fan (Figure 4C). Due to the continuous supply upstream, the water flow gradually increases, eroding the loose downstream deposits (Figure 4D). Figure 4E, shows the erosion of the upstream dam shoulder, point B. In this stage, the outburst flood increases rapidly and non-uniform, arc-like shock waves are frequently observed (Figures 4F–H). These turbulent and unsteady flows induce frequent, albeit temporary, localized blockages that effectively widen the dam breach width (Figures 4F–H). This indicates that the flow discharge can hardly remain constant along the longitudinal direction. The outer lateral contour of the dam is shaped like an hour glass, wherein the ends are wide and the mid-section is narrow (Figures 4F–K black line). This is quite different from existing models that assume that the outer contour is linear (Chang and Zhang, 2010; Zhong et al., 2018). Large scale erosion of the downstream loose deposits are also recorded in these stages (Figures 4F–H). Finally, the dam breaching process ends when clear water is observed downstream and the breach side slope remains stable (Figure 4K).
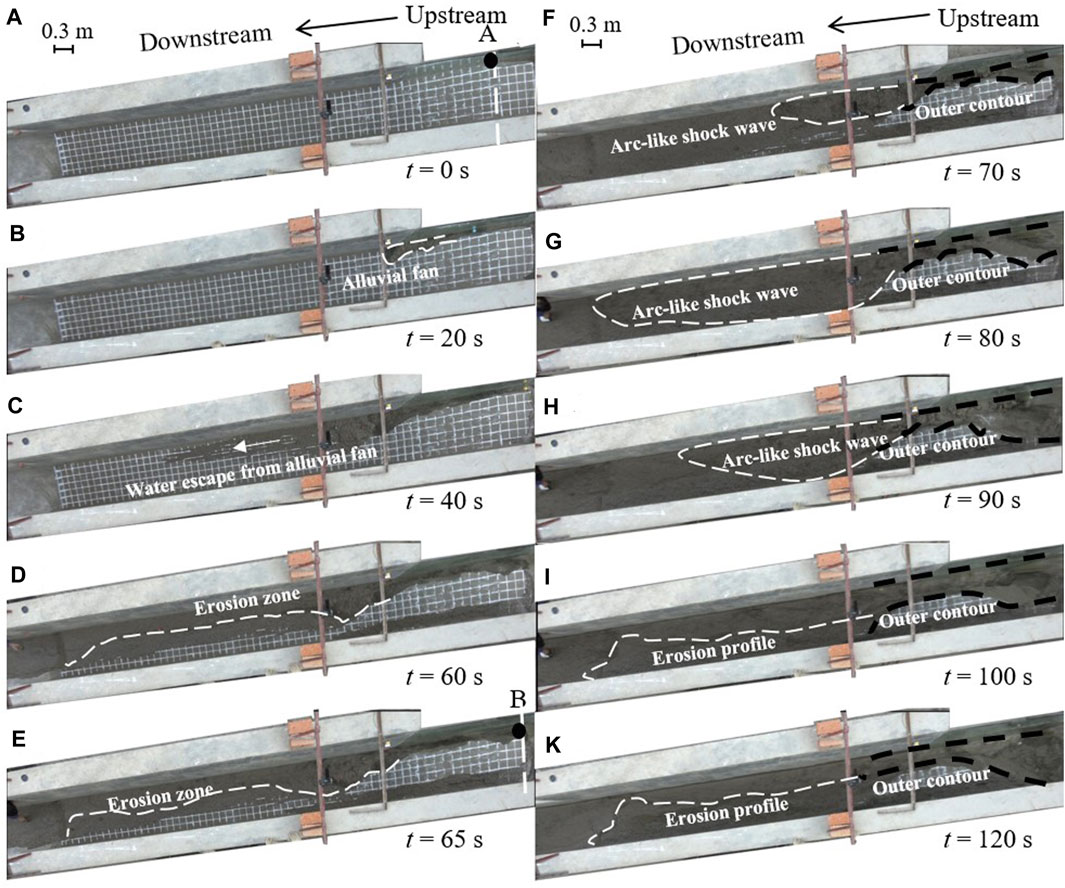
FIGURE 4. Snapshots of the dam-breaching process (Test No. E-Q3.0). t0 = 0 s is the moment when water starts to travel along the initial notch and eventually reaches the downstream crest. The grid is 0.1 m × 0.1 m. The dashed lines mark the surface profile of the dam geometry.
Longitudinal Evolution of Dam Breaching
Figure 5 (A1,A2) show snapshots of the longitudinal dam breach process at t = 0 s of test N-Q5.3 (left side) which has no erodible bed behind the dam and test E-Q5.3 (right side) which has an erodible bed behind the dam respectively. At the initial stage, since the breaching discharge is small, most of the sediment transport is still confined to the area immediately below dam the crest, Point A (Figure 5) (B1,B2). At around t = 20 s, the formation of erosional step pools (Parker and Izumi, 2000; Walder et al., 2015) is observed in the two set ups at the same location (x = 0.6 m) (Figure 5) (C1,C2). The upstream migration of these shallow pools, which coalesce into a headcut, lead to the establishment of hydraulic control at the breach crest, an erosional feature that functions as a weir (Figure 5) (D1,D2). As the upstream inflow continues to supply flowing water, the fine particles are more easily eroded and entrained into the outburst floods, resulting in an increase of suspended particles in the water.
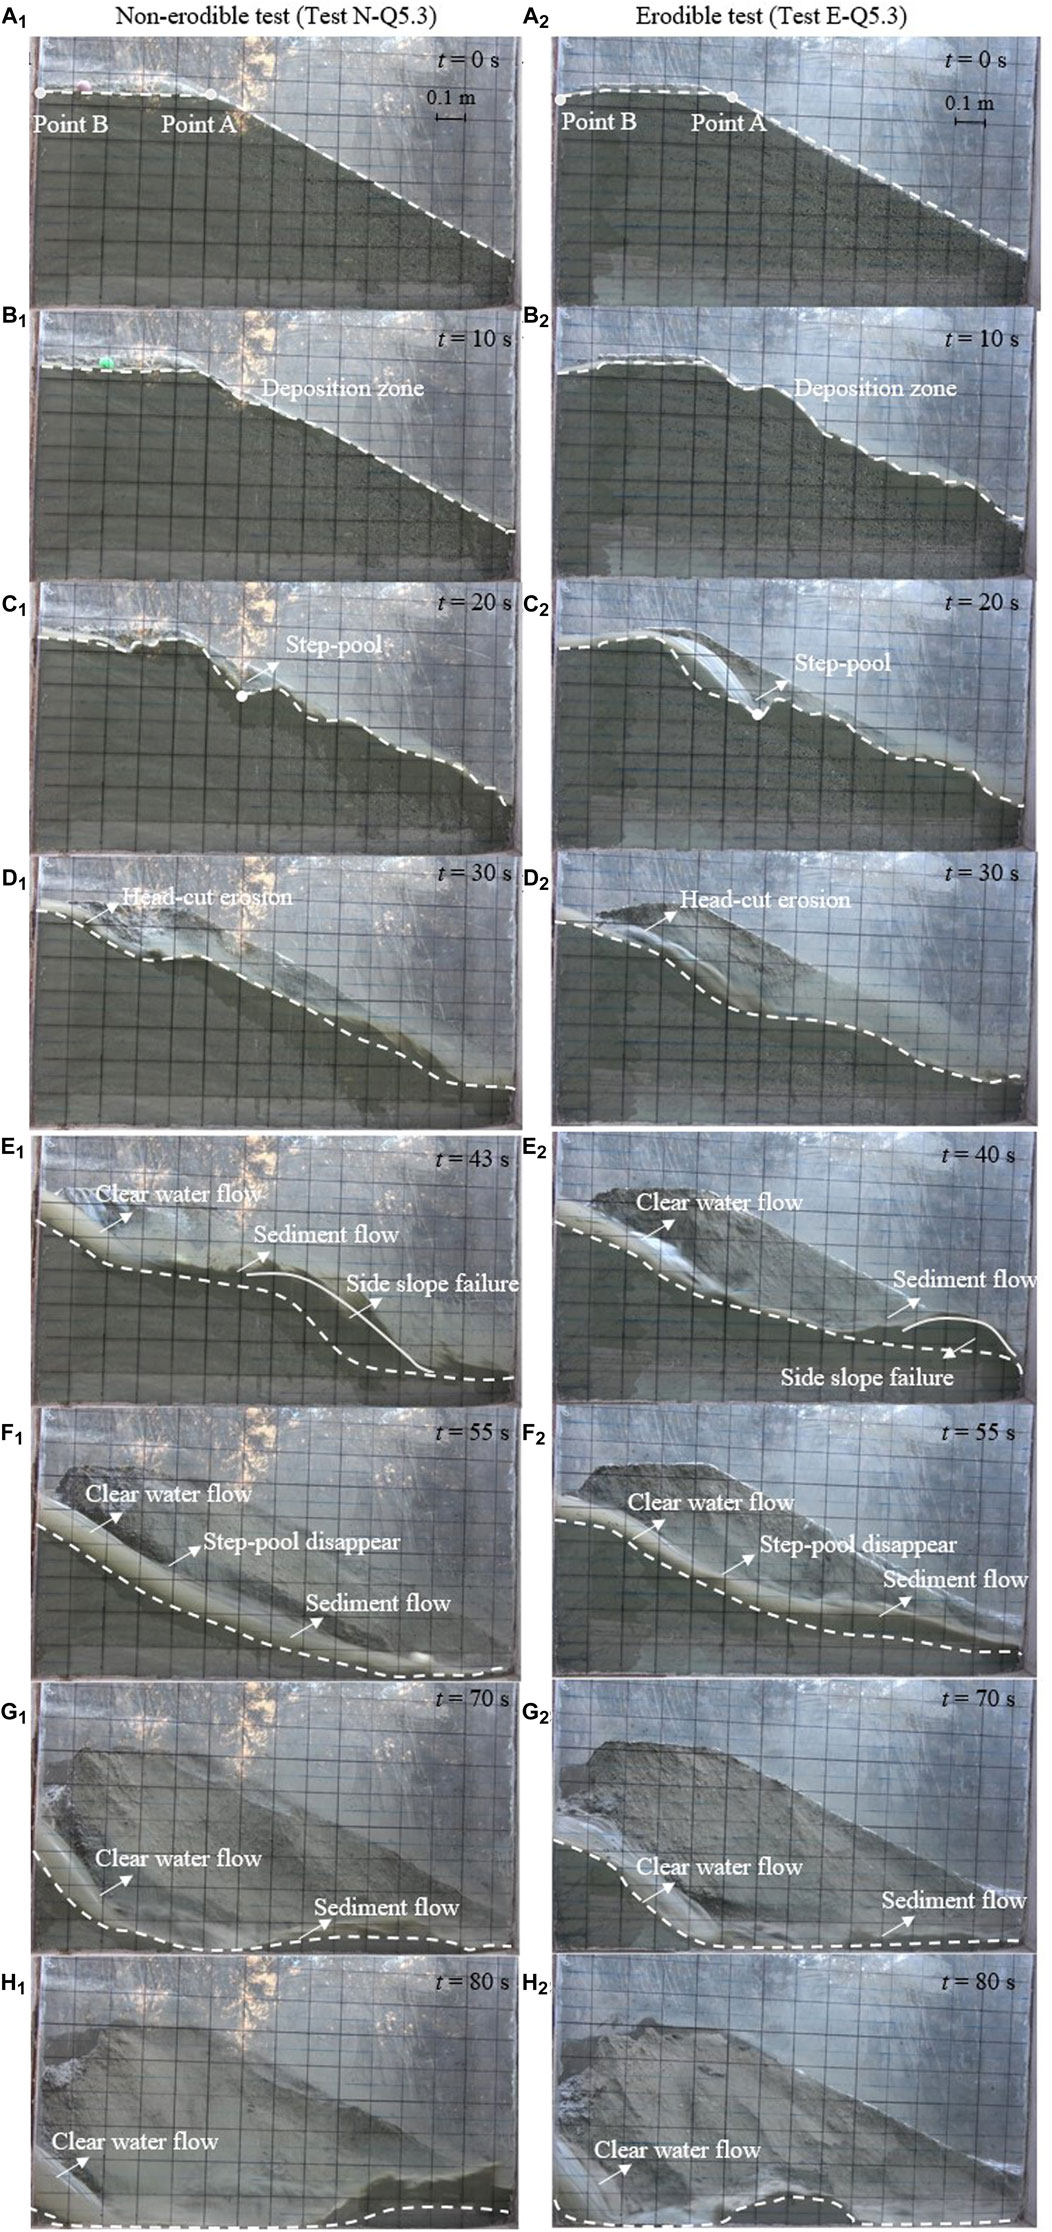
FIGURE 5. Longitudinal snapshots of the dam-breaching process (Test Nos. N-Q5.3 left side and E-Q5.3 right side). The grid size on the window is 0.1 m × 0.1 m.
When the erosion point reaches the upstream dam shoulder Point B [t = 43 s in N-Q5.3, and at t = 40 s in test No. E-Q5.3 (Figure 5) (E1, E2)], the dam crest completely collapses and the water level of the dammed lake quickly decreases as larger amounts of water are released downstream. From this stage, the water flow at the overtopped dam crest is clear but becomes murky and sediment-laden near the dam toe as it entrains soil particles along its path. The step-pools gradually disappear (Figure 5) (F1, F2) accelerating the erosion process along the dam surface, promoting further side slope failure. The depth of the water starts to decline and the geometry of the sloping bed begins to smoothen out as a result of its exposure to the rapid water flows. This decline in depth continues until the water level in the reservoir is close to the residual dam height (Figure 5) (H1, H2). At this point, no further side slope failure and erosion occurs. Finally, an almost identical final dam breaching morphology is observed in both sets of experiments (Figure 5) (H1, H2).
Hydrological Evolution of Dam Breaching Flow
Figure 6 shows representative temporal profiles (test N-Q5.3) of the water depth
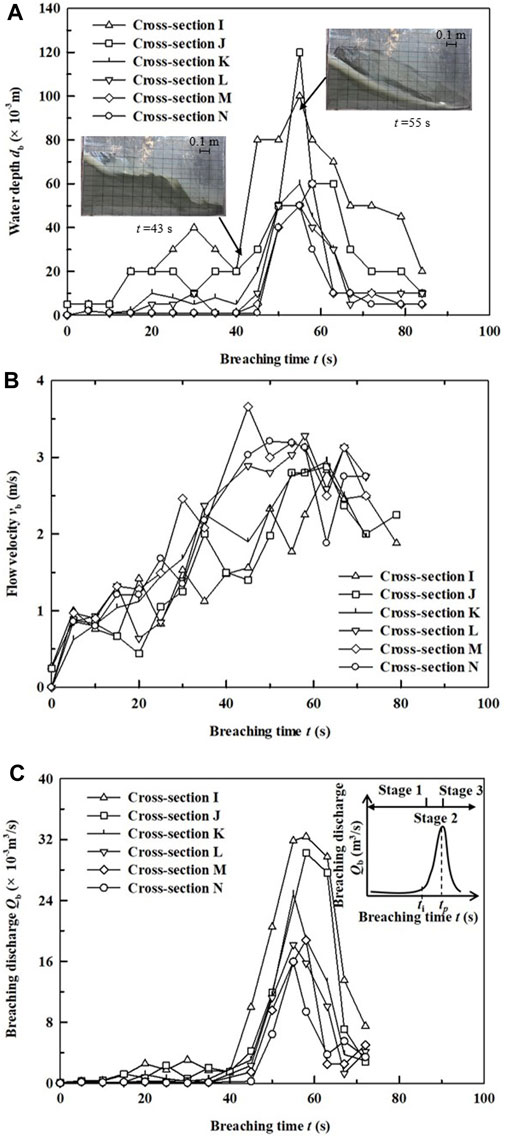
FIGURE 6. The evolution of the (A) depth (B) velocity and (C) discharge of breaching flow at different dam sections.
Figure 6C shows the evolution of discharge of the breaching flow. The trend of the breaching discharge is identical to that of the water depth: the flow initially increases slowly from zero, followed by a rapid increase up to a peak discharge value before decreasing. The temporal evolution of the discharge can be divided into three stages separated by inflection points, i.e. abrupt changes in the values of
Hydrological Evolution of Breaching Flow Along Longitudinal Direction
Hydrological Evolution of Breaching Flow
Figure 7 shows the breaching hydrological evolution of landslide dam overtopping failure process, in dimensionless time (t/ti) without an erodible bed. The value of breaching discharge at different cross-section is different especially during rapid stages (Stages 2 and 3). The evolution of both the breaching flow is consistent at the different sections wherein values gently increase first in Stage 1 (before t/ti = 1) followed by a sudden positive change in Stage 2 (after t/ti = 1), and thereafter the outburst flood attenuates in Stage 3. Note that, because side slope instabilities mainly occur after Stage 2, the change of the whole overtopping flow rate fluctuates greatly from during this stage in all tests (Figure 7). In addition, the maximum overtopping breaching discharge is usually obtained at the front of the dam body under different Qin (Figure 7). Moreover, the peak breaching discharge increases from 14.3 × 10⁻³ m3/s to 41.3 × 10⁻³ m3/s as the upstream inflow is also increased from 2.0 × 10⁻³ m3/s to 6.9 × 10⁻³ m3/s (Figure 7). It can be seen in Figure 6A, that the breaching discharge significantly varies along the flow direction due to the influence of the local topography, consequently resulting in a constantly changing streamline. The different breaching flows measured at different cross-sections of the dam all support the theory that the overtopping flow discharge is not even along the flow body (e.g., Jiang et al., 2017; Jiang et al., 2020), which is different from many assumptions used in rapid assessment models (e.g., Chang and Zhang, 2010; Wu, 2013; Chen Z.Y. et al., 2015; Zhong et al., 2018; Zhang et al., 2020; Zhong et al., 2020).
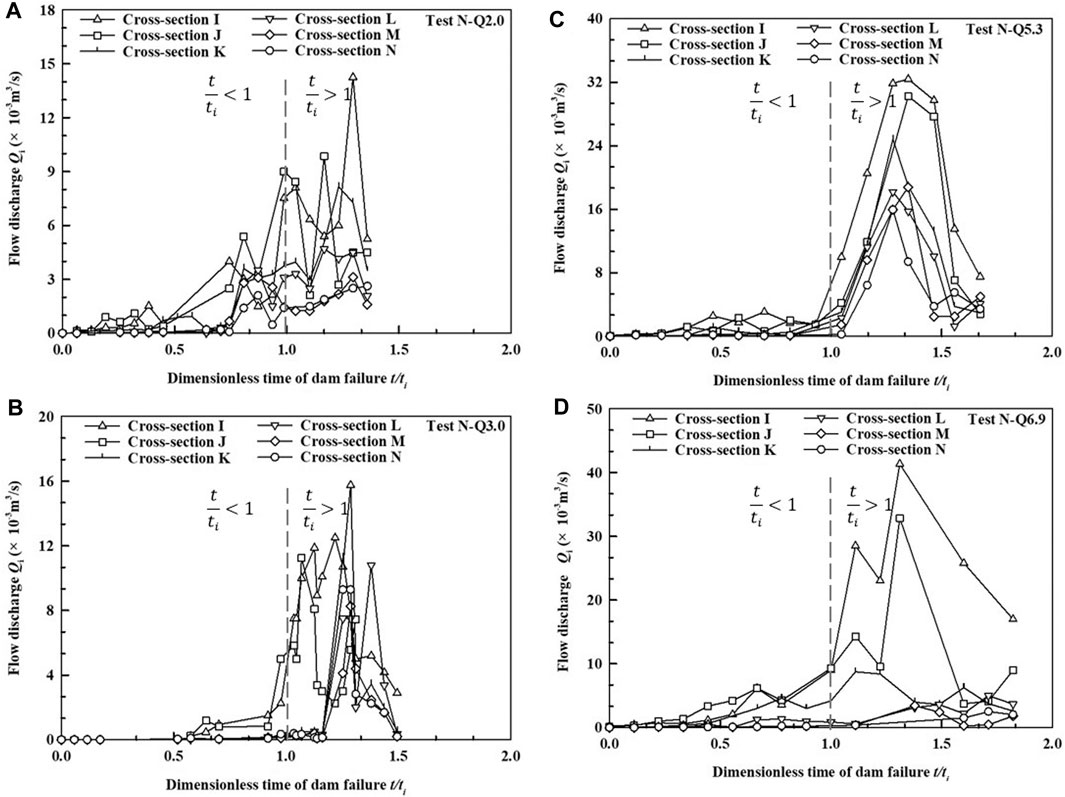
FIGURE 7. Hydrographs of the dam-breaching flow discharge at different dam sections for different inflow discharges (A) Qin = 2.0 × 10⁻³ m3/s (B) Qin = 3.0 × 10⁻³ m3/s (C) Qin = 5.3 × 10⁻³ m3/s (D) Qin = 6.9 × 10⁻³ m3/s.
Breaching Flow Attenuation Along the Longitudinal Direction
Figure 8 shows the breaching discharge evolution along longitudinal direction at different inflow discharges. Considering that Stages 2 and 3 are the main stages of outburst flow evolution wherein peak discharges are obtained and Stage 1 is small and basically unchanged (Figure 7), we separate the two parts when studying the change of the breaching discharge along the flow direction. The triangular (gray) markers represent the breaching discharge at different cross sections and at different points in time during Stage 1, while the rectangular (gray) markers represent the measured discharges during Stages 2 and 3. The breaching flow above the dam decreases along the longitudinal direction and averaging across the different points in each stage (cross black marks for Stage 1, and circles black for Stages 2 and 3), one can observe a clear linear decline. The slope of this decline
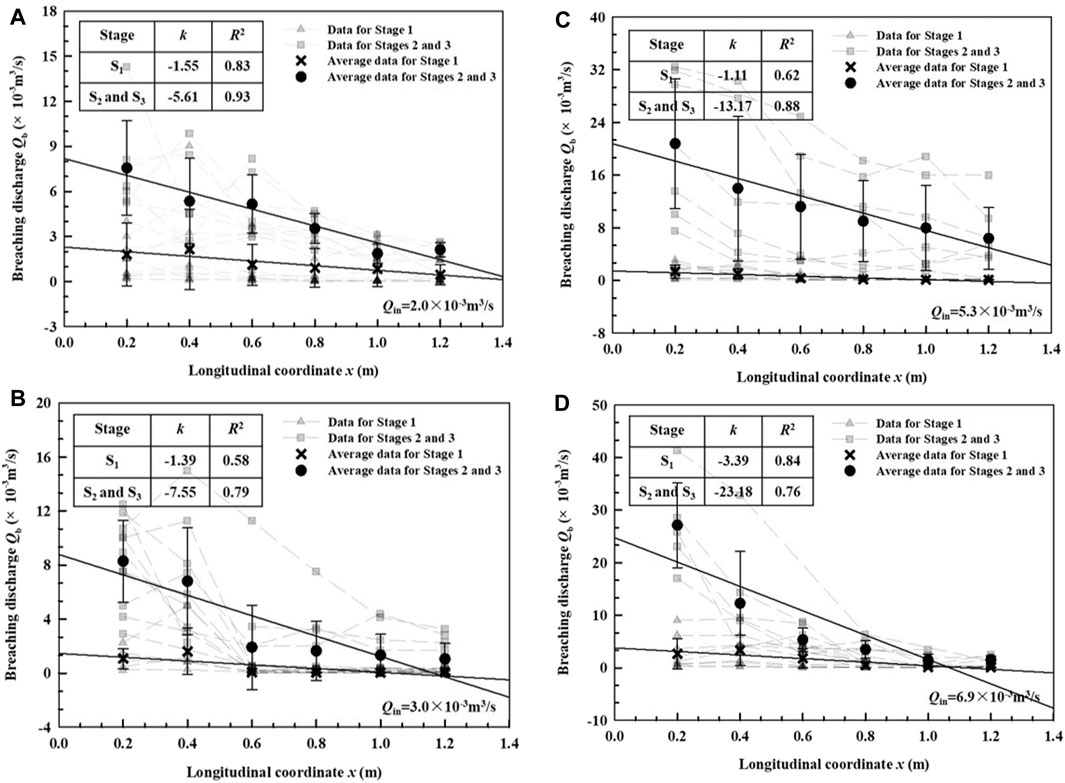
FIGURE 8. The evolution of average breaching flow discharge along the longitudinal direction during different Stage 1 and Stages 2 and 3 (A) Qin = 2.0 × 10⁻³ m3/s (B) Qin = 3.0 × 10⁻³ m3/s (C) Qin = 5.3 × 10⁻³ m3/s (D) Qin = 6.9 × 10⁻³ m3/s.
This decreasing trend is related to the local blockages resulting from the collapse of loose dam soils, particularly in Stages 2 and 3, which affect the water flow (Figure 1). Energy of the water flow is consumed to wash away or overcome the local blockages, which effectively reduces the discharge of the breaching flow. Although the collapses are random and do not occur consistently at the same place, the breaching discharge at the rear of dam is most affected by the collapses due to the lower dam heights in this region. Similar trends are observed for different upstream inflow discharges, although the magnitude of the slopes noticeably increase with Qin (Figure 8). Due to the increase of the upstream inflow, the water level of the dam body always maintains a high breach water level, leading to stronger flows. The greater the flow disturbance, the more likely for collapses to occur along the path that can further decrease the discharge.
Analysis on Influencing Factors of Outburst Flood
Figure 9A shows the influence of inflow discharge and loose deposit on the time to inflection flow discharge and the time to peak flow discharge. The relative time
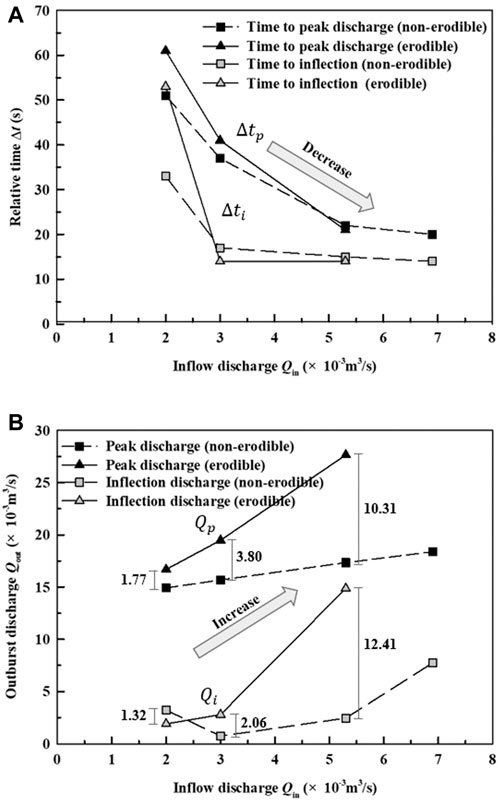
FIGURE 9. Influence of upstream flow discharge on (A) the time to inflection discharge and peak discharge and (B) the outburst discharge of dams with erodible beds (Test Nos. E-Q2.0, E-Q3.0, E-Q5.3) and those with non-erodible beds (Test Nos. N-Q2.0, N-Q3.0, N-Q5.3, N-Q6.9).
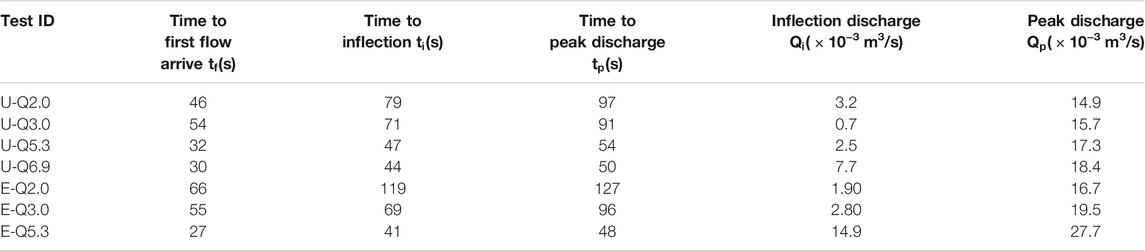
TABLE 3. Characteristic timescales and discharges for each test.
Figure 9B shows the influence of upstream inflow discharge
Discussion
Effects of the Upstream Inflow on the Mechanisms of Outburst Flooding
Figure 10 shows the change of the normalized breaching discharge
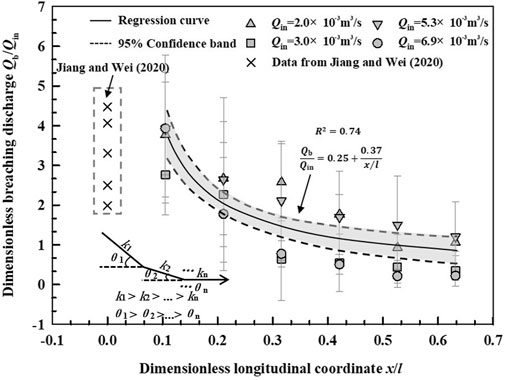
FIGURE 10. The magnification coefficient of the breaching flow varies along the dimensionless longitudinal coordinate.
Influence of Loose Deposits Behind the Dam on the Mechanism of Outburst Flood
Another phenomenon is that the peak flow of dams with erodible beds are higher than those without erodible beds (Table 3). This means that the loose deposits have a magnifying effect on the outburst floods. The enhancement effect of the loose deposits in the fluid is often observed in debris flow experiments involving movable beds. Iverson et al. (2010) argued that the amplification effect of debris flows can be attributed to the influence of excess pore water pressures in erodible bed due to load process. However, the water content of the loose deposit in this study is almost zero, therefore it is still not clear what the amplification effect is.
Figure 1A shows the outburst hydrographs of tests N-Q5.3 and E-Q5.3 where the three stages detailed in the previous sections can still be observed. In order to compare outburst discharge at different Stages of those two sets of downstream conditions, the hydrographs are projected in dimensionless time (t/ti), where t is the time of flow and ti is the time of inflection discharge. In Figure 11A it can be noticed that prior to the peak discharge (Stages 1 and 2), there is a period of time in which the flow front still travels from the dam toe to the measurement location (5 m away), in which no discharge data is recorded. After which, the outburst discharge begins to gently increase, marking the arrival of the initial minor surges. A sudden positive change in the discharge trend–an inflection point–is observed at
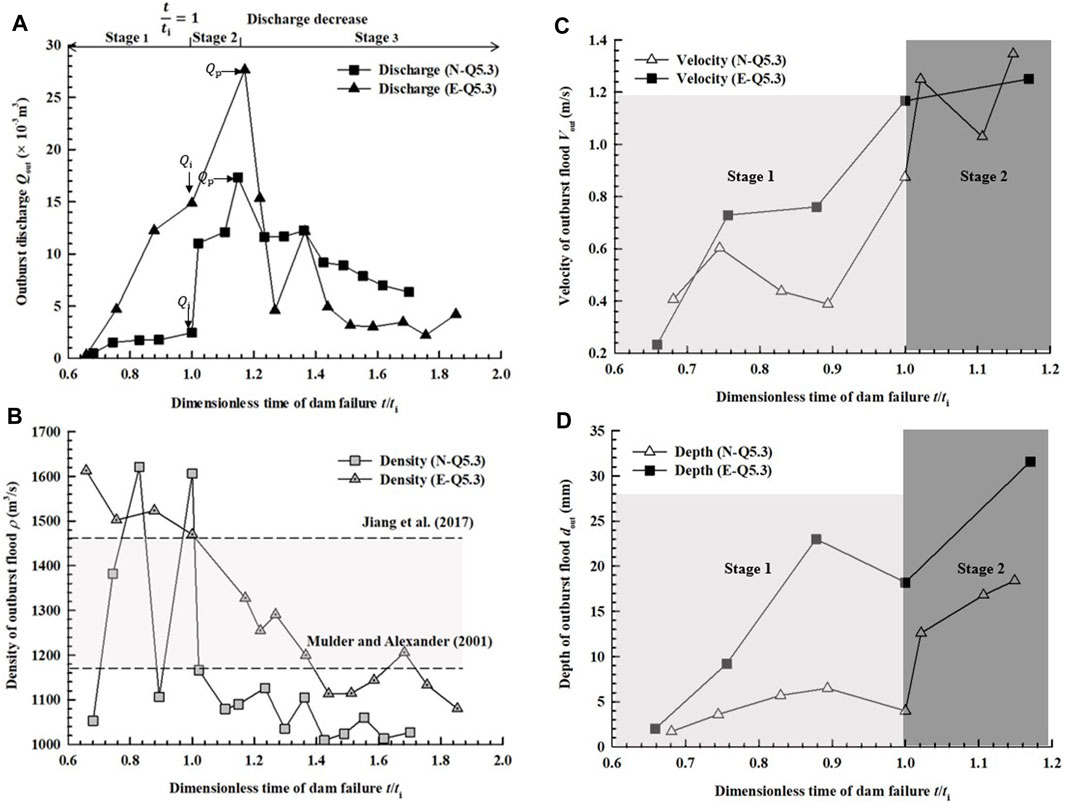
FIGURE 11. The (A) discharge of the outburst floods and (B) density of the outburst flood in tests N-Q5.3 and E-Q5.3. The (C) velocity and (D) water depth of outburst floods in Stages 1 and 2.
Figure 11B shows the density of the outburst floods of tests N-Q5.3 and E-Q5.3. The density of flows steadily decrease in two tests. Before the peak discharge, during the early stages of the dam failure, the flood density is relatively high in both conditions (Jiang et al., 2017) (Figure 11B). The transition to the lower densities corresponds to the time at which the inflection discharges are recorded. The density of the discharge of dams with erodible beds are noticeably larger than those without. The outburst floods in test N-Q5.3 are comparable to low-density turbidity currents (Middleton and Hampton, 1973; Mulder and Alexander, 2001) (with densities lower than 1165 kg/m3), while the flows in test E-Q5.3 can be likened to sediment flows (with densities more than 1165 kg/m3 and less than 1460 kg/m3) or even debris flows (more than 1460 kg/m3). Once the material starts to move down the slope, it will once again increase the momentum of the outburst flood and further increase the flow velocity of outburst flood (Figure 11C). The erosion of loose deposits in the erodible bed increases the sediment concentration and hence the flow depth (Figure 11D). Thus the increased outburst flood discharge of dams with erodible beds behind them are mainly due to increased flow height which results from the increased sediment concentration in the entraining flows.
Conclusion
By using flume modelling tests, the effects of upstream inflow discharge and downstream bed erodibility on the breaching flow and outburst flooding induced by landslide dam overtopping failure are investigated. The spatial-temporal evolution of breaching flows on different overtopping failure stages are presented in detail. In addition, the mechanisms underlying the enlargement of outburst flood discharge due to the presence of erodible beds behind landslide dams are discussed. The key conclusions drawn are as follows:
1) The breaching flow develops consistently with the downstream outburst. It can be divided into three stages where each stage is defined by distinct discharge dynamics. The definition of these stages are unaffected by the presence of an erodible base behind the dam. Furthermore, the maximum value of breach discharge increases with the increase of upstream inflow.
2) The breaching flow above the dam gradually decreases along the longitudinal direction. The average value of the outburst discharge at different sections during the different stages gradually decrease. The rate of decline of the breaching flow discharge in rapid failure stages (Stages 2 and 3) is higher than that of Stage 1. In addition, the larger the upstream inflow, the faster the dam breaching discharge decreases in Stages 2 and 3.
3) The scale amplification of the breaching flow decreases along the dam surface. An inverse equation is proposed to define the spatial evolution of the scale amplification (Stages 2 and 3). The rate of decline is asymptotic to a limit
4) The larger the inflow, the larger the peak discharges, and the shorter the time it takes to reach the said discharge. The dependence of peak discharge and inflection discharge on inflow is stronger when an erodible bed exists behind the dam. The replenishment of loose deposits behind the dam is an important reason for the significant increase of its peak outburst discharge.
The failure process of a landslide dam is a complex process which involves geotechnical and hydro-dynamic concepts. As a simplification, we only consider the evolution of overtopping flow of a dam body with one shape. The void ratio of the dam is kept uniform along the depth to imitate a naturally loose accumulation. Although the influence of inflow discharge on the peak outburst flood discharge is also affected by storage capacity, water content, and the density and gradation of the loose deposits behind the dam, these variables are not considered in this study. These items will be the focus of our future work, along with the consideration of the interactions between the scale amplification and breaching flow during the landslide dam failure.
Data Availability Statement
The original contributions presented in the study are included in the article/Supplementary Material, further inquiries can be directed to the corresponding author.
Author Contributions
MZ finished data collection and this manuscipt. ZS contributed to the conceptualization, supervision and funding acquisition. GZ reviewed and edited the manuscript. KC contributed to the conceptualization and reviewed and polised the manuscript. MP reviewed and edited the manuscript.
Conflict of Interest
The authors declare that the research was conducted in the absence of any commercial or financial relationships that could be construed as a potential conflict of interest.
Publisher’s Note
All claims expressed in this article are solely those of the authors and do not necessarily represent those of their affiliated organizations, or those of the publisher, the editors and the reviewers. Any product that may be evaluated in this article, or claim that may be made by its manufacturer, is not guaranteed or endorsed by the publisher.
Acknowledgments
The authors acknowledge the financial support from the National Natural Science Foundation of China (Grant Nos. 41731283, 42007252, 41877234).
References
Bellos, C. V., Soulis, V., and Sakkas, J. G. (1992). Experimental Investigation of Two-Dimensional Dam-Break Induced Flows. J. Hydraulic Res. 30 (1), 47–63. doi:10.1080/00221689209498946
Breien, H., De Blasio, F. V., Elverhøi, A., and Høeg, K. (2008). Erosion and Morphology of a Debris Flow Caused by a Glacial lake Outburst Flood, Western Norway. Landslides 5, 271–280. doi:10.1007/s10346-008-0118-3
Cao, Z., Yue, Z., and Pender, G. (2011). Landslide Dam Failure and Flood Hydraulics. Part I: Experimental Investigation. Nat. Hazards 59 (2), 1003–1019. doi:10.1007/s11069-011-9814-8
Casagli, N., Ermini, L., and Rosati, G. (2003). Determining Grain Size Distribution of Material Composing Landslide Dams in the Northern Apennine: Sampling and Processing Methods. Eng. Geol. 69 (1), 83–97. doi:10.1016/s0013-7952(02)00249-1
Chang, D. S., and Zhang, L. M. (2010). Simulation of the Erosion Process of Landslide Dams Due to Overtopping Considering Variations in Soil Erodibility along Depth. Nat. Hazards Earth Syst. Sci. 10 (4), 933–946. doi:10.5194/nhess-10-933-2010
Chang, D. S., Zhang, L. M., Xu, Y., and Huang, R. Q. (2011). Field Testing of Erodibility of Two Landslide Dams Triggered by the 12 May Wenchuan Earthquake. Landslides 8 (3), 321–332. doi:10.1007/s10346-011-025610.1007/s10346-011-0256-x
Chen, S.-C., Lin, T.-W., and Chen, C.-Y. (2015). Modeling of Natural Dam Failure Modes and Downstream Riverbed Morphological Changes with Different Dam Materials in a Flume Test. Eng. Geology. 188, 148–158. doi:10.1016/j.enggeo.2015.01.016
Chen, S. S., Xu, G. M., Zhong, Q. M., and Gu, X. W. (2012). Development and Application of Centrifugal Model Test System for Break of Earth-Rock Dams. J. Hydraul. Eng. 43 (2), 241–245. in Chinese. doi:10.13243/j.cnki.slxb.2012.02.006
Chen, Z. Y., Ma, L. Q., Yu, S., Chen, S. J., Zhou, X. B., Sun, P., et al. (2015). Back Analysis of the Draining Process of the Tangjiashan Barrier lake. J. Hydraul. Eng. 141 (4), 1–14. doi:10.1061/(asce)hy.1943-7900.0000965
Costa, J. E. (1985). Floods from Dam Failures. U.S. Geological Survey, U.S. Geological Survey Open-File Report. Reston, VA: U.S. Geological Survey, 85–560.
Costa, J. E., and Schuster, R. L. (1988). The Formation and Failure of Natural Dam. Geol. Soc. Am. Bull. 100, 1054–1068. doi:10.1130/0016-7606(1988)100<1054:tfafon>2.3.co;2
Cui, P., Zhou, G. G. D., Zhu, X. H., and Zhang, J. Q. (2013). Scale Amplification of Natural Debris Flows Caused by Cascading Landslide Dam Failures. Geomorphology 182 (427), 173–189. doi:10.1016/j.geomorph.2012.11.009
Davies, T. R., Manville, V., Kunz, M., and Donadini, L. (2007). Modeling Landslide Dambreak Flood Magnitudes: Case Study. J. Hydraul. Eng. 133 (7), 713–720. doi:10.1061/(asce)0733-9429(2007)133:7(713)
Dong, J.-J., Li, Y.-S., Kuo, C.-Y., Sung, R.-T., Li, M.-H., Lee, C.-T., et al. (2011). The Formation and Breach of a Short-Lived Landslide Dam at Hsiaolin Village, Taiwan - Part I: Post-event Reconstruction of Dam Geometry. Eng. Geology. 123, 40–59. doi:10.1016/j.enggeo.2011.04.001
Fan, X., Dufresne, A., Siva Subramanian, S., Strom, A., Hermanns, R., Tacconi Stefanelli, C., et al. (2020). The Formation and Impact of Landslide Dams - State of the Art. Earth-Science Rev. 203, 103116. doi:10.1016/j.earscirev.2020.103116
Fan, X., Scaringi, G., Korup, O., West, A. J., Westen, C. J., Tanyas, H., et al. (2019). Earthquake‐Induced Chains of Geologic Hazards: Patterns, Mechanisms, and Impacts. Rev. Geophys. 57 (2), 421–503. doi:10.1029/2018RG000626
Fannin, R. J., and Wise, M. P. (2001). An Empirical-Statistical Model for Debris Flow Travel Distance. Can. Geotech. J. 38 (5), 982–994. doi:10.1139/t01-030
Gregoretti, C., Maltauro, A., and Lanzoni, S. (2010). Laboratory Experiments on the Failure of Coarse Homogeneous Sediment Natural Dams on a Sloping Bed. J. Hydraul. Eng. 136 (11), 868–879. doi:10.1061/(asce)hy.1943-7900.0000259
Hakimzadeh, H., Nourani, V., and Amini, A. B. (2014). Genetic Programming Simulation of Dam Breach Hydrograph and Peak Outflow Discharge. J. Hydrol. Eng. 19 (4), 757–768. doi:10.1061/(asce)he.1943-5584.0000849
Iverson, R. M., Reid, M. E., and LaHusen, R. G. (1997). Debris-flow Mobilization from Landslides. Annu. Rev. Earth Planet. Sci. 25, 85–138. doi:10.1146/annurev.earth.25.1.85
Iverson, R. M., Reid, M. E., Logan, M., LaHusen, R. G., Godt, J. W., Griswold, J. P., et al. (2010). Positive Feedback and Momentum Growth during Debris-Flow Entrainment of Wet Bed Sediment. Nat. Geosci 4 (2), 116–121. doi:10.1038/ngeo1040
Iverson, R. M. (2015). Scaling and Design of Landslide and Debris-Flow Experiments. Geomorphology 244, 9–20. doi:10.1016/j.geomorph.2015.02.033
Jiang, X., and Wei, Y. (2020). Erosion Characteristics of Outburst Floods on Channel Beds under the Conditions of Different Natural Dam Downstream Slope Angles. Landslides 17, 1823–1834. doi:10.1007/s10346-020-01381-y
Jiang, X., Wei, Y., Wu, L., and Lei, Y. (2018a). Experimental Investigation of Failure Modes and Breaching Characteristics of Natural Dams. Geomatics, Nat. Hazards Risk 9 (1), 33–48. doi:10.1080/19475705.2017.1407367
Jiang, X., Wörman, A., Chen, P., Huang, Q., and Chen, H. (2020). Mechanism of the Progressive Failure of Non-cohesive Natural Dam Slopes. Geomorphology 363, 107198. doi:10.1016/j.geomorph.2020.107198
King, J., Loveday, I., and Schuster, R. L. (1989). The 1985 Bairaman Landslide Dam and Resulting Debris Flow, Papua New Guinea. Q. J. Eng. Geology. Hydrogeology 22 (4), 257–270. doi:10.1144/gsl.qjeg.1989.022.04.02
Kirkpatrick, G. W. (1977). “Evaluation Guidelines for Spillway Adequacy. Evaluation of Dam Safety,” in Proceedings of the Engineering Foundation Conference, Zurich, 395–414.
Korup, O. (2004). Geomorphometric Characteristics of New Zealand Landslide Dams. Eng. Geology. 73 (1), 13–35. doi:10.1016/j.enggeo.2003.11.003
Korup, O., Montgomery, D. R., and Hewitt, K. (2010). Glacier and Landslide Feedbacks to Topographic Relief in the Himalayan Syntaxes. Proc. Natl. Acad. Sci. 107 (12), 5317–5322. doi:10.1073/pnas.0907531107
Korup, O. (2006). Rock-slope Failure and the River Long Profile. Geol 34 (1), 45–48. doi:10.1130/g21959.1
Li, M.-H., Sung, R.-T., Dong, J.-J., Lee, C.-T., and Chen, C.-C. (2011). The Formation and Breaching of a Short-Lived Landslide Dam at Hsiaolin Village, Taiwan - Part II: Simulation of Debris Flow with Landslide Dam Breach. Eng. Geology. 123, 60–71. doi:10.1016/j.enggeo.2011.05.002
Liu, W., Carling, P. A., Hu, K., Wang, H., Zhou, Z., Zhou, L., et al. (2019). Outburst Floods in China: A Review. Earth-Science Rev. 197, 102895. doi:10.1016/j.earscirev.2019.102895
Liu, W., Hu, K., Carling, P. A., Lai, Z., Cheng, T., and Xu, Y. (2018). The Establishment and Influence of Baimakou Paleo-Dam in an Upstream Reach of the Yangtze River, southeastern Margin of the Tibetan Plateau. Geomorphology 321, 167–173. doi:10.1016/j.geomorph.2018.08.028
Mangeney, A., Tsimring, L. S., Volfson, D., Aranson, I. S., and Bouchut, F. (2007). Avalanche Mobility Induced by the Presence of an Erodible Bed and Associated Entrainment. Geophys. Res. Lett. 34 (22), 22401. doi:10.1029/2007gl031348
Middleton, G. V., and Hampton, M. A. (1973). “Sediment Gravity Flows: Mechanics of Flow and Deposition,” in Turbidity and Deep Water Sedimentation (Pacific Section: SEPM), 1–38.
Mulder, T., and Alexander, J. (2001). The Physical Character of Subaqueous Sedimentary Density Flows and Their Deposits. Sedimentology 48 (2), 269–299. doi:10.1046/j.1365-3091.2001.00360.x
Parker, G., and Izumi, N. (2000). Purely Erosional Cyclic and Solitary Steps Created by Flow over a Cohesive Bed. J. Fluid Mech. 419, 203–238. doi:10.1017/S0022112000001403
Peng, M., Jiang, Q.-L., Zhang, Q.-Z., Hong, Y., Jiang, M.-z., Shi, Z.-M., et al. (2019). Stability Analysis of Landslide Dams under Surge Action Based on Large-Scale Flume Experiments. Eng. Geology. 259, 105191. doi:10.1016/j.enggeo.2019.105191
Peng, M., and Zhang, L. M. (2012). Breaching Parameters of Landslide Dams. Landslides 9 (1), 13–31. doi:10.1007/s10346-011-0271-y
Pickert, G., Weitbrecht, V., and Bieberstein, A. (2011). Breaching of Overtopped River Embankments Controlled by Apparent Cohesion. J. Hydraulic Res. 49 (2), 143–156. doi:10.1080/00221686.2011.552468
Pierce, M. W., Thornton, C. I., and Abt, S. R. (2010). Predicting Peak Outflow from Breached Embankment Dams. J. Hydrol. Eng. 15 (5), 338–349. doi:10.1061/(asce)he.1943-5584.0000197
Shen, D., Shi, Z., Peng, M., Zhang, L., and Jiang, M. (2020a). Longevity Analysis of Landslide Dams. Landslides 17, 1797–1821. doi:10.1007/s10346-020-01386-7
Shen, D., Shi, Z., Peng, M., Zhang, L., and Zhu, Y. (2020b). Preliminary Analysis of a Rainfall-Induced Landslide hazard Chain in Enshi City, Hubei Province, China in July 2020. Landslides 18, 509–512. doi:10.1007/s10346-020-01553-w
Shi, Z. M., Guan, S. G., Peng, M., Zhang, L. M., Zhu, Y., and Cai, Q. P. (2015). Cascading Breaching of the Tangjiashan Landslide Dam and Two Smaller Downstream Landslide Dams. Eng. Geology. 193 (2), 445–458. doi:10.1016/j.enggeo.2015.05.021
Shi, Z. M., Wang, Y. Q., Peng, M., Chen, J. F., and Ji, Y. (2014). Characteristics of the Landslide Dams Induced by the 2008 Wenchuan Earthquake and Dynamic Behavior Analysis Using Large-Scale Shaking Table Tests. Eng. Geol. 194, 25–37. doi:10.1016/j.enggeo.2014.10.009
Singh, K. P., and Snorrason, A. (1984). Sensitivity of Outflow Peaks and Flood Stages to the Selection of Dam Breach Parameters and Simulation Models. J. Hydrol. 68 (1), 295–310. doi:10.1016/0022-1694(84)90217-8
van Gorp, W., Schoorl, J. M., Temme, A. J. A. M., Reimann, T., Wijbrans, J. R., Maddy, D., et al. (2016). Catchment Response to Lava Damming: Integrating Field Observation, Geochronology and Landscape Evolution Modelling. Earth Surf. Process. Landforms 41 (11), 1629–1644. doi:10.1002/esp.3981
Walder, J. S. (2016). Dimensionless Erosion Laws for Cohesive Sediment. J. Hydraul. Eng. 142 (2), 04015047. doi:10.1061/(asce)hy.1943-7900.0001068
Walder, J. S., Iverson, R. M., Godt, J. W., Logan, M., and Solovitz, S. A. (2015). Controls on the Breach Geometry and Flood Hydrograph during Overtopping of Noncohesive Earthen Dams. Water Resour. Res. 51 (8), 6701–6724. doi:10.1002/2014wr016620
Walsh, L. S., Martin, A. J., Ojha, T. P., and Fedenczuk, T. (2012). Correlations of Fluvial Knickzones with Landslide Dams, Lithologic Contacts, and Faults in the Southwestern Annapurna Range, central Nepalese Himalaya. J. Geophys. Res. 117, a–n. doi:10.1029/2011JF001984
Wang, G. H., Sassa, K., and Fukuoka, H. (2003). Downslope Volume Enlargement of a Debris Slide–Debris Flow in the 1999 Hiroshima, Japan, Rainstorm. Eng. Geol. 69 (3), 309–330. doi:10.1016/s0013-7952(02)00289-2
Webby, M. G. (1996). Discussion of "Peak Outflow from Breached Embankment Dam" by David C. Froehlich. J. Water Resour. Plann. Manage. 122 (4), 316–317. doi:10.1061/(asce)0733-9496(1996)122:4(316)
Wu, W. (2013). Simplified Physically Based Model of Earthen Embankment Breaching. J. Hydraul. Eng. 139 (8), 837–851. doi:10.1061(asce)hy.1943-7900.000074110.1061/(asce)hy.1943-7900.0000741
Xiangang, J., Jiahua, H., Yunwei, W., Zhipan, N., Fenghui, C., Zuyin, Z., et al. (2018b). The Influence of Materials on the Breaching Process of Natural Dams. Landslides 15, 243–255. doi:10.1007/s10346-017-0877-9
Xiangang, J., Peng, C., Huayong, C., and Yayong, G. (2017). Formation Conditions of Outburst Debris Flow Triggered by Overtopped Natural Dam Failure. Landslides 14 (3), 821–831. doi:10.1007/s10346-016-0751-1
Xiong, X., Shi, Z. M., Guan, S. G., and Zhang, F. (2018). Failure Mechanism of Unsaturated Landslide Dam under Seepage Loading - Model Tests and Corresponding Numerical Simulations. Soils and Foundations 58, 1133–1152. doi:10.1016/j.sandf.2018.05.012
Xiong, Z., Feng, G., Feng, Z., Miao, L., Wang, Y., Yang, D., et al. (2020). Pre- and post-failure Spatial-Temporal Deformation Pattern of the Baige Landslide Retrieved from Multiple Radar and Optical Satellite Images. Eng. Geology. 279, 105880. doi:10.1016/j.enggeo.2020.105880
Xu, F.-g., Yang, X.-g., Zhou, J.-w., and Hao, M.-h. (2013). Experimental Research on the Dam-Break Mechanisms of the Jiadanwan Landslide Dam Triggered by the Wenchuan Earthquake in China. Scientific World J. 2013, 1–13. doi:10.1155/2013/272363
Xu, Q., Fan, X.-M., Huang, R.-Q., and Westen, C. V. (2009). Landslide Dams Triggered by the Wenchuan Earthquake, Sichuan Province, South West China. Bull. Eng. Geol. Environ. 68 (3), 373–386. doi:10.1007/s10064-009-0214-1
Yan, J., Cao, Z.-x., Liu, H.-h., and Chen, L. (2009). Experimental Study of Landslide Dam-Break Flood over Erodible Bed in Open Channels. J. Hydrodyn. 21 (1), 124–130. doi:10.1016/S1001-6058(08)60127-4
Yang, Y., Cao, S.-y., Yang, K.-j., and Li, W.-p. (2015). Experimental Study of Breach Process of Landslide Dams by Overtopping and its Initiation Mechanisms. J. Hydrodyn. 27 (6), 872–883. doi:10.1016/S1001-6058(15)60550-9
Yin, Y., Wang, F., and Sun, P. (2009). Landslide Hazards Triggered by the 2008 Wenchuan Earthquake, Sichuan, China. Landslides 6 (2), 139–152. doi:10.1007/s10346-009-0148-5
Zhang, L., Xiao, T., He, J., and Chen, C. (2019). Erosion-based Analysis of Breaching of Baige Landslide Dams on the Jinsha River, China, in 2018. Landslides 16, 1965–1979. doi:10.1007/s10346-019-01247-y
Zheng, H., Shi, Z., Shen, D., Peng, M., Hanley, K. J., Ma, C., et al. (2021). Recent Advances in Stability and Failure Mechanisms of Landslide Dams. Front. Earth Sci. 9, 659935. doi:10.3389/feart.2021.659935
Zheng, Y., Chen, C., Liu, T., and Ren, Z. (2021). A New Method of Assessing the Stability of Anti-dip Bedding Rock Slopes Subjected to Earthquake. Bull. Eng. Geol. Environ. 80, 3693–3710. doi:10.1007/s10064-021-02188-4
Zhong, Q., Chen, S., and Shan, Y. (2020). Prediction of the Overtopping-Induced Breach Process of the Landslide Dam. Eng. Geology. 274, 105709. doi:10.1016/j.enggeo.2020.105709
Zhong, Q. M., Chen, S. S., Mei, S. A., and Cao, W. (2018). Numerical Simulation of Landslide Dam Breaching Due to Overtopping. Landslides 15 (6), 1183–1192. doi:10.1007/s10346-017-0935-3
Zhou, G. G. D., Cui, P., Chen, H. Y., Zhu, X. H., Tang, J. B., and Sun, Q. C. (2013). Experimental Study on Cascading Landslide Dam Failures by Upstream Flows. Landslides 10 (5), 633–643. doi:10.1007/s10346-012-0352-6
Zhou, G. G. D., Cui, P., Tang, J. B., Chen, H. Y., Zou, Q., and Sun, Q. C. (2015). Experimental Study on the Triggering Mechanisms and Kinematic Properties of Large Debris Flows in Wenjia Gully. Eng. Geology. 194, 52–61. doi:10.1016/j.enggeo.2014.10.021
Zhou, G. G. D., and Ng, C. W. W. (2010). Dimensional Analysis of Natural Debris Flows. Can. Geotech. J. 47 (7), 719–729. doi:10.1139/t09-134
Zhou, G. G. D., Zhou, M., Shrestha, M. S., Song, D., Choi, C. E., Cui, K. F. E., et al. (2019). Experimental Investigation on the Longitudinal Evolution of Landslide Dam Breaching and Outburst Floods. Geomorphology 334, 29–43. doi:10.1016/j.geomorph.2019.02.035
Zhou, M.-j., Zhou, G. G. D., Cui, K. F. E., Song, D.-r., and Lu, X.-q. (2019). Influence of Inflow Discharge and Bed Erodibility on Outburst Flood of Landslide Dam. J. Mt. Sci. 16 (4), 778–792. doi:10.1007/s11629-018-5312-8
Keywords: landslide dam, overtopping failure, inflow discharge, loose deposits, breaching flow, outburst discharge
Citation: Zhou M, Shi Z, Zhou GGD, Cui KFE and Peng M (2021) Experimental Investigation of the Outburst Discharge of Landslide Dam Overtopping Failure. Front. Earth Sci. 9:766524. doi: 10.3389/feart.2021.766524
Received: 29 August 2021; Accepted: 23 September 2021;
Published: 12 October 2021.
Edited by:
Yun Zheng, Institute of Rock and Soil Mechanics (CAS), ChinaReviewed by:
Qiming Zhong, Nanjing Hydraulic Research Institute, ChinaTingkai Nian, Dalian University of Technology, China
Copyright © 2021 Zhou, Shi, Zhou, Cui and Peng. This is an open-access article distributed under the terms of the Creative Commons Attribution License (CC BY). The use, distribution or reproduction in other forums is permitted, provided the original author(s) and the copyright owner(s) are credited and that the original publication in this journal is cited, in accordance with accepted academic practice. No use, distribution or reproduction is permitted which does not comply with these terms.
*Correspondence: Kahlil Fredrick E. Cui, a2ZjdWlAaW1kZS5hYy5jbg==