 Xiaohua Jiang1,2,3
 Songtao Wu1,2,3*
 Lianhua Hou1,2*Jinyou Zhang4Modi Guan1,5Fulin Zhai1,2Jinhao Guo1Ling Su1,2,3
 Fengrong Liao1,2,3Lihua Ding1,2
- 1Research Institute of Petroleum Exploration and Development, CNPC, Beijing, China
- 2National Energy Tight Oil and Gas Research and Development Center, Beijing, China
- 3Key Laboratory of Oil and Gas Reservoir, CNPC, Beijing, China
- 4Research Institute of Petroleum Exploration and Development of Daqing Oilfield Limited Company, CNPC, Daqing, China
- 5College of Earth and Planetary Sciences, University of Chinese Academy of Sciences, Beijing, China
Pore structure is a major factor affecting the storage space and oil-bearing properties of shales. Mineralogy, organic matter content, and thermal evolution complicate the pore structures of lacustrine shales. In this study, the porosity evolution of organic-matter-rich shales from the Cretaceous Nenjiang Formation in the Songliao Basin, Northeast China, are investigated using thermal simulation experiments and in-situ scanning electron microscope analysis. Three findings were obtained as follows: 1) The pore system of shales from the Nenjiang Formation is dominated by inter-granular dissolution pores of plagioclase and intra-granular pores of illite-smectite mixed layers. Few organic-matter pores are observed. 2) New pores developing during thermal evolution are primarily organic matter pores and clay mineral pores, with diameters greater than 18 nm. Clay mineral pores with diameters of 18–50 nm are the principal contributors to porosity at temperatures between the low maturity stage and the oil-generation window, and organic matter pores with diameters of greater than 50 nm comprise the majority of pores generated between the gas-generation window and the high-/over-mature stages. 3) Porosity increases continuously with maturity, and the pore system varies at different maturity stages. Porosity evolution is controlled by illite content and organic matter abundance. Total pore volume correlates positively with illite content but negatively with organic matter abundance. These findings could provide guidance on shale oil evaluation in the Songliao Basin and assist in the ‘sweet-spotting’ of lacustrine shale systems across China.
Introduction
As a new field of oil and gas exploration, research on shales has been a focus of attention for more than a decade. After “shale gas”, “shale oil” is now contributing to this unconventional energy revolution, ensuring an important strategic position for shales in China. (Jia et al., 2012; Du et al., 2019; Jin et al., 2019; Jia, 2020; Zhao et al., 2020; Zou et al., 2020, 2021). Geologists have come to understand that shale provides not only source rocks but also reservoirs, so the study of pore structures in shales has become a research hotspot, since pore structure has an important effect on reservoir properties (Wu et al., 2018; Zhu et al., 2016a, 2018). Previous studies of shale pore structures have tended to focus on two specific aspects; static characterization and dynamic evolution. In terms of static characterization of pore structures, research has concentrated on using various methods to evaluate shale pore types and determine their sizes and controlling factors (Zhu et al., 2018; Wu ST. et al., 2020). The principal understandings that have been gained are: 1) Shale pore types include inorganic mineral pores, organic matter (OM) pores, and microfractures. Different types of shales possess different types and combinations of pores. Lacustrine shale is dominated by inorganic mineral pores (Wu et al., 2018; Zeng et al., 2019; Liu et al., 2021), but marine shale has a relatively high proportion of OM pores (Zhao et al., 2016; Zhang et al., 2017; Wang et al., 2018). 2) Shale pores are very small, and micro-nano meter pore-throat systems occupy the largest proportion of reservoir space (Zou et al., 2010; Zhu et al., 2016a). For example, Zeng, (2020) proposed that, numerically, the majority of pores have diameters of less than 10 nm but that pores with diameters greater than 10 nm contribute most of the pore volume. Zhang et al. (2017) found that OM pores in Wufeng-Longmaxi Formation shale are mostly micropores and mesopores, smaller than 50 nm. 3) the clay minerals content, TOC, and thermal evolution are major influences on pore structure (Zhu et al., 2016b; Wu et al., 2015, 2019; Cui et al., 2012; Kang, 2020; Duan, 2017; Xu J. et al., 2020; Hou et al., 2021a). In terms of dynamic evolution, the previous research has mainly focused on two aspects: 1) Geological comparison of shales with different mineral compositions, different OM abundances, and different thermal evolution maturity, using scanning electron microscopy, nitrogen adsorption, and other methods to evaluate the quantitative differences between pores (Curtis et al., 2012a). 2) High-temperature and high-pressure physical simulation of the evolution of low-mature shales using physical simulation apparatus, focusing on determining the characteristics of pore evolution during thermal evolution (Cui et al., 2012; Jiale et al., 2021; Wu et al., 2015; Zhen and Wei, 2018; Wu et al., 2019).
The Cretaceous Nenjiang Formation (NJ Fm) in the Songliao Basin contains large areas of organic-matter-rich (OMR) shales (Zeng et al., 2018; Xu Jiale et al., 2021; Yang et al., 2021). The dark shale in the first member of the NJ Fm alone has a cumulative thickness of 184.8 m, with an average of 90.5 m (Chi, 2010; Feng et al., 2011; Wang, 2014; Zheng et al., 2015), which suggests good oil exploration and development potential. The shales of the NJ Fm are of low maturity, making it an excellent target area for exploration of in-situ conversion (ICP) of shale oil (Zhao et al., 2018). An ICP breakthrough in this set of low-maturity shales would revitalize the old industrial base in Northeast China and improve the current energy situation of the entire country. In general, current research on the pore structures of NJ Fm shale is focused on static characteristics. For example, Kang (2020) noted that NJ Fm shale contains large numbers of mineral intergranular pores, with a few OM pores and mineral intragranular pores, and proposed that clay minerals are the main factors controlling pore development. Cheng et al. (2019) observed that OM pore sizes in the NJ Fm range between 30 and 500 nm, with the main peak at 70–130 nm. Duan (2017) determined that the pores of the NJ Fm shale are concentrated in two ranges: less than 100 nm, and 100–200 μm. On the whole, the pores of NJ Fm shale have been studied in terms of static rather than dynamic properties, and the influence of mineral composition, OM, diagenetic evolution, and hydrocarbon generation and expulsion have generally not been considered in discussion of the evolution of pore structures. Systematic research on the dynamic evolution of shales in the NJ Fm is therefore essential.
In this study, NJ Fm shale with low maturity from the Songliao basin is selected as the research object to observe changes in mineral composition, OM, and pore structures during thermal evolution, to reveal their interactions, and to establish a pore evolution model for NJ Fm shale. This is achieved using thermal simulation, combining field emission scanning electron microscopy (FE-SEM) observation, N2 adsorption, X-ray diffraction mineral analysis, organic carbon analysis, rock thermal analysis, and other methods, based on in-situ SEM characterization. The overall goal is to clarify the thermal evolution process of the shale and to improve basic geological understanding of shale oil.
Geological Background and Basic Information of Samples
Located in Northeast China, the Songliao Basin is a large depression petroliferous basin in which vast amounts of OMR shales were deposited during the Cretaceous. The Cretaceous NJ Fm is an important source rock series in the basin. It is divided into five sections from bottom to top, with the largest lake area during the deposition stage being 11.2 × 10⁴ km2. Shales in the first and second members of the NJ Fm are the most developed, with thicknesses of up to 200 m (Figure 1). The OM types are mainly type-I and type-II1, with total organic carbon (TOC) ranging from 0.14 to 14.4% (the average is 2.4%). Due to its low thermal evolution, the NJ Fm shale has low vitrinite reflectance (Ro), with values ranging from 0.40 to 0.68% (Zheng et al., 2015).
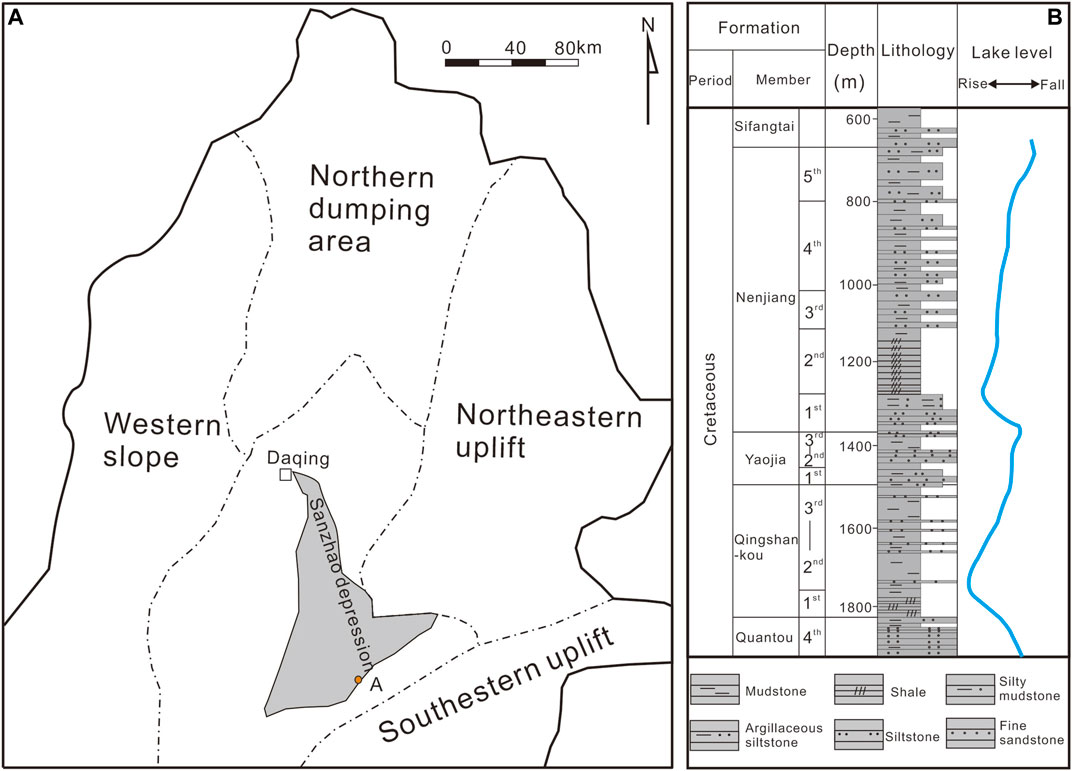
FIGURE 1. Location map (A) and strata column (B) of the study area.
The sample for the experiments in this study was taken from low-mature shale of the NJ Fm in well A in the slope area of the Sanzhao sag in the Songliao Basin. The Ro and TOC values are 0.58 and 9.3% respectively, with quartz, K-feldspar, albite, clay minerals, and pyrite contents of 52.2, 1.1, 4.8, 4.8, and 4.2% respectively. Illite-smectite and illite are the dominant clay minerals, with contents of 61 and 34% respectively. Chlorite content is 5% (Table 1).
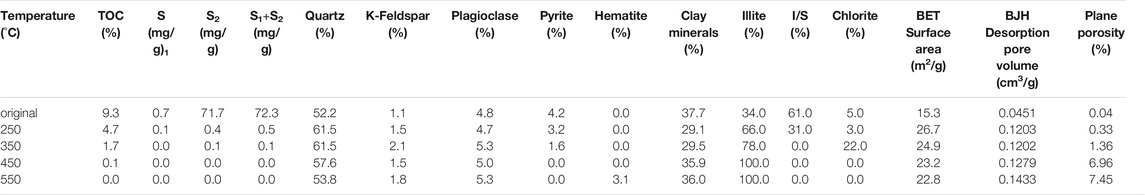
TABLE 1. Geochemical parameters, mineral composition, nitrogen adsorption, and plane porosity of samples at different temperatures.
Experimental Method
Physical Simulation Equipment and Procedure
Simulation was carried out using a high-temperature simulation device at the National Energy Tight Oil and Gas R and D Center. The simulation was based on the relationship between the vitrinite reflectance and thermal simulation temperature of the sampled shale and those of modern lacustrine mud (which were established by Wu et al. (2015)). The temperature increments were set to 250°C, 350°C, 450°C, and 550°C, with corresponding Ro set to 0.6, 1.3, 2.0, and 2.7% respectively (Figure 2). The original sample is extremely fragile, so great care had to be taken when preparing it to avoid cracking. The physical simulation experiment was therefore performed without external pressure.
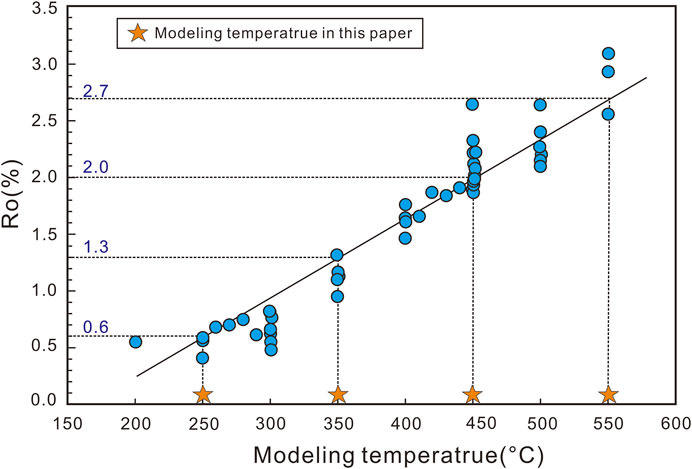
FIGURE 2. Relationship between simulated temperature and measured vitrinite reflectance (Ro) (modified after Wu et al., 2015).
The samples were divided into block and powder samples. The block samples were used for SEM analysis, and the powder samples for geological experiments and pore structure analysis. In order to ensure the scientificity of the experiment, the block and powder samples were both subjected to the same physical evolution process. The specific experimental process is as follows: 1) Sample preparation: prepare samples in 1 × 1 cm square blocks, with 2–3 mm thickness—argon ion polished but not carbon-coated—then prepare 120 g as powder, crushed to 200 mesh. 2) Select the region of interest for SEM imaging and take photos, then remove 30 g of the powder sample for nitrogen adsorption testing and TOC, pyrolysis, and X-ray diffraction mineral analysis. The results are labelled as ‘original sample’ data. 3) Select another 30 g of the powder sample and place the block sample and the powder sample together in the thermal simulation device, with the temperature set to 250°C and the heating rate to 2°C/h. The temperature is kept constant for 8 h once 250°C is reached. 4) remove both the block and the 30 g powder samples. For the block sample, the same region as step 2) is selected for in-situ SEM observation. For the 30 g powder sample, a second set of tests is performed, including nitrogen adsorption, TOC, pyrolysis, and X-ray diffraction mineral analysis. The results are labelled as “250°C sample” data. 5) Steps 3) and 4) are then repeated with the temperature set successively to 350°C, 450°C, and 550°C, maintaining the same heating rate and constant temperature holding time in each instance. In-situ SEM analysis, nitrogen adsorption, TOC, pyrolysis, and X-ray diffraction minerals analysis are carried out in sequence. The results are labelled as “350°C sample”, “450°C sample”, and “550°C sample” data.
In-situ SEM observation technology has previously been used in materials research, such as battery and composite metals (Tsurekawa et al., 2009; Uetsuji et al., 2002; Motoyama et al., 2015). A few studies have used the technology to study shale reservoirs (Wu, et al., 2015; Wu, et al., 2019; Cui, et al., 2012). It should be noted that in-situ SEM analysis effects comparative analysis by repeatedly observing the same region of the same sample, using SEM at the same magnification, as it is subjected to different thermal evolution conditions.
Mineralogy, Organic Geochemistry, and Pore System Characterization
The TOC and rock pyrolysis experiments were performed in the Key Laboratory of Petroleum Geochemistry of China National Petroleum Corporation (CNPC). The laboratory’s CS-i carbon-sulfur analyzer instrument was used to test the TOC of the 200 mesh powder samples under normal temperature and pressure conditions. A ROCK-EVAL6 pyrolysis instrument was used to carry out rock pyrolysis analysis of the 200 mesh powder samples. S1 was tested at a constant temperature of 300°C for 3 min, and S2 at a rising temperature rate of 25°C/min within the temperature range 300°C–650°C.
X-ray diffraction mineral analysis was carried out in the Key Laboratory of Oil and Gas Reservoirs, CNPC. The 200-mesh powder sample was analyzed using a Rigaku X-ray diffractometer. A SmartLab instrument was used for XRD non-clay minerals analysis, and the experiment was completed using a working voltage of 45 kV and a working current of 150 mA. A TTR instrument was used for XRD clay minerals analysis, with a working voltage of 48 kV and a working current of 100 mA.
FE-SEM analysis was carried out in the National Energy Tight Oil and Gas R andD Center using an Apreo FE-SEM instrument from FEI Inc. The working voltage was 2.00 kV and the working distance 4.0 mm. To ensure absolute precision, the electron microscope sample was not carbon coated.
The low-temperature nitrogen adsorption experiment was conducted at Peking University using an ASAP2020 instrument, using shale powder samples with a particle size of 200 mesh. The surface area referred to the Brunauer-Emmett-Teller (BET) surface area, and the desorption curve was selected to calculate the volume and size of pores according to the Barret-Joyner-Halenda (BJH) theory.
Experimental Results
Mineral Evolution
XRD mineral analysis shows that the minerals in the NJ Fm shales undergo different changes with increasing temperature during thermal evolution (Table 1; Figure 3).
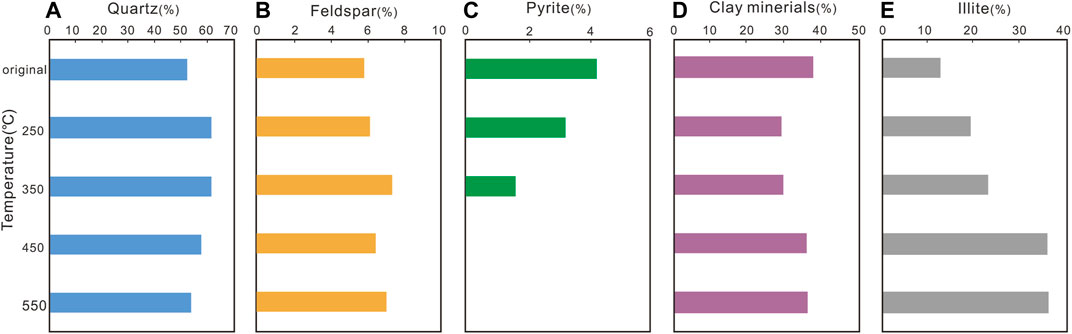
FIGURE 3. Changes of mineral content at different temperatures. (A)-Quartz, (B)-Feldspar, (C)-Pyrite, (D)-Clay minerals, (E)-Illite.
Evolution Characteristics of Non-clay Minerals
Between room temperature (about 20°C) and 250°C, the quartz content increases from 52.2 to 61.5%, then remains nearly stable between 250°C and 350°C but gradually decreases once the temperature exceeds 350°C (Table 1; Figures 3A). The content of K-feldspar and plagioclase shows good consistency, increasing slowly in tandem from room temperature to 350°C, then slowly decreasing between 350°C and 450°C, before slightly increasing again between 450°C and 550°C (Table 1; Figures 3B). From room temperature to 350°C, the content of pyrite decreases continuously until the temperature reaches 450°C, when it completely disappears as it transforms into hematite (Table 1; Figures 3C).
Evolution Characteristics of Clay Minerals
Like the evolution of non-clay minerals, the evolution of clay minerals is also complicated: the overall content of clay minerals first decreases and then increases as the temperature increases (Table 1; Figures 3D). During the thermal evolution process, the content of illite-smectite mixed layers gradually decreases, before disappearing as the temperature rises above 250°C. However, the content of illite increases, with all clay minerals converting to illite by the time the temperature reaches 450°C (Table 1; Figures 3E). The change in chlorite content is relatively complicated. Chlorite content initially decreases but then increases, with a substantial increase between 250°C and 350°C, before disappearing completely as the temperature exceeds 350°C (Table 1).
Evolution of Organic Geochemical Parameters
The organic geochemical analysis results show that TOC, S1, and S2 all decrease significantly with increase in the thermal simulation temperature, with the most dramatic changes being in the S1 and S2 values (Figure 4). Between room temperature and 250°C, TOC reduces by about 50%. Between 250°C and 350°C it reduces by a further 65% before reducing almost to zero as the temperature rises above 450°C (Table 1; Figures 4A). The evolutionary sequences of S1, and S2 are similar to that of TOC, with S1 and S2 values decreasing from 0.69 mg/g to 0.08 mg/g and from 71.65 mg/g to 0.44 mg/g respectively, and S1 decreasing to 0.03mg/g at 350°C (Table 1; Figure 4B,C).
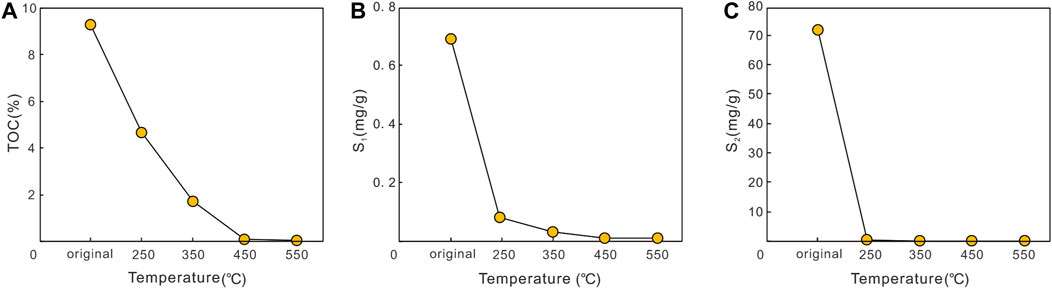
FIGURE 4. TOC (A), S1 (B), and S2 (C) changes at different temperatures.
Pore Structure Evolution
In-situ Scanning Electron Microscopy Analysis
The thermal evolution of pores related to inorganic minerals and OM was investigated using high-resolution in-situ SEM analysis. As mentioned, in-situ SEM achieves comparative analysis by observing the same region of the same sample, using SEM at the same magnification, at different stages of thermal evolution. Related geochemical and porosity tests were carried out at the same time.
1) Porosity related to inorganic minerals
The overall change in inorganic minerals is relatively small, with different minerals changing in different ways during thermal evolution. Pores related to plagioclase are mostly plagioclase intragranular pores (Figure 5A1). Oil can be observed in these pores as the thermal evolution temperature increases (Figure 5A2), with the pores being least developed at 350°C, and then increasing between 450°C and 550°C (Figure 5A4,5A5). Compared with plagioclase, intra/intergranular pores are barely developed in quartz. It is observed that pores at the granular edges of the quartz, surrounding by OM, increase with thermal evolution (Figure 5B1–B5). Intragranular pores of clay minerals develop (Figure 5C1), increasing with thermal evolution. Between 250°C and 350°C, intergranular pores of clay minerals increase rapidly, with the maximum pore volume occurring at 450°C (Figure 5C2–C5). Intergranular pores of pyrite grains are filled with OM (Figure 5D1). As the temperature increases, OM between pyrite crystals generates hydrocarbons, creating new pores. Meanwhile, the pyrite crystals become smaller so that intergranular pores tend to increase (Figure 5D2–D5).
2) Pores related to OM
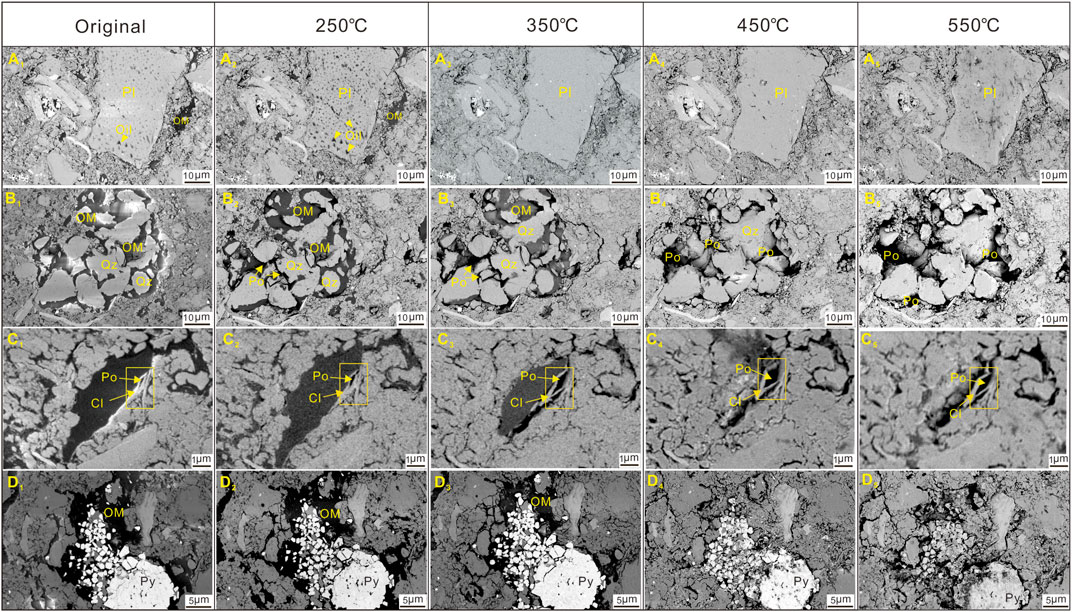
FIGURE 5. SEM images of different minerals at different temperatures. (A) series are plagioclase, (B) series are quartz, (C) series are clay minerals, (D) series are pyrites. Pl-plagioclase, Qz-quartz, OM-organic matter, Po-pore, Cl-clay minerals, Py-pyrites.
OM is abundant in the OMR shales of the NJ Fm, distributed in lumped, striped, and filling patterns (Figure 6). The OM can be divided into two types according to whether or not it contains pores. Some studies have found that shales with low maturity tend to have more OM-hosted pores than mature shales (Loehr et al., 2015; Wu Z. et al., 2020; Mark, E. et al., 2012). However, other studies have observed many OM-hosted pores in mature shales (Xu et al., 2020a, Xu et al., 2020b, Passey et al., 2010; Milliken et al., 2012, 2013). The pores are irregularly distributed within the OM (Figure 6-A1) and probably come from terrestrial woody debris (Wu Z. et al., 2020). It is difficult to determine whether OM without pores is bitumen or kerogen. In pores with OM, (Figure 6-A1), the pores gradually increase between room temperature and 250°C. At 350°C, the OM has pyrolyzed thoroughly and has nearly disappeared (Figure 6-A3, A4, A5). A pyrite grain was briefly observed at 450°C, but disappeared at 550°C (Figure 6-A4,A5). This was probably due to collapse of existing pyrite during thermal evolution rather than generation of new pyrite. For OM without pores, microcracks develop between OM and minerals when the sample is heated to 250°C (Figure 6-B1-B2, C1-C2, D1-D2). The microfractures are more developed when the temperature reaches 350°C (Figure 6-B3, C3, D3). However, the OM is almost completely decomposed when the sample reaches a high-/over-mature stage at 450°C–550°C, with almost all the OM being transformed into pores (Figure 6-B4-B5, C4-C5, D4-D5).
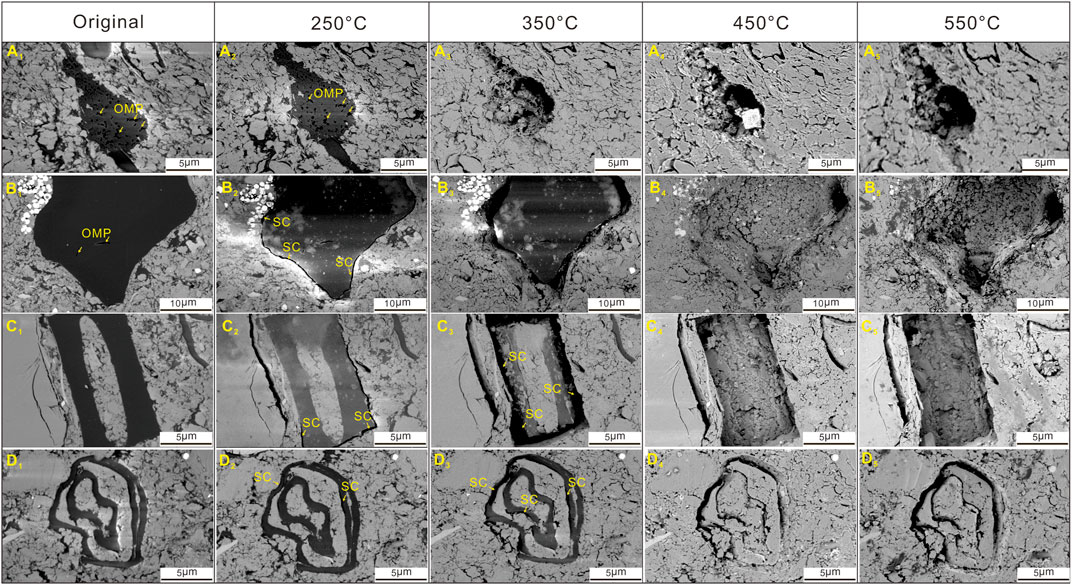
FIGURE 6. SEM images of OM at different temperatures. OMP-OM pores, SC-shrinkage crack.
Since there are obvious changes in OM during thermal evolution, image analysis was performed to quantify the variation. The same region of the SEM images was selected at different temperatures and the surface area, pore numbers, and distributions of pores with different sizes were calculated using Avizo software (Figure 7). Statistical analysis was performed on the results. The black areas represent OM (Figure 7-A1-E1) and the blue areas represent pores (Figure 7-A2-E2). Porosity increases considerably between the starting temperature and 550°C (Figure 7-A2-E2). The results show that plane porosity increases from 0.33% (original) to 7.45% (550°C) during thermal evolution. Generally, both the equivalent pore diameter and the total surface of large pores increase with thermal evolution. From room temperature to 550°C, the peak value of equivalent pore diameter increases from 300 to 400 nm to more than 800 nm, and the surfaces of pores with diameters of 300–400 nm decrease from 53.24 to 10.26%. The surface areas of pores with diameters greater than 800 nm increase from 14.93 to 69.11% (Figure 7-A3, B3, C3, D3, E3). In terms of pore amounts, pore diameters in the original sample are concentrated in the range 300–400 nm, and the number of pores increases from 271 to 20981 (Figure 7-A4, B4, C4, D4, E4). This reveals that the number of larger OM pores increases during the thermal evolution process.
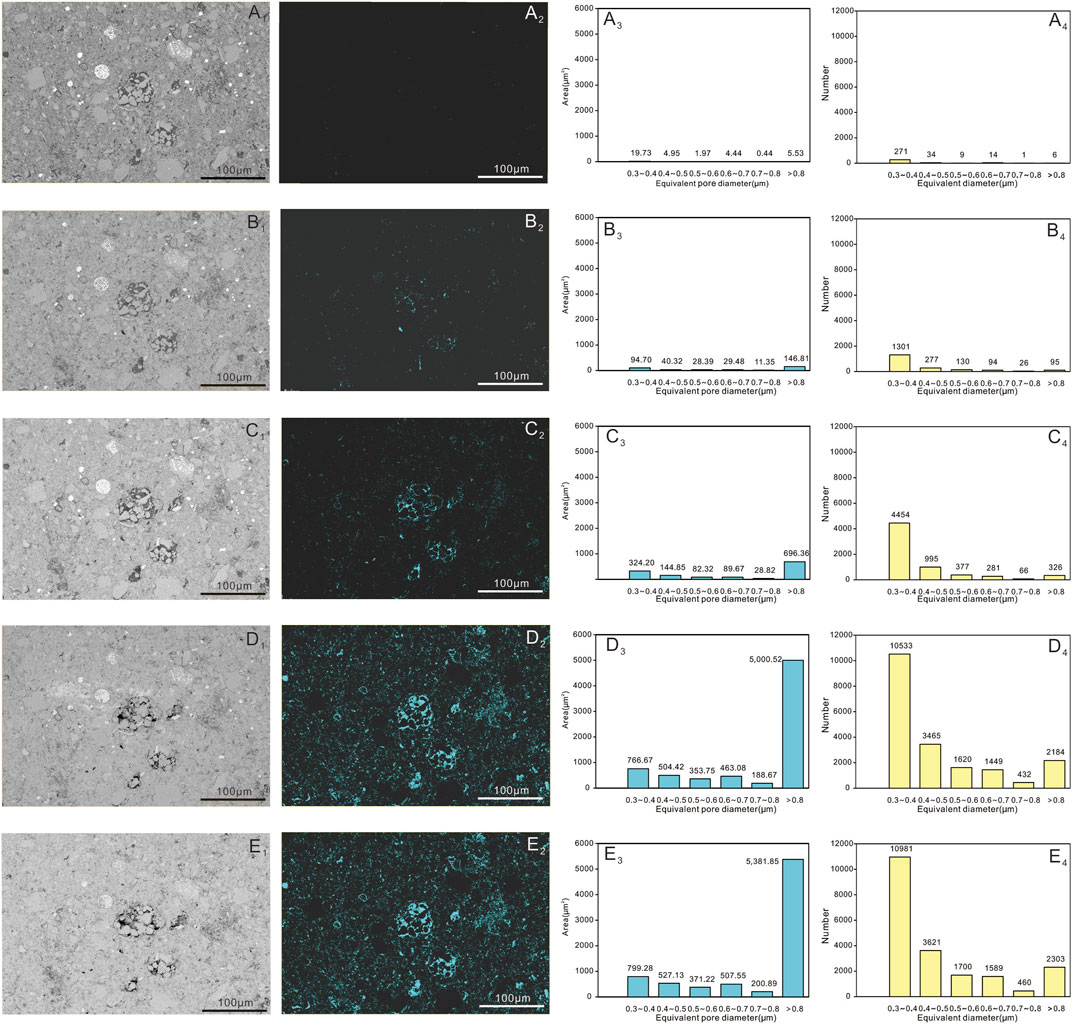
FIGURE 7. Plane porosity of shale samples at different temperatures shown by image analysis. (A) series are original samples, (B) series are samples at 250°C, (C) series are samples at 350°C, (D) series are samples at 450°C, and (E) series are samples at 550°C.
Nitrogen Adsorption
Quantitative evaluation of pores with diameters of less than 200 nm is based on nitrogen adsorption experiments. The results in this study show that more than 65% of the pores in the samples have diameters of between 2 and 50 nm. As the simulated temperature increases, overall pore volume also gradually increases (Figure 8). Between room temperature and 550°C, the BJH pore volume increases from 0.04510 cm3/g to 0.1433 cm3/g, an increasing ratio exceeding 317%. The BET surface area increases from 15.3073 m2/g to 22.805 m2/g, an increasing ratio of 148%.
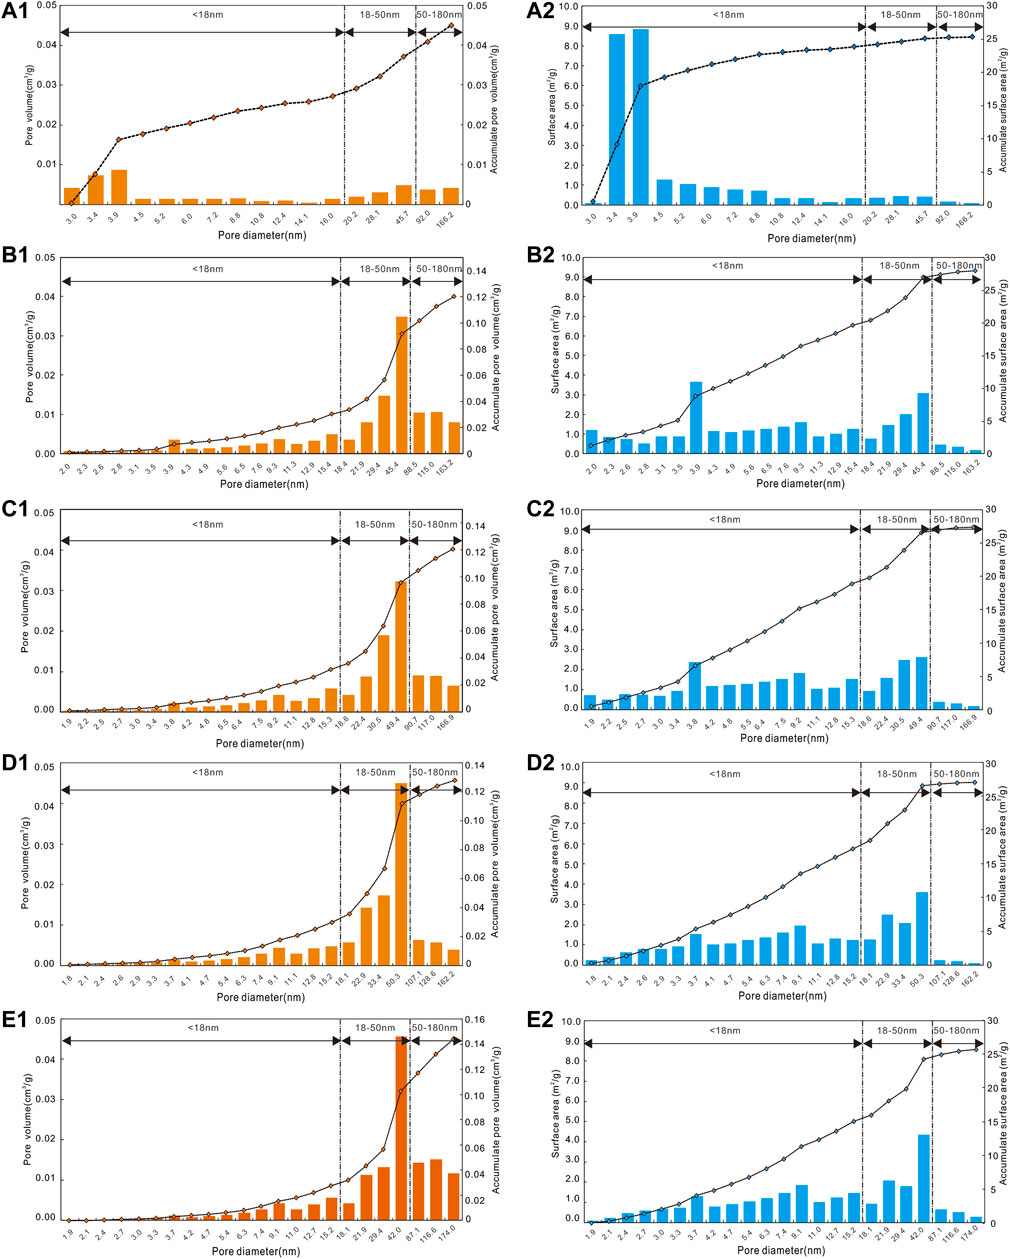
FIGURE 8. BJH pore volume and BET surface area distribution at different temperatures. (A)-original sample, (B)-250°C, (C)-350°C, (D)-450°C, (E)-550°C.
From the perspective of BJH pore volume, the original samples have two peaks of pore diameters, at 3.92 and 45.74 nm, with the 3.92 nm peak being higher (Figure 8-A1). When the temperature increases to 250°C, the 3.92 nm peak reduces, the proportion of macropores increases, and a single pore peak develops at a diameter of 45.45 nm (Figure 8-B1). Between 250°C and 350°C, the volume of mesopores further increases, and overall pore volume increases, with a pore diameter of about 30 nm (Figure 8-C1). At 450°C, the volume of pores with a diameter of 22.9 nm further increases (Figure 8-D1). As the temperature rises to 550°C, the volume of pores with diameters greater than 80 nm increases, while the volume of pores with diameters of about 20 nm decreases significantly (Figure 8-E1). During the entire thermal evolution process, the main peak of BJH pore volume remains between diameters of 40–50 nm, and the change point of BJH pore volume appears at diameters of 18–20 nm.
Analysis of BET surface area shows that the original sample has a single-peak distribution, with pore diameters of 3–4 nm (Figure 8-A2). When heated to 250°C, BET surface area shows a bimodal distribution, with corresponding peaks at diameters of 3.88 and 45.45 nm (Figure 8-B2). In the subsequent thermal evolution process, at temperatures between 250°C and 350°C, this pattern is still basically maintained (Figure 8-C2). Overall BET surface area distribution reverts to a unimodal distribution between 450°C and 550°C, with the peak corresponding to a diameter range of 50.27–41.96 nm (Figure 8-D2, 7-E2).
Combining the accumulation curves of BJH pore volume and BET surface area for the original sample, a sudden increase appears at a diameter of 4.49 nm in both curves. Pores with diameters of 3.44–4.49 nm appear to contribute most of the porosity. Following thermal evolution, sudden increases in the cumulative curves of both BJH volume and BET surface area appear at a point corresponding to pores of about 90 nm diameter, with pores with diameters of 20–90 nm contributing greatly to porosity. This indicates that, overall, pores become larger during the evolution process. The BJH pore volume increases to 3.2 times the original volume as the temperature increases from 20°C to 550°C.
To find the law of pore variation during thermal evolution, further analysis was performed. The relationships between pore volume and temperature show different features for pore sizes in different ranges. The thresholds are 18 and 50 nm (Figure 9). Pores within the diameter range of 18–50 nm contribute most to overall pore volume, a proportion which increases with increase in temperature, with a high degree of correlation. The volume of pores with a diameter of less than 18 nm increases initially but then decreases with increasing temperature, showing a relatively good correlation with temperature change. The volume of pores with diameters of more than 50 nm initially increases and then decreases with increasing temperature, but with a low degree of correlation.
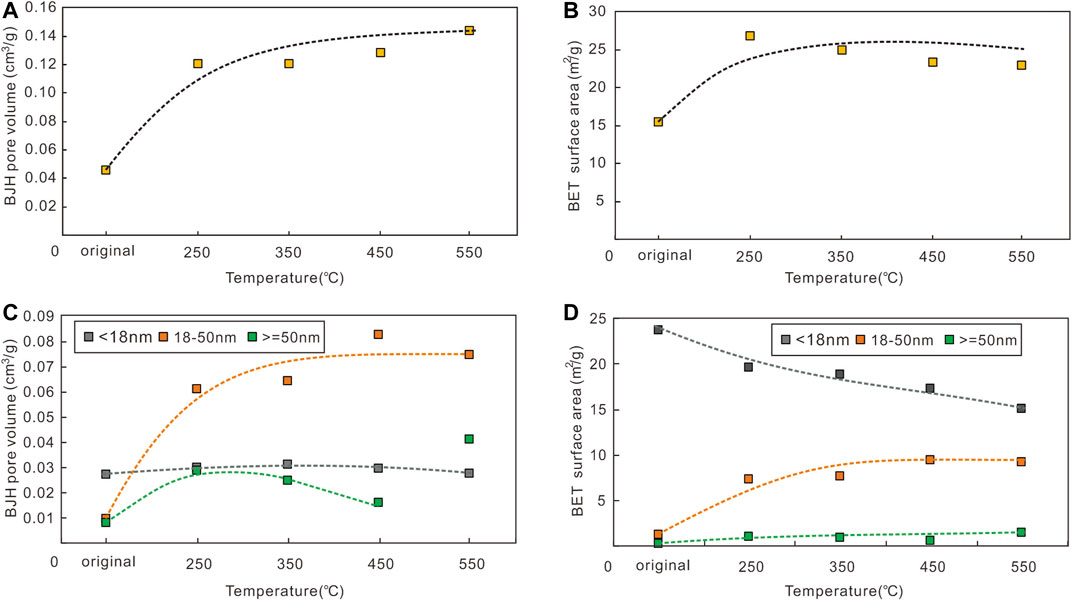
FIGURE 9. Cumulative BJH pore volume and cumulative BET surface area characteristics of samples at different temperatures. A\C-Temperature vs BJH pore volume, B\D-Temperature vs BET surface area.
Discussion
Mineral Evolution Characteristics
The overall content of minerals such as quartz and feldspar changes only slightly during the thermal evolution of OMR shales, but the clay minerals content changes considerably (Wu et al., 2015; 2019). In this study it is found that contents of minerals such as quartz and feldspar in the OMR shales of the NJ Fm are relatively stable during thermal evolution. Although the XRD mineral content increases at first and then decreases, it is generally consistent. The content of clay minerals drops between room temperature and 250°C, but increases continuously above 250°C (Figure 3). Clay minerals, particularly illite, show an overall increasing trend, which is consistent with previous research results (Cui et al., 2012; Wu et al., 2015; Xu XY. et al., 2021). Due to low thermal evolution, the clay mineral content consists mainly of illite-smectite mixed layers which transform into illite between room temperature and 250°C. During this process, Si4+ ions are released which provide source material for authigenic quartz, which leads to an increase in quartz content. Between 250°C and 350°C, given that a large proportion of the illite and illite-smectite mixed layers has already been converted into illite, fewer Si4+ ions are released and the quartz content tends to stabilize. Meanwhile, pyrites partially crack due to the high temperature, releasing Fe2+, Fe2+ and Mg2+ ions which combine with other substances to form chlorites. There is therefore a significant increase in the content of chlorite at 350°C (Figure 3). As the temperature increases from 350°C to 450°C, quartz partially cracks so the quartz content decreases, and more non-clay minerals are transformed into clay minerals leading to increasing clay minerals content. At the same time, clay minerals are transformed into illite and chlorite, with the chlorite produced also finally transforming into illite due to the high temperature. The quartz content reduces further between 450°C and 550°C, with only a few of the released Si4+ ions being converted into clay minerals, while the remainder are partially converted into feldspar.
Organic Matter Evolution
The genesis of OM pores is extremely complicated (Curtis et al., 2012b; Cardott et al., 2015; Mastalerz et al., 2013; Bernard et al., 2012; Bernard and Horsfield, 2014) and is beyond the scope of this study, which focuses on OM and OM-related pores. During the high-temperature and high-pressure evolution of OMR shales, the contribution of OM to pores is greater than that of changes in mineral composition (Loucks et al., 2009; Jarvie et al., 2007). The in-situ SEM analysis results confirm that OM in the OMR shales in the NJ Fm makes a similar contribution. At relatively low temperatures, lumped, striped, and filling OM (Figure 6-B1, C1, D1) seems to be more sensitive to temperature than OM with OM-hosted pores (Figure 6-A1). This is because the lumped, striped, and filling OM is likely to be related to bitumen, while OM with OM-hosted pores is probably residual kerogen which pyrolyzes less easily. Obvious heat shrinkage cracking can be observed between room temperature and 250°C (Figure 6). This is because the OM is entering the oil-generation window, so it begins to crack and generate hydrocarbons (Hou et al., 2021b; Ma et al., 2020; Hou et al., 2020). It is observed that OM pyrolysis begins at the contact boundary with other minerals. When the OM enters the gas-generation window at 350°C, following initial cracking and hydrocarbon generation, the occurrence of pyrolysis becomes more obvious and produces a large number of new pores. Almost all of the OM is completely decomposed by the time it enters the high-/over-mature stage at 450°C, and the spaces originally occupied by OM have almost completely changed into pores (Figure 6). The BJH pore volume of the sample increases by a factor of x3.2 as the temperature increases to 550°C. It can be concluded that the thermal evolution process of solid OM in shale follows the hydrocarbon generation law of source rocks, and that the generation of large numbers of OM pores is controlled by the oil- and gas-generation windows.
Pore Evolution Model
As mentioned, the pores of the original shale samples consist of clay minerals inter/intragranular pores, feldspar dissolution pores, and pyrite intergranular pores, with only a few OM pores. It is easily established that minerals such as quartz and feldspar do not change significantly during thermal evolution (Figure 8). However, clay minerals and OM change markedly. Single factor analysis confirms that the contents of quartz, K-feldspar, and plagioclase are not strongly correlated with pore volume (Figure 10). The original sample contains diverse pore types, the range of pore sizes is wide, and the pores can be classified in three ranges—<18 nm, 18–50 nm, and >50 nm—according to pore size. It is found in this study that, except for illite, the content of other minerals has little effect on pore volume (Figure 11), which confirms the positive contribution of clay mineral evolution to increasing porosity during thermal evolution. Moreover, the content of illite has a strong correlation with pores with diameters in the range 18–50 nm. As the content of illite increases, the volume of pores with diameters in this range increases linearly, with good correlation. Based on previous results, it can be concluded that quartz and feldspar contribute little to porosity, while OM and clay minerals, particularly illite, contribute significantly.
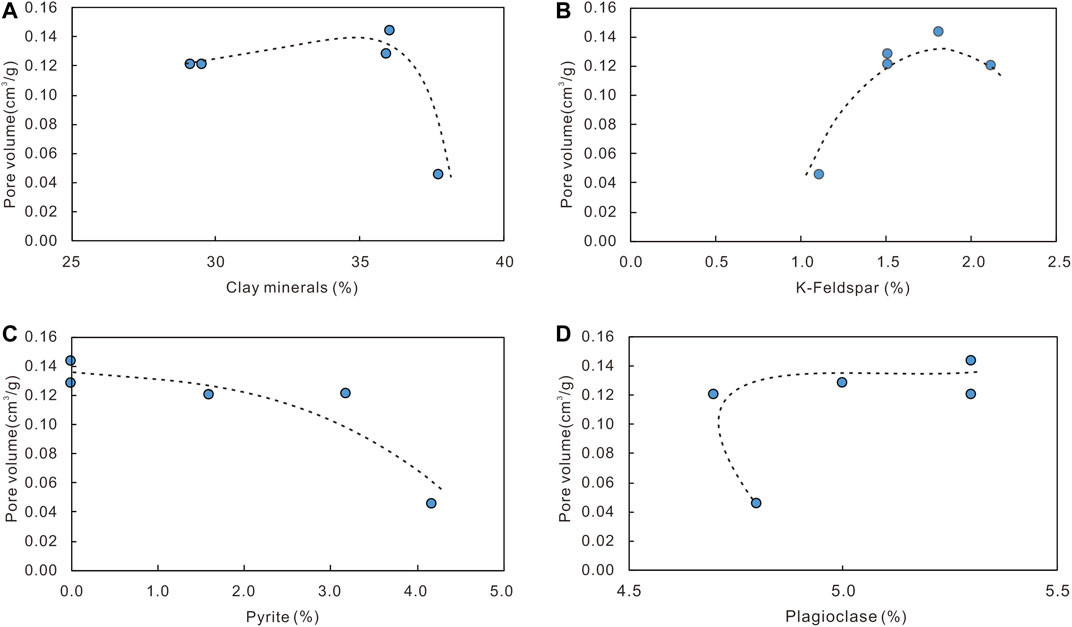
FIGURE 10. Relationship among different minerals and pore volume. (A)-clay minerals vs pore volume, (B)-feldspar vs pore volume, (C)-pyrite vs pore volume, (D)-plagioclase vs pore volume.
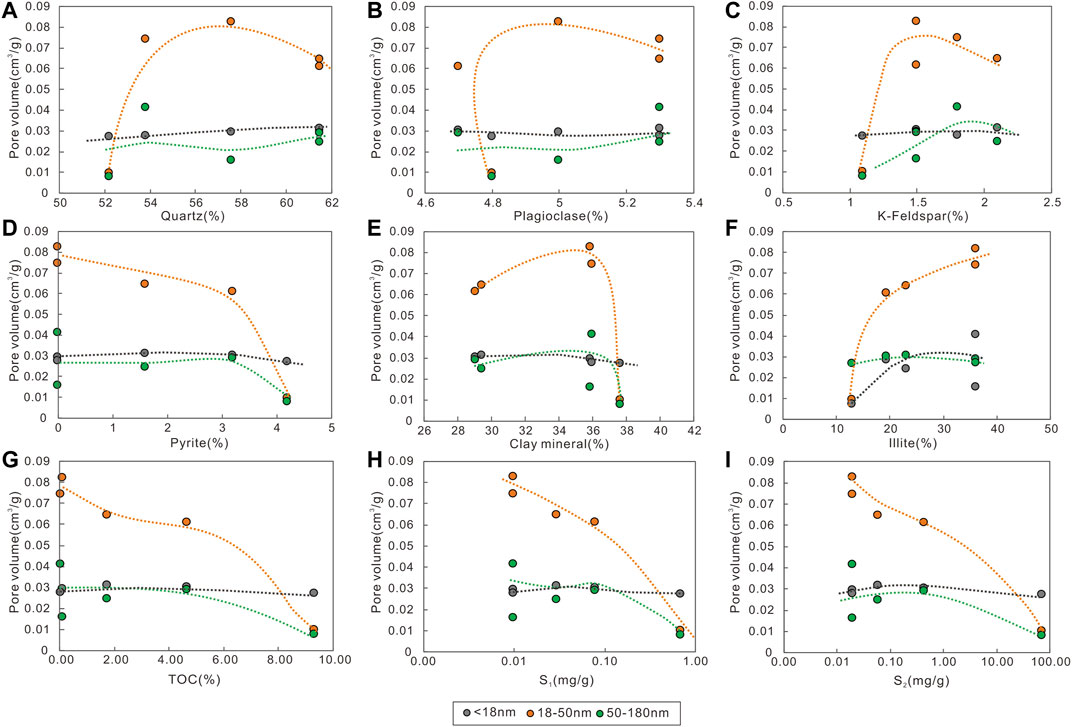
FIGURE 11. Relationship between mineral contents and pore volumes. (A)-quartz vs pore volume, (B)-plagioclase vs pore volume, (C)-k-feldspar vs pore volume, (D)-pyrite vs pore volume, E-clay minerals vs pore volume, F-illite vs pore volume, G-TOC vs pore volume,H-S1 vs pore volume, I-S2 vs pore volume.
From the perspective of pore size, the pores in the original sample are mostly in the ranges 3–5 nm and 20–180 nm, with a marked ‘bimodal’ distribution. After thermal evolution, the 20–280 nm pores are more developed, with pores in the range 18–50 nm showing the most obvious change. It is observed that pores in low-mature shale become larger during thermal evolution and become dominated by mesopores. Combined with the FE-SEM image analysis results, the porosity of the sample at five temperature points—room temperature, 250°C, 350°C, 450°C, and 550°C—is 0.04, 0.33, 1.36, 6.96, and 7.45% respectively (Figure 7). It should be noted that there may be disagreement between the porosity change results given by nitrogen adsorption and image analysis, principally in two aspects: 1) The porosity results from nitrogen adsorption and SEM image analysis have the same overall change trend; both increasing with increasing temperature. However, the overall change trend of porosity according to nitrogen adsorption is slow, and the critical period of porosity increase is between room temperature and the oil-generation window (250°C) (Figure 8-A1, B2; Figures 9–A,B). Image analysis results show two critical periods; one between room temperature and the oil-generation window (250°C) (Figure 7-A2、B2), and another between the gas-generation window (350°C) and 450°C (Figure 7-C2,D2). The likely explanation for this is the difference in testing range between nitrogen adsorption and image analysis. Nitrogen adsorption testing is adapted to pores with diameters of 2–200 nm while the range for image analysis is > 300nm. This means that the pores that are detected in image analysis are larger than those detected by nitrogen adsorption. Between the low-mature stage (room temperature) and the mature stage (oil-generation window), OM shrinkage pores with small sizes are detected by nitrogen adsorption. However, once the OM enters the oil-generation window, and as it evolves to a high-/over-mature stage, larger areas of the OM begin to crack, forming larger pores that exceed the testing range of nitrogen adsorption but fall within the range for detection by image analysis. A sudden apparent increase in porosity following entry into the gas-generation window can therefore be observed in the image analysis results. 2) Nitrogen adsorption analysis results indicate that the majority of pores are in the 18–50 nm range. If this were the case, the porosity change of 18–50 nm pores should be consistent with change of total porosity. However, it is found that the porosity of 18–50 nm pores decreases while the total nitrogen adsorption porosity continues to increase after 450°C (the high-/over-mature stage). This may be because small pores merge into macropores, which are beyond the range of nitrogen adsorption detection, but can be identified by image analysis, which therefore shows an increase in porosity above 450°C.
Based on this research, a pore evolution model for the OMR shales in the NJ Fm is developed (Figure 12). The original sample is dominated by inter/intra-granular pores of clay minerals at room temperature (20°C). When the temperature is increased to 250°C, the content of clay minerals decreases as the illite-smectite mixed layers transform to illite, leading to an increase in illite content, while the inorganic pores remain unchanged. Meanwhile, OM shrinks to form shrinkage pores and cracks, a process that leads to a slight increase in OM pores as well as an increase in total pore volume. During this period, pores with diameters of 18–50 nm make the greatest contribution to overall porosity. As the temperature is raised to 350°C, clay minerals are increasingly transformed into illite, and inter/intra-granular and intercrystalline pores of illite increase. At the same time, the OM is more intensively cracked by heat, so the volume of OM pores increases markedly, producing a significant increase in the total pore volume as the temperature rises towards 450°C. By the time the temperature reaches 450°C, almost all the clay minerals have been transformed to illite, so the mineral contents stabilize while the OM is still undergoing pyrolysis. OM pore volume and total pore volume both increase, and the evolution of the entire shale sample enters a peak period. At 550°C, the thermal evolution of the sample is complete. The mineral content is stable and all of the OM has been pyrolyzed, so the total pore volume has reached its maximum.
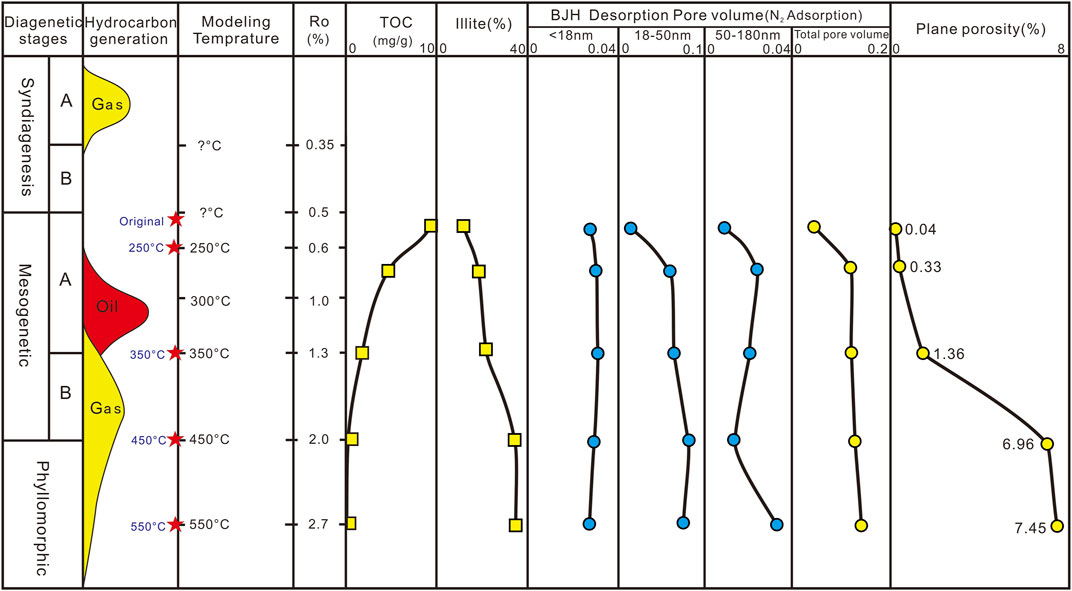
FIGURE 12. Porosity evolution model of OMR shales from NJ Fm.
Conclusion
1) The pore structure of lacustrine shales is complex, affected by mineralogy and OM content as well as maturity. The shales of the NJ Fm, with TOC of 9.3%, represent typical OMR shales in lacustrine basins. The pore system is dominated by inorganic mineral pores, including inter-granular dissolution pores of plagioclase and inter/intra-granular pores of illite-smectite mixed layers, with only a small number of OM pores.
2) Porosity increases continuously with maturity, and the pore system varies at different maturity stages. The main contributors to new pores are OM pores and clay mineral pores. Clay mineral pores with diameters of 18–50 nm are the principal contributors between the low maturity stage and the oil-generation window. OM pores with diameters greater than 50 nm comprise the majority of generated pores between the gas-generation window and the high-/over-mature stage.
3) Porosity evolution is controlled by illite content and OM abundance. Total pore volume correlates positively with illite content but negatively with OM abundance. From the low-mature stage to the high-/over-mature stage, inter/intra-granular pores of illite are generated as clay minerals consistently transform into illites. At the same time, OM is continuously consumed to form large numbers of OM pores, which leads to an incremental increase in overall porosity.
Data Availability Statement
The original contributions presented in the study are included in the article/Supplementary Material, further inquiries can be directed to the corresponding authors.
Author Contributions
The author’s contributions are as follows:XJ, SW and LH have substantial contributions to the conception or design of the research work. XJ wrote the draft individually and completed the revision of the article with SW and LH. MG did the TOC content,rock pyrolysis experiment and nitrogen adsorption experiment. FZ completed the scanning electron microscopy imaging work and got the high resolution images. JG has done the image analysis work of plane porosity, LS did the data sorting, statistics work. FL did work on the text modification. LD prepared the samples for the study.
Funding
This study was supported by the National Natural Science Foundation of China (Grant No. 42072187), and Major science and technology project of PetroChina Co., Ltd (Grant Nos. 2019E26-01; 2021DJ04).
Conflict of Interest
All authors of this manuscript are employed by RIPED/CNPC. No other conflicts of interest are declared.
Publisher’s Note
All claims expressed in this article are solely those of the authors and do not necessarily represent those of their affiliated organizations, or those of the publisher, the editors, and the reviewers. Any product that may be evaluated in this article, or claim that may be made by its manufacturer, is not guaranteed or endorsed by the publisher.
Acknowledgments
We thank Xiaohong Li, Chao Ren, Jingfang Bai, Hang Jiao, and Huadong Li for their support in carrying out the experimental analysis. We thank Li Wan for assistance in article revising. We also thank the reviewers for their constructive suggestions, which helped immeasurably in improving the article.
References
Bernard, S., Horsfield, B., Schulz, H. M., Wirth, R., Schreiber, A., and Sherwood, N. (2012). Geochemical Evolution of Organic-Rich Shales with Increasing Maturity: a Systematic Study of the Posidonia Shale (Lower Toarcian, Northern Germany). Mar. Pet. Geology. 31 (1), 0–89. doi:10.1016/j.marpetgeo.2011.05.010
Bernard, S., and Horsfield, B. (2014). Thermal Maturation of Gas Shale Systems. Annu. Rev. Earth Planet. Sci. 42, 635–651. doi:10.1146/annurev-earth-060313-054850
Cardott, B. J., Landis, C. R., and Curtis, M. E. (2015). Post-oil Solid Bitumen Network in the Woodford Shale, USA—a Potential Primary Migration Pathway. Int. J. Coal Geology. 139 (1). doi:10.1016/j.coal.2014.08.012
Cheng, X., Xu, S., Hao, F., Song, H., Yang, F., Gou, Q. Y., et al. (2019). Origin of Organic Pores in the Organic-Rich Shale of Nenjiang Formation, Songliao Basin, China. Geol. Sci. Tech. Inf. 38 (04), 62–69. doi:10.19509/j.cnki.dzkq.2019.0408
Chi, X. Y. (2010). Characteristics and Sedimentary Environment of Oil Shale in the Upper Cretaceous of Songliao basin. J. Oil Gas Tech. (04), 161–165.
Cui, J. W., Zou, C. N., and Zhu, R. K. (2012). New Advances in Shale Porosity Research. Adv. Earth Sci. 27 (12), 1319–1325.
Curtis, M. E., Cardott, B. J., Sondergeld, C. H., and Rai, C. S. (2012b). Development of Organic Porosity in the Woodford Shale with Increasing thermal Maturity. Int. J. Coal Geology. 103, 26–31. doi:10.1016/j.coal.2012.08.004
Curtis, M. E., Sondergeld, C. H., Ambrose, R. J., and Rai, C. S. (2012a). Microstructural Investigation of Gas Shales in Two and Three Dimensions Using Nanometer-Scale Resolution Imaging. Bulletin 96 (4), 665–677. doi:10.1306/08151110188
Du, J. H., Hu, S. Y., Pang, Z. l., Lin, S. H., Hou, L. H., and Zhu, R. K. (2019). The Types, Potentials and Prospects of continental Shale Oil in China. China Pet. Exploration (05), 560–568.
Duan, Y. Y. (2017). The Pore Characteristics of Shale of the Upper Cretaceous Nenjiang Formation in Songliao basin and its Relation to Diagenesis –Taking Songke 1 and 2 wells as an Example. Beijing: China University of Geosciences, 5.
Feng, Z., Fang, W., Li, Z., Wang, X., Huo, Q., Huang, C., et al. (2011). Depositional Environment of Terrestrial Petroleum Source Rocks and Geochemical Indicators in the Songliao Basin. Sci. China Earth Sci. 54, 1304–1317. doi:10.1007/s11430-011-4268-0
Hou, L., Luo, X., Zhao, Z., and Zhang, L. (2021a). Identification of Oil Produced from Shale and Tight Reservoirs in the Permian Lucaogou Shale Sequence, Jimsar Sag, Junggar Basin, NW China. ACS Omega 6, 2127–2142. doi:10.1021/acsomega.0c05224
Hou, L., Ma, W., Luo, X., and Liu, J. (2020). Characteristics and Quantitative Models for Hydrocarbon Generation-Retention-Production of Shale under ICP Conditions: Example from the Chang 7 Member in the Ordos Basin. Fuel 279, 118497. doi:10.1016/j.fuel.2020.118497
Hou, L., Ma, W., Luo, X., Liu, J., Liu, S., and Zhao, Z. (2021b). Hydrocarbon Generation-Retention-Expulsion Mechanism and Shale Oil Producibility of the Permian Lucaogou Shale in the Junggar Basin as Simulated by Semi-open Pyrolysis Experiments. Mar. Pet. Geology. 125, 104880. doi:10.1016/j.marpetgeo.2020.104880
Jarvie, D. M., Hill, R. J., Ruble, T. E., and Pollastro, R. M. (2007). Unconventional Shale-Gas Systems: the Mississippian Barnett Shale of north-central Texas as One Model for Thermogenic Shale-Gas Assessment. Bulletin 91 (4), 475–499. doi:10.1306/12190606068
Jia, C. Z., Zheng, M., and Zhang, Y. F. (2012). Unconventional Hydrocarbon Resources in China and the prospect of Exploration and Development. Pet. Exploration Dev. (02), 129–136. doi:10.1016/s1876-3804(12)60026-3
Jia, C. Z. (2020). Development Challenges and Future Scientific and Technological Research in China’s Petroleum Industry Upstream. Acta Petrolei Sinica (12), 1445–1464.
Jin, Z. J., Bai, Z. R., Gao, B., and Li, M. W. (2019). Has China Ushered in the Shale Oil and Gas Revolution. Oil Gas Geology. (03), 451–458.
Kang, L. (2020). Pore Fractal Characteristics of Lacustrine Shale of Upper Cretaceous Nenjiang Fm from the Songliao Basin, NE China. Beijing: China University of Geosciences, 5. doi:10.27493/d.cnki.gzdzy.2020.000962
Liu, J., Wang, J., Zhang, B. Z., Yang, Y., and Wang, L. (2021). Genesis and Oil-Bearing Characteristics of Micro-nano Pores in Shale Reservoir of the Lucaogou Formation in Jimusar Depression. Xinjiang Geology. 39 (01), 94–98.
Loehr, S., C., Baruch, E. T., Hall, P. A., and Kennedy, M. J. (2015). Is Organic Pore Development in Gas Shales Influenced by the Primary Porosity and Structure of Thermally Immature Organic Matter. Org. Geochem. A Publ. Int. Assoc. Geochem. Cosmochemistry 87, 119–132. doi:10.1016/j.orggeochem.2015.07.010
Loucks, R. G., Reed, R. M., Ruppel, S. C., and Jarvie, D. M. (2009). Morphology, Genesis, and Distribution of Nanometer-Scale Pores in Siliceous Mudstones of the Mississippian Barnett Shale. J. Sediment. Res. 79, 848–861. doi:10.2110/jsr.2009.092
Ma, W. J., Hou, L. H., Luo, X., Liu, J. Z., Tao, S. Z., Guan, P., et al. (2020). Generation and Expulsion Process of the Chang 7 Oil Shale in the Ordos Basin Based on Temperature-Based Semi-open Pyrolysis: Implications for In-Situ Conversion Process. J. Pet. Sci. Eng. 190, 1–14. doi:10.1016/j.petrol.2020.107035
Mastalerz, M., Schimmelmann, A., Drobniak, A., and Chen, Y. (2013). Porosity of Devonian and Mississippian New Albany Shale across a Maturation Gradient: Insights from Organic Petrology, Gas Adsorption, and Mercury Intrusion. Bulletin 97 (10), 1621–1643. doi:10.1306/04011312194
Milliken, K. L., Esch, W. L., Reed, R. M., and Zhang, T. (2012). Grain Assemblages and strong Diagenetic Overprinting in Siliceous Mudrocks, Barnett Shale (Mississippian), Fort Worth Basin, Texas. Bulletin 96 (8), 1553–1578. doi:10.1306/12011111129
Milliken, K. L., Rudnicki, M., Awwiller, D. N., and Zhang, T. (2013). Organic Matter-Hosted Pore System, Marcellus Formation (Devonian), Pennsylvania. Bulletin 97 (2), 177–200. doi:10.1306/07231212048
Motoyama, M., Ejiri, M., and Iriyama, Y. (2015). In-situ Scanning Electron Microscope Observations of Strain-Confined Lithium Nucleation at Electrode/electrolyte Interfaces in All-Solid-State-Lithium Battery. MRS Proc. 1754, 25–30. doi:10.1557/opl.2015.584
Passey, Q. R., Bohacs, K. M., Esch, W. L., Klimentidis, R., Sinha, S., et al. (2010). From Oil-Prone Source Rock to Gas-Producing Shale Reservoir-Geologic and Petrophysical Characterization of Unconventional Shale Gas Reservoirs. The CPS/SPE International Oil and Gas Conference and Exhibition. Beijing: Society of Petroleum Engineers, 1–29 doi:10.2118/131350-ms
Tsurekawa, S., Fukino, T., and Matsuzaki, T. (2009). In-situ SEM/EBSD Observation of Abnormal Grain Growth in Electrodeposited Nanocrystalline Nickel. Int. J. Mater. Res. (formerly Z. fuer Metallkunde) 1006, 800–805. doi:10.3139/146.110119
Uetsuji, Y., Zako, M., and Nishiyabu, K. (2002). Numerical Analysis and In-Situ SEM Observation of Damage Development for Woven Fabric Composite Materials. J. Soc. Mater. Sci. Jpn. 5110, 1147–1153. doi:10.2472/jsms.51.1147
Wang, M., Guan, Y., Li, C. M., Liu, Y., and Liu, W. (2018). Qualitative Description and Full-Pore-Size Quantitative Evaluation of Pores in Lacustrine Shale Reservoir of Shahejie Formation,Jiyang Depression. Oil Gas Geology. 39 (06), 1107–1119.
Wang, M. (2014). The Generation and Potential of Shale Oil for N1 and N2 Interval in Northern SongLiao basin, 5. Daqing, China: Northeast Petroleum University.
Wu, S. T., R K, Zhu., Cui J W, , Mao, Z. G., and Liu, K. Y. (2020a). Ideas and prospect of Porous Characterization in Unconventional Reservoirs. Geol. Rev. 66 (S1), 151–154. doi:10.16509/j.georeview.2020.s1.058
Wu, S. T., R K, Zhu., Li, X., Jin, X., and Yang, Z. (2018). Evaluation and Application of Porous Structure Characterization Technologies in Unconventional Tight Reservoirs. Earth Sci. Front. 25 (02), 191–203. doi:10.13745/j.esf.yx.2017-6-2
Wu, S. T., Zou, C. N., Zhu, R. K., Yuan, X. J., and Yao, J. L. (2015). Reservoir Quality Characterization of Upper Triassic Chang 7 Shale in Ordos basin. J. China Univ. Geosciences (11), 1810–1823.
Wu, S., Yang, Z., Zhai, X., Cui, J., Bai, L., Pan, S., et al. (2019). An Experimental Study of Organic Matter, Minerals and Porosity Evolution in Shales within High-Temperature and High-Pressure Constraints. Mar. Pet. Geology. 102, 377–390. doi:10.1016/j.marpetgeo.2018.12.014
Wu, Z., He, S., Han, Y., Zhai, G., He, X., and Zhou, Z. (2020b). Effect of Organic Matter Type and Maturity on Organic Matter Pore Formation of Transitional Facies Shales: A Case Study on Upper Permian Longtan and Dalong Shales in Middle Yangtze Region, China. J. Earth Sci. 31 (2), 368–384. doi:10.1007/s12583-019-1237-6
Xu, J., Gao, C., and Liu, G. (2020c). Micro Pore Structure Characteristics and Development Control Factors of continental Shale Reservoirs in Ordos Basin. Bull. Sci. Tech. 36 (02), 17–23. doi:10.13774/j.cnki.kjtb.2020.02.003
Xu, Jiale., Wu, Songtao., Yuan, Yujie., and Wang, J. (2021a). New Insights into Controlling Factors of Pore Evolution in Organic-Rich Shale. Energy & Fuels 35 (Issue 6), 4858–4873. doi:10.1021/acs.energyfuels.0c04189
Xu, S., Gou, Q., Hao, F., Zhang, B., Shu, Z., Lu, Y., et al. (2020b). Shale Pore Structure Characteristics of the High and Low Productivity wells, Jiaoshiba Shale Gas Field, Sichuan Basin, China: Dominated by Lithofacies or Preservation Condition. Mar. Pet. Geology. 114, 104211. doi:10.1016/j.marpetgeo.2019.104211
Xu, S., Hao, F., Shu, Z., Zhang, A., and Yang, F. (2020a). Pore Structures of Different Types of Shales and Shale Gas Exploration of the Ordovician Wufeng and Silurian Longmaxi Successions in the Eastern Sichuan Basin, South China. J. Asian Earth Sci. 193, 104271. doi:10.1016/j.jseaes.2020.104271
Xu, X. Y., Liu, W. B., Bai, J., Chen, S., and Li, Y. H. (2021b). Enrichment Characteristics and Resource Potential of Shale Oil in the First Member of Qingshankou Formation in Southern Songliao basin. Geology. Resour. 30 (3), 296–302. doi:10.13686/j.cnki.dzyzy.2021.03.01
Yang, J. G., Li, S. C., Yang, Y. L., Xiao, F., and Li, A. (2021). Strategic Survey Results of Shale Oil in the First Member of Qingshankou Formation, Upper Cretaceous in Northern Songliao basin. Geology. Resour. 30 (3), 232–237. doi:10.13686/j.cnki.dzyzy.2021.03.004
Zeng, W. Z., Song, Z. G., and Cao, X. (2018). Oil Potential of Qingshankou Formation Source Rocks in Northern Songliao Basin. Geochimica 47 (4), 345–351. doi:10.19700/j.0379-1726.2018.04.003
Zeng, W. Z., Zhou, G. Y., and Song, Z. G. (2019). Influence of Pore Structure on the Shale Oil Accumulation of the Qingshankou Formation in the Songliao Basin. Geochimica 48 (06), 632–643. doi:10.19700/j.0379-1726.2019.06.011
Zeng, W. Z. (2020). Pore Structure and Shale Oil Potential of Qingshankou Formation Shale in Songliao Basin, 6. Beijing, China: University of Chinese Academy of Sciences. doi:10.27544/d.cnki.gzcds.2020.000005
Zhang, J. K., He, S., Yan, X. L., Hou, Y. G., and Chen, X. J. (2017). Structural Characteristics and thermal Evolution of Nanoporosity in Shales. J. China Univ. Pet. (01), 11–24.
Zhao, J. H., Jin, Z. J., Jin, Z. K., Du, W., and Wen, X. (2016). Petrographic Methods to Distinguish Organic Matter Type in Shale. Pet. Geology& Exp. 38 (04), 514–520+527.
Zhao, W. Z., Hu, S. Y., and Hou, L. H. (2018). Connotation and Strategic Role of In-Situ Conversion Processing of Shale Oil Underground in the Onshore China. Pet. Exploration Dev. 45 (04), 563–572. doi:10.1016/s1876-3804(18)30063-6
Zhao, W. Z., Hu, S. Y., Hou, L. H., Yang, T., Li, X., Guo, B. C., et al. (2020). Types and Resource Potential of continental Shale Oil in China and its Boundary with Tight Oil. Pet. Exploration Dev. (01), 1–10. doi:10.1016/s1876-3804(20)60001-5
Zhen, D. C., and Wei, G. H. (2018). In Situ Scanning Electron Microscope (SEM) Observations of Damage and Crack Growth of Shale. Microsc. Microanalysis 242, 107–115. doi:10.1017/S1431927618000211
Zheng, Y. L., Chen, C. R., Wang, B. C., Wang, Z. G., and Liu, S. Y. (2015). Resource Potential Evaluation of Oil Shale in North Songliao basin. J. Jilin Univ. Earth Sci. Edition 45 (3), 683–690. doi:10.13278/j.cnki.jjuese.201503103
Zhu, R. K., Jin, X., Wang, X. Q., Liu, X. D., Li, J. M., Sun, L., et al. (2018). Multi-scale Digital Rock Evaluation on Complex Reservoir. Earth Sci. (05), 1773–1782.
Zhu, R. K., Wu, S. T., and Cui, J. W. (2016b). Classification and Evaluation of Pore Size in Oil & Gas Reservoir Rocks. Geol. Sci. Tech. Inf. 35 (03), 133–144.
Zhu, R. K., Wu, S. T., Su, L., Cui, J. G., and Zhang, X. X. (2016a). Problems and Future Works of Porous Texture Characterization of Tight Reservoirs in China. Acta Petrolei Sinica (11), 1323–1336.
Zou, C. N., Li, J. Z., Dong, D. Z., and Li, X. J. (2010). Abundant Nano Pores Have Been Found in Shale Gas Reservoirs for the First Time in China. Beijing, China: Petroleum Exploration and Development, 508–509.05.
Zou, C. N., Pan, S. Q., Jing, Z. H., Gao, J. L., Yang, Z., Wu, S. T., et al. (2020). Shale Oil and Gas Revolution and its Impact. Acta Petrolei Sinica (01), 1–12.
Keywords: shale oil, fine-grained deposition, unconventional oil and gas, nano pore-throat system, in-situ conversion
Citation: Jiang X, Wu S, Hou L, Zhang J, Guan M, Zhai F, Guo J, Su L, Liao F and Ding L (2021) Porosity Evolution In Lacustrine Organic-Matter-Rich Shales With High Claly Minerals Content. Front. Earth Sci. 9:766093. doi: 10.3389/feart.2021.766093
Received: 28 August 2021; Accepted: 21 September 2021;
Published: 24 November 2021.
Edited by:
Rui Liu, Southwest Petroleum University, ChinaReviewed by:
Haikuan Nie, SINOPEC Petroleum Exploration and Production Research Institute, ChinaZhiye Gao, China University of Petroleum, China
Copyright © 2021 Jiang, Wu, Hou, Zhang, Guan, Zhai, Guo, Su, Liao and Ding. This is an open-access article distributed under the terms of the Creative Commons Attribution License (CC BY). The use, distribution or reproduction in other forums is permitted, provided the original author(s) and the copyright owner(s) are credited and that the original publication in this journal is cited, in accordance with accepted academic practice. No use, distribution or reproduction is permitted which does not comply with these terms.
*Correspondence: Lianhua Hou, aG91bGhAcGV0cm9jaGluYS5jb20uY24=; Songtao Wu, d3VzdEBwZXRyb2NoaW5hLmNvbS5jbg==