A Corrigendum on
by Yadab P. Dhakal and Takashi Kunugi Front. Earth Sci. 9:699439. doi: 10.3389/feart.2021.699439
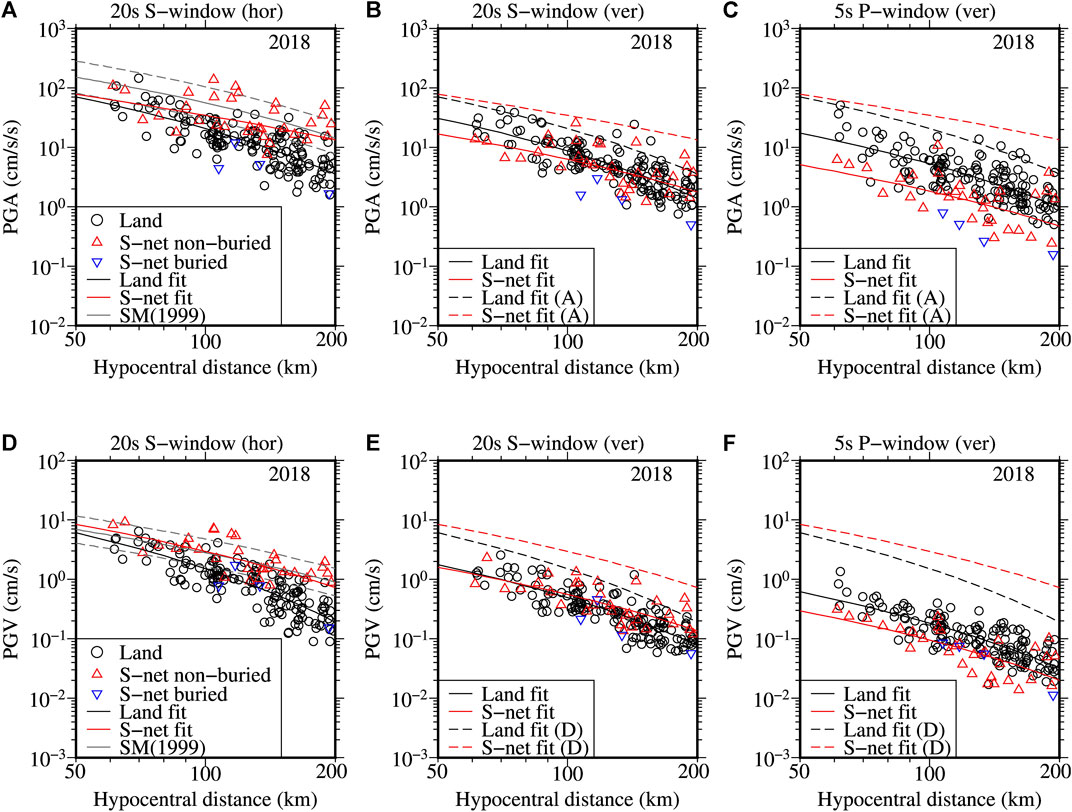
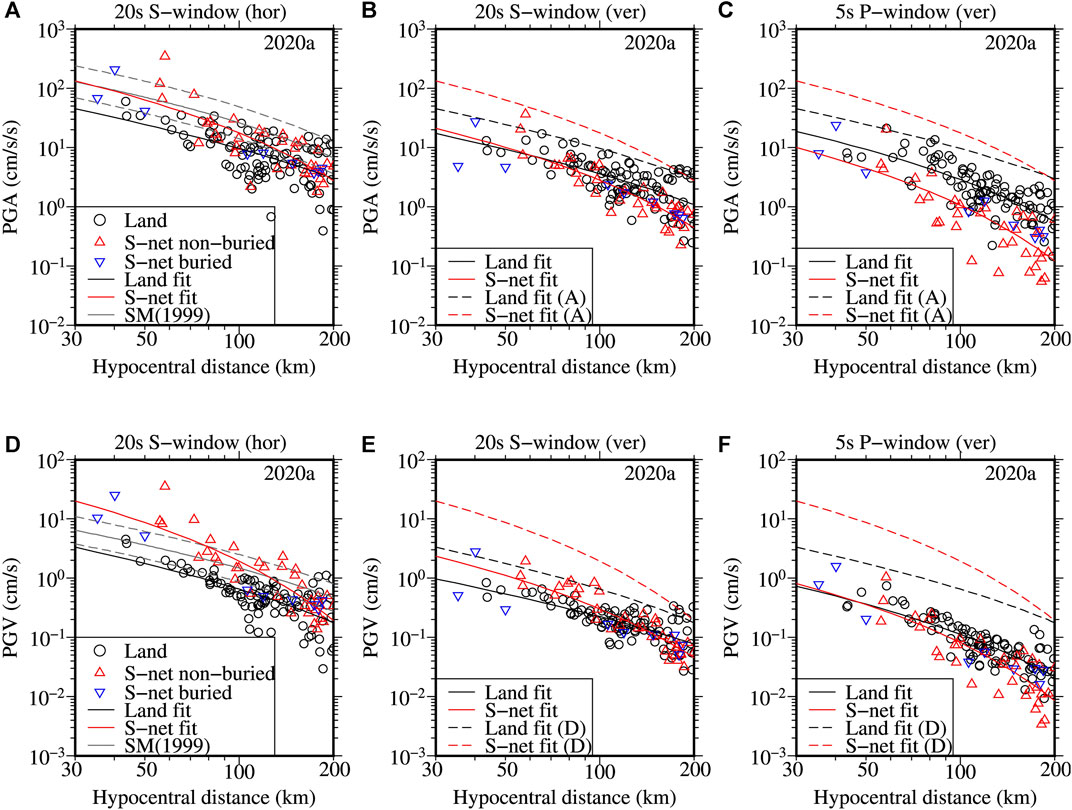
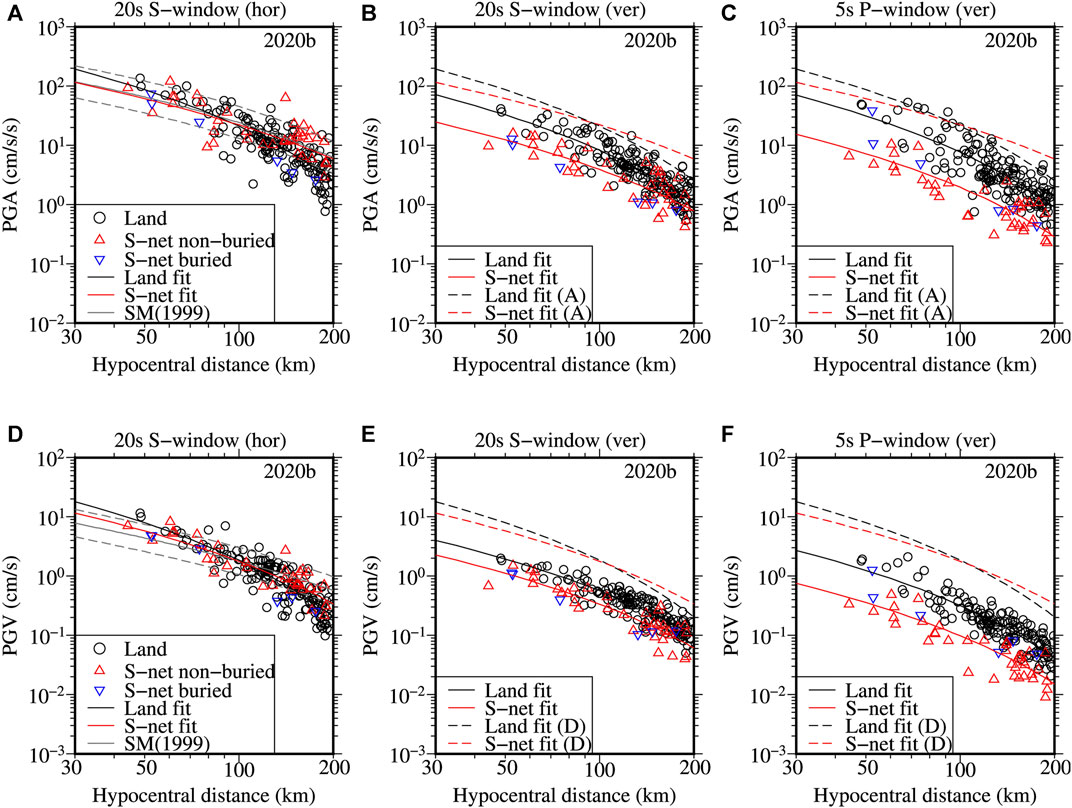
In the original article, there was a mistake in the legend for S-net buried and S-net non-buried stations in Figures 4, 5, and 6. The symbols for the S-net buried and S-net non-buried stations were mistaken for each other. The correct legend appears below.
The authors apologize for this error and state that this does not change the scientific conclusions of the article in any way. The original article has been updated.

FIGURE 4. Plots of PGAs (A, B, C) and PGVs (D, E, F) as a function of hypocentral distance for the 2018 event (see Table 1 for the event information). The left and middle panels show the peak values of the 20 s time windows starting from the S-onset for the horizontal (hor) and vertical (ver) components, respectively. The right panels show the peak values of the 5 s time windows starting from the P-onset for the vertical components. The plotted values for the horizontal components are the larger ones of the peak values of the two horizontal components. The circles denote the K-NET/KiK-net stations, simply written as Land in the legends, and the triangles S-net stations of which the inverse triangles (blue colored) denote the buried S-net stations. The black and red solid lines represent the fitted lines between the observed values and hypocentral distances for the K-NET/KiK-net and S-net stations in each panel. The solid and dashed grey lines denote the median prediction curves and range of one standard deviation for soil site condition in (A) and Vs30 = 300 m/s in (D) using the GMPEs in Si and Midorikawa (1999), written as SM (1999) in the legend, for an intraslab-type earthquake. The dashed black and red lines in (B, C) and (E, F) denote the fitted black and red solid lines in (A) and (C), respectively, for comparison.

FIGURE 5. Same as Figure 4, but for the 2020a interplate event (see Table 1 of the original article for the event information). The GMPEs for an interplate-type earthquake are used in the panels (A) and (D).

FIGURE 6. Same as Figure 4, but for the 2020b crustal event (see Table 1 of the original article for the event information). The GMPEs for a crustal-type earthquake are used in the panels (A) and (D).
Publisher’s Note
All claims expressed in this article are solely those of the authors and do not necessarily represent those of their affiliated organizations, or those of the publisher, the editors and the reviewers. Any product that may be evaluated in this article, or claim that may be made by its manufacturer, is not guaranteed or endorsed by the publisher.
Keywords: S-net, ocean-bottom seismograph network, Japan Trench, MeSO-net, Kanto Basin, earthquake early warning, peak ground acceleration, strong-motion duration
Citation: Dhakal YP and Kunugi T (2021) Corrigendum: An Evaluation of Strong-Motion Parameters at the S-Net Ocean-Bottom Seismograph Sites Near the Kanto Basin for Earthquake Early Warning. Front. Earth Sci. 9:765487. doi: 10.3389/feart.2021.765487
Received: 27 August 2021; Accepted: 31 August 2021;
Published: 27 September 2021.
Edited and reviewed by:
Francisco Javier Nuñez-Cornu, University of Guadalajara, MexicoCopyright © 2021 Dhakal and Kunugi. This is an open-access article distributed under the terms of the Creative Commons Attribution License (CC BY). The use, distribution or reproduction in other forums is permitted, provided the original author(s) and the copyright owner(s) are credited and that the original publication in this journal is cited, in accordance with accepted academic practice. No use, distribution or reproduction is permitted which does not comply with these terms.
*Correspondence: Yadab P. Dhakal, eWRoYWthbEBib3NhaS5nby5qcA==
 Yadab P. Dhakal
 Takashi Kunugi