- 1State Key Laboratory of Mining Disaster Prevention and Control, Shandong University of Science and Technology, Qingdao, China
- 2Intelligent Equipment College, Shandong University of Science and Technology, Taian, China
The application of sand powder three-dimensional (3D) printing technology in the field of rock mechanics and mining engineering has tremendous potential, but it is still in the preliminary exploration stage. This study investigated the effect of printing layer thickness on the physical and mechanical properties of rock-like specimens with sand powder 3D printing. Quartz sand powder was used as the printing material, and the specimens were prepared with three different layer thicknesses of 0.2, 0.3, and 0.4 mm. Uniaxial compression tests with a combination of digital image correlation (DIC), acoustic emission (AE) and 3D microscope observations were performed to analyze the mechanical properties and failure patterns of the specimens during loading. Experimental findings showed that increasing the layer thickness from 0.2 to 0.4 mm would result in a decrease in the weight, density, uniaxial compression strength, and elastic modulus of the specimens. The stress-strain curve, deformation and failure patterns, crack growth process, and AE characteristics of the specimens with a layer thickness of 0.2 mm are similar to the AE characteristics of rock-like material, whereas the specimens with layer thicknesses of 0.3 and 0.4 mm deform like a ductile material, which is not appropriate for simulation of coal or rock mass. In future studies, rock-like specimens should be prepared with a small layer thickness.
Introduction
In the field of rock mechanics and engineering, experimental research is a fundamental methodology that is capable of revealing the mechanical properties and behaviors and providing important guidance for parameter calibration in analytical and numerical studies. One of the most notable difficulties in rock mechanics and engineering is that rock differs from most other engineering materials in that it contains joints, which render its structure discontinuous. Obviously, the presence of joints or other kinds of discontinuities of different scales (faults, fractures, cracks, bedding planes, etc.) has a dominant effect on the mechanical behaviors and stability of rock masses and hereby has a fundamental influence on rock engineering design.
For underground coal mines, because of the sedimentary effect of coal seams and other strata, the rocks surrounding coal mines are relatively weak and fractured compared to other underground engineering projects (Zuo et al., 2019). Thus, the stability of coal mine openings (preparation entries, roadways, chambers, etc.) has always been a major concern of researchers and engineers.
Because of the weak nature of soft rocks (coal, mudstone, etc.), it is highly difficult to prepare natural rock or artificial specimens with fractures or joints. In addition, extreme limits exist with respect to the spatial properties (e.g., number, spacing, length, and geometry) of the joints, which is the bottleneck in current research.
The three-dimensional (3D) printing (3DP) technology, also known as additive manufacturing, is capable of producing a large number of specimens with identical structural and material properties, which makes it an inspiring method for rock mechanics by overcoming the aforementioned limitations of traditional artificial specimen preparation methods, such as casting. Multiple printing methods and materials can be applied according to the requirements, such as fused deposition modeling (FDM), stereolithography apparatuses (SLAs), selective laser sintering (SLS), and 3DP.
The application of 3DP in rock mechanics has attracted the attention of researchers since 2014 (Hasiuk, 2014). Jiang and Zhao (2015) conducted a preliminary study of 3DP on rock mechanics with FDM and polylactic acid (PLA). After experimental investigations on PLA specimens with different preset joints, the study concluded that 3DP is a strong tool to reveal the significant effect of joints; however, specimens printed by FDM and PLA are unsuitable for direct simulation of rock. Then, attempts were made to find suitable printing materials and technical parameters by various laboratory tests (Fereshtenejad and Song, 2016; Jiang et al., 2016; Gell et al., 2019). Zhou et al. (2017) and Zhu et al. (2018) conducted uniaxial compression tests on specimens produced by different printing methods and found that SLS specimens behave more brittlely than others, which makes them suitable for simulating hard rocks. Experimental studies on printed specimens with joints have also been conducted as a novel method for research on rock joint behavior (Jiang et al., 2016a; Jiang et al., 2016b; Tian et al., 2017; Feng et al., 2019; Liu et al., 2019).
According to previous studies, 3DP technology is a promising tool in the research of rock mechanics and has rapidly obtained worldwide attention. However, to date, its applications in rock mechanics and engineering have been seriously limited. Because of the large variety of natural rocks, the differences in the mechanical properties of rocks are significant. The uniaxial compression strength (UCS) of soft rocks in coal mines usually ranges from 5 to 25 MPa, whereas the UCS of hard rock in metal mining, such as granite, can reach over 200 MPa. Therefore, it would be quite difficult to create all sorts of rock-like specimens, which have significant differences in mechanical properties, with a single printing method and material.
Regarding 3DP techniques, attempts have been made to find the optimum printing method, material, and parameters for one specific type of rock by comparing their mechanical properties from laboratory tests. Lu et al. (2009) printed 3D network structures with alloy powder with different particle sizes and found that specimens with minimum particle sizes have high strength Vaezi et al. (2011) investigated the influence of printing layer thickness and binder saturation on the mechanical properties of specimens with plaster-based powder, and the results showed that the layer thickness and binder saturation were negatively and positively correlated with the specimen strength, respectively. The effect of other important printing parameters (printing orientation, drying time, etc.) has also been investigated by previous studies (Farzadi et al., 2015; Liu et al., 2019). However, no attempt has been made with sand powder–based printing techniques, which is a promising technique for rock-like specimens due to their similar silica-based composition in nature.
Therefore, this study aims to investigate the effect of printing layer thickness on the mechanical behavior of rock-like specimens with sand powder printing. Uniaxial compression tests were performed with monitoring measures of acoustic emission (AE) and digital image correlation (DIC) to study the mechanical properties and failure patterns during loading. The research that has been conducted can provide useful insights for the further application of 3DP in the field of rock mechanics and engineering.
Specimen Preparation and Methods
Overview of Three-Dimensional Printing Technique
To date, many types of general 3DP technologies, such as SLAs, FDM, SLS, and 3DP, have been developed on the basis of different formation methods. The selection of material choices ranges from a variety of photopolymers, metals, sand powder, and composites. In this work, the 3DP technique was chosen for the research, which employs binder jetting technology (BJT) and represents a simple and convenient method to process a wide variety of powder materials. The printing materials are divided into forming materials and bonding materials. Alloy powder, ceramic powder, gypsum powder, sand powder, etc., can be used as forming materials. In contrast, BJT has higher requirements for bonding materials, which can be quickly cemented with powder and have a strong ability to ensure the strength of the specimens, such as furan resin binder and phenolic resin binder. During fabrication, a liquid binder is sprayed from an inkjet printer head onto the powder layer precisely to bind the powder particles together to form a hardened solid material.
Specimen Preparation Procedures
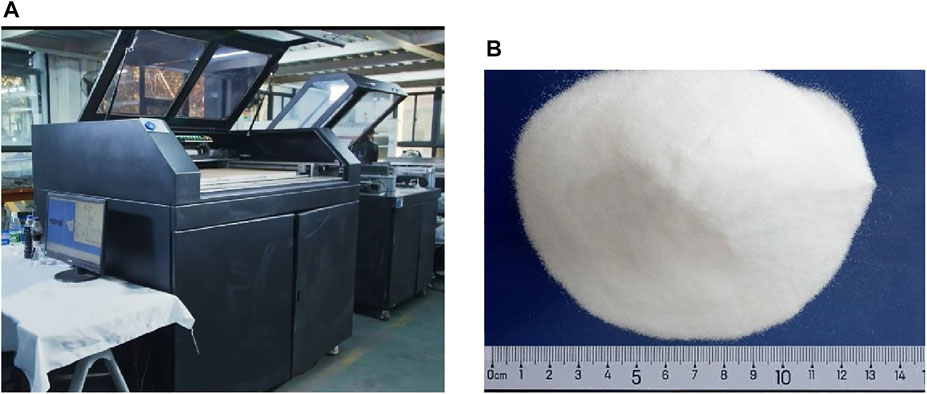
In this study, the specimens were printed using an Easy3DP-S500 printer by Wuhan Easymade Technology Co., Ltd. The dimensions of the build bed are 500 × 450 × 400 mm, and the resolution of the inkjet print heads is 360 DPI. The printing layer thickness ranged from 0.1 to 0.5 mm, and it had a surface finish of ±0.2 mm. High-quality quartz sand powder with a particle size between 0.075 and 0.12 mm was selected as the forming material, with the characteristics of high hardness, less ash, fewer impurities, and desiccation; the binder material was furan resin, which has the characteristics of rapid speed of solidification, good heat resistance, and high brittleness after solidifying. The main components of furan resin include furfuryl alcohol phenolic aldehyde. With the aforementioned printing parameters, there will be no notable interface or layers in the specimen because the sand powder is micronized. The printer is shown in Figure 1A, and the quartz sand powder is shown in Figure 1B.
To investigate the effects of the printing layer thickness on the mechanical properties, specimens with three different layer thicknesses of 0.2, 0.3, and 0.4 mm were set in the printing process. To facilitate the DIC test, the dimensions of the specimen were set to cubes of 50 × 50 × 100 mm. The general printing process of specimen preparation includes the following basic steps.
1) 3D model construction. The 3D digital model of the specimen is established by SolidWorks, stored as a high-precision STL format file, and then imported into the computer control system of the printer to set parameters such as the printing layer thickness, surface accuracy, and filling ratio. The digital model is sliced according to the thickness of the printing layer to obtain the two-dimensional profile information of each layer of the specimen.
2) Specimen printing. First, before the printing process, the quartz sand powder and hardener were mixed in proportion and allowed to dry naturally. The hardener serves later as a catalyst for the polymerization reaction of the binder. Then, the mixed sand powder and binder were placed in the powder feeding reservoir and the binder supplying reservoir, respectively. The specimens are printed on the printing bed, which is covered by sand powder up to a sufficient thickness before printing. This primary layer provides a smooth bed for the part to be built on (Fereshtenejad and Song, 2016). Then, a thin layer of sand powder is spread and smoothed using a roller over the printing bed, and the print head moves along the x- and y-axes and spreads the binder. The piston in the printing bed then descends to a certain level and gets ready for the subsequent layer. This cycle could be repeated several times to complete the transformation of the 3D model to the specimen. The specimen printing process is shown in Figure 2.
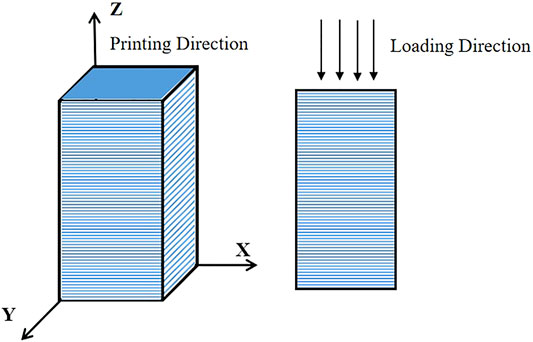
According to previous studies, different printing directions have a great influence on the mechanical properties of 3D printer specimens. Liu et al. (2019) found in the test that when the printing direction is perpendicular to the loading direction (the orientation of the layers is parallel to the loading direction), the fracture form of the specimen is a vertical split crack parallel to the bedding plane; when the printing direction is parallel to the loading direction (the orientation of the layers is perpendicular to the loading direction), the failure behavior of the specimen is similar to the failure behavior of rock materials in the uniaxial compression test. To ensure that the specimen can properly simulate the mechanical behavior of rock material, the z-axis direction is selected as the printing direction in this test. The printing direction is illustrated in Figure 3.
3) Postprocessing. After printing, the excess powder was removed from the specimen, and the specimens were placed in a shady and ventilated place for 3–4 days to allow the moisture to evaporate and to solidify naturally.
Testing Procedure
In this study, the strength of the specimens with different layer thicknesses was investigated by the uniaxial compression test using an RLJW-2000 model rock rheometer with a maximum loading capacity of 2,000 kN and a maximum displacement capacity of 8 mm. The loading mode was displacement control with a loading rate of 0.3 mm/min.
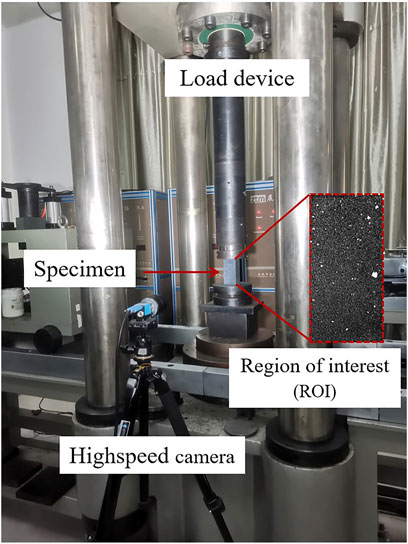
DIC refers to the class of noncontact methods that acquire images of an object, store images in digital form, and perform image analysis to extract full-field shape, deformation, and motion measurements and has been widely employed in experimental solid mechanics for strain and fracture analysis. DIC has the advantages of a simple experimental setup, low requirements in the measurement environment, a wide range of measurement sensitivities and resolutions, full-field, real-time, online, flexibility, etc. (Munoz et al., 2016; Song et al., 2013; Sharafisafa et al., 2019). DIC analysis of specimens with different layer thicknesses provided quantitative evidence on the nature of field strains developed in the specimen surface throughout the uniaxial compression test. In this work, it is important to discuss the method of preparing speckles on 3D printed specimens. Because of the obvious microporosity of 3D printed specimens, white paint spray on the specimen surface will penetrate into the specimen and make it difficult to form spots. Therefore, a layer of Vaseline should be painted on the specimen surface before spray painting. After Vaseline is dried to form a film, a layer of black paint should be sprayed on the specimen surface, and then, white paint will be sprayed randomly to form speckles. Figure 4 shows the experimental setup of DIC.
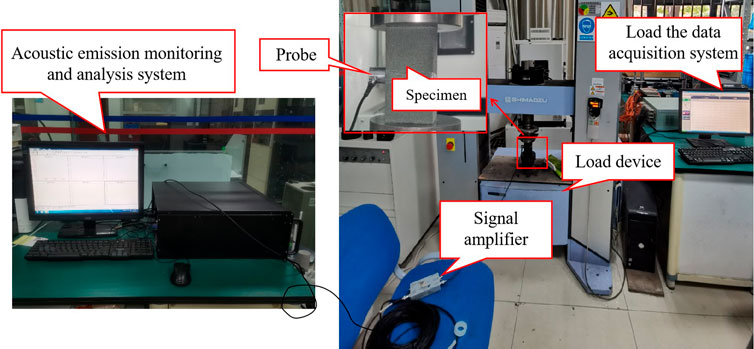
The AE of rock materials is a phenomenon where rock elastic strain energy is released in the deformation or failure process, and it is a kind of acoustic wave with different frequencies and energies generated by microfractures inside the rock during loading. AE events carry crucial information on the internal destruction of rock materials. On the basis of the AE information, changes in the internal behavior and the mechanism of rock failure are gradually deduced (Meng et al., 2018). Because of the simplicity of operation and low requirements for specimens, the AE technique has been widely used to study the failure process and fracture characteristics of rock materials (Cheng 2019; Miao et al., 2020). Figure 5 shows the AE test system. Vaseline is used as the coupling agent for the contact part of the specimen and the AE probe during the test to reduce signal attenuation. To avoid the influence of environmental noise during the test, the threshold value of the AE analysis system is set to 45 dB. It is important to preload for a period of time before formal loading to ensure that the specimen is fully attached to the loading surface and avoid noise generated during contact that may affect the results of AE monitoring.
Results
Physical Properties of Specimens With Different Layer Thicknesses
The appearance and color of specimens with different layer thicknesses are relatively consistent, whereas the surface accuracy of the specimens gradually decreases as the layer thickness increases, as shown in Figure 6A. To further observe the surface structure of the specimens, a 3D microscope was used to obtain the texture of the specimens. As shown in Figure 6B, the specimens with a layer thickness of 0.2 mm (T-0.2) have high surface smoothness, and the black binder is evenly distributed without obvious layer texture. On the surface of specimens with layer thicknesses of 0.3 mm (T-0.3), the proportion of black binder decreased. The surface accuracy of specimens with a layer thickness of 0.4 mm (T-0.4) is poor, and there are relatively obvious stratification characteristics and particle flaking phenomenon.

FIGURE 6. Apparent characteristics of specimens with different layer thicknesses (A) The appearance and color of specimens (B) Microscope images.
In this test, the physical properties, such as dimension, weight, and density, were very similar between specimens of the same layer thickness. Table 1 shows that the average weight and density of the specimens show a decreasing trend with increasing layer thickness as a result of the difference in the binder-to-sand ratio. In the process of specimen printing, the amount of binder sprayed at each surface is the same, whereas T-0.2 sprayed 500 times, T-0.3 sprayed 334 times, and T-0.4 sprayed 250 times, so the total ink jet is reducing with layer thickness increasing, resulting in the differences in physical properties.
Mechanical Behavior of Specimens With Different Layer Thicknesses
Basic Mechanical Properties
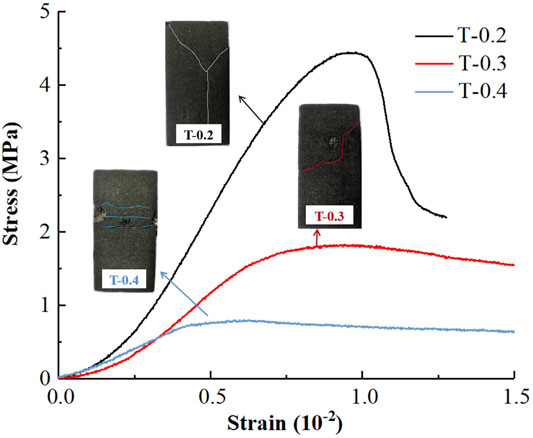
Figure 7 shows that the stress-strain curves of the specimens with the same layer thickness are very similar, and the difference in peak stress is within 1 MPa. However, the peak stress of specimens with different layer thicknesses has a large difference. As the thickness increases, the uniaxial compressive strength of the specimens shows a decreasing trend. From T-0.2 to T-0.4, the average peak strength of the specimen is 4.45 and 0.78 MPa, respectively.
As shown in Figure 8, the stress-strain curve closest to the average value of peak strength was selected for comparison.
The stress-strain curve of T-0.2 includes the microfracture compaction stage, the elastic deformation stage, the plastic deformation stage, and the fracture stage. The peak stress of the specimen is 4.45 MPa, and the peak strain (σc) is 0.95 × 10⁻². According to the suggestion of the International Society for Rock Mechanics, the linear elastic modulus at σ = 0.5σc can be used as the elastic modulus of nonlinear rock, which is 0.48. The postpeak behavior in the stress-strain curves shows a rapid drop, and the residual stress is 2.20 MPa with a strength attenuation of 50.56%. Macroscopic cracks propagated and coalesced rapidly during the fracture stage and finally formed a Y-shaped crack. The fracture mode of T-0.2 is tensile-shear destruction and takes on brittle failure characteristics, which are more similar to the failure patterns and mechanical properties of rock-like materials.
The peak stress of T-0.3 is 1.83 MPa, the peak strain is 0.94 × 10⁻², the residual stress is 1.49 MPa, accounting for 81.42% of the peak strength, and the strength is attenuated by only 18.58%. The experimental results revealed that T-0.3 exhibited elastic to plastic behavior in the uniaxial compression tests, in which the fracture mode was shear destruction, and had plastic failure characteristics.
The stress-strain curve of T-0.4 shows elastic-plastic-creep deformation. The beginning of the curve is a small straight segment, and then, the slope gradually decreases until it is approximately parallel to the abscissa. The curve is “flat”, and there is no obvious peak stress or strength attenuation. The specimen reaches its peak stress under a very small axial load, and the fractures are horizontally distributed.
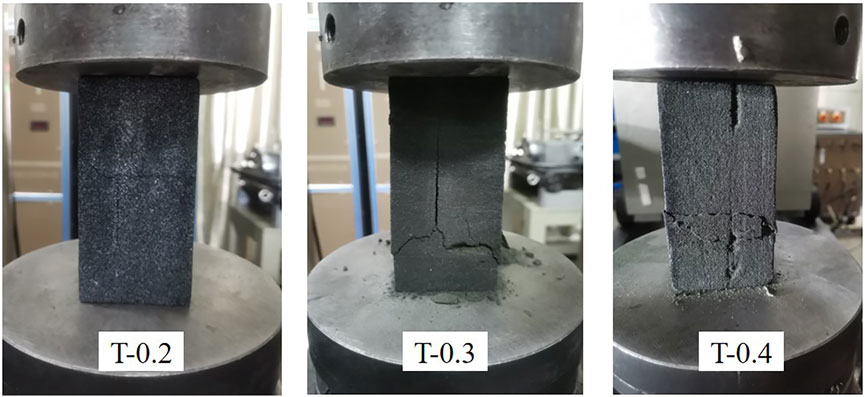
Through comparison, different layer thicknesses are found to have obvious effects on the strength and failure pattern of the specimen. As the layer thickness increases, the UCS of the specimen gradually decreases. Compared with T-0.2, the peak strength and elastic modulus of T-0.3 and T-0.4 are significantly weakened, the UCS decreases by 58.88% and 82.47%, respectively, and the elastic modulus decreases by 53.33% and 62.22%, respectively. Obvious postpeak ductile characteristics are presented, and the failure mode changes from brittle failure to plastic failure. As shown in Figure 9, the sand particles around the cracks of T-0.3 and T-0.4 continue to peel off during the loading process, and the fractured section is very loose. The specimen shows obvious characteristics of looseness, softness, and weakness, which are quite different from the characteristics of natural rocks.
Deformation Evolution and Failure Analysis by Digital Image Correlation
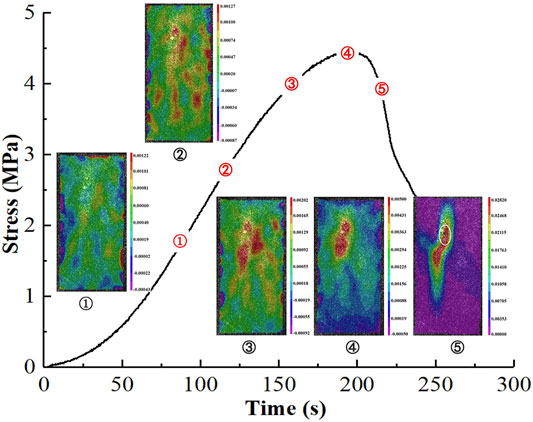
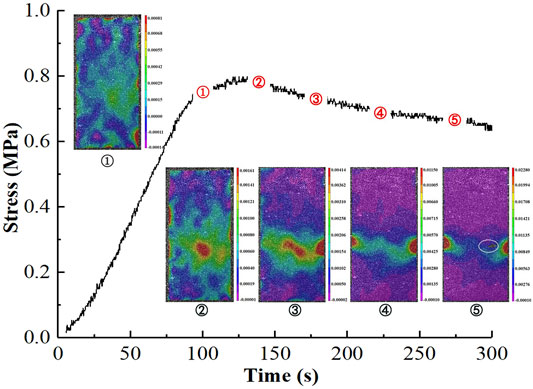
Figure 10 shows the crack propagation process of the specimen with a layer thickness of 0.2 mm under axial loading. As shown in Figure 10, ① is the apparent strain field at the specimen loaded up to 90 s. There is no obvious strain concentration in the initial stage of elastic deformation, and the damage spreads diffusely over the specimen due to the tiny unevenness of the specimen surface and the internal microporosity being compression. ②, ③, and ④ are the apparent strain fields at the specimen loaded up to 120, 160, and 195 s, respectively; it can be noted that some obvious strain concentration zones start to appear and gradually concentrating toward the middle of the specimen. An elliptical high strain concentration zone is formed in the middle and upper parts of the specimen at the peak stress. Then, the high strain concentration zone expands further along the loading direction and gradually forms a lightning-shaped vertical high strain concentration zone, and its value is significantly larger than the value of other regions. When loaded to 218 s (Figure 10⑤), a macrocrack was generated and rapidly expanded to the bottom of the specimen, finally showing tensile-shear destruction. The gray area with missing color in Figure 10⑤ is caused by the spalling of surface particles during crack extension.
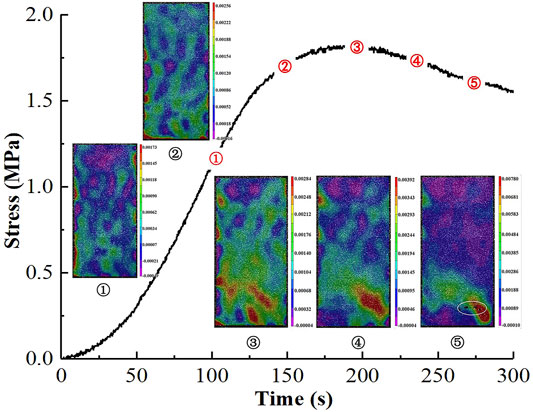
Figure 11 shows the crack propagation process of the specimen with a layer thickness of 0.3 mm under axial loading. As shown in the figure, ① and ② are the strain fields at 100 and 150 s, respectively, at which time there is no obvious strain concentration. As the loading continues until 200 s (Figure 11③), the randomly distributed strain zone gradually disappears before reaching a new stress equilibrium. With increasing stress, an obvious strain concentration zone appears at the bottom of the specimen and then gradually concentrates toward the lower right corner of the specimen, forming a high strain concentration zone to the lower right corner and forming a macroscopic crack, in which particles spall nearby (Figure 11⑤). The failure mode of the specimen is shear destruction.
Figure 12 shows the crack propagation process of the specimen with a layer thickness of 0.4 mm under axial loading. When loaded to 140 s (Figure 12②), the specimen entered the plastic deformation stage, and the strain concentration zone first appeared in the middle of the specimen. With increasing stress, the strain concentration zone expands to the sides of the specimen, eventually forming a transversely distributed strain concentration zone and forming two high strain zones on the left and right sides of the specimen, and the strain zone in the middle of the specimen disappears. Eventually, a transverse macrocrack forms perpendicular to the loading direction. As shown in Figure 12⑤, the specimen surface particles spalled off because the long-term local stress was concentrated on the right surface of the specimen.
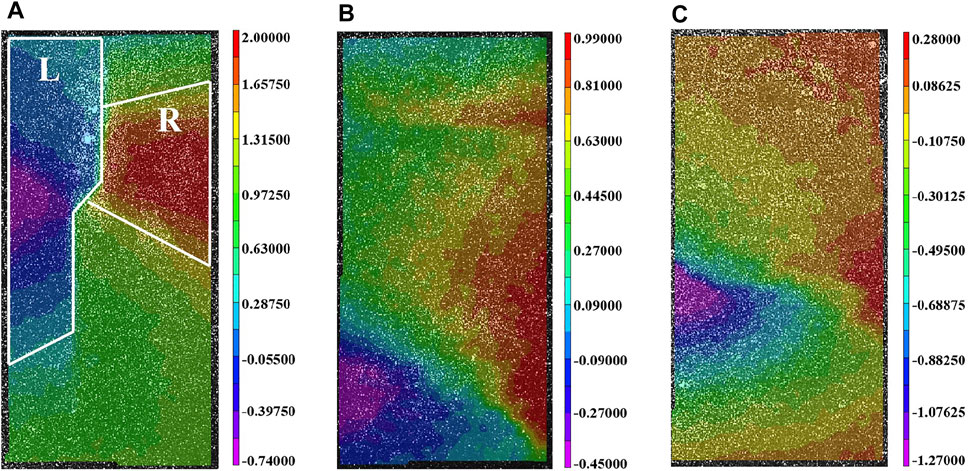
Compared with the strain field, the horizontal displacement field can reflect the crack type and formation cause more clearly. Figure 13 shows the horizontal displacement field of the three specimens. Taking T-0.2 as an example, the local regions of the left and right sides of the specimens (L area and R area) are strongly contrasting in color. According to the illustration, the L area of the specimen is opposite to the R area in the horizontal displacement direction, so the main cause of crack formation is tensile destruction.
Acoustic Emission Characteristics
AE ringing counts are the number of signal oscillations whose amplitude exceeds the threshold value. The AE energy is a quantitative characterization parameter of the signal strength. The ringing counts and energy reflect the total number of AE events and the intensity of the AE activity (Kong et al., 2016; Liu et al., 2021). Therefore, this paper chooses these two parameters for analysis. Figure 14 shows the evolution of the AE parameters (AE ringing counts, AE cumulative ringing counts, and AE energy) with the stress-time curves for specimens with different layer thicknesses.
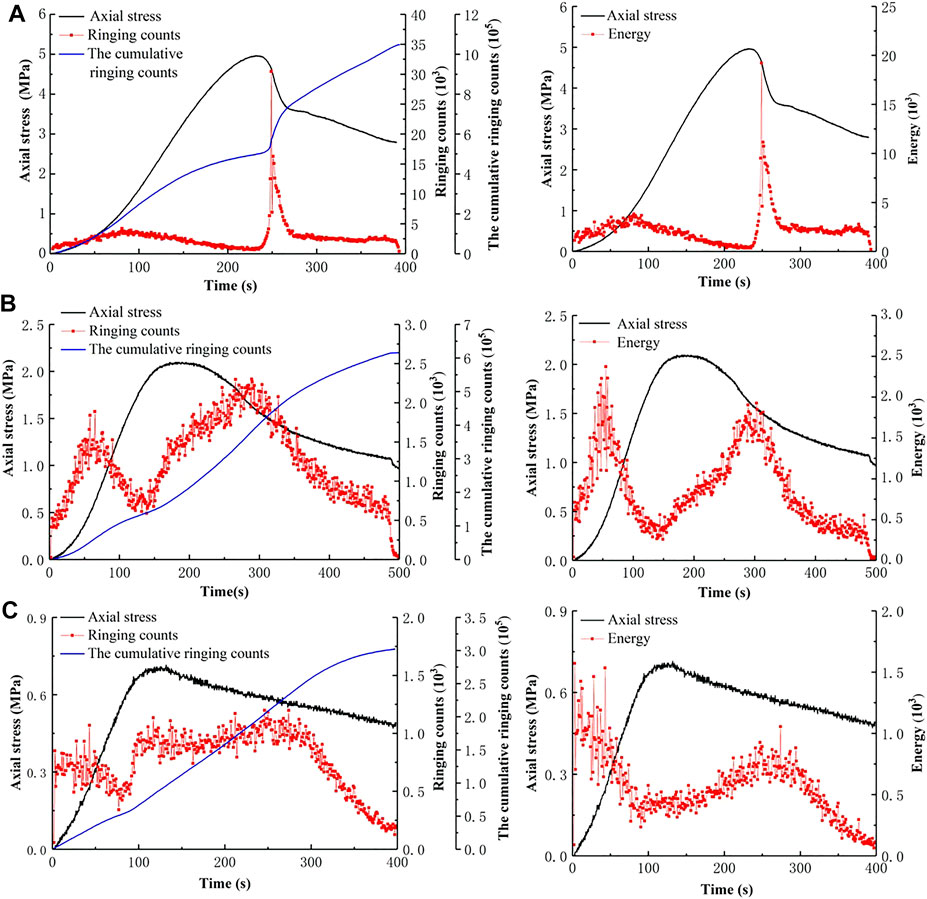
FIGURE 14. Evolution of the AE parameters with the stress-time curves for specimens with different layer thicknesses: (A) T-0.2, (B) T-0.3, and (C) T-0.4.
As shown in Figure 14A, the ringing count curve of T-0.2 is similar to the AE energy curve. During the microfracture compaction stage, the ringing counts and energy both increased slightly, and the highest values per unit time were 4.22 × 10³ and 3.83 × 10³, respectively. At this stage, the original microfractures and micropores of the specimen were closed, and displacement and friction of the fracture surface generated AE signals. Because the signals in the compaction stage are mostly the impact events of tiny units, the energy value is low. In the elastic stage, the ringing counts and AE energy begin to slowly decrease, and there is a “quiet period” before the peak stress. At the failure stage, the ringing counts and AE energy increased sharply. The highest ringing count per unit time was 3.04 × 10⁴, and the highest AE energy was 1.92 × 10⁴. At this stage, the high-level AE signal increased sharply, indicating that a large-scale fracture event occurred. The maximum AE signal strength has a certain hysteresis relative to the peak stress of the specimen, at 92% of the postpeak stress. Compared with the T-0.2 strain field diagram (Figure 10), the specimen does not immediately produce large-scale fracture when the peak stress is reached, and the final failure of the specimen lags behind the peak stress. There is still a small amount of AE activity in the postpeak stage, indicating that the cracks continue to develop until the load is stopped, and the final cumulative ringing counts of T-0.2 are 1.05 × 10⁶.
As shown in Figure 14B, there are two peaks in the AE ringing count curve of T-0.3. The first peak is in the transition stage from the compaction stage to the elastic stage, with the highest ringing counts and AE energy of 1.88 × 10³ and 2.37 × 10³, respectively, per unit time. The second peak is in the failure stage, with the highest ringing counts and AE energy of 2.30 × 10³ and 1.93 × 10³, respectively, per unit time. By comparison, the first peak AE energy is higher than the second, indicating that more microfractures are generated in the specimen during the elastic deformation stage. The expansion of the crack in the failure stage is the extension of the existing crack in the weak medium, so the AE signal generated by the cracks is relatively weak.
As shown in Figure 14C, during the entire loading process, the ringing counts and AE energy of T-0.4 were maintained at a very low value range. The highest value of the ringing counts per unit time is 1.20 × 10³, and the AE energy reaches the highest value of 1.57 × 10³ per unit time at 3 s. There is a big difference between the AE energy and the ringing counts curve of T-0.4: The postpeak ringing counts are higher than prepeak, whereas the AE energy is opposite, showing that the AE signal during the loading process is very weak, and the specimen is damaged under a small axial load.
Discussion
Among the parameters affecting the mechanical properties of specimens, the number of intergranular spaces, which are filled with the binder (degree of cementation), plays a significant role. When the layer thickness decreases, the sprayed binder penetrates better in the vertical and lateral directions over the surface, and as a result, there would be less unoccupied space between powder particles, so the specimen would have less porosity. With the increase of the printing layer thickness, the same amount of binder needs to bond 1.5 to 2 times of the sand particles, so the binder cannot be well penetrated to wrap the sand powder particles, resulting in a decrease in the viscosity between sand particles. As a consequence, the UCS and elastic modulus of the sample decrease, and a plastic flow tendency occurs.
Comparing the strain and displacement field of three specimens with different layer thicknesses, as the layer thickness increases, the deformation and failure pattern of the specimens are more different from the natural rock, and the final macroscopic crack angle formed in the specimens gradually decreases. For instance, the crack angle in Figure 13A is close to 90°, the crack angle in Figure 13B is close to 45°, and Figure 13C shows transverse cracks close to 0°. According to the preliminary analysis, the reason is that, as the thickness of the printed layer increases, the bond between each layer decreases, resulting in the formation of a weak structure with poor load bearing capacity between the layers, so that the ability to withstand shear stress is reduced, and damage occurs along the weak structure under a very small load, forming transverse cracks.
Through comparison, the AE characteristics of T-0.2 are very similar to the characteristics of brittle rock-like materials, which can simulate the mechanical behavior of natural rocks. With increasing layer thickness, the UCS of the specimen showed a decreasing tendency, and the ringing counts and AE energy also showed a decreasing tendency. Compared with T-0.2, the AE cumulative ringing counts of T-0.3 and T-0.4 were reduced by 41.11% and 71.15%, respectively, and the maximum AE energy per unit time was reduced by 87.65% and 91.82%, respectively. The active degree of the AE signal is positively correlated with the strength of the specimen, and the decrease in specimen strength significantly weakens the AE signal. The AE characteristics of T-0.3 and T-0.4 are quite different from the AE characteristics of rock-like materials and are not suitable for simulating natural rocks.
Conclusion
The printing layer thickness has an obvious effect on the physical and mechanical properties of the 3D printed specimen. T-0.2 has high surface smoothness, and the black binder is evenly distributed without obvious layer texture. With increasing layer thickness, the surface accuracy decreases and presents obvious stratification characteristics, and the weight, density, and UCS also decrease. Compared with T-0.2, the peak strength and elastic modulus of T-0.3 and T-0.4 were significantly weakened. With increasing layer thickness, the angle of macroscopic cracks formed in the specimens gradually decreased, the postpeak ductility was enhanced, and the failure mode changed from brittle failure to plastic failure. The AE characteristics of T-0.2 during the loading process are very similar to the AE characteristics of brittle rock-like materials, which can simulate the mechanical behavior of natural rock. By increasing the layer thickness, the ringing counts and AE energy showed a decreasing trend. The AE characteristics of T-0.3 and T-0.4 are quite different from the AE characteristics of rock materials.
The physical and mechanical properties of the specimens with a layer thickness of 0.2 mm are similar to the physical and mechanical properties of rock-like materials, whereas the specimens with layer thicknesses of 0.3 and 0.4 mm deform like ductile materials, which is not appropriate for the simulation of coal or rock masses. In future studies, rock-like specimens should be prepared with a small layer thickness. Furthermore, there are many parameters worth studying about BJT, such as sand powder type, sand particle size, binder saturation level, and hardener saturation level. We optimistically believe that research on BJT will promote the development of petrophysical experiments as well as rock mechanics and engineering.
Data Availability Statement
The original contributions presented in the study are included in the article/supplementary material, further inquiries can be directed to the corresponding author.
Author Contributions
All authors listed have made a substantial, direct, and intellectual contribution to the work and approved it for publication.
Funding
This study was financially supported by the National Natural Science Foundation of China (52074166, 51774195), the China Postdoctoral Science Foundation (2020T130385) and the Climbing Project of Taishan Scholar in Shandong Province(tspd20210313).
Conflict of Interest
The authors declare that the research was conducted in the absence of any commercial or financial relationships that could be construed as a potential conflict of interest.
Publisher’s Note
All claims expressed in this article are solely those of the authors and do not necessarily represent those of their affiliated organizations or those of the publisher, the editors, and the reviewers. Any product that may be evaluated in this article, or claim that may be made by its manufacturer, is not guaranteed or endorsed by the publisher.
References
Cheng, X. (2019). Damage and Failure Characteristics of Rock Similar Materials with Pre-existing Cracks. Int. J. Coal Sci. Technol. 6, 505–517. doi:10.1007/s40789-019-0263-4
Farzadi, A., Waran, V., Solati-Hashjin, M., Rahman, Z. A. A., Asadi, M., and Osman, N. A. A. (2015). Effect of Layer Printing Delay on Mechanical Properties and Dimensional Accuracy of 3D Printed Porous Prototypes in Bone Tissue Engineering. Ceramics Int. 41 (7), 8320–8330. doi:10.1016/j.ceramint.2015.03.004
Feng, X.-T., Gong, Y.-H., Zhou, Y.-Y., Li, Z.-W., and Liu, X.-F. (2019). The 3D-Printing Technology of Geological Models Using Rock-like Materials. Rock Mech. Rock Eng. 52, 2261–2277. doi:10.1007/s00603-018-1703-y
Fereshtenejad, S., and Song, J.-J. (2016). Fundamental Study on Applicability of Powder-Based 3D Printer for Physical Modeling in Rock Mechanics. Rock Mech. Rock Eng. 49 (6), 2065–2074. doi:10.1007/s00603-015-0904-x
Gell, E. M., Walley, S. M., and Braithwaite, C. H. (2019). Review of the Validity of the Use of Artificial Specimens for Characterizing the Mechanical Properties of Rocks. Rock Mech. Rock Eng. 52 (9), 2949–2961. doi:10.1007/s00603-019-01787-8
Hasiuk, F. (2014). Making Things Geological: 3-D Printing in the Geosciences. GSA Today.24, 28-29 doi:10.1130/gsatg211gw.1
Jiang, C., and Zhao, G.-F. (2015). A Preliminary Study of 3D Printing on Rock Mechanics. Rock Mech. Rock Eng. 48 (3), 1041–1050. doi:10.1007/s00603-014-0612-y
Jiang, Q., Feng, X., Song, L., Gong, Y., Zheng, H., and Cui, J. (2016a). Modeling Rock Specimens through 3D Printing: Tentative Experiments and Prospects. Acta Mech. Sin. 32 (001), 101–111. doi:10.1007/s10409-015-0524-4
Jiang, Q., Feng, X., Gong, Y., Song, L., Ran, S., and Cui, J. (2016b). Reverse Modelling of Natural Rock Joints Using 3D Scanning and 3D Printing. Comput. Geotechnics 73 (Mar.), 210–220. doi:10.1016/j.compgeo.2015.11.020
Kong, B., Wang, E., Li, Z., Wang, X., Liu, J., and Li, N. (2016). Fracture Mechanical Behavior of Sandstone Subjected to High-Temperature Treatment and its Acoustic Emission Characteristics under Uniaxial Compression Conditions. Rock Mech. Rock Eng. 49 (12), 1–8. doi:10.1007/s00603-016-1011-3
Liu, B., Zhao, Y., Zhang, C., Zhou, J, Li, Y, and Sun, Z (2021). Characteristic Strength and Acoustic Emission Properties of Weakly Cemented sandstone at Different Depths under Uniaxial Compression. Int. J. Coal Sci. Technol. doi:10.1007/s40789-021-00462-0
Liu, P., Ju, Y., Ranjith, P. G., Zheng, Z., Wang, L., and Wanniarachchi, A. (2016). Visual Representation and Characterization of Three-Dimensional Hydrofracturing Cracks within Heterogeneous Rock through 3D Printing and Transparent Models. Int. J. Coal Sci. Technol. 3, 284–294. doi:10.1007/s40789-016-0145-y
Liu, Q. S., He, P., Deng, P. H., and Tian, Y (2019). Application of 3D Printing Technology to Physical Modeling in Rock Mechanics. Rock Soil Mech. 40 (9), 3397–3404. (in Chinese). doi:10.16285/j.rsm.2018.0991
Lu, K., Hiser, M., and Wu, W. (2009). Effect of Particle Size on Three Dimensional Printed Mesh Structures. Powder Technology 192 (2), 178–183. doi:10.1016/j.powtec.2008.12.011
Meng, Q., Zhang, M., Han, L., and Hai, P. (2018). Acoustic Emission Characteristics of Red Sandstone Specimens under Uniaxial Cyclic Loading and Unloading Compression. Rock Mech. Rock Eng. 51 (4), 969–988. doi:10.1007/s00603-017-1389-6
Miao, S., Pan, P. Z., Zhao, X., Shao, V., and Yu, P. (2020). Experimental Study on Damage and Fracture Characteristics of Beishan Granite Subjected to High-Temperature Treatment with DIC and AE Techniques. Rock Mech. Rock Eng. 2020 (1–3), 1–23. doi:10.1007/s00603-020-02271-4
Sharafisafa, M., Shen, L., Zheng, Y., and Xiaoc, J (2019). The Effect of Flaw Filling Material on the Compressive Behaviour of 3D Printed Rock-like Discs. Int. J. Rock Mech. Mining Sci. 117, 105–117. doi:10.1016/j.ijrmms.2019.03.031
Song, H., Zhang, H., and Fu, D. (2013). Experimental Study on Damage Evolution of Rock under Uniform and Concentrated Loading Conditions Using Digital Image Correlation. Fatigue Fracture Eng. Mater. Structures 36(8):760–768. doi:10.1111/ffe.12043
Tian, W., and Han, N. (2017). Mechanical Properties of Rock Specimens Containing Pre-existing Flaws with 3D Printed Materials. Strain 53 (6), e12240. doi:10.1111/str.12240
Vaezi, M., and Chua, C. K. (2011). Effects of Layer Thickness and Binder Saturation Level Parameters on 3D Printing Process. Int. J. Adv. Manuf Technol. 53 (1-4), 275–284. doi:10.1007/s00170-010-2821-1
Zhou, T., and Zhu, J. B. (2017). Identification of a Suitable 3D Printing Material for Mimicking Brittle and Hard Rocks and its Brittleness Enhancements. Rock Mech. Rock Eng. 51, 765–777. doi:10.1007/s00603-017-1335-7
Zhu, J. B., Zhou, T., Liao, Z. Y., Sun, L., Li, X. B., and Chen, R. (2018). Replication of Internal Defects and Investigation of Mechanical and Fracture Behaviour of Rock Using 3D Printing and 3D Numerical Methods in Combination with X-ray Computerized Tomography. Int. J. Rock Mech. Mining Sci. 106, 198–212. doi:10.1016/j.ijrmms.2018.04.022
Keywords: sand powder 3D printing, rock-like material, uniaxial compression test, physical and mechanical properties, digital image correlation, acoustic emission
Citation: Xu Q, Jiang L, Ma C, Niu Q and Wang X (2021) Effect of Layer Thickness on the Physical and Mechanical Properties of Sand Powder 3D Printing Specimens. Front. Earth Sci. 9:763202. doi: 10.3389/feart.2021.763202
Received: 01 September 2021; Accepted: 01 November 2021;
Published: 19 November 2021.
Edited by:
Chaojun Jia, Central South University, ChinaReviewed by:
Santanu Misra, Indian Institute of Technology Kanpur, IndiaQingxiang Meng, Hohai University, China
Copyright © 2021 Xu, Jiang, Ma, Niu and Wang. This is an open-access article distributed under the terms of the Creative Commons Attribution License (CC BY). The use, distribution or reproduction in other forums is permitted, provided the original author(s) and the copyright owner(s) are credited and that the original publication in this journal is cited, in accordance with accepted academic practice. No use, distribution or reproduction is permitted which does not comply with these terms.
*Correspondence: Lishuai Jiang, bHNqaWFuZ0BzZHVzdC5lZHUuY24=; Changqing Ma, bWNxMDkxMDE2QDEyNi5jb20=
 Qing Xu1
 Lishuai Jiang
 Changqing Ma