 Xiaodan Guan
 Kaiwei Zhu
 Xiaoqian Huang2
 Yongli He
- 1Collaborative Innovation Center for Western Ecological Safety, Lanzhou University, Lanzhou, China
- 2College of Atmospheric Sciences, Lanzhou University, Lanzhou, China
The semi-arid regions of East Asia are located in the transition area between regions dominated by the monsoon system and by westerly winds; their interaction is the key to understand precipitation changes, especially in the summer. Our results show that the enhancement of both the monsoon and westerly winds occurs in wet years, leading to stronger convergence and more rainfall. Weakening of both the monsoon and westerly winds occurs in dry years and results in less rainfall. Such interaction between the monsoon and westerlies is not constant; the boundary of their effects is changing all the time. As the monsoon strengthens, it shifts to the west in wet years and covers most of the semi-arid regions, and the negative effect of the El Niño-Southern Oscillation (ENSO) system on precipitation in the semi-arid regions becomes obvious. However, westward expansion has not been evident over the past 70 years in historic data. In the future, the monsoon will obviously expand westward, and the precipitation over the Loess Plateau will gradually increase as the monsoon boundary expand westward until the end of the 21st century. This change indicates that more rainfall will occur in the semi-arid regions of East Asia, which could dramatically change the ecological environment, especially over the Loess Plateau.
Introduction
The semi-arid area is broadly defined as the ratio of annual precipitation (P) to potential evapotranspiration (PET), in terms of the aridity index (AI), between one fifth and one half (Middleton and Thomas, 1997; Feng and Fu, 2013; Huang et al., 2016b; Zhu et al., 2021). In 2000, it covered ∼15% of the earth’s land surface and supported 14.4% of the global population (Safriel and Adeel 2005), and the area will continue to expand in the future (Huang et al., 2016b). The typical semi-arid region in East Asia (30–60°N, 80–140°E) is the largest semi-arid region in the middle latitudes of the Northern Hemisphere (Guan et al., 2015; Huang et al., 2016a), and the most representative underlying surface of this semi-arid region is the Loess Plateau of China (Chen et al., 2016). This area is thought to be largely constrained by water availability, and it has the characteristics of a dry climate, scarce vegetation, and poor soil and water conservation ability and is sensitive to precipitation (Sala and Lauenroth, 1982; Austin et al., 2004; Li et al., 2009; Yang et al., 2020). Because of the presence of loess, landslide disasters occur easily under heavy precipitation, whereas environmental degradation occurs under a lack of precipitation (Huang et al., 2016b). Because of this loess characteristic in China, the government has adopted a series of policies to prevent land desertification and soil erosion (Zhang and Liu, 2005) to recover the ecological environment and reduce the occurrence of disasters. Such artificial regulation can improve the regional climate to a large extent, but measures should be taken according to local conditions and climate change. According to current studies, Northwest China is getting wet, which seems beneficial for ecological system development (Zhang et al., 2021). However, disasters caused by more precipitation are increasing and are contributing to large economic losses and threats to life security.
The semi-arid region of East Asia is located in the transition zone between the monsoon region and the westerly region (Wang et al., 2017). It is under the joint influence of the westerly wind and the East Asian summer monsoon (EASM; Xing and Wang, 2017; Yan et al., 2021). The westerly wind can bring water vapour from upstream sources, such as the Atlantic Ocean, Mediterranean Sea, and Arabian Sea. (Huang et al., 2015), while the EASM delivers water vapour from the Indian Ocean and the Pacific Ocean to the semi-arid region (Ding and Chan, 2005; Zhang and Zhou, 2015). Both systems can greatly influence precipitation over the semi-arid regions of East Asia (Sun and Ding, 2010; Chen et al., 2019). The semi-arid region over East Asia has a northeast-southwest orientation, and it is parallel to and close to the northwesternmost edge of the EASM. The edge of the EASM can be properly represented by the 2 mm day−1 (300 mm a−1) precipitation isoline, which has a clearer physical significance from the perspective of climate, ecology and geography than other definitions. (Wang et al., 2012; Chen et al., 2018). Therefore, the precipitation of semi-arid region over East Asia is sensitive to the domain of the EASM (Chen et al., 2018). Hence, studying the impact of the EASM on precipitation in the semi-arid region over East Asia is of great significance for predicting precipitation in the semi-arid region and for making decisions regarding ecological protection and economic development in countries in semi-arid regions.
This paper explores the mechanism of precipitation changes in the semi-arid region of East Asia in response to changes in the EASM and the changes in the future. The data and methods are introduced in the second section. The detailed effects on precipitation changes from EASM and westerly winds, even the role of the El Niño-Southern Oscillation (ENSO) in the process, are illustrated in the third section. The fourth section presents the discussion and conclusions.
Datasets and Methods
In this study, the gauge-based gridded precipitation dataset from the Global Precipitation Climatology Centre (GPCC) was used to analyze the precipitation variation in the semi-arid regions of East Asia, which has a spatial resolution of 0.5° by 0.5° and covers the period from 1891 to 2019 (https://opendata.dwd.de/climate_environment/GPCC/html/fulldata-monthly_v2020_doi_download.html). Compared with other precipitation datasets, GPCC’s new global precipitation climatology V.2020 is more suitable for estimating precipitation in the semi-arid regions of East Asia owing to its much denser station network (Schneider et al., 2014).
The HadISST 1.1 monthly average SST dataset is from the Met Office Hadley Centre (https://www.metoffice.gov.uk/hadobs/hadisst/data/download.html), which has a spatial resolution of 1° by 1° and ranges from 1870 to present (Rayner et al., 2003). The AI (aridity index) dataset used in this study is the same as that used in Huang et al. (2020), which has a spatial resolution of 0.5° by 0.5° and covers the period from 1948 to 2016.
We use the monthly geopotential height and wind at the 850 hPa pressure level to explain the mechanism of precipitation change in the semi-arid regions of East Asia. These variables are obtained from the 20th Century Reanalysis V3 dataset, which has a spatial resolution of 1° by 1° over the period of 1836–2015 (https://psl.noaa.gov/data/gridded/data.20thC_ReanV3.html).
The self-calibrating Palmer Drought Severity Index (PDSI) is available from the Climate Explorer (http://climexp.knmi.nl/select.cgi?id=someone@somewhere&field=scpdsi), which has a spatial resolution of 0.5° by 0.5° and covers the period from 1901 to 2017. The gross primary production (GPP) is provided by National Tibetan Plateau Data Center (http://data.tpdc.ac.cn), which has a spatial resolution of 0.05° by 0.05° and covers the period from 1982 to 2018 (Wang et al., 2021).
To assess the performances of the edge of the monsoon in the future, we used outputs from 18 Coupled Model Intercomparison Project Phase 6 (CMIP6) models. The CMIP6 experiments include simulations of the 21st-century climate under new greenhouse gas (GHG) emission scenarios (referred to as shared socioeconomic pathways (SSPs); Riahi et al., 2017). The SSPs are based on five narratives describing alternative socioeconomic developments, including sustainable development, regional rivalry, inequality, fossil fuel development, and middle-of-the-road development (Riahi et al., 2017).
Result
Precipitation Change in the Semi-arid Regions Over East Asia and the Relevant Mechanism
Figure 1 shows the spatial distributions of precipitation in the semi-arid regions in East Asia. The semi-arid regions of China and Kazakhstan have an annual mean precipitation between 300 and 500 mm, and Mongolia has an annual mean precipitation in the range of 100–300 mm. These semi-arid areas are all less affected by monsoons, have limited water vapour input, and thus generally receive little precipitation, with few spatial differences (Huang et al., 2012). The time series of annual precipitation and summer precipitation are shown in Figure 2. The summer mean precipitation accounts for 63% of the annual precipitation, and the correlation coefficient between them is as high as 0.874 (p < 0.01). Therefore, the annual precipitation over semi-arid regions of East Asia is primarily determined by summer precipitation on both amplitude and variability.
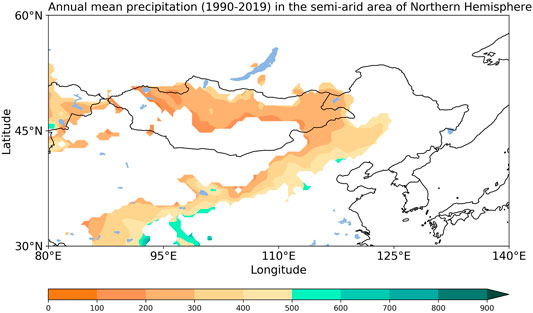
FIGURE 1. Annual mean precipitation in the semi-arid area of East Asia during 1990–2019 (units: mm).
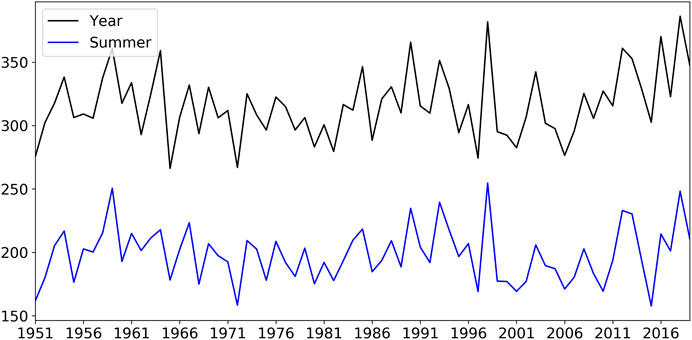
FIGURE 2. Time series of weighted-average annual (black curve) and summer (blue curve) precipitation in the semi-arid area of East Asia during 1951–2019 (units: mm).
As summer precipitation dominates the variability in annual precipitation in the semi-arid regions of East Asia, understanding the summer precipitation variation is a positive step toward predicting the precipitation in these regions. To preliminarily investigate the factors affecting summer precipitation over semi-arid regions in East Asia, we calculated the correlation coefficient between summer precipitation and sea surface temperature (SST). The SST in the tropical east-central Pacific, western Indian Ocean, and northwestern Pacific has negative correlation patterns, and the Barents Sea and East China Sea have positive patterns that passed the significance test at 90% (Figure 3). These oceanic activities can influence precipitation in semi-arid regions in East Asia through atmospheric circulation. This shows that the SST factors are mainly related to the monsoon route and the sea basin where ENSO occurs, so the monsoon and ENSO may have a great impact on the precipitation over semi-arid regions in East Asia.
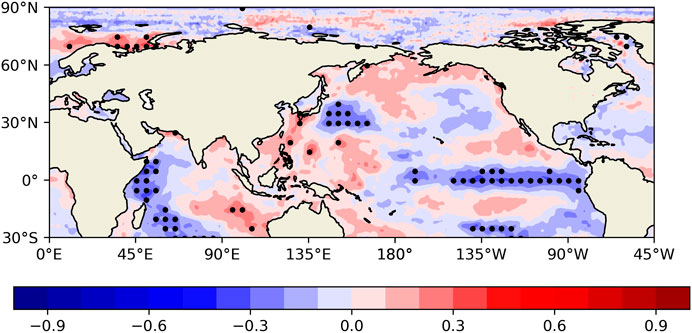
FIGURE 3. Correlation coefficient between SST and precipitation in semi-arid regions in East Asia. Stippling denotes the region with statistical significance at the 90% confidence level based on Student’s t-test.
To further explore the ocean effect on the precipitation changes in the semi-arid areas of East Asia, we selected wet and dry years to compare the different monsoon and ENSO behaviours. Periods with precipitation greater than one standard deviation are defined as wet years, and periods with precipitation less than one standard deviation are defined as dry years (Figure 4). The wet years in the past 70 years are 1959, 1967, 1990, 1993, 1998, 2012, 2013, and the dry years are 1951, 1955, 1968, 1972, 1980, 1997, 2001, 2006, 2010, 2015. From the composited 850 hPa geopotential height field for positive (wet) years and negative (dry) years (Figure 5), we found that there is a negative anomaly center over the East Asia continent during wet years, which spatially corresponds to the Mongolian low (Figure 5A). The anomaly center and mean field center basically coincide and pass the significance test at 90%. The negative geopotential height anomaly center, on the one hand, can greatly enhance the Mongolian low, which enhances upstream westerly wind transport; on the other hand, it can enhance the summer pressure difference between land and sea, enhancing monsoon transport (Figure 6A). As a result, the strengthening of the monsoon causes the edge of the monsoon to shift westward, and the monsoon region covers most of the semi-arid regions in East Asia (Figure 6A). Wet and warm monsoon southwesterlies, meeting cold air from the northwest over the semi-arid regions, generate strong convergence anomalies, which enhance the updraft and favour more precipitation (Figure 6A).
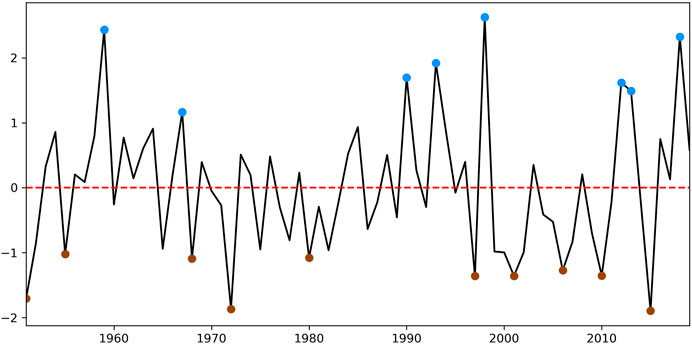
FIGURE 4. Time series of summer precipitation anomalies (normalized) in the semi-arid regions of East Asia. The blue dots represent wet years, and the brown dots represent dry years.
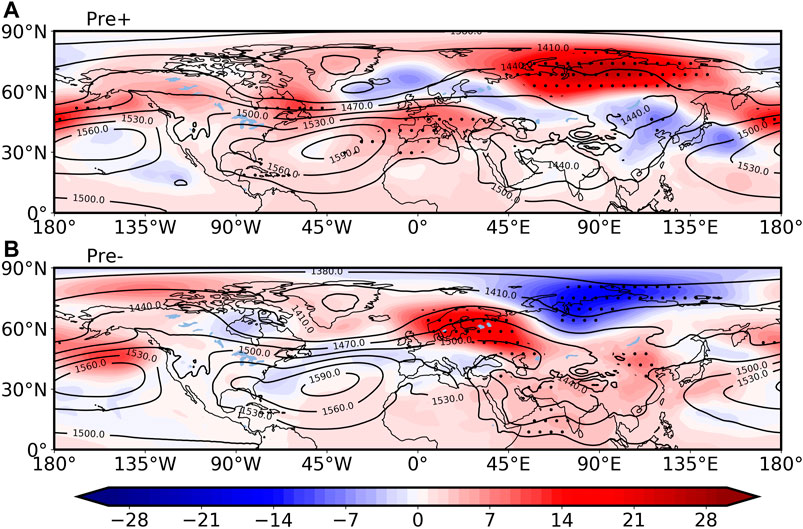
FIGURE 5. 850 hPa summer geopotential height field anomalies (shaded) and 850 hPa summer mean geopotential height field (contours) composite for wet (A) and dry (B) years in the semi-arid regions of East Asia (units: gpm). Stippling denotes the region with statistical significance at the 90% confidence level based on Student’s t-test.
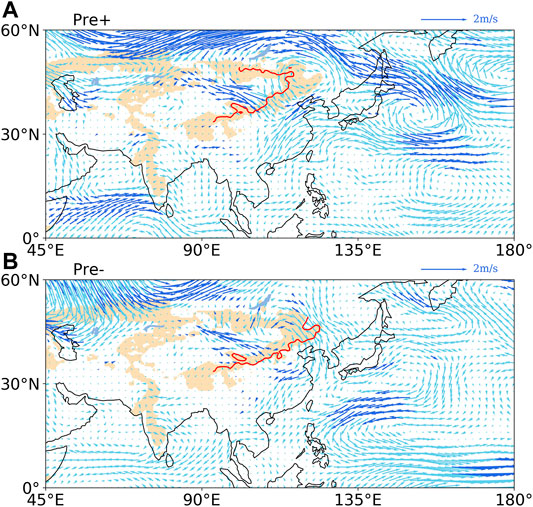
FIGURE 6. 850 hPa summer wind composite for wet (A) and dry (B) years in the semi-arid regions of East Asia (units: m/s). The brown areas represent semi-arid areas of East Asia. The red curve represents the edge of the East Asian monsoon. The dark blue arrow denotes the region with statistical significance at the 90% confidence level based on Student’s t-test.
During dry years, a positive geopotential height anomaly center is located at the Mongolian low, and a negative geopotential height anomaly center is located northwest of the Mongolian low (Figure 5B). This geopotential height anomaly distribution weakens the Mongolian low and causes southeast wind anomalies from the semi-arid regions of East Asia (Figure 6B), which is in the opposite direction to the westerlies, thereby weakening them. The positive geopotential height anomalies over the East Asian continent and the negative geopotential height anomalies over the surrounding sea weaken the summer pressure difference between land and sea (Figure 5B). Thus, the monsoon anomalies move in the opposite direction, greatly weakening the monsoon (Figure 6B). The weakening of the monsoon occurs as the edge of the monsoon moves back, right on the eastern edge of the semi-arid regions (Figure 6B). The monsoon does not reach the semi-arid regions, and the westerly winds are weakened, which results in a decrease in precipitation in the semi-arid regions.
To further explore the effect of ENSO and the monsoon on precipitation, we calculated the correlation coefficients among precipitation, the Niño 3.4 index, the monsoon index and the westerly index to reveal their relationships (Figure 7). The monsoon index is defined as the U850 in (5°–15°N, 90°–130°E) minus U850 in (22.5°–32.5°N, 110°–140°E) (Wang and Fan, 1999) to measure the strength of the EASM, it can capture the three-dimensional circulation and total variance of the precipitation over East Asia (Wang et al., 2008; Huang et al., 2018). The westerly index proposed by Li et al. (2008) (the difference of the geopotential height at 500 hPa between 35°N and 50°N over 70°–110°E) is a good indicator of the westerly strength over East Asian middle latitude. Figure 7A shows that the monsoon index has an obvious negative effect (r = −0.86) on the precipitation in the wet years and passed 99% of the significance test when the monsoon edge crossed the semi-arid region of East Asia. However, the correlation coefficient decreases to −0.21 and is not significant when we do not distinguish between dry years and wet years (Figure 7A). This means that only when the edge of the monsoon crosses the semi-arid regions can the monsoon affect the precipitation of the semi-arid regions. The effect of ENSO on precipitation can also be inferred through the same calculation. The direct relationship between Niño 3.4 and precipitation is not significant, but Niño 3.4 has an obvious positive effect (r = 0.30) on the monsoon index, which has the ability to change precipitation over semi-arid regions. Therefore, ENSO has a negative effect on the precipitation of the semi-arid region of East Asia when the edge of the monsoon crosses the semi-arid regions of East Asia. Figure 7D shows that the westerly index is positively correlated with the precipitation in semi-arid regions over East Asia and passed 95% of the significance test, which means westerly wind favors the increased precipitation in this region.
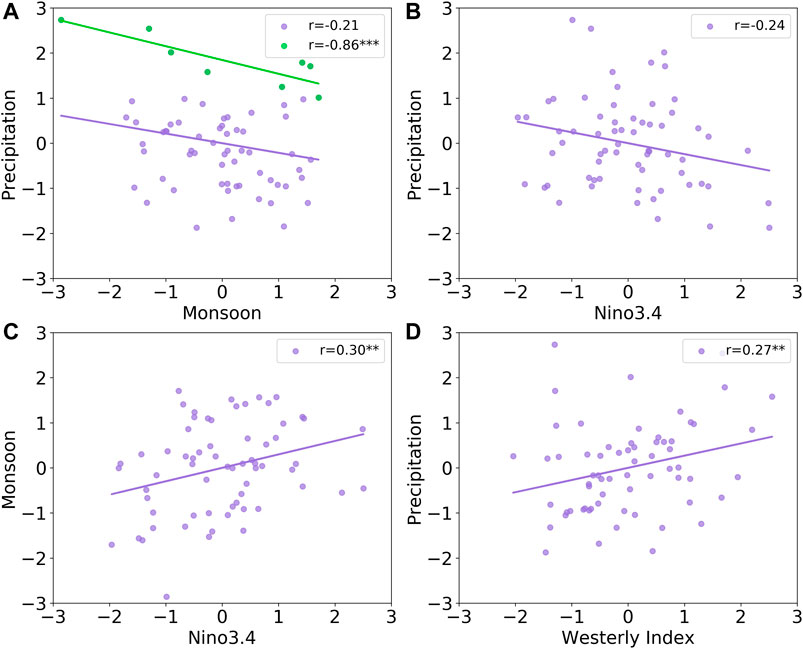
FIGURE 7. Correlation coefficients between precipitation and the monsoon index (A), precipitation and Niño 3.4 (B), and Niño 3.4 and the monsoon index (C). The green dots in (A) represent the years when the monsoon edge crossed the semi-arid regions. Two asterisks denote statistical significance at the 95% confidence level based on Student’s t-test. Three asterisks denote statistical significance at the 99% confidence level based on Student’s t-test.
Effects of Monsoon Edge Changes on Semi-arid Regions Over East Asia in the Future
The historic decadal change in the monsoon edge shows that the decadal monsoon edge over the past 70 years exhibits obvious oscillations near the middle area of semi-arid regions. Although there was obvious deviation in the 2000s, the decadal change in the edge has not led to a robust western or eastern trend (Figure 8). However, in future scenarios (Figure 9), the monsoon edges in ACCESS-CM2, CESM2-WACCM, CMCC-CM2-SR5, CMCC-ESM2, FIO-ESM-2–0, INM-CM4-8, INM-CM5-0, MIROC6, and TaiESM1 exhibit obvious westward expansion, and most of them cover the entire semi-arid region. The monsoon edges in AWI-CM-1-1-MR, EC-Earth3-Veg, EC-Earth3-Veg-LR, GFDL-ESM4, MPI-ESM1-2-HR, MPI-ESM1-2-LR, and MRI-ESM2-0 expand westward, except for the middle part of the monsoon edges. The monsoon edges in CanESM5 and IPSL-CM6A-LR also expand westward, but the monsoon edges near the Tibetan Plateau expand in the opposite direction. Accordingly, the edge of the monsoon in half of the models exhibits obvious westward expansion, and all the models show that the edge has a general tendency to extend westward with increasing emissions of GHGs; the more GHGs are emitted, the greater the westward spread of the monsoon edge. Due to the increase in the control area of the East Asia summer monsoon in the future, its influence on the semi-arid regions of East Asia will also be enhanced, which will lead to an increase in precipitation in the semi-arid regions.
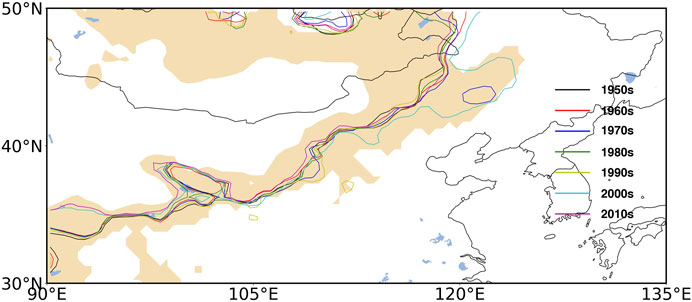
FIGURE 8. The decadal monsoon edge in the past 70 years. The brown areas represent semi-arid areas.
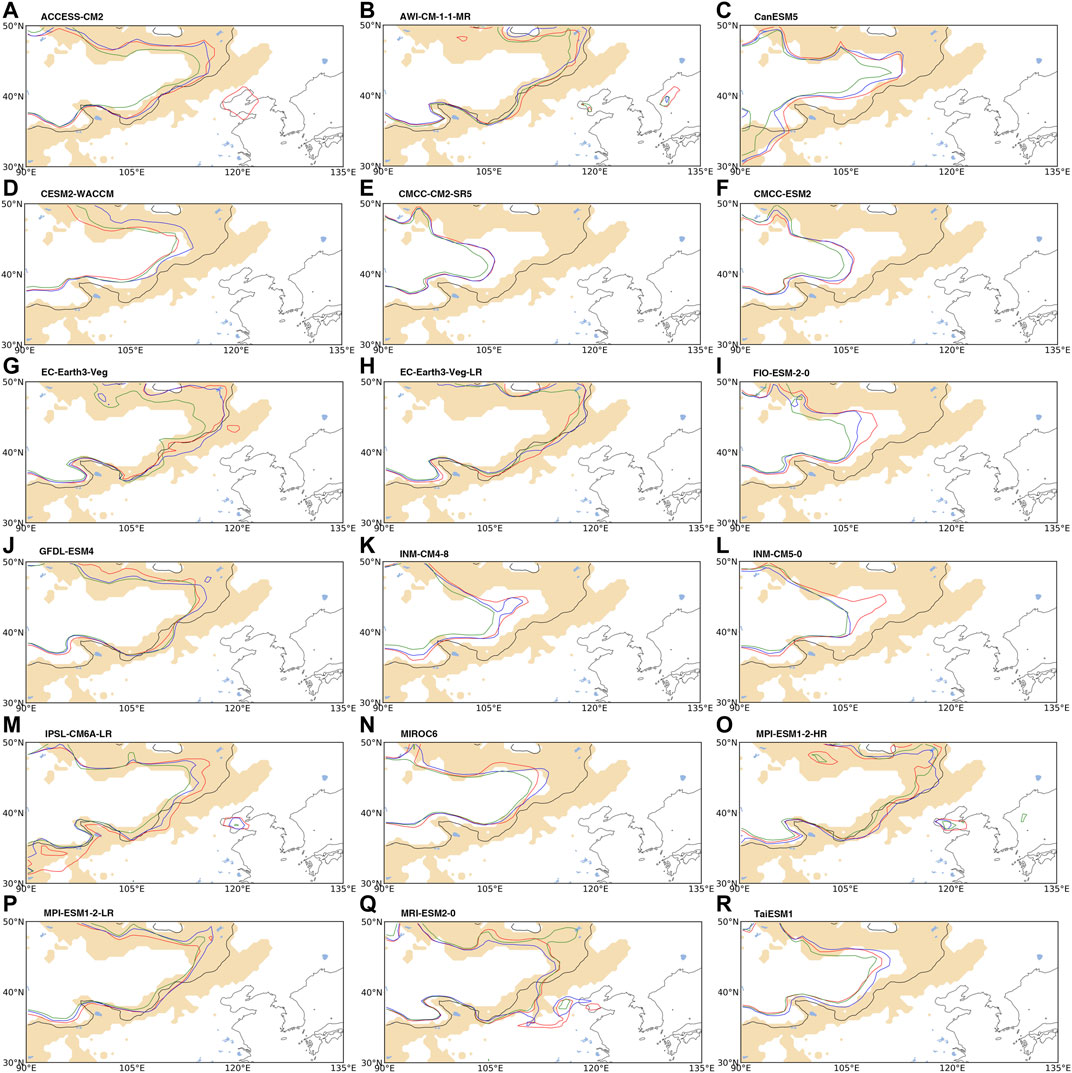
FIGURE 9. The decadal monsoon edge simulated by the models in the future. The brown areas represent semi-arid areas. The black curve represents the mean monsoon edge for 2011–2019. The red, blue, and green curves represent the mean monsoon edges for 2091–2100 under SSP126, SSP245, and SSP585, respectively.
As precipitation changes in semi-arid regions, both aridity and ecology exhibit sensitive responses. The Palmer drought severity index (PDSI) distribution increases in wet years and decreases in dry years, especially in the northern part of the semi-arid regions. This shows that semi-arid regions will become wetter (drier) when precipitation increases (decreases), and the northern part of the semi-arid region is more sensitive to precipitation variation. Meanwhile, precipitation can obviously affect ecological conditions (Figure 10). The gross primary production (GPP) in wet years shows a consistent variation with precipitation, especially in the eastern drylands. The most obvious increase in GPP occurs in the northeastern part of the semi-arid region, which is sensitive to monsoon changes (Figure 11A). This result indicates that vegetation growth is closely associated with precipitation in this region (Figures 10, 11). According to the monsoon edges in the different scenarios in the future, the westward expansion of the monsoon edge will turn the semi-arid regions of East Asia wet and green. The area that turns wet and green will be even larger under the high-emission scenario. In addition, more areas in the semi-arid regions of East Asia will be influenced by ENSO via the monsoon.

FIGURE 10. PDSI composite for wet (A) and dry (B) years in the semi-arid regions of East Asia. Stippling denotes the region with statistical significance at the 90% confidence level based on Student’s t-test.
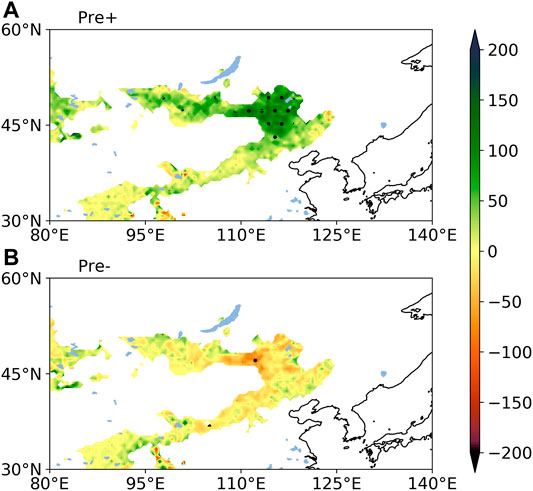
FIGURE 11. GPP composite for wet (A) and dry (B) years in the semi-arid regions of East Asia (units: g C m−2). Stippling denotes the region with statistical significance at the 90% confidence level based on Student’s t-test.
Conclusions and Discussion
In this study, we investigate the key role of the monsoon on precipitation in the semi-arid regions of East Asia under global warming. The characteristics of annual precipitation in the semi-arid regions can be basically reflected by summer precipitation because in terms of amount, the summer mean precipitation accounts for 63% of the annual precipitation, and in terms of variation, the correlation coefficient between them is as high as 0.874. Therefore, exploring the causes of summer precipitation variation is the key to understanding precipitation in the semi-arid regions of East Asia. During wet years, there is a negative pressure anomaly center at 850 hPa in the Mongolian low, which strengthens the Mongolian low and leads to the strengthening of the westerly wind. Simultaneously, the anomalous low pressure, combined with the anomalous high pressure at sea, enhances the sea-land pressure difference in summer and strengthens the summer monsoon. The coincidence of an enhanced monsoon and enhanced westerly winds over the semi-arid regions results in increased precipitation. The coincidence of a weak monsoon and weak westerly winds results in low precipitation in dry years. In addition, we found that ENSO has a negative effect on precipitation in semi-arid regions when the monsoon is strong enough to expand into the inner semi-arid regions of East Asia.
The decadal monsoon edge in the past 70 years has an obvious oscillation near the middle area of semi-arid regions, which has not obviously led to a robust western or eastern trend. However, in the future, the monsoon edge has a tendency to extend westward with the increased emission of GHGs. Westward spread of the monsoon edge will take place in the high-emissions scenario. Such westward extension of the edge of the monsoon will result in more precipitation. Meanwhile, as the frequency of El Niño increases and the intensity of El Niño-induced atmospheric anomalies under greenhouse warming increases (Cai et al., 2015; Hu et al., 2021), the climate in the semi-arid regions of East Asia may be greatly changed by ENSO. In addition, monsoon expansion will turn the semi-arid regions of East Asia wet and green. As a typical underlying surface of the semi-arid region of East Asia, the Loess Plateau will undergo great ecological changes in the future, and more investigation is needed.
Data Availability Statement
We thank all the institutions providing data for this research. The precipitation dataset is from GPCC (https://opendata.dwd.de/climate_environment/GPCC/html/fulldata-monthly_v2020_doi_download.html). The AI dataset used in this study is provided by Huang et al. (2020) (https://www.sciencedirect.com/science/articlepii/S1470160X20305884). The 20th Century Reanalysis V3 data are provided by the NOAA/OAR/ESRL PSD, Boulder, Colorado, United States, from their website at https://psl.noaa.gov/data/gridded/data.20thC_ReanV3.html, the HadISST 1.1 monthly average SST dataset is from the Met Office Hadley Centre (https://www.metoffice.gov.uk/hadobs/hadisst/data/download.html), the self-calibrating PalmerDrought Severity Index is available from the Climate Explorer (http://climexp.knmi.nl/select.cgi?id=someone@somewhere&field=scpdsi), the gross primary production is provided by National Tibetan Plateau Data Center (http://data.tpdc.ac.cn/), and the phase 6 of the Coupled Model Intercomparison Project (CMIP6) for simulated sea level pressure and snow depth data (https://esgf-node.llnl.gov/search/cmip6/).
Author Contributions
XG contributed to conception and design of the study. KZ organized the database. KZ, XH, and XZ performed the statistical analysis. XG and KZ wrote the first draft of the manuscript. XH, XZ, and YH wrote sections of the manuscript. All authors contributed to manuscript revision, read, and approved the submitted version.
Funding
This work is supported by National Natural Science Foundation of China (42041004, 41722502), the “Innovation Star” Project for Outstanding Postgraduates of Gansu Province (2021CXZX-103, 2021CXZX-102), the Strategic Priority Research Program of Chinese Academy of Sciences (Grant No. XDA2006010301), and the Fundamental Research Funds for the Central Universities (lzujbky-2019-kb30).
Conflict of Interest
The authors declare that the research was conducted in the absence of any commercial or financial relationships that could be construed as a potential conflict of interest.
Publisher’s Note
All claims expressed in this article are solely those of the authors and do not necessarily represent those of their affiliated organizations, or those of the publisher, the editors and the reviewers. Any product that may be evaluated in this article, or claim that may be made by its manufacturer, is not guaranteed or endorsed by the publisher.
Acknowledgments
We thank all the institutions providing data for this research. The precipitation dataset is from GPCC. The AI dataset used in this study is provided by Huang et al. (2020). The 20th Century Reanalysis V3 data are provided by the NOAA/OAR/ESRL PSD, Boulder, Colorado, United States, from their website at https://psl.noaa.gov/data/gridded/data.20thC_ReanV3.html. Thanks to the help of the two reviewers and the editor.
References
Austin, A. T., Yahdjian, L., Stark, J. M., Belnap, J., Porporato, A., Norton, U., et al. (2004). Water Pulses and Biogeochemical Cycles in Arid and Semiarid Ecosystems. Oecologia 141 (2), 221–235. doi:10.1007/s00442-004-1519-1
Cai, W., Santoso, A., Wang, G., Yeh, S.-W., An, S.-I., Cobb, K. M., et al. (2015). ENSO and Greenhouse Warming. Nat. Clim Change 5 (9), 849–859. doi:10.1038/nclimate2743
Chen, F., Chen, J., Huang, W., Chen, S., Huang, X., Jin, L., et al. (2019). Westerlies Asia and Monsoonal Asia: Spatiotemporal Differences in Climate Change and Possible Mechanisms on Decadal to Sub-orbital Timescales. Earth-Science Rev. 192, 337–354. doi:10.1016/j.earscirev.2019.03.005
Chen, F., Yuan, Y., Zhang, T., and Linderholm, H. W. (2016). Annual Precipitation Variation for the Southern Edge of the Gobi Desert (China) Inferred from Tree Rings: Linkages to Climatic Warming of Twentieth century. Nat. Hazards 81 (2), 939–955. doi:10.1007/s11069-015-2113-z
Chen, J., Huang, W., Jin, L., Chen, J., Chen, S., and Chen, F. (2018). A Climatological Northern Boundary index for the East Asian Summer Monsoon and its Interannual Variability. Sci. China Earth Sci. 61 (1), 13–22. doi:10.1007/s11430-017-9122-x
Feng, S., and Fu, Q. (2013). Expansion of Global Drylands under a Warming Climate. Atmos. Chem. Phys. 13 (19), 10081–10094. doi:10.5194/acp-13-10081-2013
Guan, X., Huang, J., Guo, R., and Lin, P. (2015). The Role of Dynamically Induced Variability in the Recent Warming Trend Slowdown over the Northern Hemisphere. Sci. Rep. 5 (1), 1–10. doi:10.1038/srep12669
Hu, K., Huang, G., Huang, P., Kosaka, Y., and Xie, S.-P. (2021). Intensification of El Niño-Induced Atmospheric Anomalies under Greenhouse Warming. Nat. Geosci. 14 (6), 377–382. doi:10.1038/s41561-021-00730-3
Huang, B., Cubasch, U., and Li, Y. (2018). East Asian Summer Monsoon Representation in Re-analysis Datasets. Atmosphere 9 (6), 235. doi:10.3390/atmos9060235
Huang, J., Guan, X., and Ji, F. (2012). Enhanced Cold-Season Warming in Semi-arid Regions. Atmos. Chem. Phys. 12 (12), 5391–5398. doi:10.5194/acp-12-5391-2012
Huang, J., Ji, M., Xie, Y., Wang, S., He, Y., and Ran, J. (2016a). Global Semi-arid Climate Change over Last 60 Years. Clim. Dyn. 46 (3-4), 1131–1150. doi:10.1007/s00382-015-2636-8
Huang, J., Yu, H., Guan, X., Wang, G., and Guo, R. (2016b). Accelerated Dryland Expansion under Climate Change. Nat. Clim Change 6 (2), 166–171. doi:10.1038/nclimate2837
Huang, J., Yu, H., Han, D., Zhang, G., Wei, Y., Huang, J., et al. (2020). Declines in Global Ecological Security under Climate Change. Ecol. Indicators 117, 106651. doi:10.1016/j.ecolind.2020.106651
Huang, W., Feng, S., Chen, J., and Chen, F. (2015). Physical Mechanisms of Summer Precipitation Variations in the Tarim Basin in Northwestern China. J. Clim. 28 (9), 3579–3591. doi:10.1175/JCLI-D-14-00395.1
Li, W. L., Wang, K. L., Fu, S. M., and Jiang, H. (2008). The Interrelationship between Regional westerly index and the Water Vapor Budget in Northwest China (In Chinese). J. Glaciol. Geocryol. 30 (1), 28–34.
Li, Z., Liu, W.-z., Zhang, X.-c., and Zheng, F.-l. (2009). Impacts of Land Use Change and Climate Variability on Hydrology in an Agricultural Catchment on the Loess Plateau of China. J. Hydrol. 377 (1-2), 35–42. doi:10.1016/j.jhydrol.2009.08.007
Rayner, N. A., Parker, D. E., Horton, E. B., Folland, C. K., Alexander, L. V., Rowell, D. P., et al. (2003). Global Analyses of Sea Surface Temperature, Sea Ice, and Night marine Air Temperature since the Late Nineteenth century. J. Geophys. Res. 108 (D14). doi:10.1029/2002JD002670
Riahi, K., Van Vuuren, D. P., Kriegler, E., Edmonds, J., O’Neill, B. C., Fujimori, S., et al. (2017). The Shared Socioeconomic Pathways and Their Energy, Land Use, and Greenhouse Gas Emissions Implications: An Overview. Glob. Environ. Change 42, 153–168. doi:10.1016/j.gloenvcha.2016.05.009
Sala, O. E., and Lauenroth, W. K. (1982). Small Rainfall Events: An Ecological Role in Semiarid Regions. Oecologia 53, 301–304. doi:10.1007/BF00389004
Schneider, U., Becker, A., Finger, P., Meyer-Christoffer, A., Ziese, M., and Rudolf, B. (2014). GPCC's New Land Surface Precipitation Climatology Based on Quality-Controlled In Situ Data and its Role in Quantifying the Global Water Cycle. Theor. Appl. Climatol. 115 (1), 15–40. doi:10.1007/s00704-013-0860-x
Sun, Y., and Ding, Y. (2010). A Projection of Future Changes in Summer Precipitation and Monsoon in East Asia. Sci. China Earth Sci. 53 (2), 284–300. doi:10.1007/s11430-009-0123-y
Wang, B., and Fan, Z. (1999). Choice of South Asian Summer Monsoon Indices. Bull. Amer. Meteorol. Soc. 80 (4), 629–638. doi:10.1175/1520-0477(1999)080<0629:cosasm>2.0.co;2
Wang, B., Liu, J., Kim, H.-J., Webster, P. J., and Yim, S.-Y. (2012). Recent Change of the Global Monsoon Precipitation (1979-2008). Clim. Dyn. 39 (5), 1123–1135. doi:10.1007/s00382-011-1266-z
Wang, B., Wu, Z., Li, J., Liu, J., Chang, C.-P., Ding, Y., et al. (2008). How to Measure the Strength of the East Asian Summer Monsoon. J. Clim. 21 (17), 4449–4463. doi:10.1175/2008JCLI2183.1
Wang, L., Chen, W., Huang, G., and Zeng, G. (2017). Changes of the Transitional Climate Zone in East Asia: Past and Future. Clim. Dyn. 49 (4), 1463–1477. doi:10.1007/s00382-016-3400-4
Wang, S., Zhang, Y., Ju, W., Qiu, B., and Zhang, Z. (2021). Tracking the Seasonal and Inter-annual Variations of Global Gross Primary Production during Last Four Decades Using Satellite Near-Infrared Reflectance Data. Sci. Total Environ. 755, 142569. doi:10.1016/j.scitotenv.2020.142569
Xing, W., and Wang, B. (2017). Predictability and Prediction of Summer Rainfall in the Arid and Semi-arid Regions of China. Clim. Dyn. 49 (1), 419–431. doi:10.1007/s00382-016-3351-9
Yan, X., Liu, J., Rühland, K. M., Smol, J. P., and Chen, F. (2021). Climate Change as the Dominant Driver of Recent Ecological Changes in a Semi-arid alpine lake from the Chinese Loess Plateau. J. Paleolimnol. 1-19. doi:10.1007/s10933-020-00167-5
Yang, F., He, Q., Huang, J., Mamtimin, A., Yang, X., Huo, W., et al. (2020). Desert Environment and Climate Observation Network over the Taklimakan Desert. Bull. Am. Meteorol. Soc. 102 (6), E1172–E1191. doi:10.1175/BAMS-D-20-0236.1
Yihui, D., and Chan, J. C. L. (2005). The East Asian Summer Monsoon: an Overview. Meteorol. Atmos. Phys. 89 (1), 117–142. doi:10.1007/s00703-005-0125-z
Zhang, L., and Zhou, T. (2015). Drought over East Asia: a Review. J. Clim. 28 (8), 3375–3399. doi:10.1175/JCLI-D-14-00259.1
Zhang, Q., Yang, J., Wang, W., Ma, P., Lu, G., Liu, X., et al. (2021). Climatic Warming and Humidification in the Arid Region of Northwest China: Multi-Scale Characteristics and Impacts on Ecological Vegetation. J. Meteorol. Res. 35 (1), 113–127. doi:10.1007/s13351-021-0105-3
Zhang, X.-C., and Liu, W.-Z. (2005). Simulating Potential Response of Hydrology, Soil Erosion, and Crop Productivity to Climate Change in Changwu Tableland Region on the Loess Plateau of China. Agric. For. Meteorology 131 (3-4), 127–142. doi:10.1016/j.agrformet.2005.05.005
Keywords: precipitation, loess plateau, monsoon, westerly wind, enso
Citation: Guan X, Zhu K, Huang X, Zeng X and He Y (2021) Precipitation Changes in Semi-arid Regions in East Asia Under Global Warming. Front. Earth Sci. 9:762348. doi: 10.3389/feart.2021.762348
Received: 21 August 2021; Accepted: 15 October 2021;
Published: 11 November 2021.
Edited by:
Renguang Wu, Zhejiang University, ChinaReviewed by:
Lin Wang, Institute of Atmospheric Physics (CAS), ChinaYunting Qiao, Sun Yat-sen University, China
Copyright © 2021 Guan, Zhu, Huang, Zeng and He. This is an open-access article distributed under the terms of the Creative Commons Attribution License (CC BY). The use, distribution or reproduction in other forums is permitted, provided the original author(s) and the copyright owner(s) are credited and that the original publication in this journal is cited, in accordance with accepted academic practice. No use, distribution or reproduction is permitted which does not comply with these terms.
*Correspondence: Xiaodan Guan, Z3VhbnhkQGx6dS5lZHUuY24=