 Chenghu Sun
 Jinqing Zuo3
 Xiaohui Shi
95% of researchers rate our articles as excellent or good
Learn more about the work of our research integrity team to safeguard the quality of each article we publish.
Find out more
ORIGINAL RESEARCH article
Front. Earth Sci. , 26 November 2021
Sec. Atmospheric Science
Volume 9 - 2021 | https://doi.org/10.3389/feart.2021.761311
This article is part of the Research Topic Changes in Snow, Monsoon and Snow-Monsoon Relationship in the Warming Climate View all 12 articles
An observational study illustrates that three distinct modes of winter Siberian high variability exist in observations at the inter-annual time scale. In this paper, we compare the connection between these diverse Siberian high variation modes with pre-autumn and simultaneous Eurasian snow cover in an observation and BCC-CSM2-MR coupled climate model run under pre-industrial conditions from the CMIP6 project. Our analyses indicate that the inter-annual variation of observed Siberian high modes do have a connection with pre-autumn and simultaneous Eurasian snow cover anomalies, but the BCC-CSM2-MR coupled climate model does not capture the observed diverse Eurasian snow–Siberian high relationships well. The BCC-CSM2-MR coupled climate model can partly reproduce the observed Siberian high variation modes, but fail to capture the spatial distribution and statistics of boreal fall and winter Eurasian snowpack, which is a key facet of simulated diverse Siberian high variability irrespective of the influence of Eurasian snow cover.
The Siberian high (SH) is the most conspicuous pressure system found in the Northern Hemisphere during wintertime (Lydolf, 1977). The strong radiative cooling over the Eurasian snow cover forms a cold-core high-pressure system in the lower troposphere over the Mongolia plateau (e.g., Cohen et al., 2001; Gong and Ho, 2002; Panagiotopoulos et al., 2005). A stronger SH could result in a higher frequency of cold surges over East Asia to decrease the temperature and generate heavy snow (Ding and Krishnamurti, 1987; Ding, 1990). Thus, SH is a primary factor of determining strength of the East Asian Winter Monsoon (EAWM) circulation. Previous studies have found that the variation of SH intensity is impacted by a number of factors, such as the Arctic Oscillation (AO), North Atlantic Oscillation (NAO), high-pressure ridge around the Ural mountains (Joung and Hitchman, 1982; Takaya and Nakamura, 2005a, Takaya and Nakamura, 2005b; Wang B. et al., 2010; Sun et al., 2016), Eurasian snow cover (Foster et al., 1983; Cohen and Fletcher, 2007; Cohen et al., 2012; Ghatak et al., 2012), and sea surface temperature (SST) anomalies in the North Atlantic. (e.g., Li, 2004; Li and Lan, 2017). Among them, interaction between the snow cover and the overlying atmospheric circulation remains a challenging issue (Henderson et al., 2018).
Snow is an important component of the hydroclimate system. Variations of snow cover can modulate radiative, moisture, and heat exchanges between the atmosphere and land surface. Physically, snow cover could affect the atmospheric circulation through altering surface albedo and soil moisture during the melting process (Hahn and Shukla 1976; Groisman et al., 1994; Barnett et al., 1989; Cohen and Rind, 1991; Dutra et al., 2011; Mu and Zhou., 2015; Zhang et al., 2017; Henderson et al., 2018). Therefore, the interaction between snow in local and remote atmospheric dynamics has been an interesting research subject (e.g., Henderson et al., 2018). Previous studies have found that the inter-annual variation of Eurasian snow cover is influenced by atmospheric circulation such as weather pattern, NAO, the mid-latitude Rossby wave train, and Arctic moisture transportation (e.g., Clark et al., 1999; Bulygina et al., 2009; Henderson and Leathers, 2010; Zuo et al., 2011; Wegmann et al., 2015; Ye et al., 2015; Ye and Lau, 2016; Ye and Wu, 2017; Sun et al., 2019). Other studies have suggested that the Eurasian snow has sufficient potential to alter the large-scale atmospheric circulation in the following winter, which affects sea level pressure (SLP) over vast areas of Northern Eurasia to exert impact on SH intensity (Cohen and Entekhabi, 1999; Cohen et al., 2001, 2007; Saito et al., 2001; Fletcher et al., 2009; Orsolini and Kvamstø, 2009; Luo and Wang, 2019). Recent results have shown that the inter-annual variation in SH exhibits three dominant modes (e.g., Jia et al., 2018; Liu et al., 2019; Zhu et al., 2019), the uniform mode, the north–south dipole mode, and the east–west dipole mode. These modes have diverse spatial features and thus different impact on East Asian winter climate. However, the connection between the spatial variations in SH and Eurasian snow anomalies in pre-autumn and simultaneous winter has received little attention and remains unclear.
The Eurasian snow–mid-latitude circulation (e.g., AO and SH) relationship has been reproduced in modeling experiments forced with Eurasian snow cover anomalies (e.g., Gong et al., 2003; Cohan and Fletcher. 2007; Fletcher., 2009; Allen and Zender 2010, 2011; Peings et al., 2012). Modeling experiment success, however, arises only when prescribing the observed snow variability, while the coupled models cannot reproduce the snow–mid-latitude circulation relationship with internally generated snow anomalies (e.g., Hardiman et al., 2008; Allen and Zender 2011; Furtado et al., 2015). For example, Furtado et al. (2015) demonstrated that coupled CMIP5 models are unable to reproduce the snow–AO dynamical links, echoing similar results from Hardiman et al. (2008) for the CMIP3 models. They claimed that the coupled CMIP5 models underestimate the variability of October Eurasian snow cover and thus do not simulate lagged winter atmospheric responses to October Eurasian snow cover variability. However, along with improvement of model physics and resolution, whether the state-of-the-art climate model can reproduce the snow–mid-latitude circulation relationship remains unclear.
In this study, we intend to examine the connection between Eurasian snow anomalies with diverse winter SH modes of inter-annual variability in observations during 1979–2019 and the BCC-CSM2-MR coupled climate model simulations. BCC-CSM2-MR is a coupled climate model developed by the Beijing Climate Center (BCC). This model participates in the current Coupled Model Inter-comparison Project, CMIP6, and the sub-seasonal to seasonal (S2S) prediction project and also provides routine seasonal forecasts (Liu et al., 2019; Liu et al., 2021; Zhu et al., 2021). The evaluation indicates that BCC-CSM2-MR shows better performance in the tropospheric air temperature and circulation in East Asia and Indian monsoon region (e.g., Wu et al., 2019; Kumar and Sarthi, 2021). Whether this newly developed climate model of BCC has any ability to reproduce the observed snow–mid latitude circulation connection in winter is still unknown, and the associated evaluated results are important to further improve the seasonal prediction skill of the BCC climate system model. We attempt to address the following issues: the lead-concurrent relationship between Eurasian snow anomalies and the diverse winter SH modes in observations at an inter-annual timescale during 1979–2019, and whether the lead-concurrent relationship can be captured by the BCC-CSM2-MR coupled climate model.
The observation and BCC-CSM2-MR coupled climate model datasets applied in the study are described in Section 2. In Section 3, we depict the major inter-annual variation modes of SH and explore their relationships with Eurasian snow cover conditions. In Section 4, we further explore the simulated inter-annual variations of SH in the BCC-CSM2-MR coupled climate model, their possible relationships with simulated snow, and the possible causes for the lack of snow–SH connection in the BCC-CSM2-MR coupled climate model. The summary of results is presented in Section 5.
The observational dataset used for comparison with model output is the ERA5 (Hersbach., 2020). The monthly mean values from 1979 to 2019 of several atmospheric variables such as geopotential height, surface air temperature, sea level pressure (SLP), snow fall, and snow depth are studied with a focus on the boreal winter season (i.e., December–January–February). Version 4 of the Northern Hemisphere EASE-Grid 2.0 snow cover (Brodzik and Armstrong 2013) used in this study is obtained from the National Snow and Ice Data Center (http://nsidc.org/data/) with the original weekly data at a grid cell size of 25 km × 25 km, which has been converted to monthly mean with 1 × 1 spatial resolution, and the newly released GlobSnow v3.0 Northern Hemisphere snow water equivalent dataset for the period of 1979–2018 is also used (Luojus et al., 2021). The AO, East Atlantic/Western Russia (EA/WR), and Polar/Eurasia (POLEUR) teleconnection indices are provided by the Climate Prediction Center (CPC). The seasonal means are calculated from monthly values, and anomalies are computed relative to the means of entire periods. To retain the inter-annual variability, the 9-year low-pass components using the Gaussian-type filter is removed for all variables. The SH intensity index (SBI) is defined after Gong et al. (2001). The North’s significance test is used to determine the confidence level of statistics in Empirical Orthogonal Function (EOF) analysis (North et al., 1982). Singular value decomposition analysis (SVD) is employed for identifying the temporal co-variability between two climatic spatial fields (Bretherton et al., 1992), and the Monte Carlo approach (Czaja and Frankignoul, 2002) is used to evaluate the significance of statistics in the SVD method. To estimate the transient eddy response of mid-latitude circulation to snow cover anomalies, the synoptic eddy vorticity feedback to the anomalous low-frequency flow is analyzed as Lau and Holopainen (1984).
Simulations from the BCC-CSM2-MR model are used to diagnose the presence of the modeled Eurasian snow–SH mechanism. The BCC-CSM2-MR model is an atmosphere–land–ocean–sea ice coupled model. The atmosphere component is the BCC Atmospheric General Circulation Model version 3 with T106 triangular truncation (resolution of approximate 110 km) and 46 vertical hybrid sigma/pressure layers, top at 1.459 hPa. The land component is the BCC Atmosphere and Vegetation Interaction Model version 2 with T106 horizontal resolution and 10 soil layers. The ocean component is the GFDL Modular Ocean Model version 4 with varying horizontal resolutions of 1/3° (at the equator) to 1° (at the pole), and the sea-ice component is the GFDL Sea Ice Simulator with the same resolution as the ocean component. All components are coupled at a frequency of 30 min without any flux adjustment. Details of the BCC-CSM2-MR model and its general performance have been documented in Wu et al. (2019).
Similar to Furtado et al. (2015), we select the coupled climate model output from a pre-industrial control (piControl) scenario (i.e., prescribed, non-evolving greenhouse gas concentrations and aerosols mimicking conditions prior to 1850 are the primary forcings) for analysis in this work. The advantages of choosing piControl scenario over other simulations are its long integrations (600 years of model output) and its exclusion of anthropogenic effects that could influence the studied relationship. Model atmospheric variables analyzed are identical to those from observations.
Figure 1 depicts the first three leading EOF modes of wintertime sea level pressure anomalies over the SH domain (40°N–60°N, 60°E–120°E) for the 1979–2019 period. The first leading EOF mode (referred to as SH-EOF1, hereafter) accounts for about 65% of the total variance, which is characterized by a uniform variation over the whole SH region to represent the intensity variation of SH (Table 1). The second leading EOF mode (SH-EOF2) accounts for about 14.1% of the total variance, and its horizontal structure shows a north–south seesaw pattern in SLP anomalies. The third leading EOF mode (SH-EOF3) shows a west–east seesaw pattern, which accounts for about 10.2% of the total variance. The three SH-EOF modes are well distinguished from each other according to the rule of North et al. (1982). Figures 1D–F display the principal components (PC) of the three SH EOF modes, and they exhibit notable interannual variations during the 1979–2019 period.
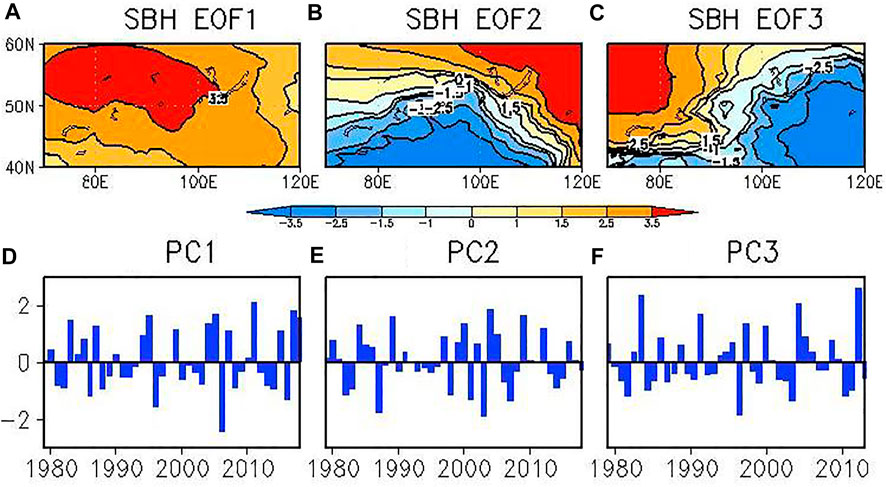
FIGURE 1. Spatial patterns and corresponding principal components of the first (A,D), second (B,E), and third (C,F) EOF mode of winter-mean SLP in the Siberian high domain (40–60oN, 70–120oE) in 1979–2019 for ERA5 Reanalysis.

TABLE 1. Correlation coefficient of Siberian High intensity index (SHI), AO, POLEUR, and EAWR teleconnection indices with the PCs of SH modes. The bold italic font indicates the value exceeding the 95% confidence level.
To further illustrate diverse features of the three SH-EOF modes, the typical anomaly SH cases for each mode are shown in Figure 2. The SH defined by the outline of 1,028 hPa SLP (Liu and Zhu, 2020) is quite similar to that defined by 1,030 hPa as Wu and Wang (2002) except for the discontinuation of the climatological 1,030 hPa contour over the SH domain. Figures 2A,B show a typical case in positive (negative) phase of the SH-EOF1 mode; that is, the enhanced (weakened) SH is notable along with enlarged (shrinked) SH extension in 2011 (2006). For the typical cases of the SH-EOF2 mode in 1984 (Figure 2C) and 2001 (Figure 2D), it represents northward or southward shift of the SH, respectively. In contrast, for the typical cases of SH-EOF3 mode in 2008 (Figure 2E) and 1999 (Figure 2F), it shows a westward displacement and eastward stretch of the SH, respectively.
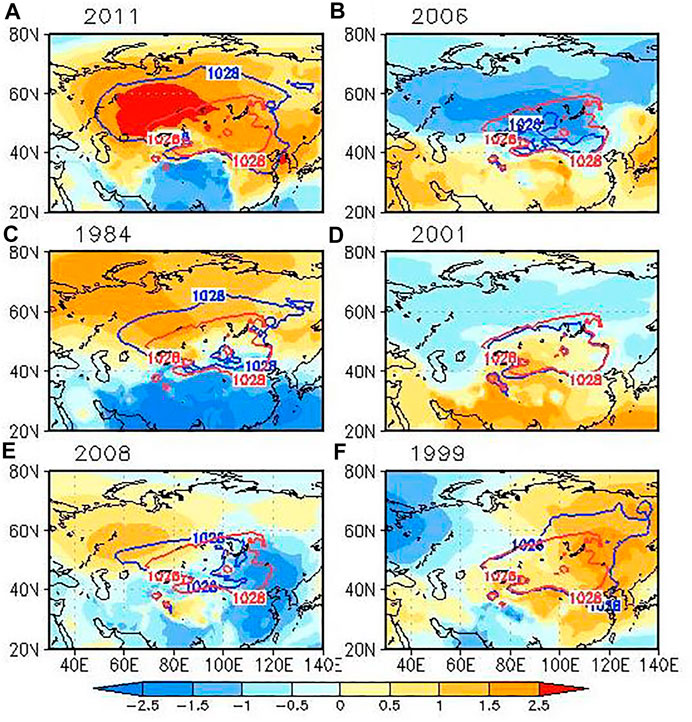
FIGURE 2. The distribution of the 1,028-hPa SLP contour in typical cases of the SH-EOF1 mode (blue line; A,B), the SH-EOF2 mode (blue line; C,D), and the SH-EOF3 mode (blue line; E,F). The climate mean 1,028-hPa SLP contour is represented by the red line and the standardized anomalies of SLP are shaded.
Figure 3 displays the wintertime upper- and low-level large-scale tropospheric circulation associated with the SH-EOF modes. The SLP anomalies associated with the SH-EOF1 mode are characterized by positive anomalies over a broad region from the Arctic to the Siberian plateau, implying a stronger-than-normal Siberian–Mongolian high (Figure 3A). Consistently, positive 500-hPa geopotential height anomalies extend southward from the Arctic to the Ural Mountains (Figure 3B). In the mid-latitudes, two major negative anomaly centers are located in the central Europe and northeastern East Asia, separately. This distribution of geopotential height anomalies resembles the EA/WR teleconnection pattern as indicated by Chen et al. (2019), and the SH-PC1 has a correlation coefficient of 0.50 with the EA/WR index (Table 1), which is significant at the 95% confidence level. The EA/WR like pattern is accompanied by an upper-level blocking ridge over the Ural Mountains and a deepened trough off the east coast of East Asia, providing favorable dynamical conditions for the southward intrusion of mid–high latitude cold air into East Asia (e.g., Wu and Chan, 1997; Wang B. et al., 2010; Wang L. et al., 2010).
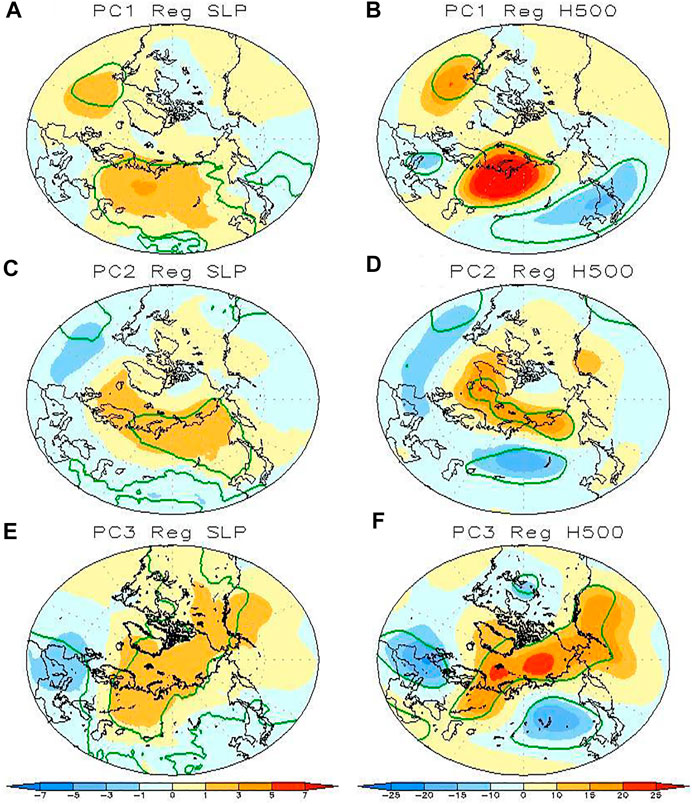
FIGURE 3. Regressed anomalies of DJF (A) SLP (shading, units: hPa), (B) 500 hPa geopotential height (shading, units: m) onto the PC1 index, (C,D) onto the PC2 index, and (E,F) onto the PC3 index. The green line indicates the value significantly exceeding the 95% confidence level.
For the SH EOF2 (Figure 3C), the associated positive SLP anomalies occupy a broad region from the Arctic to the northern Siberian plateau and opposite anomalies occur over the southern Siberian plateau. For the winter 500-hPa geopotential height field (Figure 3D), negative anomalies are evident over most of the Eurasian continent and opposite anomalies over the Arctic Ocean, the pattern of which is similar to the negative phase of AO to some extent (e.g., Chen et al., 2014, 2016). The correlation coefficient between the SH-PC2 and AO index is approximately −0.40, exceeding significance at the 95% confidence level (see Table 1). Comparison of Figures 3C,D indicates that the atmospheric circulation anomalies associated with the SH-EOF2 exhibits a notable baroclinic structure in the mid–high latitude.
The SLP variation associated with the SH-EOF3 mode is characterized by a west–east dipole pattern, with positive anomalies over the western Siberian plateau and the Arctic Ocean and opposite anomalies over the eastern Siberian plateau (Figure 3E). The west–east dipole pattern is also clearly observed in the 500-hPa geopotential height field (Figure 3F), with a mild ridge over the western Siberian plateau and a trough over the Lake Baikal, which resembles the POLEUR teleconnection pattern (see Table 1).
Moreover, relationships between the surface air temperature anomalies and the three SH-EOF modes in winter are examined. Associated with variation of the SH-EOF1 mode, warming signal exceeding 1.0°C occurs over the Arctic and northern edge of the Eurasian continent and cold anomalies spread in the high-mid latitude Eurasian continent (Figure 4A). Associated with variation of the SH EOF2 mode, the appearance of warm surface air temperature anomalies is confined to the Arctic region, and cold anomalies exceeding −1.0°C dominate the mid-high latitude of the Eurasian continent (Figure 4B). Associated with the SH EOF3 mode (Figure 4C), cold temperature anomalies cover most of the mid-latitude of the Eurasian continent, whereas the milder warm temperature anomalies occur over the region to the south of 40°N and stretch northwestward to Lake Baikal.
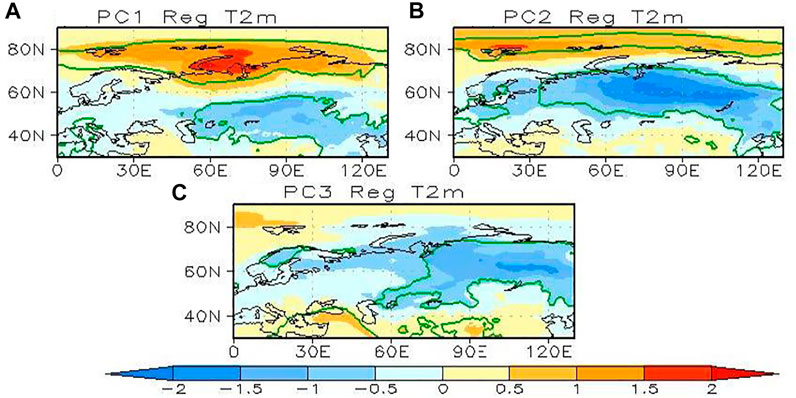
FIGURE 4. Regressed anomalies of DJF T2m (shading, units: C) onto the (A) PC1, (B) PC2, and (C) PC3 index. The green line indicates the value significantly exceeding the 95% confidence level.
There are several possible physical mechanisms in the Eurasian snow cover–SH connection: (1) The thermodynamical pathway: the expansion of the Eurasian snow cover in late autumn can persist into winter and cause a strong radiative cooling above the snow-covered surface over the Eurasian continent, which cools the surface and increases surface pressure to enhance the SH (e.g., Ding 1990; Cohen et al., 2001; Cohen et al., 2007; Jeong et al., 2011; Luo and Wang, 2019). (2) The troposphere–stratosphere interaction pathway: previous studies have suggested that the lower tropospheric anomalies associated with pre-autumn snow anomalies can amplify the downstream standing wave pattern and enhance the vertical wave propagation into the polar stratosphere through troposphere–stratosphere interaction to affect the mid-latitude circulation (e.g., AO) in late winter, which can also modulate SH variation (e.g., Henderson et al., 2018). Besides, several studies also found that the snow cover feedbacks start from radiative and thermodynamical processes and then are amplified by the internal dynamics of the climate system (Clark et al., 1999; Cohen et al., 2007). The strong transient eddy forcing is important for connection of extratropical response to mid-latitude snow anomalies, which may impact the SH variation (Deser et al., 2007; Fletcher et al., 2009; Wu B. et al., 2011).
To examine the connection between the three SH modes and Eurasian snow cover variations, we present regression of their corresponding PCs onto the snowfall, snow depth, and snow water equivalent (SWE) anomalies in simultaneous winter. Associated with variation of the SH-EOF1 mode (Figures 5A–C), the less snow is observed over most areas of the Siberian plateau to the north of 45°N, in which the positive surface pressure anomalies are located (see Figures 3A,B), while more snow is over the region to its south, especially to the south of Lake Baikal where it is under the control of negative pressure anomalies. These features indicate that the SH-EOF1 mode dominates the local snow variations in simultaneous winter. Similar results are obtained for the EOF2 (Figures 5D–F) and EOF3 (Figures 5G–I) modes.
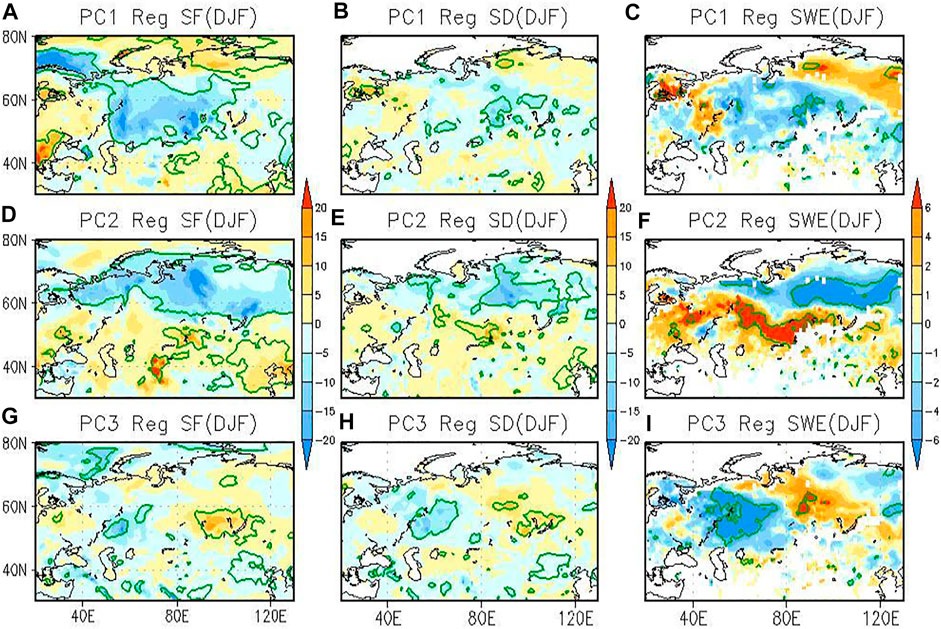
FIGURE 5. Regressed anomalies of DJF (A) snow fall (shading, units: mm), (B) snow depth (shading, units: mm), and (C) snow water equivalent (shading, units: mm) onto PC1, (D–F) onto PC2, and (G–I) onto PC3. The green line indicates the value significantly exceeding the 95% confidence level.
Furthermore, we detect the connection between pre-autumn snow anomalies and the three SH-EOF modes by applying the SVD method as Wu et al. (2011b). Figure 6 displays the first three pairs of coupled SVD pattern of DJF SLP over the SH domain and (October–November) ON Eurasian snow cover anomalies for the period of 1979–2019. The first leading SVD mode describes decreased ON snow cover over most of the Eurasian continent, especially over the northern and eastern Siberian plateau, and increased snow cover over the southwestern Eurasia continent collated with a uniform enhanced SLP over the whole Siberian region as the SH-EOF1 mode (Figures 6A–C). The second most important pair of coupled SVD patterns is characterized by increased ON snow cover over the eastern Eurasian continent and decreased snow cover over the western part co-varying with a northward shift of SH as the SH-EOF2 mode (Figures 6D–F). The third pair of coupled SVD patterns is characterized by increased ON snow cover over the northeastern Eurasian continent and decreased snow cover over the western part co-varying with a westward shift of SH as the SH-EOF3 mode (Figures 6G–I).
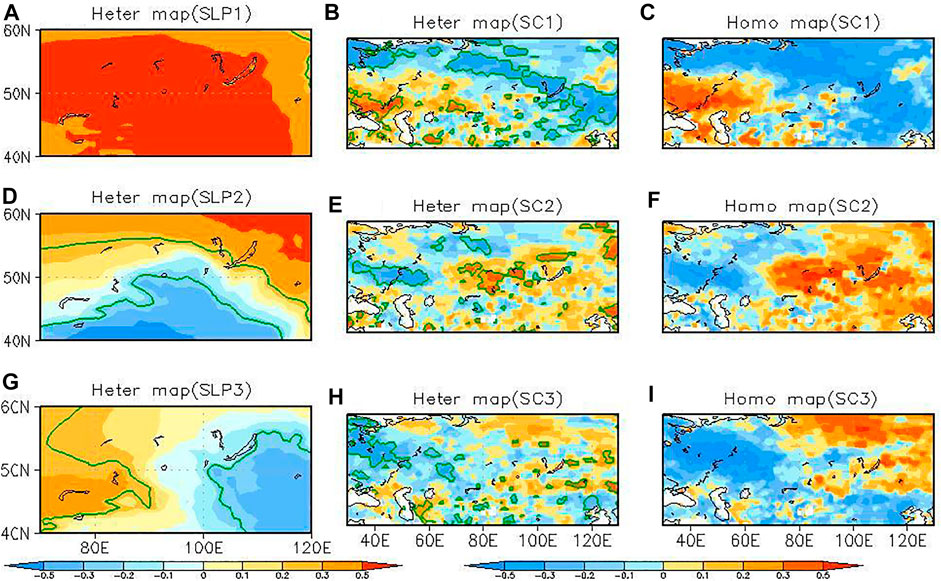
FIGURE 6. Heterogeneous correlation coefficient maps of DJF SLP (A), ON snow cover (B), and homogeneous map of ON snow cover (C) in the first SVD mode of observations. (D–F) For the second SVD mode, (E–F) for the third SVD mode. The green line indicates the value significantly exceeding the 90% confidence level.
To reveal the physical connection among the above-mentioned three leading SVD modes, we firstly analyze the possible influence of SVD SC1 snow cover mode on the ON, DJF snow depth, and H500 synoptic eddy-vorticity forcing by regressing the expansion coefficient time series of SVD-SC1 onto them. The features in Figures 6B,C are also evident in snow depth anomalies of later autumn and the following winter (Figures 7A,B). The distribution pattern of snow anomalies modulates the mid-latitude circulation resembled to EA/WR teleconnection pattern through synoptic eddy-vorticity response (Figure 7C), which further modulates the occurrence of the SH-EOF1 mode as in Figures 3A,B; Table 1. With the influence of the SVD-SC2 mode (Figures 6E,F), previous studies have found that the positive snow cover anomalies over the eastern Siberian plateau would force negative AO phase through troposphere–stratospheric circulation interaction. As AO-like response has been well studied, we will only examine the associated evolution of circulation in troposphere and stratosphere to illustrate the possible connections. Figure 8 displays the regressed maps of ON and DJF 50-hPa geopotential height upon the time series of SVD-SC2 expansion coefficient. In ON, the 50-hPa geopotential height anomalies show a dipole-like structure (Figure 8A), with development of positive height anomalies over the North Atlantic–North American sector. In the following winter (Figure 8B), the above circulation structures remain visible at the middle and high latitudes. The above spatial distribution of stratospheric circulation changes is collocated with a wave 1 pattern. At H500 (Figures 8C,D), the blocking-type ridge is developed in the Ural Mountain region in later autumn, and it has been documented that the frequent and persistent episodes of blocking in the Ural Mountain region are likely to contribute to vertical planetary wave propagation with wavenumber-1 and wavenumber-2 components (Charney and Drazin 1961; Garfinkel et al., 2010; Mori et al., 2014). With enhanced propagation of the vertical wave into the polar stratosphere trough troposphere–stratospheric circulation interaction in the following winter, it finally affects the mid-latitude circulation as AO (Figure 8D) and further modulates the SH EOF-2 mode as in Figures 3C,D; Table 1. With the influence of the SVD-SC3 mode (Figures 6H,I), the enhanced snow cover over the northeastern Siberian Plateau and less snow cover over the Ural region persists from later autumn into winter (Figures 9A,B), and it modulates the mid-latitude circulation resembling the POLEUR teleconnection pattern through synoptic eddy-vorticity forcing response (Figure 9C), which further impacts the occurrence of SH-EOF 3 mode as in Figures 3E,F; Table 1.
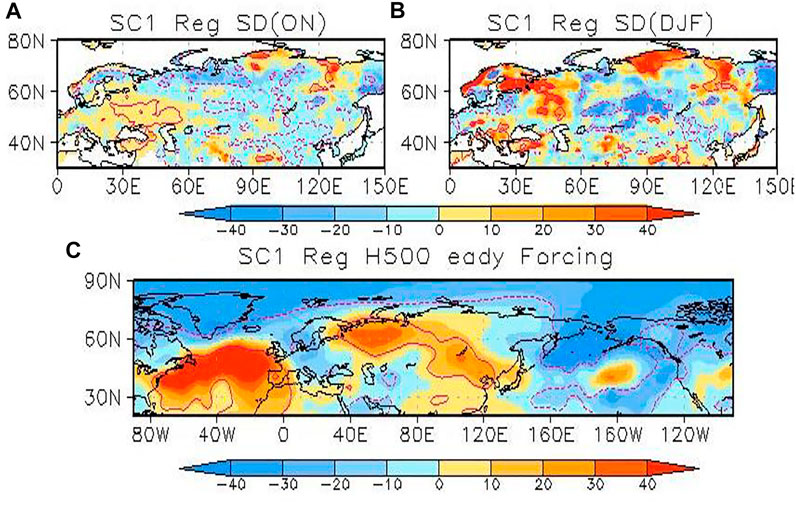
FIGURE 7. Regressed anomalies of ON (A), (B) DJF snow depth (shading, units: mm), and (C) H500 synoptic eddy-vorticity forcing onto expansion coefficient time series of snow cover in the first SVD mode. The red line indicates the value significantly exceeding the 90% confidence level.
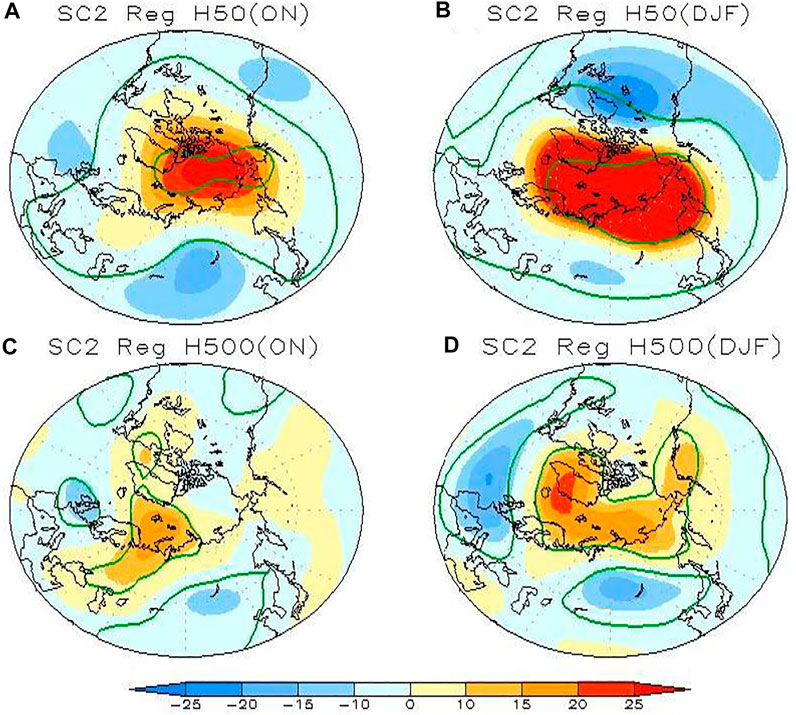
FIGURE 8. Regressed anomalies of ON (A), (B) DJF H50 geopotential height (shading, units: m), ON (C) and DJF (D) H500 geopotential height onto expansion coefficient time series of snow cover in the second SVD mode. The red line indicates the value significantly exceeding the 90% confidence level.
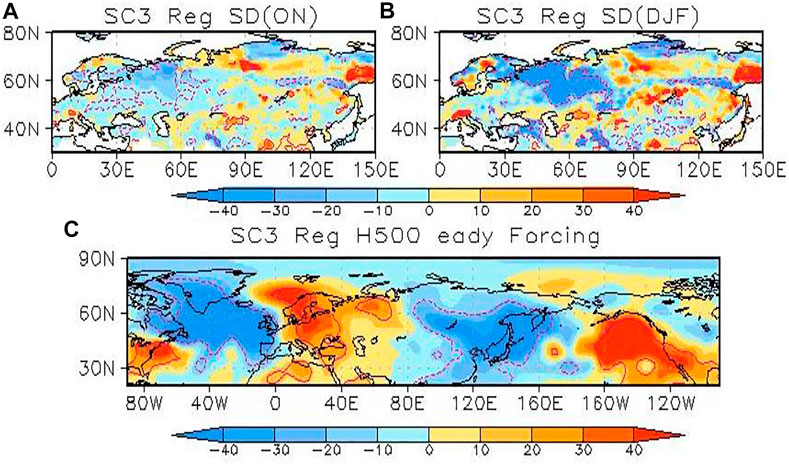
FIGURE 9. Regressed anomalies of ON (A), (B) DJF snow depth (shading, units: mm), and (C) H500 synoptic eddy-vorticity forcing onto expansion coefficient time series of snow cover in the third SVD mode. The red line indicates the value significantly exceeding the 90% confidence level.
Previous studies have found the linkage between Eurasian snow cover and the intensity of SH through both thermodynamic and troposphere–stratospheric circulation interaction pathway; however, the possible influence of snow cover on the spatial variation of SH received little attention. Our statistical analysis indicates that the possible connections between pre-autumn snow cover and three different types of SH variation mode is mainly through the transient eddy response mechanism and troposphere–stratospheric circulation interaction. In simultaneous winter, we find that the SH variation modes act to force the anomaly distribution of Eurasian snow cover.
To examine whether the BCC-CSM2-MR coupled climate model has any ability to reproduce the observed Eurasian snow–SH connection, this section explores the diverse SH variation modes and their connections with the Eurasian snow cover in the 599-year piControl simulation from this model. Figure 10 depicts the first three leading EOF modes of simulated winter SLP anomalies over the SH domain (40°N–60°N, 60°E–120°E) for the model years from 1850 to 2448. These three simulated EOF modes can be separated from each other according to the criterion of North et al. (1982). The simulated EOF1 mode accounts for 57.6% of the total variance (Figure 10A), which is characterized by a uniform variation in SLP over the whole region as that of observation. The simulated EOF2 mode accounts for 21.6% of the total variance (Figure 10B), and its horizontal structure depicts a northeast–southwest seesaw pattern in SLP variations, which is different from the observed EOF2 mode (i.e., the north–south seesaw pattern). The simulated EOF3 mode accounts for approximately 10.4% of the total variance (Figure 10C), and it is characterized by a northwest–southeast seesaw pattern, which partly resembles the observed SH-EOF3 mode (i.e., the west–east seesaw pattern).

FIGURE 10. Spatial patterns and corresponding principal components of the first (A,D), second (B,E), and third (C,F) EOF mode of winter-mean SLP in the Siberian high domain (40–60°N, 70–120°E) from the BCC-CSM2-MR model.
Figure 11 displays the large-scale tropospheric circulation associated with the abovementioned simulated SH modes in winter. Associated with variation in the simulated EOF1 mode (Figure 11A), positive SLP anomalies occurs over a broad region from the Arctic to the Siberian plateau as in the observation (Figure 3A). The simulated 500-hPa geopotential height anomalies show a wavy pattern over mid-high latitudes, with alternating positive and negative height centers of action over Central Europe, the northern Siberian plateau, and the northeastern East Asia (Figure 11B), the pattern of which is similar to that in observation (Figure 3B). Associated with variation in the simulated EOF2 mode, a similar east–west dipole pattern is observed in the SLP and 500-hPa geopotential height anomaly fields over the Eurasian continent (Figures 11C,D). The SLP and 500-hPa geopotential height anomalies associated with the simulated EOF3 mode both show a wavy pattern over the Eurasian mid–high latitudes (Figure 11E), with alternating positive and negative anomalies over southeastern Europe, the northern Siberian plateau–Arctic Ocean, and northeastern Asia. It is noticed that the overall structure of the 500-hPa geopotential height anomaly bears similarity between the simulated EOF1 and EOF3 modes, except that the latter shifts more northward to the higher latitude (Figure 11F).

FIGURE 11. Regressed anomalies of DJF (A) SLP (shading, units: hPa), (B) 500 hPa geopotential height (shading; units: m) onto the PC1, (C,D) PC2, and (E,F) PC3 index from the BCC-CSM2-MR model. The green line indicates the value significantly exceeding the 95% confidence level.
Figure 12 shows relationships between the three simulated EOF modes and surface air temperature anomalies in winter. Associated with variation in the simulated EOF1 mode (Figure 12A), warming temperature anomalies between 0.5°C and 1.5°C occur over the Arctic and the northern edge of Eurasia, and cold anomalies occur over the Eurasian mid-latitudes, the pattern of which bears resemblance to that in observation (Figure 4A). For the simulated EOF2 mode, mild warm temperature anomalies of approximately 0.5°C appear over the Arctic region, while cold anomalies of approximately −0.5°C to−1.0°C occur over the northwestern Eurasian continent and extend eastward to Lake Baikal (Figure 12B). The pattern of surface air temperature anomalies associated with the simulated EOF3 mode is similar to that associated with the simulated EOF1 mode, but the warm temperature anomalies between 1°C and 1.5°C are confined to the Barents–Kara Sea and cold anomalies exceeding −1.0°C lie in central Siberia for the simulated EOF3 mode (Figure 12C).
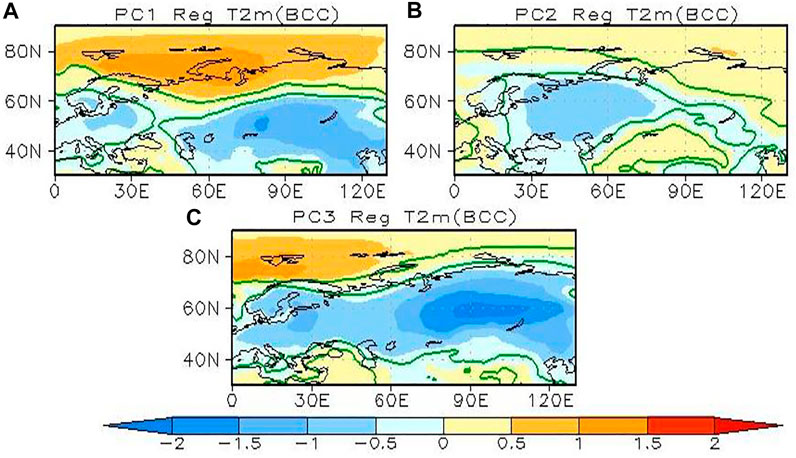
FIGURE 12. Regressed anomalies of DJF T2m (shading, units: °C) onto the simulated (A) PC1, (B) PC2, and (C) PC3 index from the BCC-CSM2-MR model. The green line indicates the value significantly exceeding the 95% confidence level.
Associated with variations in the simulated EOF1 mode (Figures 13A–C), reduced snow occurs over most of the Eurasian continent to the north of 40°N and increased snow to the south in winter. For the simulated EOF2 mode (Figures 13D–F), increased snow occurs over the southwestern Eurasian continent, while reduced snow is observed over central Siberia. The pattern of snow anomalies associated with the simulated EOF3 mode (Figures 13G–I) bears resemblance to that associated with the simulated EOF1 mode, with reduced snow over the northern Eurasia and increased snow to the south. Comparison of Figures 11, 13 indicates the direct modulation of atmospheric circulation on the underlying snow variations in the model simulation during winter, which is consistent with the observational result.

FIGURE 13. Regressed anomalies of DJF (A) snow fall (shading, units: mm), (B) snow depth (shading; units: mm), and (C) snow cover (shading; units: %) onto the PC1 index, (D–F) onto the PC2 index, and (G–I) onto PC3 index from BCC-CSM2-MR simulations. The green line indicates the value significantly exceeding the 95% confidence level.
To examine the connection between precursory snow signal in late autumn over the Eurasian continent and SH in the following winter, an SVD analysis is also applied to the simulated ON snow cover and DJF SLP anomalies (Figure 14). It is indicated that the precursory snow signals for the three simulated SH modes are rather weak, with few areas exceeding significance at the 95% confidence level. In other words, the BCC-CSM2-MR coupled climate model cannot reproduce the observed autumn snow–winter SH connection. To verify whether the poor connection between the simulated SH in winter and Eurasian snow anomalies in the preceding autumn is stable, the 599-year expansion coefficient time series of the SVD modes are divided into 14 41-year subintervals and then the correlation coefficient between the expansion coefficient time series of the winter SLP and autumn snow cover anomalies is calculated for each subinterval (see Figure 15). It is found that insignificant correlation coefficient is observed for most of the subintervals, confirming the poor ability of the BCC-CSM2-MR model to reproduce the observed autumn snow–winter SH connection.
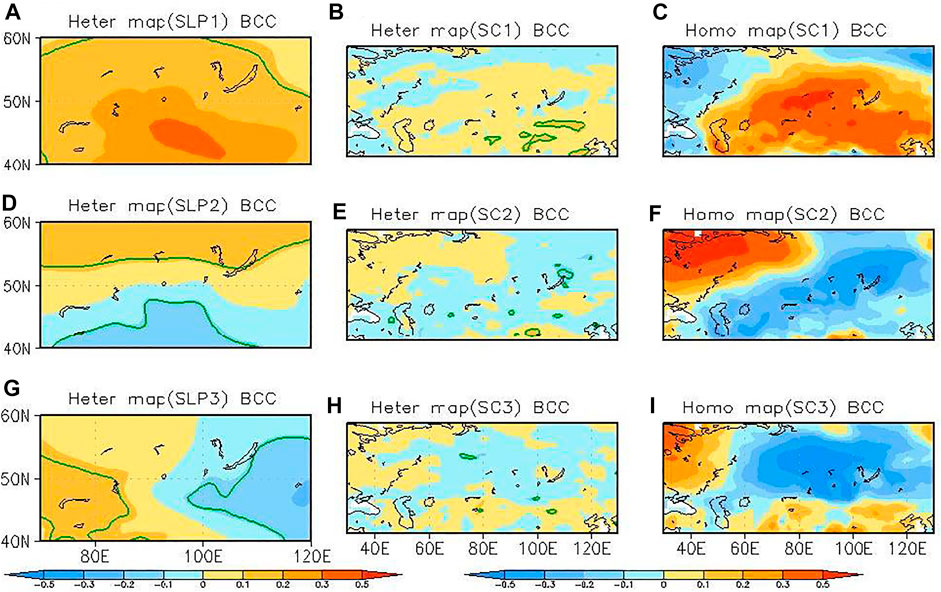
FIGURE 14. Heterogeneous correlation coefficient maps of DJF SLP (A), ON snow cover (B), and homogeneous map of ON snow cover (C) in the first SVD mode of BCC-CSM2-MR simulations. (D–F) For the second SVD mode, (D–F) for the third SVD mode. The green line indicates the value significantly exceeding the 90% confidence level.

FIGURE 15. The correlation coefficient between expansion coefficient time series of DJF SLP and ON snow cover in the first (A), second (B), and third (C) SVD mode for individual 41-year subintervals. The blue line indicates the value significantly exceeding the 95% confidence level.
Previous studies have revealed that the poor relationship between Eurasian snow cover and winter AO variability in the CMIP5 coupled simulations may be attributed to the underestimation of snow cover and its inter-annual variability in the model (Derkson and Brown, 2012; Furtado et al., 2015). Figure 16 presents the climatological late autumn snow cover fraction and snow depth in the observation (Figures 16A,B) and BCC-CSM2-MR simulations (Figures 16C,D). The spatial extent of snow cover fraction has notable differences between the observation and simulation (Figures 16A,C). In particular, the observation shows higher fraction (nearly 10%–20% higher) of snow cover over the northern Siberia and the mid-latitude belts between 40 and 50°N over Eurasia. Difference in snow depth between the observation and simulations is also evident; that is, the BCC-CSM2-MR model generally overestimates the snow depth over the area to the north of 50°N (Figures 16B,D).
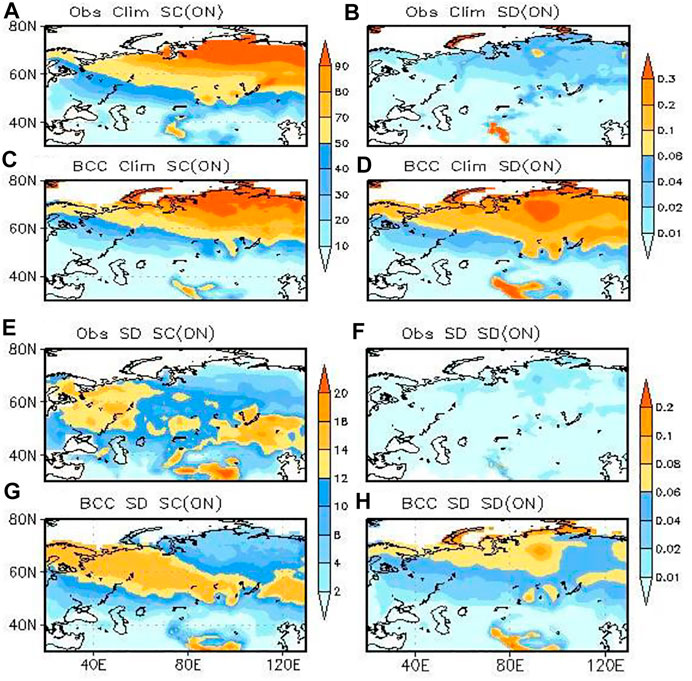
FIGURE 16. The climatological ON mean (A) fractional snow cover (units: %), (B) snow depth (units: m) of observation, the simulated (C) fractional snow cover (units: %), and (D) snow depth (units: m) from BCC-CSM2-MR simulations. The standard deviation of ON mean (E) fractional snow cover (units: %), (F) snow depth (units: m) of observation, the simulated standard deviation of (G) fractional snow cover (units: %), and (H) snow depth (units: m) from BCC-CSM2-MR simulations.
The spatial pattern of standard deviation of snow cover fraction between the simulation and observation is rather different (Figures 16E,G). The standard deviation is generally overestimated over the region from Eastern Europe to the central Siberian plateau and underestimated over the eastern Siberian plateau in the simulations. The standard deviation of the simulated snow depth is generally overestimated when compared to the observation (Figures 16F,H). It is also noted that the SVD modes of autumn snow cover in observation and model simulation are rather different (Figures 6, 14). The snow deficiency may be related to precipitation generation and/or land-surface parameterizations for accumulating snowfall in the model. Poor snowfall and snow cover representation in the BCC-CSM2-MR model results in weak or incorrect dynamical responses in the atmosphere. Future modeling studies should focus on assessing this snow cover/snowfall issue.
In this paper, we compared the connection between diverse SH inter-annual variation modes with pre-autumn and simultaneous winter Eurasian snow cover in observations and the BCC-CSM2-MR coupled climate model simulations under pre-industrial conditions from the CMIP6 project. Observational evidence shows that inter-annual variability of the winter SH exhibits three distinct modes, the uniform mode, the north–south dipole mode, and the west–east dipole mode, during 1979–2019. For the connection between the observed SH modes with simultaneous Eurasian snow anomalies in winter, the results imply that the SH modes actually force the variation in snowpack. Moreover, different spatial distribution of precursory Eurasian snowpack anomalies in the preceding autumn can be detected for the different SH modes in winter, and the possible physical connection between the autumn Eurasian snow and winter SH variations is found through transient eddy forcing response and troposphere–stratospheric interaction.
Moreover, it is found that the BCC-CSM2-MR models can capture the observed uniform mode of the SH well, but fail to reproduce the other two SH modes (i.e., the north–south and west–east dipole modes) in winter. The simulated SH-EOF1 mode features a uniform pattern over the Siberian region as that in observation. The simulated SH-EOF2 mode shows a northeast–southwest dipole pattern, which is different from the observed north–south dipole mode. The simulated SH-EOF3 mode shows a northwest–southeast dipole pattern, whereas the observed SH-EOF3 mode features a west–east dipole pattern. Also, the BCC-CSM2-MR model cannot reproduce the observed diverse connections between the winter SH and preceding autumn Eurasian snow variations, which is possibly related to the poor ability of the model in simulating the Eurasian snow cover fraction and snow depth. Since the autumn Eurasian snow cover anomalies play an important role in modulating the winter SH and thus East Asian winter monsoon variability, the poor performance of BCC-CSM2-MR in simulating the autumn snow–winter SH connections may affect the seasonal prediction skill of East Asian winter monsoon and surface climate.
In this study, we just explored the possible statistic connection between three types of SH modes with precursory and simultaneous Eurasian snow anomalies in observations and BCC-CSM2-MR coupled model simulations as Furtado et al. (2015). Further studies are still required to systematically understand how different Eurasian snow distributions modulate the diverse SH modes. Moreover, this study diagnosed the presence of the Eurasian snow–SH connection in the state-of-the-art BCC-CSM-MR model participating in CMIP6, while the performance of other CMIP6 models remains unclear. Furtado et al. (2015) demonstrated that the CMIP5 coupled models underestimate the variability of October Eurasian snow cover and thus cannot simulate lagged winter atmospheric responses to the October Eurasian snow cover variability. Jiang et al. (2020) revealed that current CMIP6 models still underestimate the strength of the East Asian winter monsoon when compared to the CMIP5 models. However, whether the biases are related to the poor performance of the model in simulating the snow–SH connections are needed to be explored in future works.
As a word of caution, this study just focused on examining the connections between the Eurasian snow cover anomalies and the diverse SH modes, and their relationships may be influenced by other external forcings. For example, recent studies have indicated that Arctic sea ice and North Atlantic SST anomalies can exert substantial impacts on the atmospheric circulation and climate anomalies over Eurasia (e.g., Mori et al., 2014; Wu et al., 2013; Sun et al., 2016; Chen and Wu, 2018). It is also worth mentioning that the observational result derived from the uncoupled ERA5 reanalysis is affected by both forced variability and internal variability, while the model output used in this study only includes unforced variability. Further analysis by using coupled reanalysis data is needed to interpret model performances in capturing the possible connections.
The original contributions presented in the study are included in the article/Supplementary Material. Further inquiries can be directed to the corresponding author.
All authors have made a substantial, direct, and intellectual contribution to the work, and approved it for publication.
This research is supported by the National Key Research and Development Program of China (Grant No. 2019YFC1510104), the National Natural Science Foundation of China (Grant No. 41975102), the Basic Scientific Research and Operation Foundation of CAMS (2021Z004 and 2021Z007), and the joint fund of the State Key Program of National Natural Science of China and the Civil Aviation Administration of China (U2033207).
The authors declare that the research was conducted in the absence of any commercial or financial relationships that could be construed as a potential conflict of interest.
All claims expressed in this article are solely those of the authors and do not necessarily represent those of their affiliated organizations, or those of the publisher, the editors and the reviewers. Any product that may be evaluated in this article, or claim that may be made by its manufacturer, is not guaranteed or endorsed by the publisher.
The authors thank the reviewers whose constructive comments are helpful for improving the overall quality of the paper.
The Supplementary Material for this article can be found online at: https://www.frontiersin.org/articles/10.3389/feart.2021.761311/full#supplementary-material
Allen, R. J., and Zender, C. S. (2010). Effects of continental-scale Snow Albedo Anomalies on the Wintertime Arctic Oscillation. J. Geophys. Res. 115, D23105. doi:10.1029/2010JD014490
Allen, R. J., and Zender, C. S. (2011). Forcing of the Arctic Oscillation by Eurasian Snow Cover. J. Clim. 24 (24), 6528–6539. doi:10.1175/2011JCLI4157.1
Barnett, T. P., Dümenil, L., Schlese, U., Roeckner, E., and Latif, M. (1989). The Effect of Eurasian Snow Cover on Regional and Global Climate Variations. J. Atmos. Sci. 46, 661–686. doi:10.1175/1520-0469(1989)046<0661:teoesc>2.0.co;2
Bretherton, C. S., Smith, C., and Wallace, J. M. (1992). An Intercomparison of Methods for Finding Coupled Patterns in Climate Data. J. Clim. 5, 541–560. doi:10.1175/1520-0442(1992)005<0541:aiomff>2.0.co;2
Brodzik, M., and Armstrong, R. (2013). Northern Hemisphere EASE-Grid 2.0 Weekly Snow Cover and Sea Ice Extent, Version 4. Boulder: NASA National Snow and Ice Data Center. doi:10.5067/P7O0HGJLYUQU
Bulygina, O. N., Razuvaev, V. N., and Korshunova, N. N. (2009). Changes in Snow Cover over Northern Eurasia in the Last Few Decades. Environ. Res. Lett. 4, 045026. doi:10.1088/1748-9326/4/4/045026
Charney, J., and Drazin, P. (1961). Propagation of planetaryscale disturbances from the lower into the upper atmosphere. J. Geophys. Res. 66, 83–109. doi:10.1029/JZ066i001p00083
Chen, S., and Wu, R. (2018). Impacts of Early Autumn Arctic Sea Ice Concentration on Subsequent spring Eurasian Surface Air Temperature Variations. Clim. Dyn. 51 (7-8), 2523–2542. doi:10.1007/s00382-017-4026-x
Chen, S., Wu, R., and Liu, Y. (2016). Dominant Modes of Interannual Variability in Eurasian Surface Air Temperature during Boreal spring. J. Clim. 29, 1109–1125. doi:10.1175/jcli-d-15-0524.1
Chen, S., Wu, R., Song, L., and Chen, W. (2019). Interannual Variability of Surface Air Temperature over Mid-high Latitudes of Eurasia during Boreal Autumn. Clim. Dyn. 53, 1805–1821. doi:10.1007/s00382-019-04738-9
Chen, S., Yu, B., and Chen, W. (2014). An Analysis on the Physical Process of the Influence of AO on ENSO. Clim. Dyn. 42, 973–989. doi:10.1007/s00382-012-1654-z
Clark, M. P., Serreze, M. C., and Robinson, D. A. (1999). Atmospheric Controls on Eurasian Snow Extent. Int. J. Climatol. 19, 27–40. doi:10.1002/(sici)1097-0088(199901)19:1<27:aid-joc346>3.0.co;2-n
Cohen, J., Barlow, M., Kushner, P. J., and Saito, K. (2007). Stratosphere-Troposphere Coupling and Links with Eurasian Land Surface Variability. J. Clim. 20, 5335–5343. doi:10.1175/2007JCLI1725.1
Cohen, J., and Entekhabi, D. (1999). Eurasian Snow Cover Variability and Northern Hemisphere Climate Predictability. Geophys. Res. Lett. 26, 345–348. doi:10.1029/1998GL900321
Cohen, J., and Fletcher, C. (2007). Improved Skill of Northern Hemisphere Winter Surface Temperature Predictions Based on Land-Atmosphere Fall Anomalies. J. Clim. 20, 4118–4132. doi:10.1175/JCLI4241.1
Cohen, J., and Rind, D. (1991). The Effect of Snow Cover on the Climate. J. Clim. 4, 689–706. doi:10.1175/1520-0442(1991)004<0689:teosco>2.0.co;2
Cohen, J., Furtado, J., Barlow, J., Alexeev, V., and Cherry, J. (2012). Arctic warming, increasing snow cover and widespread boreal winter cooling. Environ. Res. Lett. 7, 014007. doi:10.1088/1748-9326/7/1/014007
Cohen, J., Saito, K., and Entekhabi, D. (2001). The Role of the Siberian High in Northern Hemisphere Climate Variability. Geophys. Res. Lett. 28, 299–302. doi:10.1029/2000GL011927
Czaja, A., and Frankignoul, C. (2002). Observed impact of Atlantic SST anomalies on the North Atlantic Oscillation. J. Clim. 15, 606–623. doi:10.1175/1520-0442(2002)015<0606:OIOASA>2.0.CO;2
Derksen, C., and Brown, R. (2012). Spring Snow Cover Extent Reductions in the 2008-2012 Period Exceeding Climate Model Projections. Geophys. Res. Lett. 39, a–n. doi:10.1029/2012GL053387
Deser, C., Tomas, R., and Peng, S. (2007). The transient atmospheric circulation response to North Atlantic SST and sea ice anomalies. J. Clim. 20, 4751–4767. doi:10.1175/JCLI4278.1
Ding, Y. H. (1990). Buildup, Air-Mass Transformation and Propagation of Siberian High and its Relations to Cold Surge in East-Asia. Meteorol. Atmos. Phys. 44 (1–4), 281–292.
Ding, Y., and Krishnamurti, T. N. (1987). Heat Budget of the Siberian High and the winter Monsoon. Mon. Wea. Rev. 115, 2428–2449. doi:10.1175/1520-0493(1987)115<2428:hbotsh>2.0.co;2
Dutra, E., Schär, C., Viterbo, P., and Miranda, P. M. A. (2011). Land-atmosphere Coupling Associated with Snow Cover. Geophys. Res. Lett. 38 (15), L15707. doi:10.1029/2011gl048435
Fletcher, C. G., Kushner, P. J., Hall, A., and Qu, X. (2009). Circulation Responses to Snow Albedo Feedback in Climate Change. Geophys. Res. Lett. 36, L09702. doi:10.1029/2009GL038011
Foster, J., Owe, M., and Rango, A. (1983). Snow Cover and Temperature Relationships in North America and Eurasia. J. Clim. Appl. Meteorol. 22, 460–469. doi:10.1175/1520-0450(1983)022<0460:scatri>2.0.co;2
Furtado, J., Cohen, J., Butler, A., Riddle, E., and Kumar, A. (2015). Eurasian snow cover variability and Northern Hemisphere climate predictability. Clim. Dyn. 45, 2591–2605. doi:10.1007/s00382-015-2494-4
Garfinkel, C., Hartmann, D., and Sassi, F. (2010). Tropospheric precursors of anomalous Northern Hemisphere stratospheric polar vortices J. Clim. 23, 3282–3299. doi:10.1175/2010JCLI3010.1
Ghatak, D., Deser, C., Frei, A., Gong, G., Phillips, A., Robinson, D. A., et al. (2012). Simulated Siberian snow cover response to observed Arctic sea ice loss, 1979–2008. J. Geophys. Res. 117, D23108. doi:10.1029/2012JD018047
Gong, D., Wang, S., and Zhu, J. (2001). East Asian winter monsoon and Arctic Oscillation Geophys. Res. Lett. 28, 2073–2076. doi:10.1029/2000GL012311
Gong, D. Y., and Ho, C. H. (2002). Can the Arctic Oscillation Impact the East Asian Summer Monsoon? CLIVAR Exchanges 7, 18–20.
Gong, G., Entekhabi, D., and Cohen, J. (2003). Modeled Northern Hemisphere Winter Climate Response to Realistic Siberian Snow Anomalies. J. Clim. 16, 3917–3931. doi:10.1175/1520-0442(2003)016<3917:mnhwcr>2.0.co;2
Groisman, P. Y., Karl, T. R., Knight, R. W., and Stenchikov, G. L. (1994). Changes of Snow Cover, Temperature, and Radiative Heat Balance over the Northern Hemisphere. J. Clim. 7, 1633–1656. doi:10.1175/1520-0442(1994)007<1633:coscta>2.0.co;2
Hahn, D. G., and Shukla, J. (1976). An Apparent Relationship between Eurasian Snow Cover and Indian Monsoon Rainfall. J. Atmos. Sci. 33, 2461–2462. doi:10.1175/1520-0469(1976)033<2461:aarbes>2.0.co;2
Hardiman, S. C., Kushner, P. J., and Cohen, J. (2008). Investigating the Ability of General Circulation Models to Capture the Effects of Eurasian Snow Cover on winter Climate. J. Geophys. Res. 113, D21123. doi:10.1029/2008jd010623
Henderson, G. R., and Leathers, D. J. (2009). European Snow Cover Extent Variability and Associations with Atmospheric Forcings. Int. J. Climatol. 30, a–n. doi:10.1002/joc.1990
Henderson, G. R., Peings, Y., Furtado, J. C., and Kushner, P. J. (2018). Snow-atmosphere Coupling in the Northern Hemisphere. Nat. Clim Change 8, 954–963. doi:10.1038/s41558-018-0295-6
Hersbach, H., Bell, B., Berrisford, P., Hirahara, S., Horányi, A., Sabater, J. M., et al. (2020). The ERA5 Global Reanalysis. Q.J.R. Meteorol. Soc. 146, 1999–2049. doi:10.1002/qj.3803
Jeong, J.-H., Ou, T., Linderholm, H. W., Kim, B.-M., Kim, S.-J., Kug, J.-S., et al. (2011). Recent Recovery of the Siberian High Intensity. J. Geophys. Res. 116, a–n. doi:10.1029/2011jd015904
Jia, B., Wang, Y., Huang, S., Nan, Y., and Zhou, X. (2018). Variations of Siberian High Position under Climate Change: Impacts on winter Pollution over north China. Atmos. Environ. 189, 227–234. doi:10.1016/j.atmosenv.2018.06.045
Jiang, D., Hu, D., Tian, Z., and Lang, X. (2020). Differences between CMIP6 and CMIP5 Models in Simulating Climate over China and the East Asian Monsoon. Adv. Atmos. Sci. 37, 1102–1118. doi:10.1007/s00376-020-2034-y
Joung, C. H., and Hitchman, M. H. (1982). On the Role of Successive Downstream Development in East Asian Polar Air Outbreaks. Mon. Wea. Rev. 110, 1224–1237. doi:10.1175/1520-0493(1982)110<1224:otrosd>2.0.co;2
Kumar, P., and Sarthi, P. P. (2021). Intraseasonal Variability of Indian Summer Monsoon Rainfall in CMIP6 Models Simulation. Theor. Appl. Climatol 145, 687–702. doi:10.1007/s00704-021-03661-6
Lau, N.-C., and Holopainen, E. O. (1984). Transient Eddy Forcing of the Time-Mean Flow as Identified by Geopotential Tendencies. J. Atmos. Sci. 41, 313–328. doi:10.1175/1520-0469(1984)041<0313:tefott>2.0.co;2
Li, D., and Lan, L. (2017). Relationship between the Intensity of the Siberian High and the SST Anomaly in the North Atlantic. Trans. Atmos. Sci. 40, 13–24. doi:10.13878/j.cnki.dqkxxb.20151218001
Li, S. (2004). Impact of Northwest Atlantic SST Anomalies on the Circulation over the Ural Mountains during Early winter. J. Meteorol. Soc. Jpn. 82, 971–988. doi:10.2151/jmsj.2004.971
Liu, B., and Zhu, C. (2020). Diverse Impacts of the Siberian High on Surface Air Temperature in Northeast China during Boreal winter. Int. J. Climatol. 40, 594–603. doi:10.1002/joc.6199
Liu, X., Li, W., Wu, T., Li, T., Gu, W., Bo, Z., et al. (2019). Validity of Parameter Optimization in Improving MJO Simulation and Prediction Using the Sub-seasonal to Seasonal Forecast Model of Beijing Climate Center. Clim. Dyn. 52 (7–8), 3823–3843. doi:10.1007/s00382-018-4369-y
Liu, X., Yao, J., Wu, T., Zhang, S., Xu, F., Zhang, F., et al. (2021). Development of Coupled Data Assimilation with the BCC Climate System Model: Highlighting the Role of Sea-Ice Assimilation for Global Analysis. J. Adv. Model. Earth Syst. (James) 13, e2020MS002368. doi:10.1029/2020ms002368
Luo, X., and Wang, B. (2019). How Autumn Eurasian Snow Anomalies Affect East Asian winter Monsoon: a Numerical Study. Clim. Dyn. 52, 69–82. doi:10.1007/s00382-018-4138-y
Luojus, K., Pulliainen, J., Takala, M., Lemmetyinen, J., Mortimer, C., Derksen, C., et al. (2021). GlobSnow v3.0 Northern Hemisphere Snow Water Equivalent Dataset. Sci. Data 8, 163. doi:10.1038/s41597-021-00939-2
Mori, M., Watanabe, M., Shiogama, H., Inoue, J., and Kimoto, M. (2014). Robust Arctic Sea-Ice Influence on the Frequent Eurasian Cold winters in Past Decades. Nat. Geosci 7, 869–873. doi:10.1038/ngeo2277
Mu, S. N., and Zhou, G. Q. (2015). Mechanism for the Correlation of winter Fresh Snow Extent over Northern Eurasia and Summer Climate Anomalies in China: The Important Role of Eurasian winter Fresh Snow Extent (In Chinese). Chin. J. Atmos. Sci. 39, 169–191.
North, G., Bell, T., Cahalan, F., and Moeng, J. (1982). Sampling errors in the estimation of empirical orthogonal functions. Mon. Wea. Rev. 110, 699–706. doi:10.1175/1520-0493(1982)110<0699:SEITEO>2.0.CO;2
Orsolini, Y. J., and Kvamstø, N. G. (2009). Role of Eurasian Snow Cover in Wintertime Circulation: Decadal Simulations Forced with Satellite Observations. J. Geophys. Res. 114, D19108. doi:10.1029/2009jd012253
Panagiotopoulos, F., Shahgedanova, M., Hannachi, A., and Stephenson, D. B. (2005). Observed Trends and Teleconnections of the Siberian High: a Recently Declining center of Action. J. Clim. 18 (9), 1411–1422. doi:10.1175/jcli3352.1
Peings, Y., Saint-Martin, D. S., and Douville, H. (2012). A Numerical Sensitivity Study of the Influence of Siberian Snow on the Northern Annular Mode. J. Clim. 25, 592–607. doi:10.1175/jcli-d-11-00038.1
Saito, K., Cohen, J., and Entekhabi, D. (2001). Evolution of Atmospheric Response to Early-Season Eurasian Snow Cover Anomalies. Mon. Wea. Rev. 129, 2746–2760. doi:10.1175/1520-0493(2001)129<2746:eoarte>2.0.co;2
Sun, C., Yang, S., Li, W., Zhang, R., and Wu, R. (2016). Interannual Variations of the Dominant Modes of East Asian winter Monsoon and Possible Links to Arctic Sea Ice. Clim. Dyn. 47, 481–496. doi:10.1007/s00382-015-2851-3
Sun, C., Zhang, R., Li, W., Zhu, J., and Yang, S. (2019). Possible Impact of North Atlantic Warming on the Decadal Change in the Dominant Modes of winter Eurasian Snow Water Equivalent during 1979-2015. Clim. Dyn. 53, 5203–5213. doi:10.1007/s00382-019-04853-7
Takaya, K., and Nakamura, H. (2005b). Geographical Dependence of Upper-Level Blocking Formation Associated with Intraseasonal Amplification of the Siberian High. J. Atmos. Sci. 62, 4441–4449. doi:10.1175/jas3628.1
Takaya, K., and Nakamura, H. (2005a). Mechanisms of Intraseasonal Amplification of the Cold Siberian High. J. Atmos. Sci. 62, 4423–4440. doi:10.1175/jas3629.1
Wang, B., Wu, Z., Chang, C.-P., Liu, J., Li, J., and Zhou, T. (2010). Another Look at Interannual-To-Interdecadal Variations of the East Asian Winter Monsoon: The Northern and Southern Temperature Modes. J. Clim. 23, 1495–1512. doi:10.1175/2009jcli3243.1
Wang, L., Chen, W., Zhou, W., and Chan, J. C. L. (2010). Effect of the Climate Shift Around Mid-1970s on the Relationship between Wintertime Ural Blocking Circulation and East Asian Climate. Int. J. Climatology 30, 153–158. doi:10.1002/joc.1876
Wegmann, M., Orsolini, Y., Vázquez, M., Gimeno, L., Nieto, R., Bulygina, O., et al. (2015). Arctic Moisture Source for Eurasian Snow Cover Variations in Autumn. Environ. Res. Lett. 10, 054015. doi:10.1088/1748-9326/10/5/054015
Wu, B., Su, J., and Zhang, R. (2011a). Effects of Autumn-winter Arctic Sea Ice on winter Siberian High. Chin. Sci. Bull. 56, 3220–3228. doi:10.1007/s11434-011-4696-4
Wu, B., and Wang, J. (2002). Winter Arctic Oscillation, Siberian High and East Asian winter Monsoon. Geophys. Res. Lett. 29, 1–3. doi:10.1029/2002gl015373
Wu, B., Zhang, R., Arrigo, R., and Su, J. (2013). On the Relationship between Winter Sea Ice and Summer Atmospheric Circulation over Eurasia. J. Clim. 26, 5523–5536. doi:10.1175/JCLI-D-12-00524.1
Wu, M. C., and Chan, J. C. L. (1997). Upper-level Features Associated with winter Monsoon Surges over south China. Mon. Wea. Rev. 125, 317–340. doi:10.1175/1520-0493(1997)125<0317:ulfaww>2.0.co;2
Wu, Q., Hu, H., and Zhang, L. (2011b). Observed Influences of Autumn-Early winter Eurasian Snow Cover Anomalies on the Hemispheric PNA-like Variability in winter. J. Clim. 24, 2017–2023. doi:10.1175/2011jcli4236.1
Wu, T., Lu, Y., Fang, Y., Xin, X., Li, L., Li, W., et al. (2019). The Beijing Climate Center Climate System Model (BCC-CSM): the Main Progress from CMIP5 to CMIP6. Geosci. Model. Dev. 12, 1573–1600. doi:10.5194/gmd-12-1573-2019
Ye, K., and Lau, N.-C. (2016). Influences of Surface Air Temperature and Atmospheric Circulation on winter Snow Cover Variability over Europe. Int. J. Climatol. 37, 2606–2619. doi:10.1002/joc.4868
Ye, K., and Wu, R. (2017). Autumn Snow Cover Variability over Northern Eurasia and Roles of Atmospheric Circulation. Adv. Atmos. Sci. 34, 847–858. doi:10.1007/s00376-017-6287-z
Ye, K., Wu, R., and Liu, Y. (2015). Interdecadal Change of Eurasian Snow, Surface Temperature, and Atmospheric Circulation in the Late 1980s. J. Geophys. Res. Atmos. 120, 2738–2753. doi:10.1002/2015JD023148
Zhang, R., Zhang, R., and Zuo, Z. (2017). Impact of Eurasian spring Snow Decrement on East Asian Summer Precipitation. J. Clim. 30, 3421–3437. doi:10.1175/jcli-d-16-0214.1
Zhu, H. X., Chen, W., Feng, T., et al. (2019). Interannual Variations of Siberian High during Boreal winter and its Influence on East Asian Temperature. Plateau Meteorology 38 (4), 685–692.
Zhu, X., Liu, X., Huang, A., Zhou, Y., Wu, Y., and Fu, Z. (2021). Impact of the Observed SST Frequency in the Model Initialization on the BSISO Prediction. Clim. Dyn. 57, 1097–1117. doi:10.1007/s00382-021-05761-5
Keywords: Siberian high, diverse inter-annual variation, Eurasian snow, CMIP6, BCC-CSM2-MR coupled model
Citation: Sun C, Zuo J, Shi X, Liu X and Liu H (2021) Diverse Inter-Annual Variations of Winter Siberian High and Link With Eurasian Snow in Observation and BCC-CSM2-MR Coupled Model Simulation. Front. Earth Sci. 9:761311. doi: 10.3389/feart.2021.761311
Received: 19 August 2021; Accepted: 01 November 2021;
Published: 26 November 2021.
Edited by:
Renguang Wu, Zhejiang University, ChinaReviewed by:
Shangfeng Chen, Institute of Atmospheric Physics (CAS), ChinaCopyright © 2021 Sun, Zuo, Shi, Liu and Liu. This is an open-access article distributed under the terms of the Creative Commons Attribution License (CC BY). The use, distribution or reproduction in other forums is permitted, provided the original author(s) and the copyright owner(s) are credited and that the original publication in this journal is cited, in accordance with accepted academic practice. No use, distribution or reproduction is permitted which does not comply with these terms.
*Correspondence: Chenghu Sun, c3VuY2hAY21hLmdvdi5jbg==
Disclaimer: All claims expressed in this article are solely those of the authors and do not necessarily represent those of their affiliated organizations, or those of the publisher, the editors and the reviewers. Any product that may be evaluated in this article or claim that may be made by its manufacturer is not guaranteed or endorsed by the publisher.
Research integrity at Frontiers
Learn more about the work of our research integrity team to safeguard the quality of each article we publish.