 Shouxu Pan
 Ming Zha
- School of Geoscience, China University of Petroleum (East China), Qingdao, China
In order to examine the pore structure and reveal the fractal geometric nature of shales, a series of laboratory experiments were conducted on lacustrine shale samples cored from the Kongdian Formation. Based on the low temperature nitrogen adsorption, fluorescent thin section and field emission scanning electronic microscope, a comprehensive pore structure classification and evaluation were conducted on shale samples. Fractal dimensions D1 and D2 (with relative pressure of 0–0.45 and 0.45–1.00, respectively) were obtained from the nitrogen adsorption data using the fractal Frenkel-Halsey-Hill (FHH) method. With additional means of X-ray diffraction analysis, total organic carbon content analysis and thermal maturity analysis, the relationships between pore structure parameters, fractal dimensions, TOC content and mineral composition are presented and discussed in this paper. The results show that interparticle pores and microfractures are predominant, whereas organic matter pores are rarely found. The pore morphology is primarily featured with wide-open ends and slit-shaped structures. In terms of pore scale, mesopores and macropores are predominant. The value of fractal dimension D1 representing small pores ranges from 2.0173 to 2.4642 with an average of 2.1735. The value of D2 which represents large pores ranges from 2.3616 to 2.5981 with an average of 2.4960. These low numbers are an indication of few pore types and relatively low heterogeneity. In addition, smaller D1 values reveal that large pores have more complicated spatial structures than smaller ones. The results of correlation analysis show that: 1) D2 is correlated positively with specific surface area but negatively with average pore diameter; 2) D1 and D2 literally show no obvious relationship with mineral composition, TOC content or vitrinite reflectance (Ro); 3) both total Barrett-Joyner-Halenda (BJH) volume and specific surface area show a positive relationship with dolomite content and a negative relationship with felsic minerals content. These results demonstrate that the pore types are relatively few and dominated by mesopores, and the content of brittle minerals such as dolomite and felsic minerals control the pore structure development whilst organic matter and clay minerals have less influence due to low thermal maturity and abundance of clay minerals.
Introduction
In response to rising petroleum costs at the turn of the 21st century, the exploration and exploitation of shale gas and shale oil have become more and more important in China (Lu et al., 2018; Wang et al., 2019). Since 2010, shale gas mainly from marine in the south China has been investigated extensively including the basic geological characteristics (Zou et al., 2019), pore structure (Shang et al., 2020a; Shang et al., 2020b; Shang et al., 2020c; Liu et al., 2020), production controlling factors (Shang et al., 2019; Liu et al., 2021), etc., More recently, the shale oil from lacustrine basins in the north China has generally received significant attention (Lu et al., 2016; Zhao et al., 2018; Pu et al., 2019). However, the higher heterogeneity, lower thermal maturity, and limited geographical distributions of shale oil in China, pose greater challenges to a cost-effective development compared with marine shale oil reservoirs in North America (Ma et al., 2021).
Although the terms shale oil and tight oil are often used interchangeably in public discourse, shale formations are only a subset of all low permeability tight formations, which include sandstones and carbonates, as well as shales, as sources of tight oil production (Energy Information Administration, 2013). The restricted petrological definition of shale is fine-grained clastic sedimentary rock composed of mud and characterized by laminated structure, in field exploration, however, with the development and exploitation of shale oil and gas, it typically refers to any fine-grained sedimentary rock with total organic carbon (TOC) content greater than 1%, in a practical way.
The United States, home to the Bakken formation, Eagle Ford Formation and Barnett Formation, is the world’s hotspot of shale oil exploration (Montgomery et al., 2005; Jarvie et al., 2007; Bustin et al., 2008; Chalmers et al., 2012). As their success story unfolds, shale oil has become one of the most attractive unconventional sources all over the world. According to an EIA report released in 2013, the total reserves of technically recoverable shale oil in China is 320 × 108 bbl (about 43.84 × 10⁸t), which is the third largest in the world. Nevertheless, the shale oil in China is way more difficult to extract. For comparison, the shale oil in United States is primarily light oil generated from widely-distributed and organic-rich marine shales with high maturity and low heterogeneity; while the majority of shale oil in China is relatively heavy oil generated from sparsely distributed and organic-rich lacustrine shale with low maturity and high heterogeneity (Lu et al., 2016). In terms of lithology, the mineral composition of marine shale in the United States is dominated by biogenic quartz and carbonate, and the former consists of biogenic silica which is associated with organic matter enrichment. When it comes to the lacustrine shales in China, their mineral composition is dominated by clay followed by detrital quartz and chemical carbonate. Detrital quartz is terrestrial, resulted from mechanical transportation in most cases, and usually shows no signs of organic origin (Nie et al., 2016).
Although China has tremendous shale oil reserves, extraction remains a challenge. The shale oil development approach is rather different from the American paradigm. In my opinion, the biggest difference is deposition system. With higher thermal maturity to ensure that the shale oil is abundant and light with low viscosity, and with lower heterogeneity to ensure that the pattern of storage space for shale oil is more easily to be predicted, the pivot point of marine shale oil exploration is pore structure. Compared with marine shales, the lacustrine shales in China are featured with rapidly changeable sedimentary environment, relatively low maturity and limited thickness (Liu et al., 2015; Ma et al., 2021). High heterogeneity of lacustrine shale results in different rock properties, and therefore, the heterogeneous pore structure and its controlling factors need to be studied and understood.
Since the fractal theory was put forward by Mendelbrot (1982), it has been proven to be very useful to quantitatively describe the heterogeneity of naturally occurring geometries. Katz and Thompson (1985) supported the theory, confirming fractal characteristics in several sandstones. They calculated the fractal dimension using SEM and optical data and gave correct porosity prediction based on fractal analysis. Furthermore, the experiment results from Thompson (1991) revealed the significance of characterizing a sedimentary rock’s pore geometry with fractal dimensions. Apart from the verification of fractal geometry of porous media, three fractal dimension measurement approaches were generalized: 1) the discrete methods (Mandelbrot, 1982; Orford and Whally, 1983; Kartz and Thompson, 1985; Krohn and Thompson, 1986) that use rulers of different lengths to measure the fractal dimension of an object, just like the fractal measurement of coastline at the very beginning. 2) the scattering methods (Freltoft et al., 1986; Rojanski et al., 1986; Sinha et al., 1988; Hurd et al., 1989) that use small-angle X-ray or neutron scattering to study a wide range (length scale of 0.5–50 nm) of disordered systems; 3) the adsorption methods (Avnir et, al., 1983; Pfeifer and Avnir, 1984) that characterize the fractal geometry at the molecular scale.
Fractal theory has been applied for pore size classification and reservoir evaluation by using data from SEM imaging, nitrogen adsorption, mercury intrusion, and nuclear magnetic resonance to quantify the fractal characteristics and heterogeneity of shale reservoirs (Lai & Wang, 2015; Yang et al., 2016; Sun et al., 2017; Ma et al., 2021). We based our study on the Frenkel-Halsey-Hill (FHH) theory and more recent and commonly used Brunauer-Emmett-Teller (BET) surface area approach to obtain fractal dimension.
Several methods have been proposed to calculate the fractal dimensions from nitrogen adsorption experimental results. Among them, one empirical correlation, developed on the basis of Frenkel-Halsey-Hill model, has been testified and widely used by many researchers. The equation is shown below:
Where V is the absorbed gas volume under equilibrium pressure P; V0 is the absorbed volume of gas monomolecular layer; P0 is the gas saturation pressure; A is the power-law exponent obtained as the trending line slope in the lnV vs ln (ln (P0/P)) plot, having something to do with the fractal dimension D and adsorption mechanism.
Upon the onset of gas adsorption, the adsorption force is mainly Van de Waal’s force between solid and gas, and the relationship between fractal dimension D and slope A is:
In the equation, surface tension is not accounted for. But when the relative pressure increases, the surface tension effect between liquid and gas is no longer negligible, then the equation becomes:
According to Ismail and Pfeifer, (1994), when
In order to characterize pore size distribution (PSD) and total porosity of the porous media, a number of methodologies have been developed by previous researchers. The fluid invasion methods, including gas adsorption and high-pressure mercury intrusion (MICP), are widely used. In addition, nuclear magnetic resonance (NMR), micro-focus X-ray computed tomography (X-ray CT), SEM and TEM (transmission electron microscopy) are popular tools for pore structure characterization (Lu et al., 2016). Last but not least, low temperature nitrogen adsorption is known as an effective method to characterize pore structure on nanometer to micrometer scale.
The pores are classified into three types according to the standard put forward by IUPAC (International Union of Pure and Applied Chemistry) in 1985, micropores (<2 nm), mesopores (2–50 nm) and macropores (>2 nm). It is claimed that different shapes of hysteresis loops at 77.35 K are often identified with different pore structures.
In the nitrogen adsorption experiment, the nitrogen molecules attached to the pore surface are forced out under gas pressure. This occurs to both monolayers and multilayers (Sing, 2001). The gas molecules form a monolayer at zero initial relative gas pressure (P/P0 = 0) and start to fill the smallest pores. As pressure increases, they tend to fill increasingly larger pores until the entire multilayer is saturated towards the end of the adsorption process. Desorption is the reverse process of adsorption when pressure decreases, that is to say, desorption begins with the largest pores and ends with smallest ones. When the desorption process is complete, capillary condensation gives rise to the hysteresis loop (Figure 1).
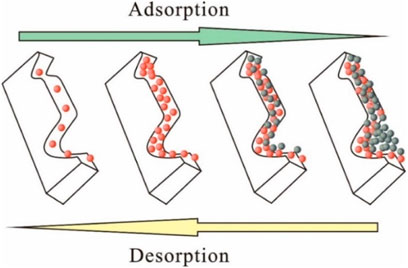
FIGURE 1. Schematic of nitrogen adsorption/desorption (Ma, 2016).
The plot of adsorbed volume vs relative pressure that represents both the nitrogen adsorption and desorption processes was used to distinguish different pore types in accordance with Sing’s classification that derived from De Boer’s classification of hysteresis loops (De Boer and Lippens, 1964; Sing et al., 2001). Four theoretical patterns (H1 through H4) of hysteresis loops (curve divergence) that correspond to four typical pore shapes (cylindrical, ink-bottle, slit, and wedge) are shown in Figure 2.
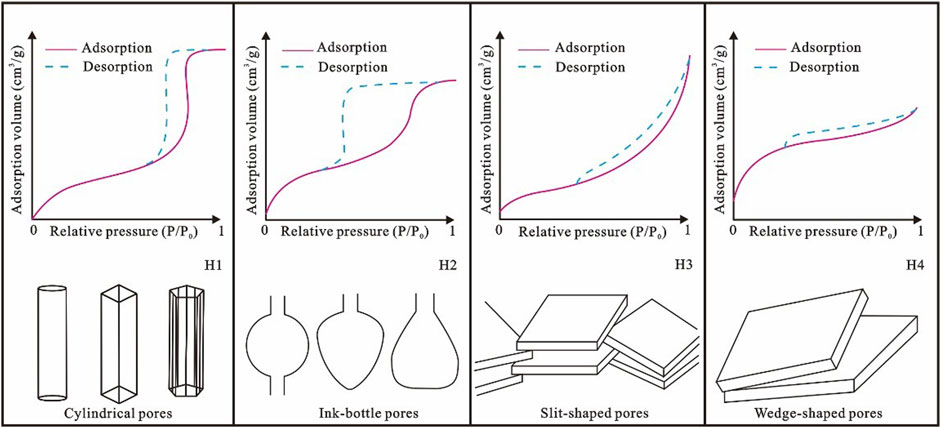
FIGURE 2. Four patterns of hysteresis loops and their corresponding pore shapes (modified from Sing et al., 1985).
Previous studies on the second member of Kongdian Formation focused mainly on geochemistry and hydrocarbon generation potential (Pu et al., 2016; Yang et al., 2018; Zhou et al., 2019; Xin et al., 2021), but not much was mentioned about pore structure especially on the nanoscale. Because of this, the characteristics of pore structure and heterogeneity of shales were poorly understood. In this paper, we used FE-SEM and low temperature nitrogen adsorption methods to characterize shale pore structure of the second member of Kongdian formation, and thereafter calculated fractal dimension based on the FHH theory. In the end, we discussed the fractal characteristics and their controlling factors of shale samples. Furthermore, we explored the relationships between fractal dimension, mineral constituents, and pore structure and the practical value of fractal dimensions.
Geological Setting
Cangdong sag is an intracontinental sub-depression unit of the Huanghua Depression bordered by Cangxian Uplift in the west, Xuhei Salient in the east and Kongdian Salient in the north (Figure 3). The second member of Kongdian Formation was deposited when Cangdong Sag was an enclosed inland lake basin. It’s fine-grained sediments are composed of dark mudstone, thin-medium bedded siltstone and argillaceous dolomite (Pu et al., 2016; Zhao et al., 2019; Zhou et al., 2019). Hydrocarbon discoveries in recent years and several good oil wells producing from the second member of Kongdian Formation in Cangdong sag indicate great shale oil potential.
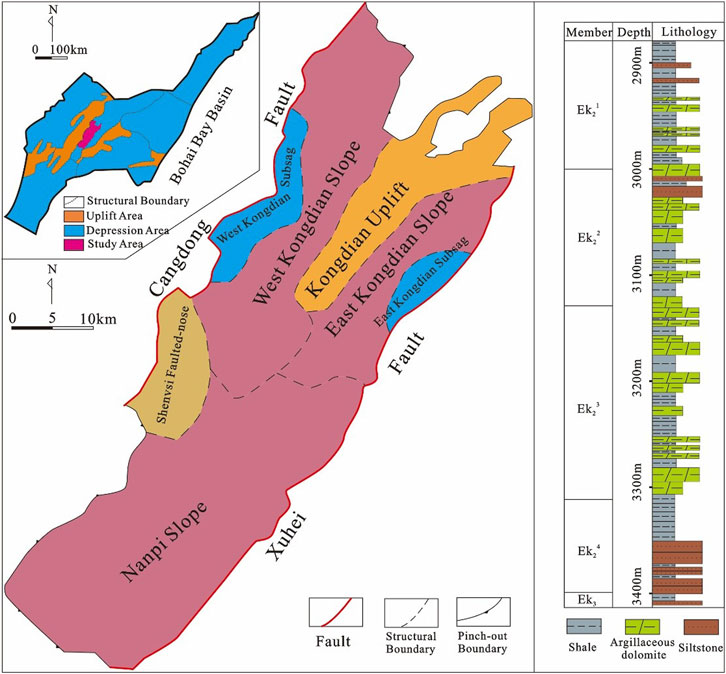
FIGURE 3. Map of the Cangdong Sag and lithology column of the second member of Kongdian Formation (Modified based on Zhao et al., 2018).
Material and Methods
Samples
10shale samples were selected from Well GX, Well GY and Well GZ. All the three wells are from the area with daily oil production ranging from 30t to 60t.
Experimental Approach
A series of laboratory tests were conducted on these samples, i.e., total organic carbon (TOC), vitrinite reflectance (Ro), XRD analysis, FE-SEM and low temperature nitrogen adsorption.
XRD, TOC, and Ro Analysis
Approximately 5 g of each shale sample was pulverized to 40–60 mesh and then mixed with ethanol. The mixture was hand ground and then coated on glass slides for XRD analysis. This preparation technique was meant for semi-quantitative estimation of mineral percentages. A Bruker AXS D8-Focus diffractometer with CuK α radiation (40 kV, 40 mA) and Ni filtering was used to collect XRD data. The relative mineral contents were estimated according to the major peaks of each mineral and the corrections of Lorentz and polarization (Chalmers and Bustin, 2008).
Next, approximately 30 mg of each sample were powderized to 80–200 mesh, decalcified with a 5% HCl solution, and then dried for 36 h in preparation for TOC analysis. A Leco CS-230 carbon and sulfur analyzer was used to determine the TOC content.
For Ro analysis, shale samples were cut into 5 × 5 × 1 mm slices and polished. The standby immersed oil and monochromatic light (wavelength of 546 nm) were also prepared. A Zeiss microscope and an MPV-I microphotometer were used to measure Ro. At least 10 measurements were taken for each sample.
FE-SEM Analysis
The high-magnification capacity of electron microscopy is straightforward and effective for direct observation of the sizes, shapes, and distribution of micro-nano pores. Secondary electron (SE) images of rough, broken shale surfaces provide high resolution textural information and allows for recognition and description of larger-scale features (Slatt and O’Brien., 2011). The shale samples were cut into approximately 10 mm × 10 mm×3 mm slices and then coated with Au to avoid electrostatic charging. FE-SEM analysis was conducted with a cold field emission scanning electron microscope (S4800, Hitachi, Japan) at the maximum magnification of 800 K. The element composition of the minerals was analyzed by an EDS spectrometer.
Nitrogen Adsorption Analysis
The shale samples were crushed to 40–60 mesh. Then the powdered samples were alternatively cleaned by methanol and toluene until the hot toluene in which the samples were immersed for 12 h became completely transparent. After this, the samples were dried at ambient temperature. 0.35–0.40 g of powdered samples were degassed in the vacuum at 10°C to remove any adsorbed moisture and volatiles. Subsequently, low temperature nitrogen adsorption tests were conducted using a Micromeritics Tristar II 3020 analyzer with a measurable aperture of 3.5–300 nm and a minimum detectable specific surface area of 0.01 m2/g. The specific pore surface area was calculated based on the Brunauer-Emmett-Teller (BET) theory (Brunauer et al., 1938), and pore volume was calculated using the Barrett-Joyner-Halenda (BJH) method (Barrett et al., 1951).
Results
Mineral Composition and Organic Geochemistry
The X-ray analysis results show that the shales in the study area have complexed mineral composition that includes quartz, albite, dolomite, carbonate, analcite and clay minerals, and none of these minerals is dominant. The average contents of felsic minerals (quartz and albite), carbonate minerals (dolomite), calcite, anacite and clay minerals are 43.59, 22.69, 14.71, 9.90 and 8.40%, respectively. In addition, there is a very minor content of pyrite associated with mirabilite and halite (Figure 4J), which appears to be round-shape under the optical microscope and bar-shaped under the electronic microscope (Figure 5C). The results show high contents of brittle minerals and low contents of clay minerals, representing mixed deposition of small lake basin.
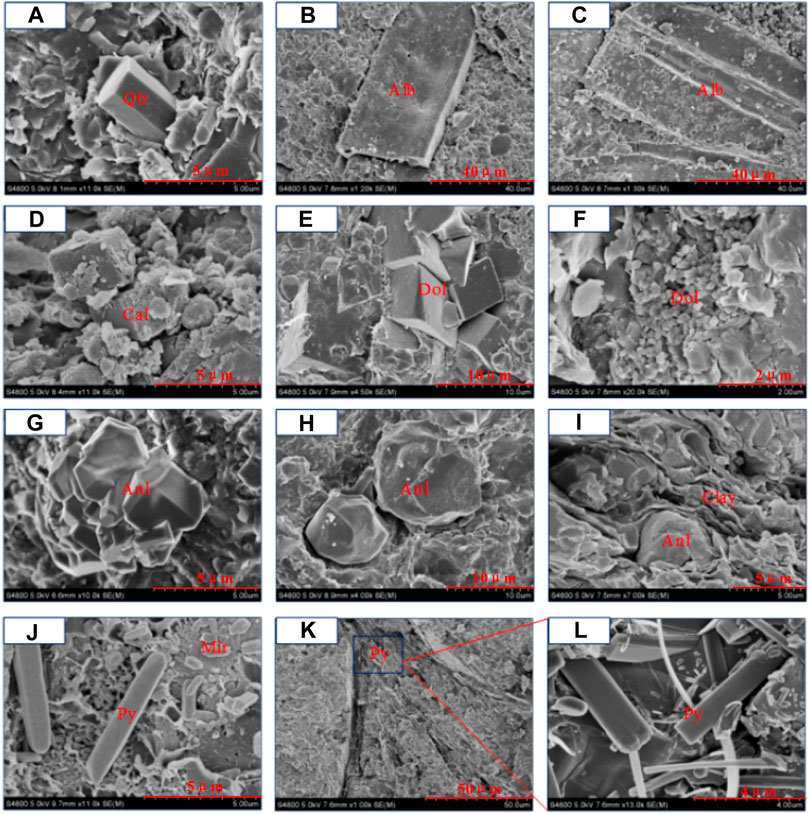
FIGURE 4. Morphology observed of major minerals in shale samples under FE-SEM.
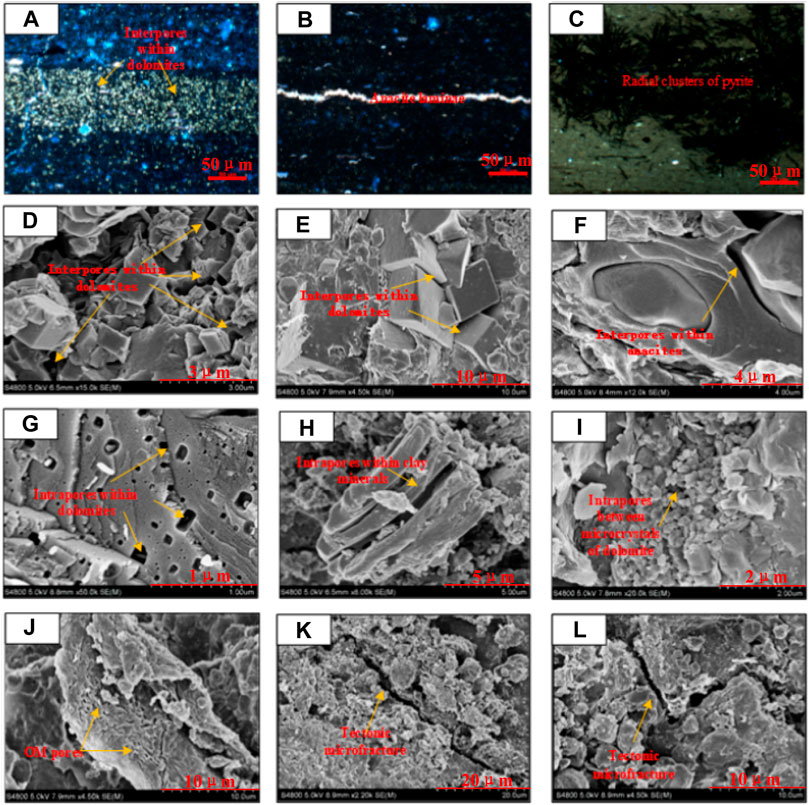
FIGURE 5. Types of pores and morphology of shale samples under FE-SEM.
The TOC contents of all shale samples range from 1.02 to 5.32% with an average value of 3.26%. The kerogen types are II1 and II2 according to the cross plot of Tmax (the temperature at which the second peak (S2 or HI) is observed during Rock-eval analysis) and Hydrogen index (HI) (Zhao et al., 2018). The Ro values are in the range of 0.67–1.05%. Considering the fact that Tmax is distributed primarily above 440°C, the low maturity shale samples from the study area are mostly in the oil window (Zhao et al., 2018).
a-authigenic quartz (well GX, 3,024.90m); b-albite grain (well GX, 3,141.57m); c-albite grain with eroded surface (well GX, 3,057.94m); d-eroded calcite crystal (well GX, 3,147.5m); e-authigenic dolomite (well GY, 3,885.27m); f-microcrystals of dolomite (well GY, 3,893.38m); g-clustered analcite (well GZ, 4,113.02m); h-monocrystal of analcite (well GZ, 4,113.02m); i-analcite crystal clamped by layered clay minerals (well GZ, 4,114.31m); j-bar-shaped monocrystal of pyrite along with mirabilite (well GZ, 4,119.15m); k-pyrite filling in the tectonic microfractures (well GZ, 4,124.60m); l-monocrystals of pyrite filling (an enlarged area of picture k).
Qtz-quartz; Alb-albite; Cal-calcite; Dol-dolomite; Anl-anacite; Clay-clay minerals; Py-pyrite; Mir-mirabilite.
Pore Structure
Pore Types and Morphology
According to FE-SEM studies, the pores in the study area are classified into four types: interparticle pores, intraparticle pores, organic matter pores and microfractures. Taking florescent thin section observation results into account, it can be concluded that interparticle pores between authigenic minerals, like dolomite and analcite, are the primary storage space for shale oil.
a-florescent thin section, abundant interpores in layered dolomite (well GX, 3,147.50m); b-florescent thin section, abundant interpores in layered analcite (well GX, 3,057.94m); c-florescent thin section, radial clusters of pyrite (well GY, 3,885.27m); d-scanning electronic microscope, irregular dissolution interpores between dolomites (well GX, 3,024.90m); e-scanning electronic microscope, slit-shaped interpores between dolomites (well GZ, 4,114.13m); f-scanning electronic microscope, strip-shaped interpores between analcites (well GZ, 4,113.02m); g-scanning electronic microscope, dissolution intrapores within dolomites (well GY, 3,885.27m); h-scanning electronic microscope, interlayered intrapores within clay minerals (well GX, 3,057.94m); i-scanning electronic microscope, intrapores between microcrystals of dolomite (well GZ, 4,124.60m); j-scanning electronic microscope, primary organic matter pores within bacteria and algae (well GX, 3,024.90m); k-scanning electronic microscope, tectonic microfracture with eroded plane (well GX, 3,141.57m); l-scanning electronic microscope, a zigzagged tectonic microfracture (well GY, 3,893.38m).
1) Interparticle pores.
Interparticle pores mainly refer to the residual space after sedimentation or diagenetic alteration (Ji et al., 2016), which are quite common in shallow-buried sediments (Loucks et al., 2012). Due to weak diagenetic alteration, low thermal maturity, and high content of brittle minerals found in the shale samples, the interparticle pores are believed to be abundant in the study area, probably having polygonal or slit-shaped apertures supported by rigid minerals like dolomite and analcite (Figure 5D, Figure 5E, Figure 5F). However, felsic minerals including quartz and albite are often mixed with clay minerals and organic matter because most of them derive from terrigenous detrital sediments, which leads to limited effective storage space for shale oil. It’s worthy to note that the dominant interparticle pores between dolomite crystals taking relatively regular shapes are well preserved and connected, forming an effective pore network. This can be clearly observed from florescent thin section observation.
2) Intraparticle pores.
The intraparticle pores are those within mineral particles or organic matter particles themselves. Some of them are primary pores in origin, but most of them are secondary pores formed in the diagenetic process. The intraparticle pores are primarily dissolution pores in the carbonate grains. They are usually irregularly-shaped with several to hundreds of nanometers in size and are disorderly distributed (Figure 5G). In addition, intracrystal pores in the microcrystalline dolomite as well as elongated pores between clay mineral interlayers (intergranular pores within flocculent illite and leaf-shaped chlorite) can also be found in the study area (Figure 5H, Figure 5I).
3) Organic matter pores.
Organic matter pores are intraparticle pores found within an organic matter, appearing as bubble-shaped, strip-shaped or oval space with irregularity. Two distinct kinds of organic matter pores have been identified: the primary organic matter pores linked to kerogen type which existed even before sedimentation, and the secondary pores caused by organic maturation and hydrocarbon expulsion (Curtis et al., 2012; Loucks et al., 2012; Reed et al., 2014). The organic matter pores are much less common, especially being compared with highly-mature marine shales in Paleozoic strata of south China. As bacteria and algae are the dominated source of organic matter (Yang et al., 2018) and shale maturity is low, so honeycomb pores, strip-shaped pores and bubble-like pores can be observed (Figure 5J).
4) Microfractures.
Microfractures mainly include tectonic fractures resulted from tectonic stress and shrinkage fractures caused by three possible phenomena, hydrocarbon expulsion from organic matter, dehydration of clay minerals and mineral recrystallization in the diagenetic process. In the study area, tectonic microfractures are regularly-shaped with smooth fracture plane, extensively distributed, well developed and usually filled with pyrite on micron to decimeter scale (Figure 5K, Figure 5L). This is because Cangdong Sag had experienced strong and continuous rifting in the early Paleogene when the shales were deposited (Chen et al., 2016; Luo et al., 2017). By contrast, shrinkage microfractures are less common due to low maturity level and low content of clay minerals found in shale samples. Tectonic microfractures are often well connected with other types of pores, forming complexed yet effective transport network, thus significantly improving the shale permeability.
Pore Size Distribution
It is found that shales in the study area mainly feature type H3 hysteresis loop. For most graphs recorded, the adsorption curve shows a slight ascent when relative pressure increases from 0 to around 0.1, inferring nominal presence of micropores. Between 0.1 to around 0.8, the adsorption curve rises marginally and almost linearly, indicating that narrow or slit-shaped pores account for the majority. The onset of a sharp bend occurs around 0.8, and beyond 0.9 the curve skyrockets to infinity, which means the pores have open ends. Desorption reserves the process, but leaving a gap between the adsorption curve owning to capillary condensation. In conclusion, the results of the nitrogen adsorption experiments demonstrate that in the study area aggregates of plate-like particles give rise to open-ended slit-shaped pores of shales.
The Brunauer-Emmett-Teller model was used to calculate the specific surface area of shale samples. Based on the Barret-Joyner-Halenda model, the adsorption curves are plotted in order to obtain the pore size distribution (Figure 6, 7).
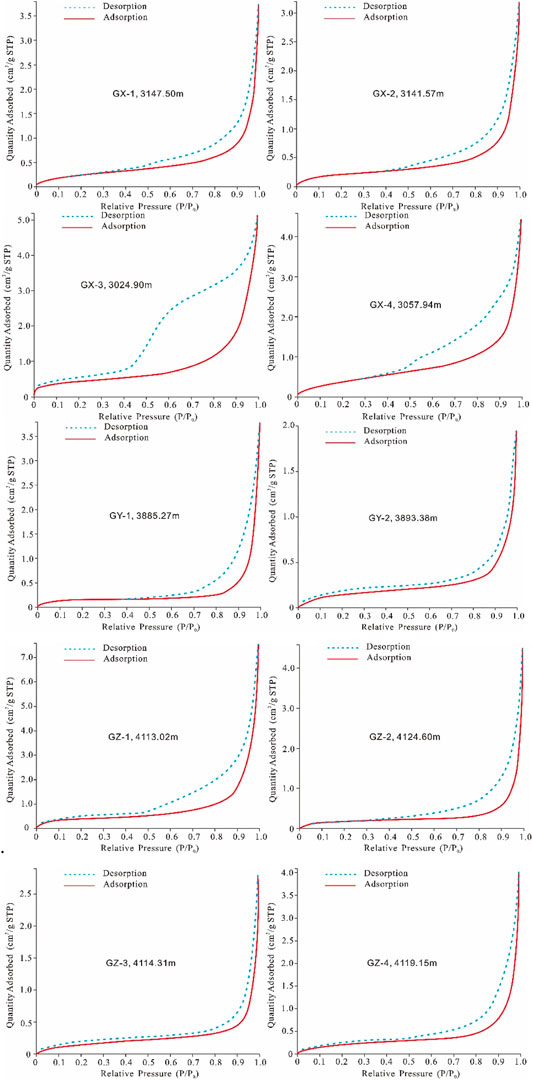
FIGURE 6. The N2 adsorption/desorption experiment results at low temperature (77 K) for the shale samples collected from the study area.
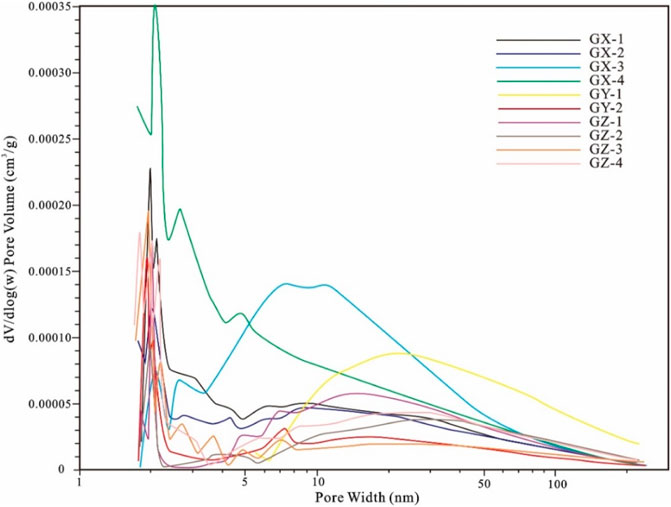
FIGURE 7. Pore size distribution plotted based on nitrogen adsorption experiment results of shale samples.
The specific surface area of shale samples is between 0.6128 m2/g and 1.4758 m2/g with an average value of 0.8748 m2/g. It is worthy of note that most values are below 1 m2/g, which is less common, especially for shales. On the basis of all experimental data and statistical analysis, micropores, mesopores and macropores account for 8.75, 77.92 and 13.33% of the total specific surface area, and 0.92, 46.69 and 50.69% of the total specific pore volume, respectively (Table 3). The pore sizes are mainly distributed in the range of 2–50 nm with three peaks observed at 2 nm, 5 and 25 nm (Figure 7).
Since micropores contribute the least to either the total specific pore surface area or volume (Table 1, Table 2, Table 3), it be can concluded that the shales in the study area are dominated by mesopores and macropores which are normally associated with organic matter and clay minerals.
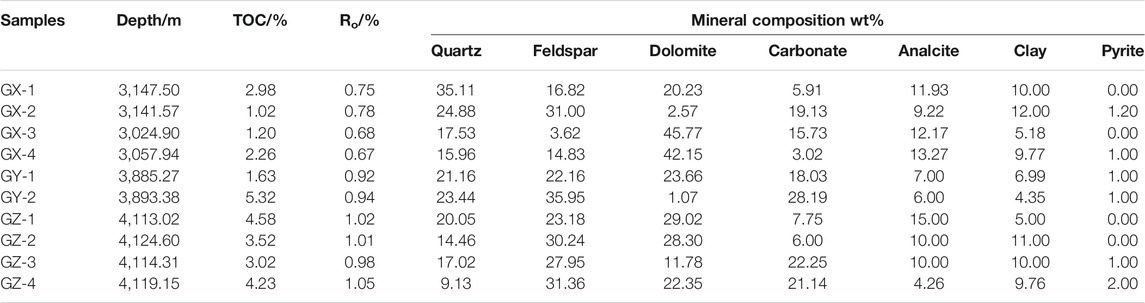
TABLE 1. Mineral composition and organic geochemistry for all shale samples.
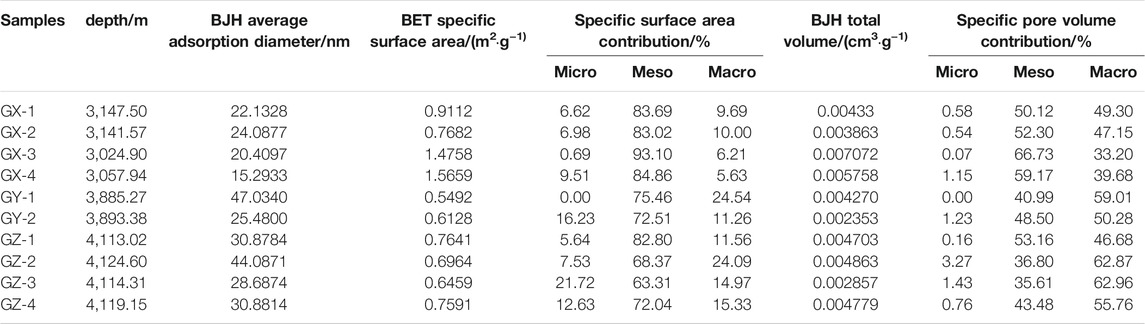
TABLE 2. Contribution of micropore, mesopore, and macropore to total pore specific surface area and volume of shale samples.
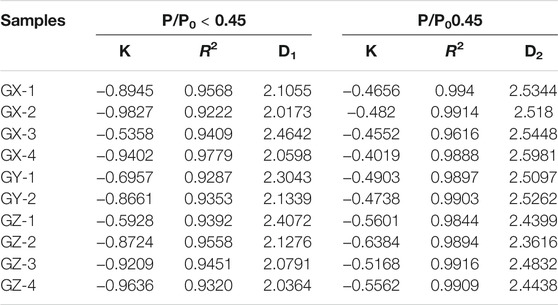
TABLE 3. Fractal dimensions obtained from N2 adsorption.
Regression analysis was carried out in order to find the relationships between different pore structure related parameters. From Figure 8–12 we can see that BET specific surface area correlates negatively with average pore diameter and positively with BJH total volume. Nevertheless, the data points of BJH total volume vs average pore are too scattered to be deemed relatable. The results indicate a narrow range of pore size where the mesopores are found to be the shale’s major reservoir space in the study area within the measuring range of nitrogen adsorption experiments.
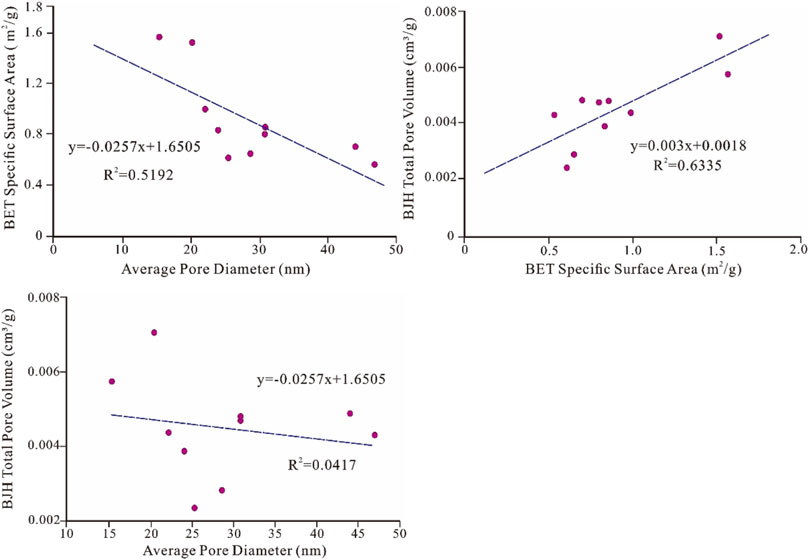
FIGURE 8. Scatter diagrams showing relationships between different pore structure parameters of all shale samples.
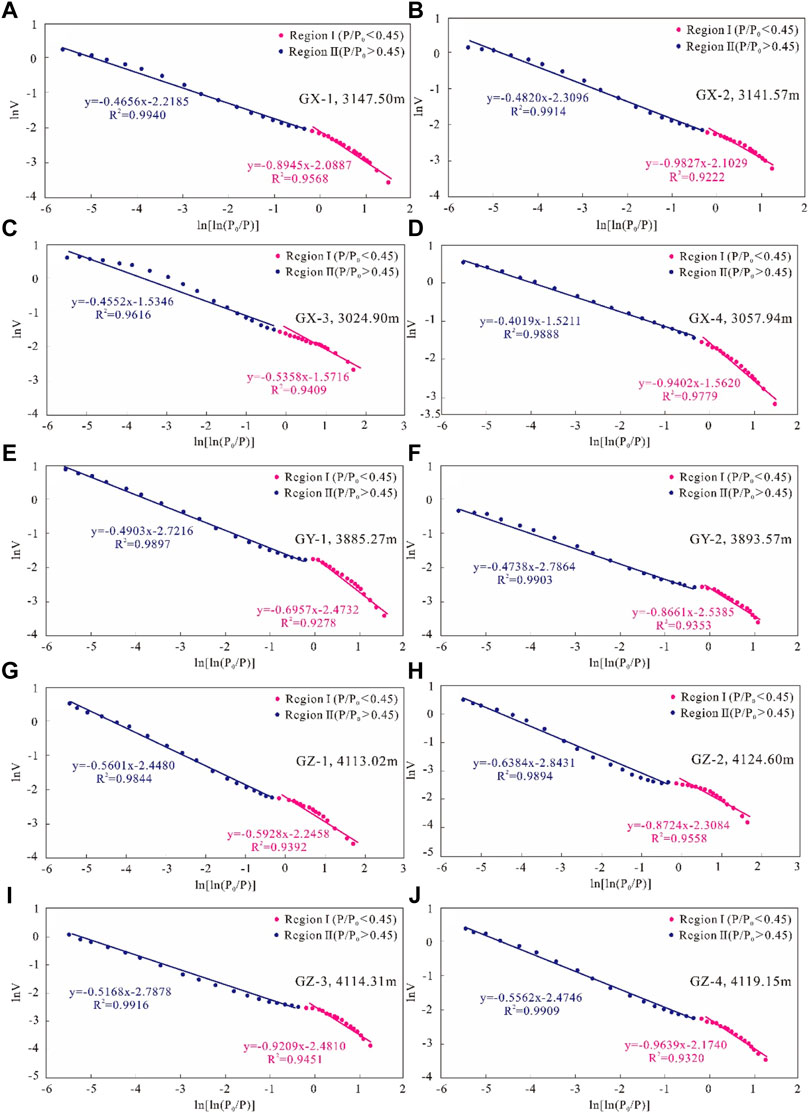
FIGURE 9. Plots of ln (lnP0/P) vs lnV for all 10 shale samples.
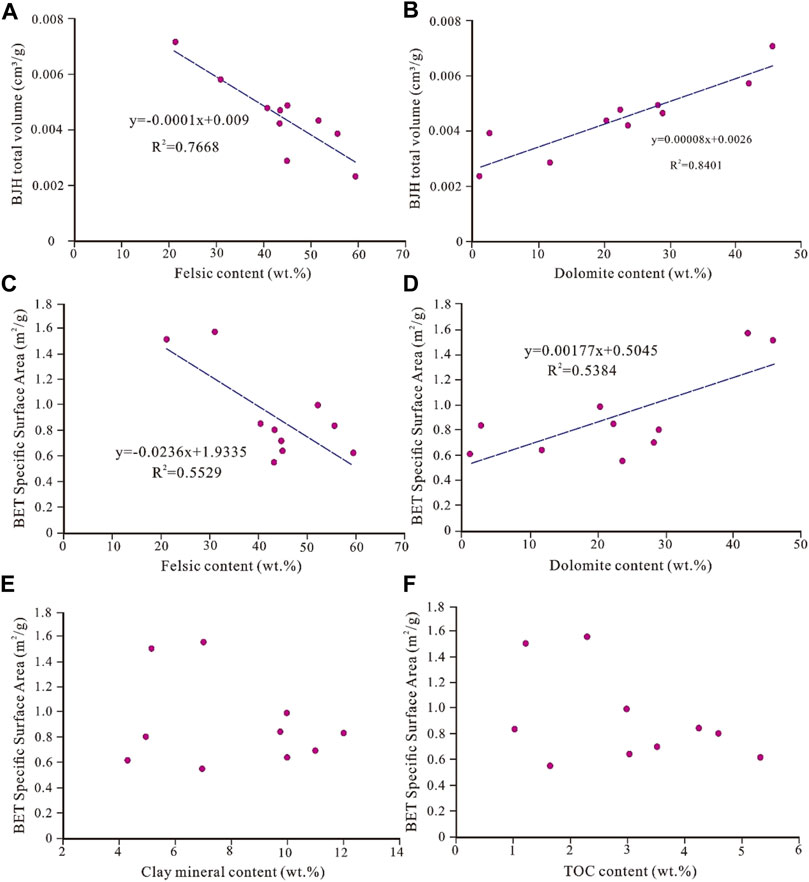
FIGURE 10. The scatter diagrams and extrapolated correlations for different pore structure parameters vs organic matter and mineral compositions.
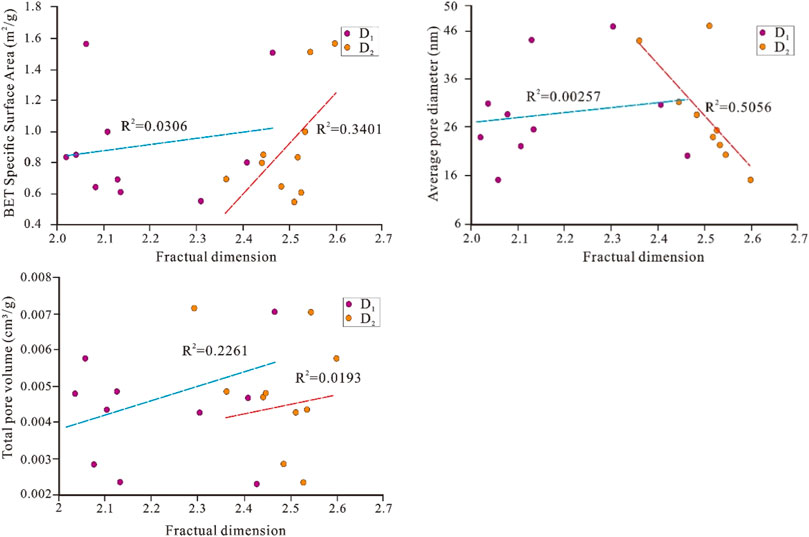
FIGURE 11. The scatter diagrams and correlations of fractal dimensions vs pore structure parameters.
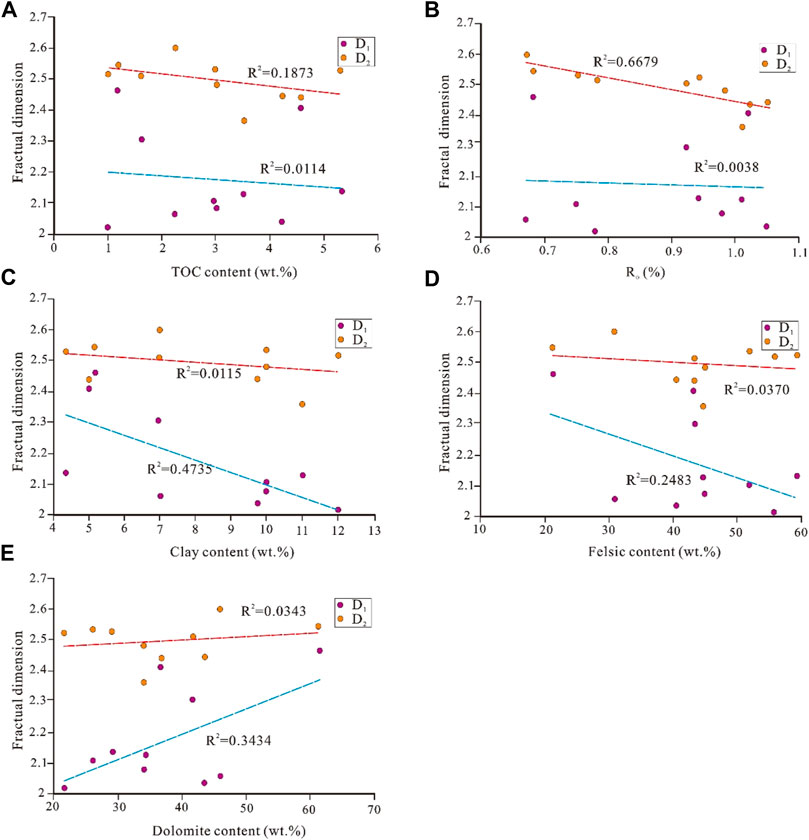
FIGURE 12. The scatter diagrams and correlations of fractal dimensions vs mineral compositions, TOC content, and Ro.
Fractal Analysis Based on Nitrogen Adsorption
The sedimentary rock structure is multi-fractal, hence different fractal dimension value represents different pore structure and physical property. In the adsorption/desorption curves shown in Figure 6, it can be clearly observed that hysteresis loop usually appears around 0.45 relative pressure when capillary condensation kicks in. This marks two distinctive pore structures that are existent in the rock samples. Therefore, D1 is calculated based on nitrogen adsorption data when the relative pressure is less than 0.45. This relates to the smaller pores like the micropores that mainly adsorb nitrogen in single or multi-molecules. While D2 is calculated in the same way except that the relative pressure is greater than 0.45. This represents the bigger pores like macropores and mesopores that mainly absorb nitrogen in multi-molecules due to capillary condensation.
The table above shows the fractal dimensions of 10 shale samples calculated based on the aforementioned model and equations. The almost perfect linear fit (all R2 are greater than 0.91 with an average value of 0.95) of lnV vs ln [ln (P0/P)] plot shows evident fractal feature of pore structure in the shales. D1 ranges from 2.0173 to 2.4642 with an average value of 2.1735, D2 ranges from 2.3616 to 2.5981 with an average value of 2.4960. Two things are worth noticing here. First, D1 values are smaller than D2 for all samples, reflecting that the bigger pores have more complexed structures than the smaller ones, which is very unusual for shales. Second, all D1 and D2 values are smaller than 2.6, inferring that pore types are not many.
The results of fractal analysis point to an unusual conclusion that the bigger pores have more complicated structures than the smaller ones. The underlying reasons could be that the micropores associated with organic matter and clay minerals are poorly developed with few types because of low maturity and low clay content of shales in the study area. By contrast, the macropores and mesopores like interparticle pores and microfractures develop attributed to high content and various types of brittle minerals, therefore they feature higher heterogeneity than the smaller pores.
Discussion
A lot of research work on pore structure and their controlling factors of terrestrial and marine shales in China has been done to date (Yang et al., 2016; Chen Q. et al., 2016; Peng et al., 2017). For the high maturity marine shales in South China, the mineral composition is dominated by quartz and clay minerals (Zou et al., 2019). Their pore types and abundances are primarily controlled by the types and contents of organic matter and clay minerals. The well-developed micropores in the organic matter and clay minerals, various pore types and a broad range of pore size distribution together lead to high shale heterogeneity, giving rise to high values of fractal dimensions D1 and D2 (Chen et al., 2016; Yang et al., 2016; Peng et al., 2017; Li et al., 2016).
The relationship between organic matter, mineral composition, pore structure parameters and fractal dimensions are discussed hereinafter to ascertain the controlling factors in pore structure development, paving the way for prospecting local shale plays with more confidence.
Relationship Between Pore Structure Parameters and Organic Matter and Mineral Compositions
Regression analyses for pore structure parameters (BET specific surface area, BJH total volume and the average pore diameter) versus TOC content, Ro, brittle minerals content and clay minerals content are carried out as follows.
The results above show that the total volume and specific surface area are correlated positively with dolomite content but negatively with felsic minerals content. In addition, no pronounced correlation is found between pore structure parameters and TOC, Ro, or clay minerals. The results indicate that the volume and surface area of shales in the study area are mainly controlled by brittle minerals, and the influence of organic matter and clay minerals on pore structure is weak. Probable explanations are that the brittle minerals, such as authigenic dolomite, provide considerable pore space for shale oil, whereas terrestrial clastic materials like quartz and albite are typically mixed with pore-plugging clay and organic matter, thus unable to provide effective storage space for shale oil.
Relationship Between Fractal Dimensions and Pore Structure Parameters
The fractal dimensions (D1 and D2) are correlated with different pore structure parameters (BET specific surface area, BJH total volume and the average pore diameter) as below.
The results show that D1 correlates poorly with surface area, average pore diameter and BJH pore volume, meanwhile D2 has a positive correlation with specific surface area and a negative correlation with average pore diameter. This bears two implications: 1) the pore structure is irregular and complex. The micropores mainly are constructed by different brittle minerals with different types of rigid edges. From the view of section, we can find that the storage space formed by straight lines of dolomites and calcites, round lines of analcite, and zigzag lines of felsic minerals (Figure 5D, Figure 5E, Figure 5F). Different brittle minerals crossing already make it look like a pile of tree branches and leaves stacking together. The rest clay minerals and organic matter will increase the irregularity and complexity even more.; 2) this complexity is linked to the bigger pores (pore size>4.5 nm). Micropores contribute less to surface area and are less complexed than mesopores due to the low thermal maturity and low content of clay minerals. If we take the particle size of shale oil and the thickness of bond water into consideration (Lu et al., 2018), 10 nm should be the minimum storage diameter for shale oil. And in this particular area, combining with the pore size distribution, the pores with diameter greater than 20 nm should be the main storage place for shale oil.
Relationship Between Fractal Dimensions and TOC Content, Ro, and Mineral Compositions
The fractal dimensions (D1 and D2) are correlated with mineral compositions, TOC content, and Ro as below.
It is obvious that none of the correlations above are deemed a good fit. This infers that the heterogeneous pore structure in the study area finds no single cause. But there is still some noteworthy abnormality. For example, the negative correlation between D2 and Ro may be related to dolomite recrystallization during hydrocarbon generation (Pu et al., 2019). Further, in the dissolution and crystallization process of micrite carbonate, impurities such as clay and fluid inclusions are discharged, leaving more pure dolomite crystals in place, giving rise to low heterogeneity and hence low D2. Last but not least, the unusual negative correlation between D1 and clay content would entail further research.
The dominant controlling factor on pore structure is brittle minerals which include quartz, albite, dolomite, calcite and analcite. The formation of the ultimate pore structure is a long and complicated process, involving the mixture of terrestrial clastic materials and the transformation of authigenic minerals. That explains why there is not a single brittle mineral showing good correlate with fractal dimensions.
In conclusion, because the low maturity and low content of clay minerals in shales has little to do with the complexity of pore structure, fractal dimensions are irrelevant with Ro, TOC and clay minerals.
Conclusion
1) The low thermal maturity, low content of clay minerals and high content of brittle minerals together shape the unique pore structure characteristics of shales in the Cangdong Sag. The pore type is primarily interparticle pores caused by authigenic brittle minerals and microfractures. The organic matter pores (macropores, mesopores, and few micropores) only account for a small portion; the pore sizes are mainly distributed in the range of 2–50 nm with three peaks, 2, 5 and 25 nm. So it is fair to claim that there is a limited number of pore types.
2) D1 values that represent the fractal dimension of smaller pores are smaller than D2 meant for bigger pores. Furthermore, both D1 and D2 values are low compared with typical marine shales, demonstrating that mesopores and macropores are much more complicated than micropores in structure.
3) As the shale reservoirs are mainly contributed by brittle minerals, which means that mesopores, macropores and microfractures are the majority of storage space for shale oil. The most favorable pore types are interparticle pores and microfractures in terms of practical development.
In conclusion, the interparticle pores and intraparticle pores that are associated with a variety of brittle minerals lead to complex structures of mesopores and macropores, and the low abundance of micropores is attributed to low thermal maturity and low content of clay minerals. Because of the obvious difference in fractal dimension values between bigger pores and smaller pores, the most favorable sweet spot of shale oil reservoirs should be interparticle pores with higher fractal dimensions and larger than 20 nm in diameter and microfractures.
Data Availability Statement
The original contributions presented in the study are included in the article/Supplementary Material, further inquiries can be directed to the corresponding author.
Author Contributions
SP: conceptualization, methodology, investigation, and writing. MZ: resources and writing. CG: validation and methodology. JQ: drawing of figures, data analysis, and references. XD: drawing of figures, data analysis, and references. All authors contributed to the article and approved the submitted version.
Funding
This research is supported by China National Key Science and Technology Special Projects (2016ZX05006; 2017ZX05001) and National Natural Science Foundation of China (Grant No. D0207).
Conflict of Interest
The authors declare that the research was conducted in the absence of any commercial or financial relationships that could be construed as a potential conflict of interest.
Publisher’s Note
All claims expressed in this article are solely those of the authors and do not necessarily represent those of their affiliated organizations, or those of the publisher, the editors and the reviewers. Any product that may be evaluated in this article, or claim that may be made by its manufacturer, is not guaranteed or endorsed by the publisher.
Acknowledgments
We would like to thank Dagang Petroleum Administration Bureau of CNPC for providing the core samples.
References
Avnir, D., Farin, D., and Pfeifer, P. (1983). Chemistry in noninteger dimensions between two and three. II. Fractal surfaces of adsorbents. J. Chem. Phys. 79, 3566–3571. doi:10.1063/1.446211
Barrett, E. P., Joyner, L. G., and Halenda, P. P. (1951). The Determination of Pore Volume and Area Distributions in Porous Substances. I. Computations from Nitrogen Isotherms. J. Am. Chem. Soc. 73, 373–380. doi:10.1021/ja01145a126
Brunauer, S., Emmett, P. H., and Teller, E. (1938). Adsorption of gases in multimolecular layers. J. Am. Chem. Soc. 60, 309–319. doi:10.1021/ja01269a023
Bustin, R. M., Bustin, A. M. M., Cui, X., Ross, D. J. K., and Murthy, P. V. S. (2008). “Impact of shale properties on pore structure and storage characteristics,” in SPE Conference (Texas: Fort Worth), 119892. doi:10.2118/119892-ms
Chalmers, G. R., Bustin, R. M., and Power, I. M. (2012). Characterization of gas shale pore systems by porosimetry, pycnometry, surface area, and field emission scanning electron microscopy/transmission electron microscopy image analyses: Examples from the Barnett, Woodford, Haynesville, Marcellus, and Doig units. Bulletin 96, 1099–1119. doi:10.1306/10171111052
Chalmers, G. R. L., and Bustin, R. M. (2008). Lower Cretaceous gas shales in northeastern British Columbia, Part I: geological controls on methane sorption capacity. Bull. Can. Pet. Geology. 56, 1–21. doi:10.2113/gscpgbull.56.1.1
Chen, Q., Zhang, J., Tang, X., Dang, W., Li, Z., Liu, C., et al. (2016). Pore structure characterization of the lower permian marine-continental transitional black shale in the southern north china basin, central china. Energy Fuels 30, 10092–10105. doi:10.1021/acs.energyfuels.6b01475
Chen, S. Y., Gong, W. L., Zhang, S., Pu, X. G., Ma, H. K., Shi, Z. N., et al. (2016). Fracture Characteristics and Main Controlling Factors of Shales of the Second Member of Kongdian Formation in Cangdong Sag Huanghua Depression. Geoscience 1, 144–154. (in Chinese with English abstract).
Curtis, M. E., Cardott, B. J., Sondergeld, C. H., and Rai, C. S. (2012). Development of organic porosity in the Woodford Shale with increasing thermal maturity. Int. J. Coal Geology. 103, 26–31. doi:10.1016/j.coal.2012.08.004
Deboer, J., and Lippens, B. (1964). Studies on pore systems in catalysts II. The shapes of pores in aluminum oxide systems. J. Catal. 3, 38–43. doi:10.1016/0021-9517(64)90090-9
Energy Information Administration (2013). in Shale Formations in 41 Countries outside the United States) (Washington, D.C.: U.S. Department of Energy), 730.World Shale Gas and Shale Oil Resource Assessment (Technically Recoverable Shale Oil and Shale Gas Resources: An Assessment of 137
Freltoft, T., Kjems, J. K., and Sinha, S. K. (1986). Power-law correlations and finite-size effects in silica particle aggregates studied by small-angle neutron scattering. Phys. Rev. B 33, 269–275. doi:10.1103/physrevb.33.269
Hurd, A. J., Schaefer, D. W., Smith, D. M., Ross, S. B., Le Méhauté, A., and Spooner, S. (1989). Surface areas of fractally rough particles studied by scattering. Phys. Rev. B 39, 9742–9745. doi:10.1103/physrevb.39.9742
Ismail, I. M. K., and Pfeifer, P. (1994). Fractal Analysis and Surface Roughness of Nonporous Carbon Fibers and Carbon Blacks. Langmuir 10, 1532–1538. doi:10.1021/la00017a035
Jarvie, D. M., Hill, R. J., Ruble, T. E., Pollastro, R. M., and Pollastro, M. (2007). Unconventional shale-gas systems: The Mississippian Barnett Shale of north-central Texas as one model for thermogenic shale-gas assessment. Bulletin 91, 475–499. doi:10.1306/12190606068
Ji, W. M., Song, Y., Jiang, Z. X., Chen, L., Wang, P. F., Liu, Q. X., et al. (2016). Micro-nano pore structure characteristics and its control factors of shale in Longmaxi Formation, southeastern Sichuan Basin. Acta Petrolei Sinica 37, 182–195. (in Chinese with English abstract).
Katz, A. J., and Thompson, A. H. (1985). Fractal Sandstone Pores: Implications for Conductivity and Pore Formation. Phys. Rev. Lett. 54, 1325–1328. doi:10.1103/physrevlett.54.1325
Krohn, C. E., and Thompson, A. H. (1986). Fractal sandstone pores: Automated measurements using scanning-electron-microscope images. Phys. Rev. B 33, 6366–6374. doi:10.1103/physrevb.33.6366
Lai, J., and Wang, G. (2015). Fractal analysis of tight gas sandstones using high-pressure mercury intrusion techniques. J. Nat. Gas Sci. Eng. 24, 185–196. doi:10.1016/j.jngse.2015.03.027
Li, A., Ding, W., He, J., Dai, P., Yin, S., and Xie, F. (2016). Investigation of pore structure and fractal characteristics of organic-rich shale reservoirs: A case study of Lower Cambrian Qiongzhusi formation in Malong block of eastern Yunnan Province, South China. Mar. Pet. Geology. 70, 46–57. doi:10.1016/j.marpetgeo.2015.11.004
Liu, B., Lv, Y. F., Meng, Y. L., Li, X. N., Guo, X. B., Ma, Q., et al. (2015). Petrologic characteristics and genetic model of lacustrine lamellar fine-grained rock and its significance for shale oil exploration: A case study of Permian Lucaogou Formation in Malang sag, Santanghu Basin, NW China. Petroleum. Exploration Dev. 42, 598–606. (in Chinese with English abstract). doi:10.1016/s1876-3804(15)30060-4
Liu, R., Jiang, D., Zheng, J., Hao, F., Jing, C., Liu, H., et al. (2021). Stress heterogeneity in the Changning shale-gas field, southern Sichuan Basin: Implications for a hydraulic fracturing strategy. Mar. Pet. Geology., 105218. doi:10.1016/j.marpetgeo.2021.105218
Liu, R., Zheng, J., Hao, F., Nie, Z., Heng, D., Tan, X., et al. (2020). Variation in pore systems with tectonic stress in the overthrust Wufeng-Longmaxi shale of the southern Sichuan Basin, China. J. Nat. Gas Sci. Eng. 83, 103617. doi:10.1016/j.jngse.2020.103617
Loucks, R. G., Reed, R. M., Ruppel, S. C., and Hammes, U. (2012). Spectrum of pore types and networks in mudrocks and a descriptive classification for matrix-related mudrock pores. Bulletin 96, 1071–1098. doi:10.1306/08171111061
Lu, S. F., Xue, H. T., Wang, M., Xiao, D. S., Huang, W. B., Li, J. Q., et al. (2016). Several key issues and research trends in evaluation of shale oil. Acta Petrolei Sinica 37, 1309–1322. (in Chinese with English abstract).
Lu, S., Li, J., Zhang, P., Xue, H., Wang, G., Zhang, J., et al. (2018). Classification of microscopic pore-throats and the grading evaluation on shale oil reservoirs. Pet. Exploration Dev. 45, 452–460. (in Chinese with English abstract). doi:10.1016/s1876-3804(18)30050-8
Luo, L., Qi, J., Li, H., DongDong, Y., Zhang, S., Zhang, X., et al. (2017). Geometry and Evolution of the Cangdong Sag in the Bohai Bay Basin, China: Implications for Subduction of the Pacific Plate. Sci. Rep. 7, 15393. doi:10.1038/s41598-017-15759-x
Ma, B., Hu, Q., Yang, S., Zhang, T., Qiao, H., Meng, M., et al. (2021). Pore structure typing and fractal characteristics of lacustrine shale from Kongdian Formation in East China. J. Nat. Gas Sci. Eng. 85, 103709. doi:10.1016/j.jngse.2020.103709
Ma, L. (2016). Multi-scale 3D imaging of the microstructure in organic-Rich shales. Manchester: University of Manchester.
Montgomery, S. L., Jarvie, D. M., Bowker, K. A., and Pollastro, R. M. (2005). Mississippian Barnett Shale, Fort Worth basin, north-central Texas: Gas-shale play with multi-trillion cubic foot potential. Bulletin 89, 155–175. doi:10.1306/09170404042
Nie, H. K., Zhang, P. X., Bian, R. K., Wu, X. L., and Zhai, C. B. (20162016). Oil accumulation characteristics of China continental shale. Earth Sci. Front. 23, 055–062. (in Chinese with English abstract).
Orford, J. D., and Whalley, W. B. (1983). The use of the fractal dimension to quantify the morphology of irregular-shaped particles. Sedimentology 30, 655–668. doi:10.1111/j.1365-3091.1983.tb00700.x
Peng, N. J., He, S., Hao, F., He, X. P., Zhang, P. X., Zhai, G. Y., et al. (2017). The Pore Structure and Difference between Wufeng and Longmaxi Shales in Pengshui Area, Southeastern Sichuan. Earth Sci. 42, 1134–1146. (in Chinese with English abstract).
Pfeifer, P., and Avnir, D. (1984). Chemistry nonintegral dimensions between two and three. J. Chem. Phys. 79, 3369–3558.
Pu, X. G., Shi, Z. N., Han, W. Z., Peng, X. M., Zhang, W., and Zhu, B. X. (2019). Petroleum geological characteristics and hydrocarbon discovery of shale system in fine-grained sedimentary area of lacustrine basin—A case study of Kong2 member in Cangdong Sag, Huanghua Depression. Pet. Geology. Recovery Efficiency 26, 50–62. (in Chinese with English abstract).
Pu, X., Zhou, L., Han, W., Zhou, J., Wang, W., Zhang, W., et al. (2016). Geologic features of fine-grained facies sedimentation and tight oil exploration: A case from the second Member of Paleogene Kongdian Formation of Cangdong sag, Bohai Bay Basin. Pet. Exploration Dev. 43, 26–35. (in Chinese with English abstract). doi:10.1016/s1876-3804(16)30003-9
Pure and Applied Chemistry (1985). Commission on colloid and surface chemistry including catalysis. Pure Appl. Chem. 57, 603–619.
Reed, R. M., Loucks, R. G., and Ruppel, S. C. (20142012). Comment on "Formation of nanoporous pyrobitumen residues during maturation of the Barnett Shale (Fort Worth Basin)" by Bernard et al. (2012). Int. J. Coal Geology. 127, 111–113. doi:10.1016/j.coal.2013.11.012
Rojanski, D., Huppert, D., Bale, H. D., Dacai, X., Schmidt, P. W., Farin, D., et al. (1986). Integrated fractal analysis of silica: adsorption, electronic energy transfer, and small-angle X-ray scattering. Phys. Rev. Lett. 56, 2505–2508. doi:10.1103/physrevlett.56.2505
Shang, X., Gou, Q. Y., Hao, F., Zhang, B. Q., Shu, Z. G., Lu, Y. B., et al. (2020a). Shale pore structure characteristics of the high and low productivity wells, Jiaoshiba shale gas field, Sichuan Basin, China: Dominated by lithofacies or preservation condition. Mar. Pet. Geology. 114, 104211.
Shang, X., Gou, Q. Y., Hao, F., Zhang, B. Q., Shu, Z. G., and Zhang, Y. Y. (2020b). Multiscale faults and fractures characterization and their effects on shale gas accumulation in the Jiaoshiba area, Sichuan Basin, China. J. Pet. Sci. Eng. 189, 107026.
Shang, X., Hao, F., Shu, Z. G., Zhang, A. H., and Yang, F. (2020c). Pore structures of different types of shales and shale gas exploration of the Ordovician Wufeng and Silurian Longmaxi successions in the eastern Sichuan Basin, South China. J. Asian Earth Sci. 193, 104271.
Shang, X., Liu, R., Hao, F., Terry, E., Yi, J. Z., Zhang, B. Q., et al. (2019). Complex rotation of maximum horizontal stress in the Wufeng-Longmaxi Shale on the eastern margin of the Sichuan Basin, China: Implications for predicting natural fractures. Mar. Pet. Geology. 109, 519–529.
Sing, K. (2001). The use of nitrogen adsorption for the characterisation of porous materials. Colloids Surf. A: Physicochemical Eng. Aspects 187-188, 3–9. doi:10.1016/s0927-7757(01)00612-4
Sinha, S. K., Sirota, E. B., Garoff, S., and Stanley, H. B. (1988). X-ray and neutron scattering from rough surfaces. Phys. Rev. B 38, 2297–2311. doi:10.1103/physrevb.38.2297
Slatt, R. M., and O'Brien, N. R. (2011). Pore types in the Barnett and Woodford gas shales: Contribution to understanding gas storage and migration pathways in fine-grained rocks. Bulletin 95, 2017–2030. doi:10.1306/03301110145
Sun, M., Yu, B., Hu, Q., Zhang, Y., Li, B., Yang, R., et al. (2017). Pore characteristics of Longmaxi shale gas reservoir in the Northwest of Guizhou, China: Investigations using small-angle neutron scattering (SANS), helium pycnometry, and gas sorption isotherm. Int. J. Coal Geology. 171, 61–68. doi:10.1016/j.coal.2016.12.004
Thompson, A. H. (1991). Fractals in Rock Physics. Annu. Rev. Earth Planet. Sci. 19, 237–262. doi:10.1146/annurev.ea.19.050191.001321
Wang, M., Ma, R., Li, J., Lu, S., Li, C., Guo, Z., et al. (2019). Occurrence mechanism of lacustrine shale oil in the Paleogene Shahejie formation of Jiyang depression, Bohai bay basin, China. Pet. Exploration Dev. 46, 833–846. (in Chinese with English abstract). doi:10.1016/s1876-3804(19)60242-9
Xin, B., Hao, F., Han, W., Xu, Q., Zhang, B., and Tian, J. (2021). Paleoenvironment evolution of the lacustrine organic-rich shales in the second member of Kongdian Formation of Cangdong Sag, Bohai Bay Basin, China: Implications for organic matter accumulation. Mar. Pet. Geology. 133, 105244. doi:10.1016/j.marpetgeo.2021.105244
Yang, C., Zhang, J. C., Tang, X., Ding, J. H., Zhao, Q. R., Dang, W., et al. (2016). Comparative study on micro-pore structure of marine, terrestrial, and transitional shales in key areas, China. Int. J. Coal Geology. 171, 76–92.
Yang, F., Pu, X. G., Jiang, W. Y., Han, W. Z., Zhang, W., Shi, Z. N., et al. (2018). Organic geochemistry characteristics of the fine grained sedimentary rock of the second member of Kongdian Formation (Ek2) in Cangdong Sag, Huanghua Depression, Bohai Bay Basin. Nat. Gas Geosci. 29, 550–558. (in Chinese with English abstract).
Zhao, X. Z., Yang, F., Zhou, L. H., Pu, X. G., Jin, F. M., Han, W. Z., et al. (2018). Geological characteristics of shale rock system and shale oil exploration in a lacustrine basin: A case study from the Paleogene 1st sub-member of Kong 2 Member in Cangdong sag, Bohai Bay Basin, China. Pet. Exploration Dev. 45, 1–10. (in Chinese with English abstract). doi:10.1016/s1876-3804(18)30043-0
Zhao, X. Z., Zhou, L. H., Zhao, M., Wang, W. G., and Guan, Q. S. (2019). Breakthrough and practice of industrial development on continental shale oil: A case study on Kong-2 Member in Cangdong sag, Bohai Bay Basin. China Pet. Exploration 24, 589–600. (in Chinese with English abstract).
Zhou, L. H., Liu, X. W., Fu, D. Q., Li, D. P., Liao, X. S., Zhang, S. C., et al. (20192019). Evaluation and application of influencing factors on the fracturability of continental shale oil reservoir: A case study of Kong 2 Member in Cangdong sag. China Pet. Exploration 24, 670–678. (in Chinese with English abstract).
Keywords: cangdong sag, nitrogen adsorption, lacustrine shale pore structure, fractal FHH model, fractal dimension
Citation: Pan S, Zha M, Gao C, Qu J and Ding X (2021) Pore Structure and Fractal Characteristics of Organic-Rich Lacustrine Shales of the Kongdian Formation, Cangdong Sag, Bohai Bay Basin. Front. Earth Sci. 9:760583. doi: 10.3389/feart.2021.760583
Received: 18 August 2021; Accepted: 18 October 2021;
Published: 02 November 2021.
Edited by:
Rui Liu, Southwest Petroleum University, ChinaReviewed by:
Ruyue Wang, SINOPEC Petroleum Exploration and Production Research Institute, ChinaLin Ma, The University of Manchester, United Kingdom
Copyright © 2021 Pan, Zha, Gao, Qu and Ding. This is an open-access article distributed under the terms of the Creative Commons Attribution License (CC BY). The use, distribution or reproduction in other forums is permitted, provided the original author(s) and the copyright owner(s) are credited and that the original publication in this journal is cited, in accordance with accepted academic practice. No use, distribution or reproduction is permitted which does not comply with these terms.
*Correspondence: Shouxu Pan, Y3VtdHBzeEAxMjYuY29t