
94% of researchers rate our articles as excellent or good
Learn more about the work of our research integrity team to safeguard the quality of each article we publish.
Find out more
ORIGINAL RESEARCH article
Front. Earth Sci. , 03 January 2022
Sec. Structural Geology and Tectonics
Volume 9 - 2021 | https://doi.org/10.3389/feart.2021.760390
 Jingchen Zhang1*
 Baocheng Wu2Fei Wang1Shanzhi Shi2Jinjun Liu2Mingxing Wang2Jie Li2Nicholas Izuchukwu Osuji1
As an important energy replacement block in China, the tight conglomerate oilfields in the Mahu area are difficult to develop and are characterized by strong heterogeneity, large horizontal stress differences, and undeveloped natural fractures. However, new development processes including temporary blocking diversion and large section-multiple clusters have been implemented on the oilfields in the past few years. In 2020, two adjacent horizontal wells in the MD well area experienced a poor fracturing development effect compared with the earlier wells in this area. Analysis suggests that the main reasons are water sensitivity of the reservoir, insufficient fracturing scale, and/or interference from the adjacent old wells. To ameliorate the problem, this study presents an experimental study of multiple temporary plugging and refracturing technology in long horizontal well sections, in combination with electromagnetic and microseismic monitoring. Results from the study show a great difference between the two monitoring techniques, which is attributed to their different detection principles. Interestingly, the combination of the two approaches provides a greater performance than either approach alone. As the fracturing fluid flow diversion is based on temporary plugging diversion and electromagnetic monitoring of fracturing fluid is advantageous in temporary plugging diversion monitoring, both approaches require further research and development to address complex situations such as multiple temporary plugging and refracturing in long intervals of adjacent older wells.
The tight conglomerate oilfield in the Mahu area is an important resource replacement block in China and is characterized by highly heterogeneous reservoir physical and mechanical properties, such as large horizontal stress and undeveloped natural fractures, which poses great challenges for the field development (Li et al., 2020). This lack of development precedent at home and abroad has led to the implementation of various new techniques and methods to drive the advancement in the field development. Some of the new techniques include temporary blocking diversion (Jiang et al., 2019; Zhou et al., 2020) and large segment fracturing (Deasy et al., 2018; Murphree et al., 2020).
Presently, microseismic monitoring is the main monitoring method adopted for hydraulic fracturing in the Mahu area (Jia et al., 2012; Zou et al., 2015). The technology is used to monitor the effect of production activities and underground conditions by observing and analyzing the microseismic events (Du et al., 2010; Xu et al., 2016) induced during operations such as oil and gas extraction and conventional water injection (Cipolla et al., 2011; Al-Khudiri et al., 2015). As the basic principle of the monitoring process is through acoustic emission and seismology (Wang, 2008;1), microseismic events do not necessarily occur where the fracturing fluid arrives or where the fracture expands (Liu, 2012;2). But, it can be attributed to the characteristics of induced microseismic signals, such as different energy, weak signal, wide frequency band, and serious interference by background noise and low signal-to-noise ratio (SNR) which affects the accuracy, reliability, and subsequent interpretation of microseismic research (Kurdi et al., 2015).In comparison, the main mechanism of hydraulic fracture is tensile failure, while that of microseismic events with high amplitude is usually associated with shear failure (Xu et al., 2013).
Since the 1930s, the surface-based controlled source electromagnetic method (CSEM) has been successfully implemented in the mining industry, whereas its application in the petroleum industry has been considerably slow. However, with the improvement of the CSEM model algorithm, the enhancement of computer processing power, and the continuous improvement of digital filters (Mao et al., 2019) in recent years, electromagnetic monitoring has been increasingly implemented in the field for fracturing. The electromagnetic monitoring method of the fracturing fluid is an artificial source electromagnetic detection method that is based on the principle of electromagnetic induction and is used to observe and study the response field in time and frequency domains. The electromagnetic exploration method transmits alternating current pulse square wave signals with different frequencies to the ground through a grounded electric dipole source. Then, an induced signal transmitted through the ground via a grounded electric dipole and/or a magnetic field sensor is received and simultaneously analyzed. Consequently, the diffusion and migration of the fracturing fluid in the formation can be obtained by monitoring the changes in electromagnetic physical properties. In addition, the obtained data are processed in time and frequency domains, thereby extracting and detecting target resistivity and induced polarization abnormal characteristic information (Weimann et al., 2018).
Field practices show that there are great disparities between results obtained from microseismic and electromagnetic monitoring as depicted in Figures 1, 2 (the pictures are quoted from the original text, and the color is only for illustration. Please refer to the original text for more information). As can be observed, the enrichment state of the fracturing fluid is affected by the formation’s physical properties, stress state, natural fractures, and other factors, and the fracture direction is often not along the direction of the principal stress. Hence, one monitoring method may not be able to fully analyze and represent the reservoir properties. Hence, for a better understanding and analysis, the combination of variety of monitoring methods (Liu et al., 2014; Hickey et al., 2019; Young et al., 2020) is preferred.
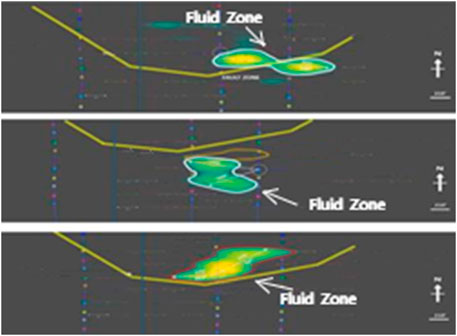
FIGURE 1. Electromagnetic monitoring of fracturing fluid aggregation pattern (Hickey et al., 2019).
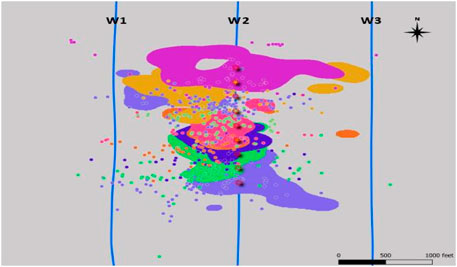
FIGURE 2. The scattered points in the image are observed micro-seismic events, while the colored laminated areas are observed areas of fracturing fluid accumulation (Young et al., 2020).
In 2020, it was discovered that two adjacent horizontal wells showed poor fracture development effect compared with the early wells in the Mahu area (crude oil production is 30% below regional average under the same conditions; further comparison information is shown in Figure 14). Through systematic analysis and comparison, it is believed that the main reason is insufficient fracturing scale or interference caused by adjacent old wells. In order to solve this problem, this work presents an approach through the experimental study of multiple temporary plugging and the refracturing process carried out in long well segments, in combination with electromagnetic and microseismic composite monitoring. The two kinds of monitoring techniques exhibit great disparity in their individual results, whereas the single effect of microseismic monitoring was not quite clear. Considering that the objective of temporary plugging is to change the flow direction of the fracturing fluid and the advantages of the electromagnetic monitoring method is in monitoring the flow of the fracturing fluid, the use of combined electromagnetic and microseismic monitoring can better evaluate the effect of temporary plugging, thereby availing a new idea for the evaluation of the temporary plugging effect and help to guide the field practice of large-scale multi-cluster and temporary plugging diversion.
Well M2 (production) area is located in the western part of Sanquan uplift and Yingxi depression of Luliang uplift in the Junggar Basin and is between wells M3 and M7 as shown in Figure 8. Each reservoir is an unsaturated reservoir with an abnormal high pressure and normal temperature system and is divided into three small layers. The average depth in the middle of the formation is 3860 m with an average temperature of about 99.78°C in the middle, an average formation pressure of 61.64 MPa, and an average saturation degree of 14.2%.
Production from wells M3 and M7 began on April 13, 2020, with an average daily oil production of 9.4t and 10.2t, respectively. At present, the water cut is 83% with a wellhead pressure of 3.84 MPa and a flowback rate of 81.12%. The horizontal section length of well M3 is 1200 m and is divided into 17 sections and 33 clusters, with the cluster spacing in the range of 20.7–72 m and an average spacing of 35.2 m. The fracturing section length is 1066m, with the single section sand amount in the range of 40 m (Zhou et al., 2020)∼60 m3 and single well sand amount of 880 m (Zhou et al., 2020). The sand adding strength is 0.83 m3/m, and the liquid–sand ratio is 13.6. For well M7, the horizontal section is 1182m and is divided into 17 sections and 33 clusters. The interval between clusters is 20–60 m with an average of 40m and an operating displacement of 18–37.5 m³/min. At present, the water cut is 81.2% with a wellhead pressure of 3.02 MPa and flow-back rate of 56.15%.
Compared with the earlier wells in this area, wells M3 and M7 have a low accumulated oil production, high water cut, low wellhead pressure, high flow-back rate, and poor production effect. Currently, it is considered that the main reasons for these conditions are reservoir water sensitivity, insufficient fracturing scale, and also shortage of the adjacent old wells. In view of the poor production effect of wells M3 and M7 compared with the previous production wells, refracturing tests were carried out.
In wells M3 and M7, new fractures were refractured, and a 0.8% mechanical swelling inhibitor was added to the fracturing fluid. The current mainstream refracturing processes include chemical temporary plugging diversion, mechanical forced isolation, and wellbore reengineering. Considering that well M2 was completed with 5-inch casing and the downhole tools were not matched, the multi-stage temporary plugging and diversion fracturing were adopted for refracturing. In view of the uncertainty of temporary plugging fracturing, the fully packed bridge plug is selected to fracture some sections near point A of well M2.
The fracturing process which commenced at about 15:31 China local time on November 11, 2020, started with pumping of slick water, then followed by granular temporary plugging agent, powder temporary plugging agent, and temporary plugging ball for five times. After each pumping stage, different degrees of pressure increase were recorded. The pumping curve obtained is shown in Figure 3.
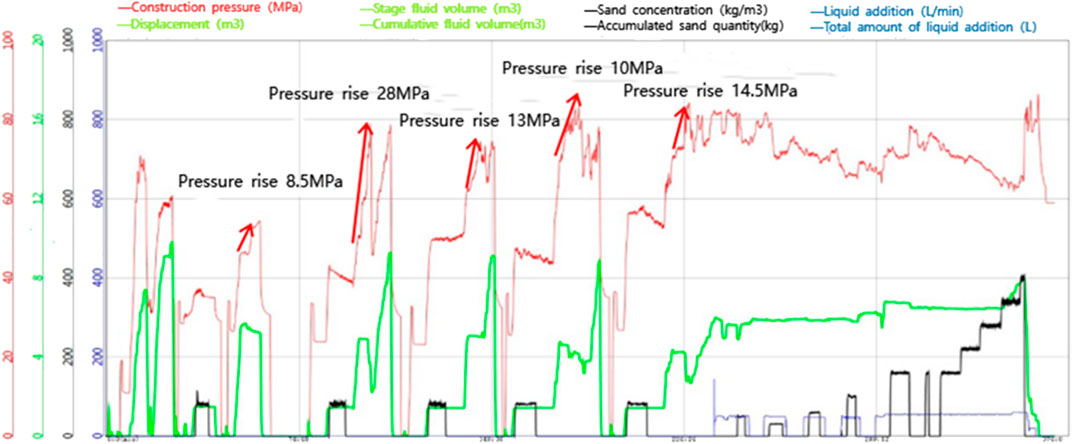
FIGURE 3. Temporary plugging pumping curve of well M3.
For the first stage, the gel, 40/70 mesh size quartz sand, and 20/40 mesh size ceramsite were pumped into well M3 in turn to conduct the first temporary plugging and fracturing of new fractures. The pumping pressure increased continuously with the increase in pumping flow, as shown in the pumping curve in Figure 4A.
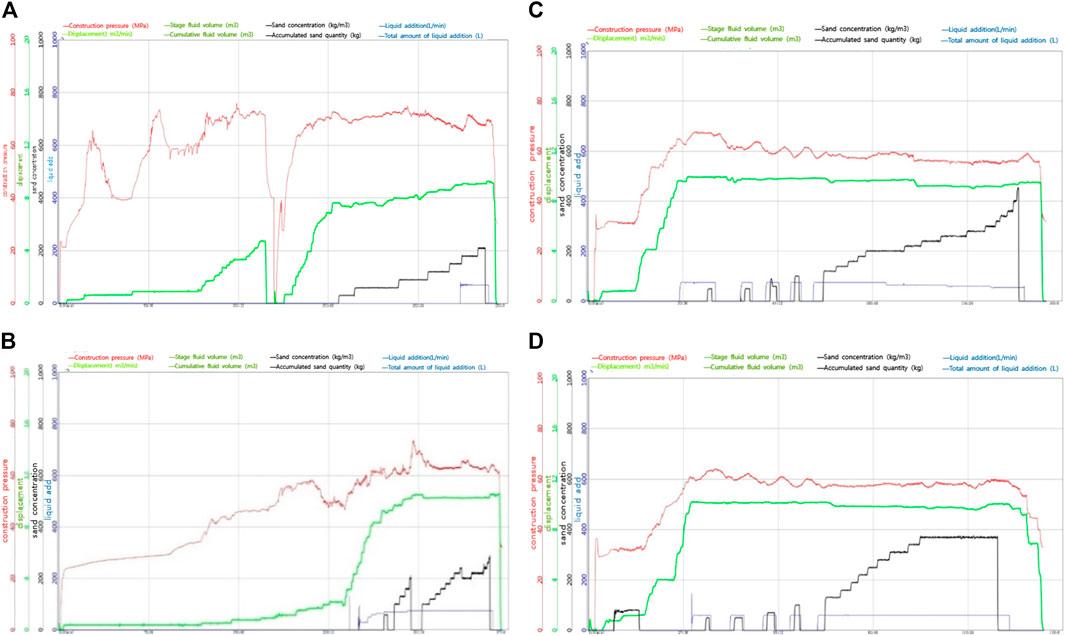
FIGURE 4. (A) First-stage fracturing operation graph of the new fracture in well M3; (B) Second-stage fracturing operation graph of the new fracture in well M3; (C) Third-stage fracturing construction graph of the new fracture in well M3; (D) Fourth stage fracturing construction graph of the new seam in well M3.
In the second stage, the gel, temporary plugging agent, powder temporary plugging agent, slippery water, twice 40/70 mesh size quartz sand, and 20/40 mesh size ceramsite were pumped successively for temporary plugging and fracturing of new fractures. As observed, overpressure occurred after an injection of 11.9 m3 and continued for some time after shut-in. The pumping curve in Figure 4B shows that at normal pressure, the pumping pressure increased slowly with an increase in the pumping rate.
Furthermore, the granule temporary plugging agent, powder temporary plugging agent, temporary plugging ball, four times 40/70 mesh size quartz sand, and 20/40 mesh size ceramsite were pumped consecutively for the third stage of temporary plugging and fracturing for the new fractures. As shown in Figure 4C, the pumping pressure was observed to increase continuously with the increase of pumping flow and then flattens when the flow stabilizes.
In the fourth stage, the granule temporary plugging agent, powder temporary plugging agent, temporary plugging ball, four times 40/70 mesh size quartz sand, and 20/40 mesh size ceramsite were pumped at once. Here, the pumping pressure was observed to increase continuously with the increase of pumping flow which then flattens after some time shown in Figure 4D.
The fracturing process for well M7 began at about 15:53 China local time on November 1, 2020, with pumping of slippery water, followed by the particle temporary plugging agent, then powder temporary plugging agent, and four times temporary plugging ball. The pumping curve is shown in Figure 5, and different degrees of pressure increase evident in each pumping stage.
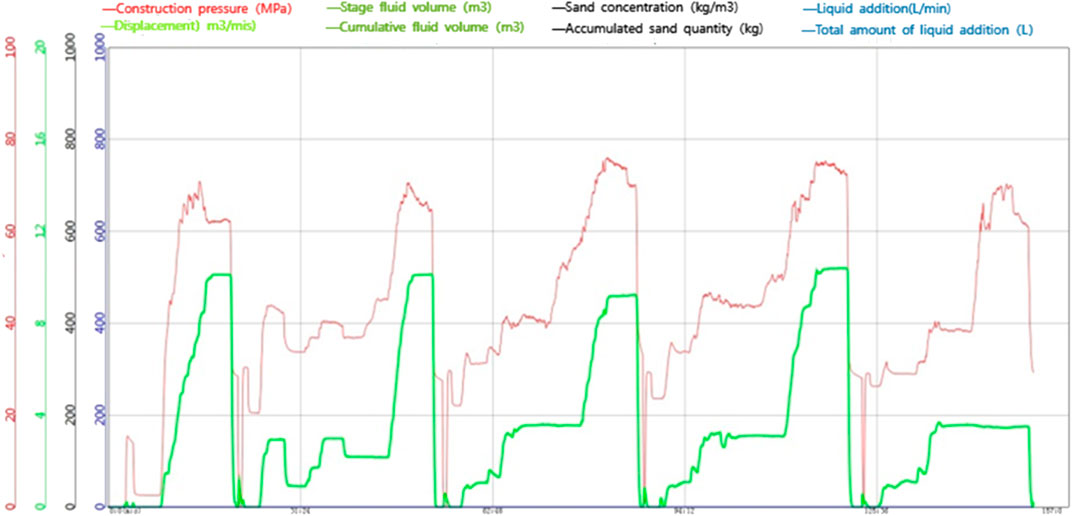
FIGURE 5. Temporary plugging pumping curve of well M7.
For the first stage, the gel was pumped in, followed by pumping of the particle temporary plugging agent, then powder temporary plugging agent, and temporary plugging with four times 40/70 mesh size quartz sand and 20/40 mesh size ceramsite. As shown in the pumping curve in Figure 6A, the pumping pressure is proportional to the pumping flow; thus, an increasing pumping flow results in an increase in the pumping pressure and vice versa. In addition, the increase of sand concentration resulted in a little increase in the pumping pressure.
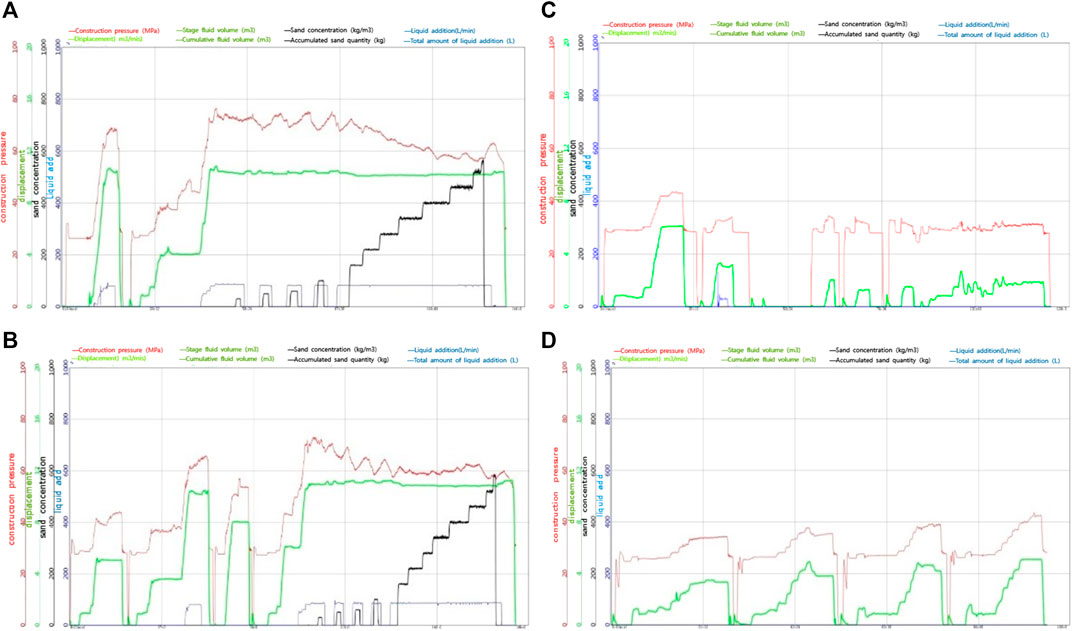
FIGURE 6. (A) First-stage fracturing operation graph of the new fracture in well M7; (B) Second-stage fracturing operation graph of the new fracture in well M7; (C) First construction graph of the third stage fracturing of the new fracture in well M7; (D) Second construction graph of the third stage fracturing of the new fracture in well M7.
At the second stage, the temporary plugging agent, particle temporary plugging agent, powder temporary plugging agent, and temporary plugging ball were pumped three times, then followed by successive pumping of four times 40/70 mesh quartz sand and 20/40 mesh size ceramsite. The pumping curve for this stage is depicted by Figure 6B.
For the third stage, the temporary plugging agent, particle temporary plugging agent, powder temporary plugging agent, and temporary plugging ball were successively pumped five times. The pumping pressure increased with the increase in pumping flow and decreased with the decrease in pumping flow. Compared with the first/second temporary plugging fracturing, the pumping pressure decreased significantly as shown in the pumping curve in Figures 6C,D.
The temporary plugging agent and temporary plugging ball added in the temporary plugging process are shown in Figure 7.
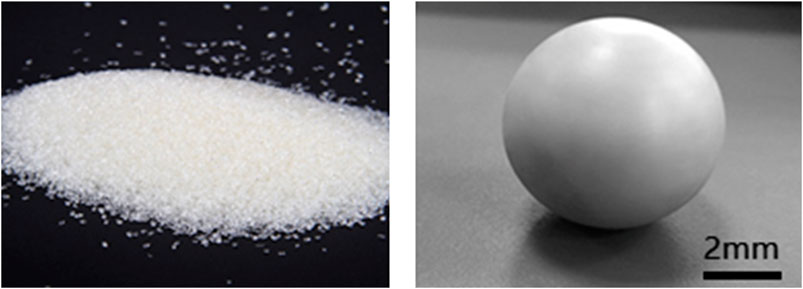
FIGURE 7. Degradable temporary plugging agent powder and a degradable temporary plugging ball for fracturing.
The plan for microseismic monitoring was to run a monitoring instrument in well M2 (production well) located between wells M3 and M7, as shown in Figure 8. The electromagnetic survey line is laid perpendicular to the horizontal well. In the case of the largest abnormal response, the survey line was deployed north-westwards. To ensure full coverage of the fracturing zone, the detection points near the horizontal fracturing stage were encrypted.
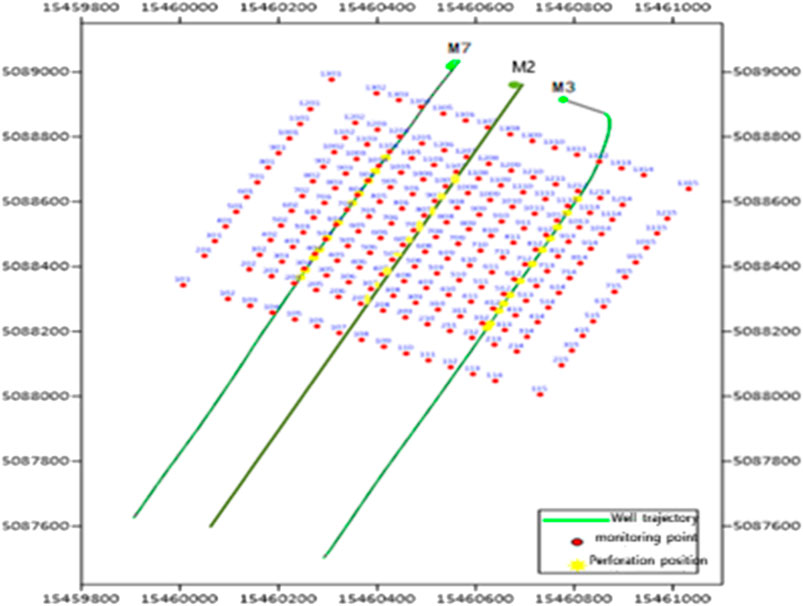
FIGURE 8. Deployment of measuring points.
For the electromagnetic monitoring process of well M3, results show that after the fracturing process, the fluid mainly concentrates on both sides of the fracturing site and then diffuses to both sides as shown in Figure 9 (left). The main diffusion direction is perpendicular to the well trajectory direction, and the fracturing fluid can be roughly divided into three parts. In the northern fracture section, the fracturing fluid diffuses south-eastwards (SE) along the vertical well trajectory. In the middle section, the fracturing fluid’s diffusion to both sides is not obvious, hence exhibiting the state of central aggregation. After the aggregation reaches a certain extent, the pressure release channel is probed along the well trajectory in the north-east (NE) and south-west (SW) direction. The fracturing fluid in the southern section first migrates to the bottom of the well along the well trajectory, then diffuses to the south-east (SE), with a small channel to the west direction. Between wells M7 and M3, there exists a fracturing fluid accumulation zone with some connectivity to both wells.
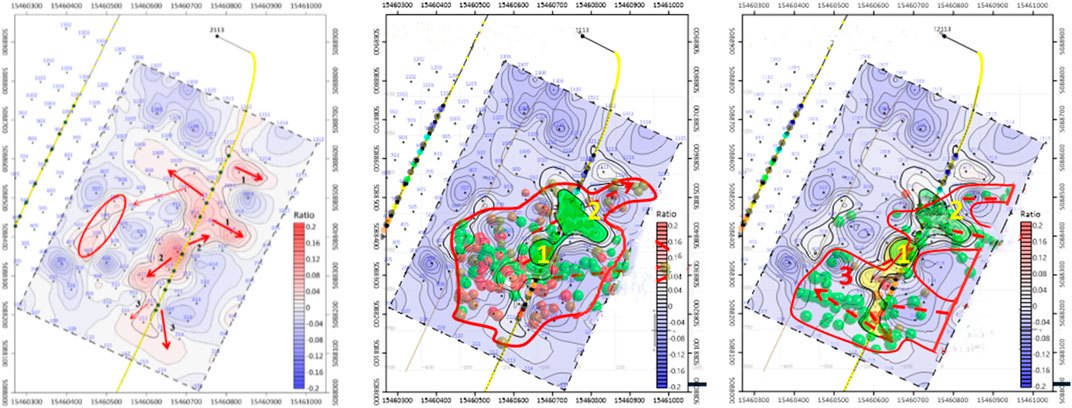
FIGURE 9. Electromagnetic monitoring of fracturing fluid migration direction in M3 well (left), comprehensive analysis of temporary plugging of old fractures in the M3 well (middle), and comprehensive analysis results of the first temporary plugging in well M3 (right).
Figure 9 (middle) shows the comprehensive analysis results of temporary plugging of old fractures in well M3. A total of 172 microseismic signals with magnitudes ranging from -3.63 to -2.80 were effectively located. It can be seen that microseismic events mainly occurred at the positions of stages 13, 14, 15, and even at stage 16. The accumulated fracturing liquid volume is about 550 m3 with a fracture pressure of 32 MPa and shut-in pressure of 30 MPa. It was observed that a large number of microseismic events occurred in a short period of time in area 1 due to the temporary blockage, which corresponds to the green dot area and should be a fully stimulated network area. The newly opened fractures were later blocked in area 2, and the microseismic event which occurred later lasted for a longer time. Hence, this leads to the more developed fractures with more absorption of the temporary plugging fluid.
Furthermore, Figure 9 (right) shows the comprehensive analysis results of the first temporary plugging in well M3. A total of 92 microseismic signals were effectively located during fracturing, with magnitudes ranging from -3.51 to -2.67. The microseismic events mainly occurred at the front end of stage 12 and the two wings of stage 13, with a small number of microseismic events occurring at the new perforation stages 15 and 16. At this stage, 896 m3 of the liquid is injected with a fracturing pressure of 84 MPa and a shut-in pressure of 30 MPa. The temporary plugging was successful, and new fractures were induced at the toe of stage 3. However, the expansion of the new fractures was limited to the near wellbore area. The signal at area 1 is enhanced, which should cause an increase in the fracturing fluid volume. As time increases, the temporary plugging failure became obvious.
Furthermore, Figure 10 (left) shows the comprehensive analysis results of the second temporary plugging in well M3. A total of 48 microseismic signals were effectively located during fracturing, with magnitudes ranging from −3.45 to −2.89. The microseismic events mainly occurred at the two wings of the new perforation area in stage 16, while the microseismic events stopped at the positions of stages 12, 13, and 14. The event point extended to well M7, and the pressure of well M7 rose to 25 MPa during fracturing. At this stage, 1388 m3 liquid is injected with a fracturing pressure of 88MPa and shut-in pressure of 30 MPa. It can be observed that the temporary plugging was successful with an obvious time effect, and the signal of the old plugging area 2 was enhanced along with new crack openings in area 4. Consequently, there may be a far-field transient plugging diversion effect, where the flow of the fracturing fluid is not consistent with the direction of in situ stress (shown in the black arrow box in Figure 10 left). In addition, a large number of micro-seismic events along the principal stress direction are also likely to occur in the area with an absence of the fracturing fluid which may be the area of the old fracture network.
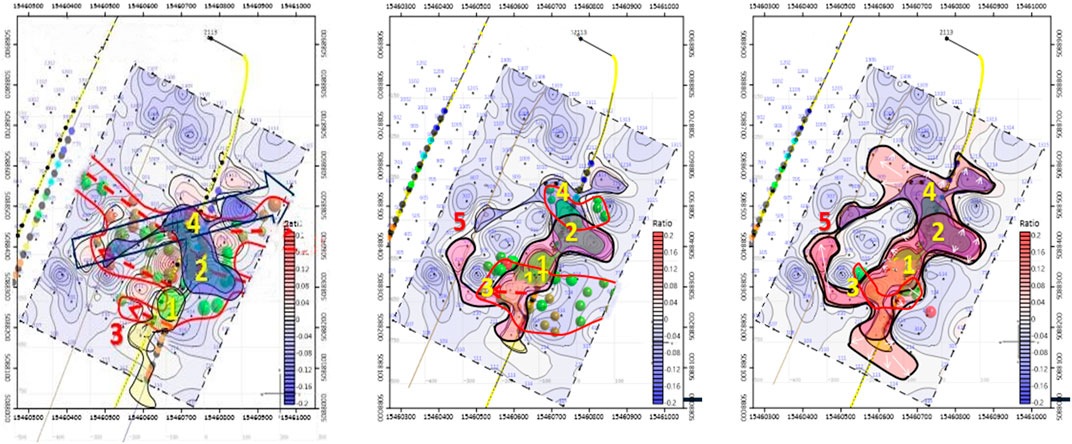
FIGURE 10. Comprehensive analysis of the second-fourth stage temporary plugging in the M3 well (left-right, second-fourth).
In Figure 10 (middle), the comprehensive analysis results of the third temporary plugging of well M3 are illustrated. A total of 36 microseismic signals with magnitudes ranging from −3.73 to −2.91 were effectively located. As can be seen, the microseismic events mainly occurred at the two wings of the perforation in stages 13 and 14, which were coincidental with the old fractures. At this stage, 1,229.9 m3 liquid is injected with a fracturing pressure of 68 MPa and a shut-in pressure of 30 MPa. Successful temporary plugging is observed with an obvious time effect and enhanced signal for the old plugging areas 1 and 2. New fractures were produced in area 3, and the initial microseismic event indicated by the green dot appeared again in large numbers. This situation indicates that the presence of microseismic events, especially the initial instantaneous microseismic events, is uncertain. Consequently, the new fractures produced in areas 3 and 4 are connected in area 5, forming a far-field integrated hydraulic system.
Figure 10 (right) shows the comprehensive analysis results of the fourth temporary plugging of well M3. A total of 11 microseismic signals with magnitudes ranging from −3.47 to −3.23 were effectively located. The microseismic events mainly occurred at the two wings of stages 13 and 14, which were coincidental with the old fractures. At this stage, 969.7 m3 liquid is injected with a fracture pressure of 67 MPa. As can be seen, the temporary plugging was initially effective with a continuous microseismic event in area 1, which later failed. Furthermore, the electromagnetic signal of the far-field integrated hydraulic system continued to increase. With the formation of a far-field integrated hydraulic system, the plugging effect in the near well zone became worse.
The electromagnetic monitoring process for well M7 shows that after fracturing, the fluid which mainly concentrates in the fracturing location gradually diffuses to both sides and then, dissipated to all sides as shown in Figure 11 (left). As a result, five dispersive directions which are in the northwest to the northeast (NW-NE) direction along the well track, southwest to southwest (SW-SW) direction, south to southwest (S-SW) direction, southeast to southeast (SE-SE) direction, and northeast (NE) direction dissipative branch were observed. The east to east direction is not the main dissipation direction and is extremely weak. Due to the fracturing of the M3 well, the two wells are then connected by the fractures and a liquid-rich area is created.
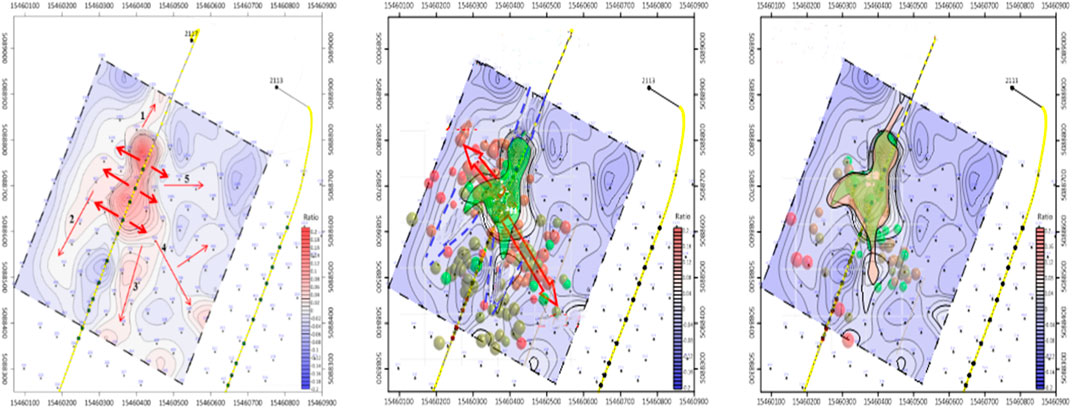
FIGURE 11. Electromagnetic monitoring of the fracturing fluid migration direction in well M7 (left), comprehensive analysis of the temporary plugging of old fractures in the M7 well (middle), comprehensive analysis of temporary plugging of the first stage in the new seam of the M7 well (right).
According to Figure 11 (middle), the microseismic events mainly occurred in stages 14, 16, and 17 during the old fracture plugging, resulting in the closure of the old fracture channels. About 534 m3 of the liquid was injected with the maximum pressure of 76 MPa and working pressure in the range of 40–76 MPa. However, the temporary plugging agent which was continuously injected into the old fracture did not induce new fractures. The abnormal area of electromagnetic monitoring is highly coincidental with the initial microseismic events, which is a sign of the high development of the fracture network. Compared with subsequent fracturing fluid injection, the transient plugging agent injection resulted in high pressure fluctuation (the same phenomenon occurred during pipeline pumping), and the microseismic response area which is a well-developed fracture network became larger. In the process of injecting temporary plugging agents, continuous microseismic events were experienced which indicates a failure/dynamic change of temporary plugging, as a successful temporary plugging will cause a lot of transient microseismic time.
Figure 11 (right) shows the comprehensive analysis results of the first temporary plugging in well M7. A total of 68 microseismic signals were effectively located with magnitudes ranging from −3.42 to −2.64. The microseismic events mainly occurred at the two wings of stage 16, and a small amount also occurred at stages 13 and 14. At this stage, about 997.5 m3 liquid is injected with a maximum pressure of 76MPa, and working pressure in the range of 49–76 MPa. In this case, the temporary plugging failed and could not induce new fractures, while the fluid continued to flow along the old fracture. A continuous increase in the regional electromagnetic signal was observed. Consequently, the left upper, left lower, and right lower channels continued to expand.
Furthermore, Figure 12 depict the comprehensive analysis results of the second temporary plugging in well M7. A total of 63 microseismic signals were effectively located with magnitudes ranging from −3.05 to −2.26. The microseismic events mainly occurred at the two wings of stage 16, which basically coincides with the microseismic events extending further forward in length. Consequently, the microseismic events at stage 13 and 14 locations ceased to occur. At this stage, about 948.8 m3 liquid is injected with a maximum pressure of 73 MPa and a working pressure of 62 MPa. The temporary plugging here failed and did not open new fractures. The liquid continues to migrate along the old fractures, and the regional electromagnetic signals continue to increase with continuous expansion of the left upper, left lower, and right lower channels. Observations in regions A and B indicate that the diversion agent injected in the early stage may have a deep diversion effect. As a result, a high permeability channel exists at site A, with a low fluid absorption ability. The fracture fluid then moves to site C in large quantity and causes microseismic events at site A. However, the new fracture microseismic events at sites D and E were not detected, which may be filtered.
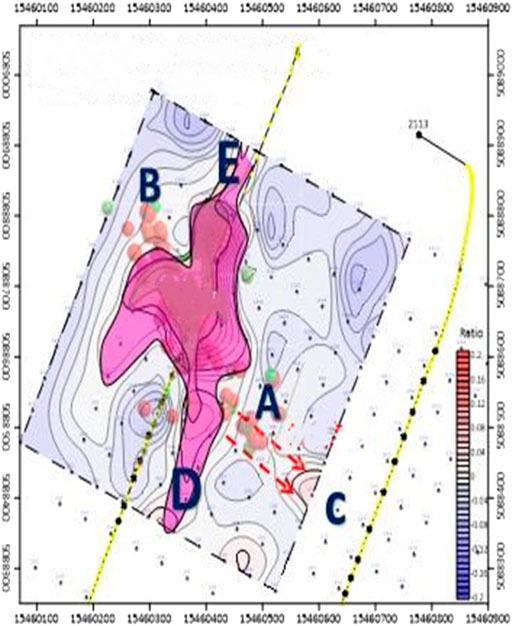
FIGURE 12. Comprehensive analysis of the second-stage temporary plugging of the M7 well.
The reservoir stimulation area is located between the time–frequency electromagnetic survey line 2 and line 13, which is mainly composed of five irregular bodies. The stimulation volume is about 3.72 million cubic meters. The green aggregates in Figure 13 are the fracturing fluid injection areas observed by the electromagnetic monitoring method. It can be seen from that there is a big difference between microseismic and electromagnetic monitoring. Electromagnetic monitoring shows that the stimulation area is more at the heel end of the wellbore and much smaller than the microseismic results. A large part of the fracturing fluid is located in the trajectory of well M2, which is supported by the rapid increase of water production after subsequent well M2 fracturing.
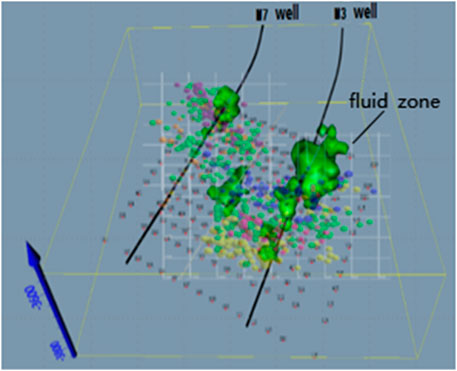
FIGURE 13. Stereo contrast of microseismic and electromagnetic monitoring.
The phenomenon of cross flow and mutual interference after fracturing is obvious, and the refracturing effect is not good. As shown in Figure 14, the overall oil production effect of well M7 after fracturing is better than that of well M3, which confirms the three deep temporary plugging diversion areas displayed by electromagnetic monitoring. The water cut of well M2 rises sharply after well pressure, which validates the liquid enrichment area near the well trajectory observed by the electromagnetic monitoring method.
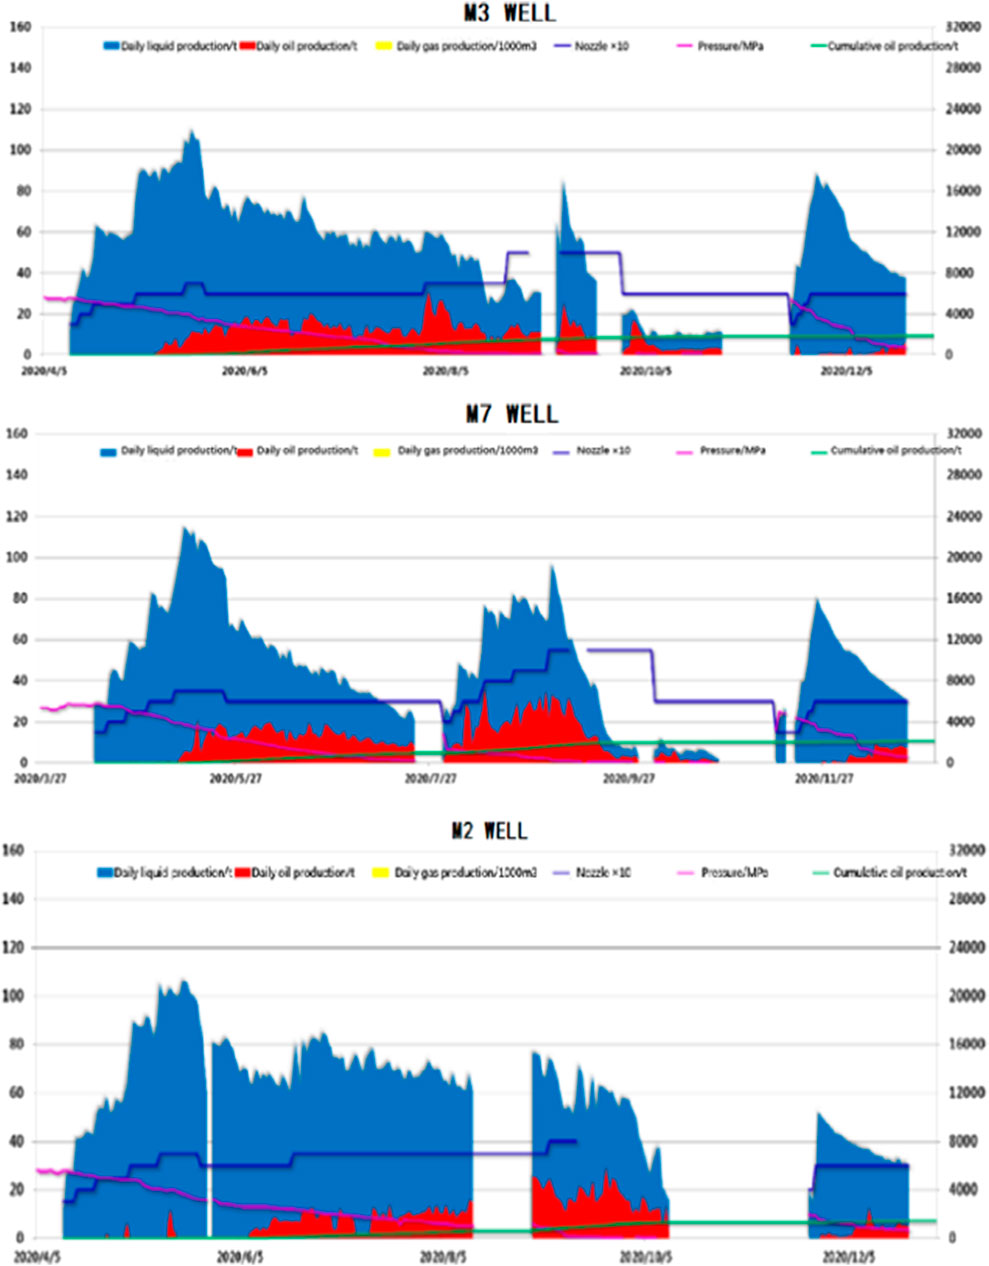
FIGURE 14. Well M3, M7, and M2 production curve (from top to bottom).
Temporary plugging and refracturing in the long section of adjacent horizontal wells involve complex situations such as fracture morphology and changes in the stress field in the primary and secondary fractures, flow channel and inter-well interference, dynamic changes of temporary plugging, and diversion of fractures. This time, the increment effect of refracturing is not obvious, and it interferes with the production of normal surrounding wells. It is necessary to further improve the means of monitoring and studying the temporary blocking and interference mechanism.
The two monitoring technologies need to be further developed in tandem having in mind some questions such as 1) what are the differences in microseismic characteristics between an old fracture area in a refracturing process, a new fracture area in a secondary fracturing process, a diverted fracture area, and a low-aspirate channel area?, 2) Is the microseismic de-noising algorithm appropriate, and are there disturbances and inappropriate filters for these simultaneous events?, 3) Does continuous injection of the fracturing fluid/diverter cause continuous microseismic events in adjacent fracture network areas?, 4) What is the relationship between the amount of fracturing fluid accumulation and the intensity of microseismic events?
Electromagnetic monitoring provides a physical detection method to directly observe the dynamic changes of the fracturing fluid enrichment location in multiple temporary plugging diversion. From the study and analysis conducted, the enrichment location of the injected fluid is greatly different from the location where microseismic events occur intensively. Hence, the following conclusions are drawn.
1) For the temporary plugging failure, the abnormal area of electromagnetic monitoring during the temporary plugging process is highly coincidental with microseismic events in a large range and for a long period of time. Consequently, the regional fracture network is highly developed, and temporary plugging becomes difficult.
2) For the successful temporary plugging, due to the transfer of elastic energy of the liquid and formation, sudden temporary plugging in the process of large displacement injection may cause a wide range of transient microseismic events in the existing well-communicated fracture networks, even with a less amount of fracturing fluid injection. This implies that, in the case of refracturing, a large number of regional transient microseismic events may be a transient response of original well-communicated fracture networks or flow channels during temporary plugging or fracturing processes. Consequently, the microseismic events with extended time and consistent with the electromagnetic monitoring results are the reliable representation of new fracture propagation.
3) During the dynamic change of temporary plugging, the pressure fluctuates greatly when the temporary plugging material is pumped in the wellbore. Therefore, the actual plugging process which may also be a dynamic process can continue to cause microseismic events in well-communicated fracture network areas, even when a large amount of the fracturing fluid does not reach these areas. Compared with fracturing fluid injection, the pressure fluctuation and micro-seismic response areas are larger for temporary plugging agent injection. As a result, these areas exhibit well-developed fracture networks. Hence, in the process of temporary plugging agent injection, multiple transient micro-seismic events signify the transient plugging dynamic change.
4) Temporary plugging has a strong timelessness, especially in near wellbore area. Electromagnetic monitoring results and pumping curves show that temporary plugging was successful several times. Additionally, the temporary plugging effect becomes worse until it fails as time goes on and as the amount of fracturing fluid injected increases.
5) Electromagnetic monitoring showed obvious deep temporary plugging diversion, indicating that the direction of new fractures deviates from the direction of principal stress. Frequently, the fracturing fluid arrival area deviates from the microseismic event occurrence area. As the microseismic events continue to occur in the areas where the fracturing fluid did not enter in large quantities, no corresponding microseismic events were detected in the areas where the fracturing fluid entered after diversion.
6) Although temporary plugging has been successfully achieved for several times in the near well zone, the situation of refracturing in the area with multiple horizontal wells is complex. Under the influence of interflow and inter-well interference, there may be multiple hydraulic communications in the far well area, making the near well temporary plugging meaningless.
The original contributions presented in the study are included in the article/supplementary material; further inquiries can be directed to the corresponding author.
JZ and FW are responsible for the whole manuscript, the theoretical part, and the interpretation of fracturing fluid migration. NIO is responsible for data collection and processing, article writing. Others are responsible for the summary of fracturing construction.
This study was supported by the Xinjiang Tianshan youth program “Research on comprehensive treatment and utilization of oily sludge from large-scale fracturing development” (2018q030), CNPC-CUP strategic cooperation science project—(zlzx2020-02-07-03)/(zlzx2020-02-07-05).
WB, SS, LJJ, WM, and LJ were employed by the Petrochina Xinjiang Oilfield Company.
The remaining authors declare that the research was conducted in the absence of any commercial or financial relationships that could be construed as a potential conflict of interest.
All claims expressed in this article are solely those of the authors and do not necessarily represent those of their affiliated organizations, or those of the publisher, the editors, and the reviewers. Any product that may be evaluated in this article, or claim that may be made by its manufacturer, is not guaranteed or endorsed by the publisher.
1https://kns.cnki.net/KCMS/detail/detail.aspx?dbname=CDFD0911&filename=2008199211.nh
2https://kns.cnki.net/KCMS/detail/detail.aspx?dbname=CMFD201301&filename=1012500001.nh
Al-Khudiri, M. M., AlSanie, F. S., Bartko, K. M., Kurdi, M. S., Kashif, M., and Meraj, H. (2015). Real-time Data Gathering and Transmission of Fracture Treatment Operations and Micro Seismic Monitoring to Enable Optimization of Field Development. Mishref, Kuwait: Society of Petroleum Engineers. SPE-175183-MS. doi:10.2118/175183-MS
Cipolla, C., Weng, X., Mack, M., Ganguly, U., Gu, H., Kresse, O., et al. (2011). Integrating Microseismic Mapping and Complex Fracture Modeling to Characterize Hydraulic Fracture Complexity. Woodlands, TX: Society of Petroleum Engineers. SPE-140185-MS. doi:10.2118/140185-MS
Deasy, M., Brown, K., He, J., Lipscomb, W., Ockree, M., Voller, K., et al. (2018). “Reduced Cluster Spacing: From Concept to Implementation – A Case History,” in Paper Presented at the SPE/AAPG Eastern Regional Meeting (Pittsburgh, Pennsylvania, USA: SPE). doi:10.2118/191801-18ERM-MS
Du, C. M., Zhang, X., Zhan, L., Gu, H., Hay, B., Tushingham, K., et al. (2010). Modeling Hydraulic Fracturing Induced Fracture Networks in Shale Gas Reservoirs as a Dual Porosity System. Beijing, China: Society of Petroleum Engineers. SPE-132180-MS. doi:10.2118/132180-MS
Hickey, M., Vasquez, O., and Trevino, S. (2019). “Using Land Controlled Source Electromagnetics to Identify the Effects of Geologic Controls during a Zipper Frac Operation - A Case Study from the anadarko basin,” in Paper Presented at the SPE Hydraulic Fracturing Technology Conference and Exhibition (Texas, USA: The Woodlands). -13: 9781613996294. doi:10.2118/194313-ms
Jia, L. C., Chen, M., and Jin, Y. (2012). The Development of Hydraulic Fracturing Fracture Monitoring Technology in Shale Gas Wells Abroad. Nat. Gas Oil 30 (01), 44–47+101102.
Jiang, W., Zhang, G. S., and Ke, W. l. (2019). Experimental Evaluation of Temporary Plugging to Refracturing Plugging Agent in Shale Gas Well. Contemp. Chem. Industry 48 (01), 32–35.
Kurdi, M., Bartko, K., Alfataierge, A., and Alghamdi, F. (2015). First Fractured Horizontal Well with Offset Horizontal Microseismic in KSA. Al-Khobar, Saudi Arabia: Society of Petroleum Engineers. SPE-178017-MS. doi:10.2118/178017-MS
Li, G. X., Qin, J. H., and Xian, C. G. (2020). Theory Understanding, Key Technology and Practice of Efficient Development of Tight Conglomerate Oilfield: a Case Study of Mahu Oilfield in Junggar Basin. Pet. Exploration Develop. 47 (06), 1185–1197. doi:10.1016/S1876-3804(20)60135-0
Liu, W. (2012). Microseismic Fracture Monitoring Method and its Application. Chengdu, China: Chengdu University of TechnologyMaster's Thesis.
Liu, X. J., He, Z. X., and Zhang, . h. (2014). Application of Time-Frequency Electromagnetic Technology in Hydrocarbon Trap Evaluation. Chinese Geophysical Society Chinese Geophysical Society, 4.
Mao, Q. H., Wang, P., and Zeng, J. (2019). A Review of Microseismic Event Localization Methods for Hydraulic Fracturing. Prog. Geophys. 34 (05), 1878–1886. doi:10.6038/pg2019CC0240
Murphree, C., Kintzing, M., Robinson, S., and Sepehri, J. 2020). Evaluating Limited Entry Perforating & Diverter Completion Techniques with Ultrasonic Perforation Imaging & Fiber Optic DTS Warmbacks. " Paper Presented at the SPE Hydraulic Fracturing Technology Conference and Exhibition, The Woodlands, Texas, USA, SPE-199712. doi:10.2118/199712-MS
Wang, A. G. (2008). Application of Microseismic Monitoring and Simulation Technology in Fracture Research. Qingdao, China: China University of Petroleum Doctoral Dissertation.
Weimann, M. I., Lopez Martinez, C., Monro Santiago, F., and Salaza Juarez, J. (2018). “Mexico Unconventional Recourses and Micro-seismic Studies,” in Paper Presented at the SPE Argentina Exploration and Production of Unconventional Resources Symposium (Argentina: NeuquenSPE-191856-MS). doi:10.2118/191856-MS
Xu, B., Li, Y., Yuan, T., Qin, G., Yin, C., and Xiao, J. (2016). Numerical Modeling and Candidate Selection of Re-fracturing with Micro-seismic Data in Shale Gas Productions. Beijing, China: Society of Petroleum Engineers. SPE-181874-MS. doi:10.2118/181874-MS
Xu, Y., Mu, L., Yang, X. G., Zhao, W., Wang, X., Lim, T. K., et al. (2013). Understanding Tight Oil Reservoir Hydraulic Fracturing Stimulation Using Two wells Simultaneous Micro Seismic Monitoring Approach. in” International Petroleum Technology Conference. IPTC-16529-MS. doi:10.2523/IPTC-16529-MS
Young, S., Williams, E. S., Stocking, R., and Morton, P. (2020). “Feeling the Pressure on Infill Development,” in Paper Presented at the SPE/AAPG/SEG Unconventional Resources Technology Conference, Virtual (Austin, TX). doi:10.15530/urtec-2020-3224
Zhou, T., Chen, M., and Zhang, S. C. (2020). Fracture Propagation Simulation and ball-drop Temporary Plugging Optimization under the Influence of Non-uniform Stress Field. Nat. Gas Industry 40 (03), 82–91. doi:10.1016/j.ngib.2020.09.010
Keywords: electromagnetic monitoring, refracturing, temporarily blocked steering, microseismic, long well section
Citation: Zhang J, Wu B, Wang F, Shi S, Liu J, Wang M, Li J and Osuji NI (2022) Experimental Research of Compound Monitoring on Multiple Temporary Blocking Refracturing for Long-Section Horizontal Wells. Front. Earth Sci. 9:760390. doi: 10.3389/feart.2021.760390
Received: 18 August 2021; Accepted: 18 November 2021;
Published: 03 January 2022.
Edited by:
Yulong Zhao, Southwest Petroleum University, ChinaReviewed by:
Fengqi Tan, University of Chinese Academy of Sciences, ChinaCopyright © 2022 Zhang, Wu, Wang, Shi, Liu, Wang, Li and Osuji. This is an open-access article distributed under the terms of the Creative Commons Attribution License (CC BY). The use, distribution or reproduction in other forums is permitted, provided the original author(s) and the copyright owner(s) are credited and that the original publication in this journal is cited, in accordance with accepted academic practice. No use, distribution or reproduction is permitted which does not comply with these terms.
*Correspondence: Jingchen Zhang, amluZ2NoZW4xMjBAMTI2LmNvbQ==
Disclaimer: All claims expressed in this article are solely those of the authors and do not necessarily represent those of their affiliated organizations, or those of the publisher, the editors and the reviewers. Any product that may be evaluated in this article or claim that may be made by its manufacturer is not guaranteed or endorsed by the publisher.
Research integrity at Frontiers
Learn more about the work of our research integrity team to safeguard the quality of each article we publish.