 Yue Liu
 Jianyun Zhang1,2,3,4
 Qinli Yang
 Guoqing Wang
94% of researchers rate our articles as excellent or good
Learn more about the work of our research integrity team to safeguard the quality of each article we publish.
Find out more
ORIGINAL RESEARCH article
Front. Earth Sci., 29 September 2021
Sec. Hydrosphere
Volume 9 - 2021 | https://doi.org/10.3389/feart.2021.759534
This article is part of the Research TopicFuture Climate Scenarios: Regional Climate Modelling and Data AnalysisView all 23 articles
Hydrological modelling is of critical importance to flood control. However, flood forecasting in semi-arid region is a great challenge to hydrologists, particularly in a changing environment. Taking the Zhulong River catchment located in north China as a case, the performance of GR4J model for hydrological modelling was investigated based on the analysis for changes in hydrological process of three periods defined as natural period (1967–1979), moderate human impact period (1980–1996) and intensive human impact period (1997–2015). Results show that 1) the annual precipitation and temperature of the catchment both presented upward trends, while the annual observed runoff exhibited a significant downward trend in the time span from 1967 to 2015; 2) the correlations between runoff and precipitation were comparatively higher on both monthly and annual scales in natural period than those in human disturbed periods; 3) both annual runoff and daily peak discharge in human disturbed periods decreased relative to those in natural period due to the environmental changes; 4) the GR4J model performed well for runoff simulations in natural period but gradually lost its applicability with the intensification of human activities. It is essential to improve the accuracy of hydrological modelling under a changing environment in further studies.
The evolution of water cycle under the changing environment is a very complex process, which has been an important issue in the “Panta Rhei-Everything Flows” project (2013–2022) of IHAS (International Association of Hydrological Science) (Montanari et al., 2013). Climate change and human activities are two main driving factors affecting water cycle process under the changing environment (Wang et al., 2020). In the context of global warming, the temporal and spatial distribution of precipitation, evaporation and runoff have changed significantly (Dai et al., 2018; Charles et al., 2020). While human activities have changed the hydrological process in a basin by means of urban expansion, water extraction, water conservancy project construction and so on (Song et al., 2013; Liang et al., 2020). The acceleration of urbanization has not only changed underlying surface of the basin, but also changed runoff yield and confluence laws as well as groundwater recharge conditions (Wang et al., 2018). The development of industrial and agricultural production has caused a substantial increase in water resources consumption, which results in corresponding changes in surface runoff, dry season runoff and groundwater level (Leng et al., 2015; Yang P. et al., 2017). The construction of water conservancy projects can effectively reduce discharge in high flow seasons and increase discharge in low flow seasons to a certain extent (Wang et al., 2019; Varentsova et al., 2020).
Hydrological models are mathematical models constructed to simulate hydrological cycles and describe hydrophysical processes. They are essential means to study the laws of hydrology and nature (Xu, 2010; Krysanova et al., 2020) and effective tools to solve practical problems, e.g., hydrological forecasting, water resources management, and water conservancy project planning and design (Musuuza et al., 2020; Thatch et al., 2020; Turner et al., 2020). Liu et al. (2019) applied the VIC model to forecast the annual maximum floods and annual first floods in the YarlungZangbo River based on precipitation and temperature data, and provided an early warning with extended lead time. Maier and Dietrich (2016) investigated the application of SWAT model for the development of water saving irrigation control strategies in Northern Germany and showed a future increase of irrigation demand in humid regions. Du et al. (2016) adopted the Xinanjiang model to simulate inflows of reservoirs and flood hydrographs of all sub-catchments in the Ganjiang River basin and established simple reservoir operation rules for calculating outflows.
Previous studies have shown that most of the hydrological models can simulate streamflow processes well in humid and semi-humid regions, but hydrological modelling in arid and semi-arid regions has always been a great challenge to hydrologists, particularly under the changing environment (Molina-Navarro et al., 2016; Bugan et al., 2020). The GR4J model, as a lumped conceptual model, has been widely applied in various climate regions of the world because of its distinctive characteristics in principle and structure (Boumenni et al., 2017; Sezen and Partal, 2019). Zeng et al. (2019) investigated the predictive ability and robustness of the GR4J model with time-varying parameters under changing environments and improved the performance of streamflow simulations in Wei River Basin. Ghimire et al. (2020) used a range of hydrological modelling approaches for flow simulation and forecasting in the Ayeyarwady Basin and revealed that the GR4J model performed best in simulations and yielded the least biases in daily flow forecasting. Grigg and Hughes (2018) implied a modified GR4J model in a forested headwater catchment in southwest Australia and improved the predictions for catchments with significant changes in vegetation cover.
Studies on changes in hydrological sequence and simulation under the changing environment for large size rivers, e.g., the Amazon River (Jahfer et al., 2020), Yangtze River (Sun et al., 2019), Yellow River (Huo et al., 2020) have attracted sufficient attentions from river managers and state authorities. However, regional flooding and water shortage issues have been increasingly serious during the past decades due to global warming and increasing water demand (Wilkinson et al., 2019; Omer et al., 2020), and attention to these issues should be paid as well. The Daqing River is an important tributary of Hai River, and the Beijing-Tianjin-Hebei region in Daqing River basin is the political, cultural and technological center of China, as well as an important engine for the country’s economic development (Li et al., 2016). Since the 1980s, human activities have caused significant changes in the underlying surface of this basin, and runoff has decreased severely. However, the rapid development of Daqing River basin increases the demand for water resources, resulting in prominent problem of water shortage (Cui et al., 2019). It is therefore of great significance to investigate variation characteristics of hydrological series and hydrological modelling under such an changing environment to support water resources management and flood control of the Daqing River basin. Taking the Zhulong River catchment, an agricultural catchment in the Daqing River basin as a case, the main objectives of the paper are to investigate changes in hydrological process in different periods and to test performance of the GR4J model for extension of the model application to catchments in semi-arid regions.
The Zhulong River is in southern branch of the Daqing River in Hai River basin, and consists of three tributaries: the Sha, Ci and Mengliang rivers. It stretches from Taihang Mountains in the west to Baiyang Lake in the north, crossing 14 counties and cities in Shanxi and Hebei provinces. The Beiguocun hydrometric station (east longitude 115°23′E, north latitude 38°19′N) is the control station of Zhulong River, covering a drainage area of 8,550 km2. The main channel is 261.3 km long, with a longitudinal slope 2.5‰ and an average basin width 88.5 km. Terrain of the catchment is high in the northwest and low in the southeast. The upper reaches are covered by forested mountains, middle reaches are mainly undulating hills, and lower reaches are dominated by flat plains (Figure 1). The Zhulong River catchment is in the temperate semi-arid continental monsoon climate zone with an annual average temperature of 12.2°C. It has a mean annual precipitation of 523.0 mm which is extremely uneven with more than 80% concentrated in flood season. There are three large reservoirs in the catchment - Wangkuai, Koutou and Hengshanling reservoirs which are located on the Sha river, Sha river’s tributary Gao river and Ci river, respectively. Each of the three reservoirs has a storage capacity of more than 100 million m³, among which the Wangkuai Reservoir has the largest capacity, about 1.39 billion m³. The control area of these reservoirs accounts for 51% of the total catchment, with main functions flood control and irrigation, as well as power generation and aquaculture.
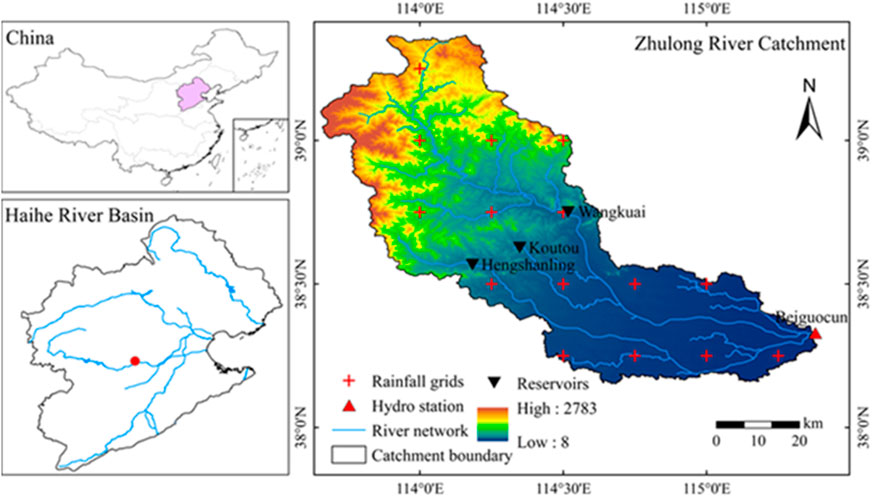
FIGURE 1. The terrain, drainage and stations distribution of the Zhulong River catchment.
Taking the Zhulong River catchment controlled by Beiguocun Hydrological Station as a study area, the DEM elevation data with a resolution of 30 m were obtained from the ASTER GDEM data set (http://www.gscloud.cn). The daily runoff data from 1967 to 2015 were extracted from the Hydrological Yearbook issued by the Ministry of Water Resources, China. Daily precipitation and daily average air temperature over 1967–2015 were collected from the China Meteorological Administration (CMA, http://cdc.cma.gov.cn). The evaporation was calculated using Penman’s formula based on the daily data set of surface climate from CMA, then the data of precipitation, runoff and evaporation were compiled and processed as inputs to drive the hydrological model.
Based on the study catchment and collected data sets, this paper investigated the variation trends of hydrometeorological variables (precipitation, temperature and runoff) from 1967 to 2015 by using Mann-Kendall rank test. Based on date sequence segment of streamflow, relationships between runoff and precipitation as well as hydrological processes under a same precipitation condition were investigated for different segmented periods. Finally, the GR4J model was applied to simulate daily and monthly discharge for periods with different degrees of human disturbance to reveal the impact of environmental changes on hydrological modelling. The research framework is shown in Figure 2.
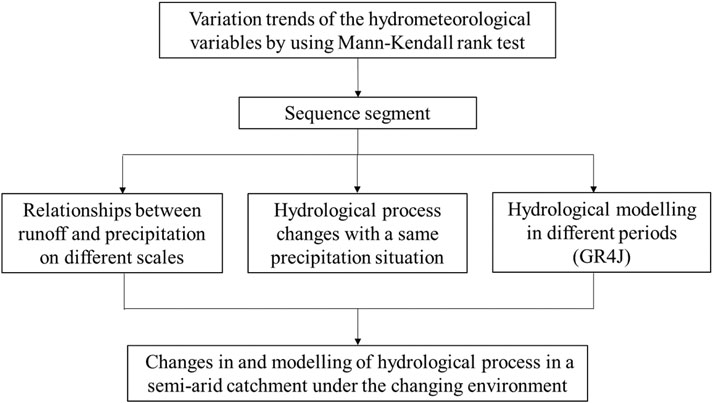
FIGURE 2. Research framework.
The Mann-Kendall rank test is a nonparametric method to evaluate trends in time series of climate and hydrological elements (Mann, 1945; Kendall, 1955). The method can effectively distinguish whether a certain time series is in a natural fluctuation or a certain trend without a specific distribution test and has been widely applied all over the world (Caloiero, 2017; Hu et al., 2020). The standardized statistic ZMK of the time series is defined (Yang Z. et al., 2017), with a positive value representing an upward trend, while a negative one indicating a downward trend. If
The GR4J model is a conceptual lumped hydrological model, proposed by French researchers (Oliveira et al., 1999). It has been verified in more than 400 regions with different climatic conditions after continuous improvement and development by hydrological scholars (Perrin et al., 2003; Moine et al., 2008). So far, the model has been widely used in water resources management, flood forecasting, and low flow forecasting in global catchments (Dhemi et al., 2010; Aufar and Sitanggang, 2020). The GR4J model is divided into two modules: production store and routing store, and both of them are calculated by a nonlinear reservoir. The main calculation process is shown in Figure 3.
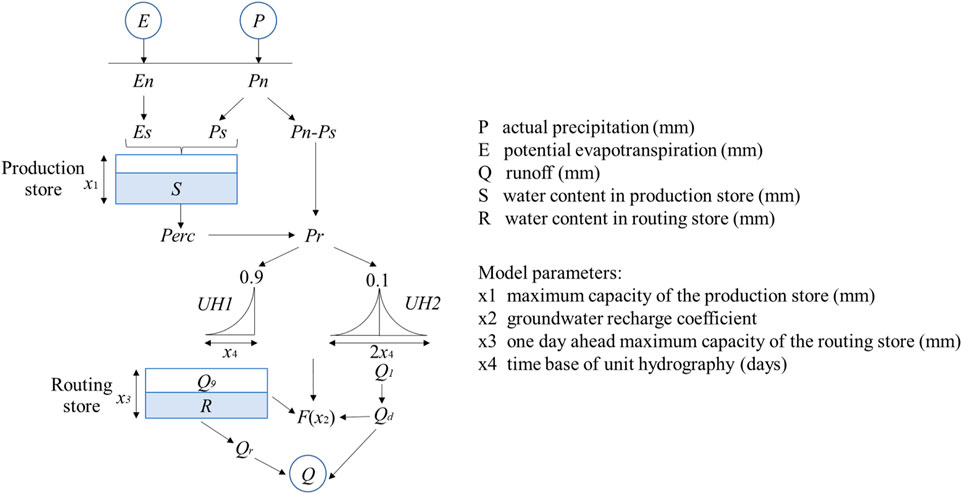
FIGURE 3. Structure of the GR4J model (Oliveira et al., 1999).
When calibrating the model, the value ranges of model parameters are determined, then different parameter sets are selected to run the model, and objective functions are calculated to reflect pros and cons of simulation results until the optimal. In order to better reflect the effect of hydrological model on runoff simulations, the Nash Sutcliffe Efficiency (NSE) and Relative Error (RE) are selected to describe the degree of agreement between simulated discharge series and observed one (Nash and Sutcliffe, 1970).
Precipitation and temperature are the most significant meteorological elements affecting the variations of runoff. The long-term variations of annual precipitation, air temperature over the catchment and the observed runoff at the Beiguocun hydrometric station during 1967–2015 are shown in Figure 4. The variation trends of annual precipitation, temperature and runoff were tested by using Mann-Kendall rank test and summarized in Table 1, in which slope coefficient (S) illustrates the magnitude of upward or downward trend of a series.
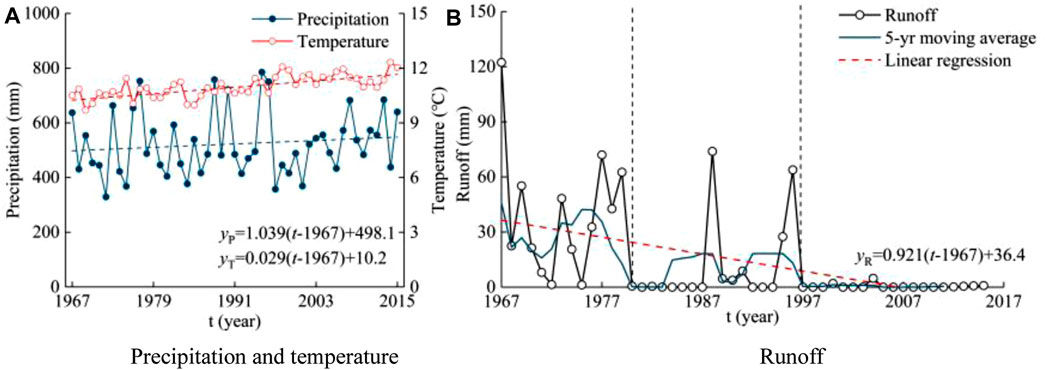
FIGURE 4. Long-term variations of annual precipitation, air temperature over the Zhulong River catchment (A) and observed runoff at the Beiguocun hydrometric station (B) during 1967–2015.
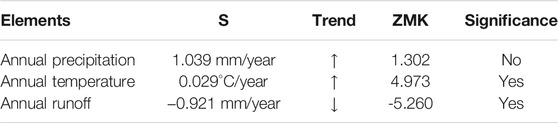
TABLE 1. Trend test results of annual precipitation, temperature and runoff during 1967–2015.
Figure 4 and Table 1 show that the annual temperature series exhibited a significant upward trend with a linear rising rate of 0.29°C/10 years, while annual precipitation series presented a slight upward trend (10.39 mm/10 years). Although the climate was getting warmer and wetter in the Zhulong River catchment during 1967–2015, the observed runoff series exhibited a significant downward trend with a linear decline rate of 9.21 mm/10 years probably due to the influence of human activities. According to the records in the local year book series, numerous water conservancy projects have been constructed successively in the Zhulong River catchment since 1970s for supporting industrial and agricultural development (Zheng et al., 2020). The continuous increase in water supply led to a decline in runoff series because of pumping water from the stream (Li et al., 2019). According to the degree of human activities disturbance and long-time variations of runoff, the research sequence is divided into three periods: the natural period of 1967–1979 in which the catchment kept a natural state with limited human activities; the moderate human impact period of 1980–1996 in which water conservancy projects were in operation and human activities was gradually intensified; the intensive human impact period of 1997–2015 in which, industry and agriculture were both highly developed, and human activities had a strong and stable impact.
In order to analyze the relationships between runoff and precipitation in the Zhulong River catchment under a changing environment, the runoff-precipitation scatter plots of the three periods on monthly and annual scales are shown in Figure 5. The average seasonal distribution of observed runoff in the three periods is shown in Figure 6.
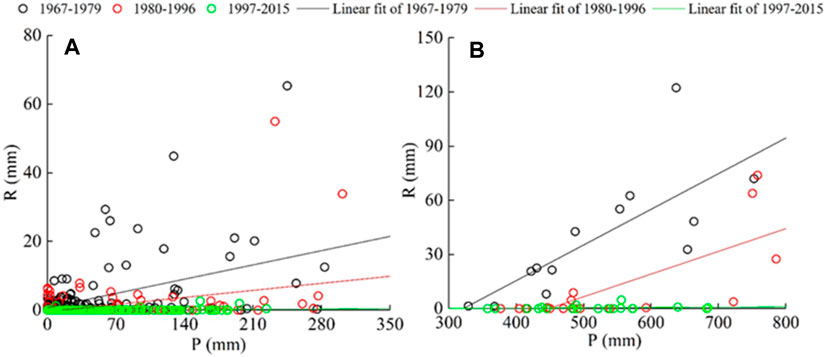
FIGURE 5. Relationships between runoff and precipitation on monthly (A) and annual (B) scales of the Zhulong River catchment during 1967–2015.

FIGURE 6. The average seasonal distributions of observed runoff in the Zhulong River catchment during 1967–2015.
Figure 5 shows that correlations between runoff and precipitation in natural period was higher than those in periods with human disturbance, the correlation decreased with the intensification of human activities. The runoff-precipitation scattered points moved downward with the passage of time, which meant that the runoff generated by a same magnitude of precipitation decreased continuously. Figure 6 shows that runoff concentrated in flood season from July to October for all the three periods. In natural period, runoff in flood season accounts for 76% of the annual total. Monthly runoff in human disturbed periods was much lower than that in natural period, particularly for the intensive human impact period. For August, runoff in moderate and intensive human impact periods decreased by 60.0 and 99.5% relative to that in natural period.
Human activities have not only changed the correlation between runoff and precipitation, but also altered the process of runoff yield and confluence. In different periods and under different intensities of human activities, the runoff processes are different even with a same precipitation situation. Research years are classified according to the percentage of precipitation anomalies (Kasei et al., 2010) from 1967 to 2015 (Figure 7), into wet years (PA > 15%), normal years (-15% < PA < 15%) and dry years (PA < -15%) (Zhu et al., 2019). There are four wet years, five normal years and four dry years in natural period, four wet years, nine normal years and four dry years in moderate human impact period, three wet years, 11 normal years and five dry years in intensive human impact period. Then typical wet, normal and dry years are selected based on the classification results in different periods to compare daily discharge processes, as is shown in Figure 8 (wet years are 1977, 1996, and 2013; normal years are 1978, 1991, and 2010; dry years are 1974, 1986, and 1999). The hydrological element information of typical years is shown in Table 2.
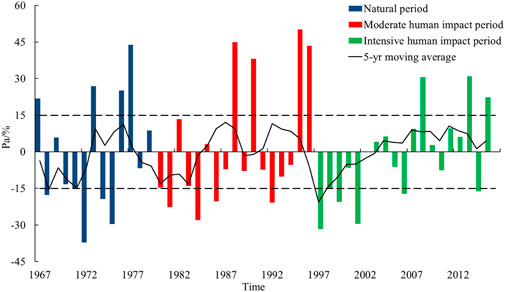
FIGURE 7. The percentage of precipitation anomalies during 1967–2015 in the Zhulong River catchment.
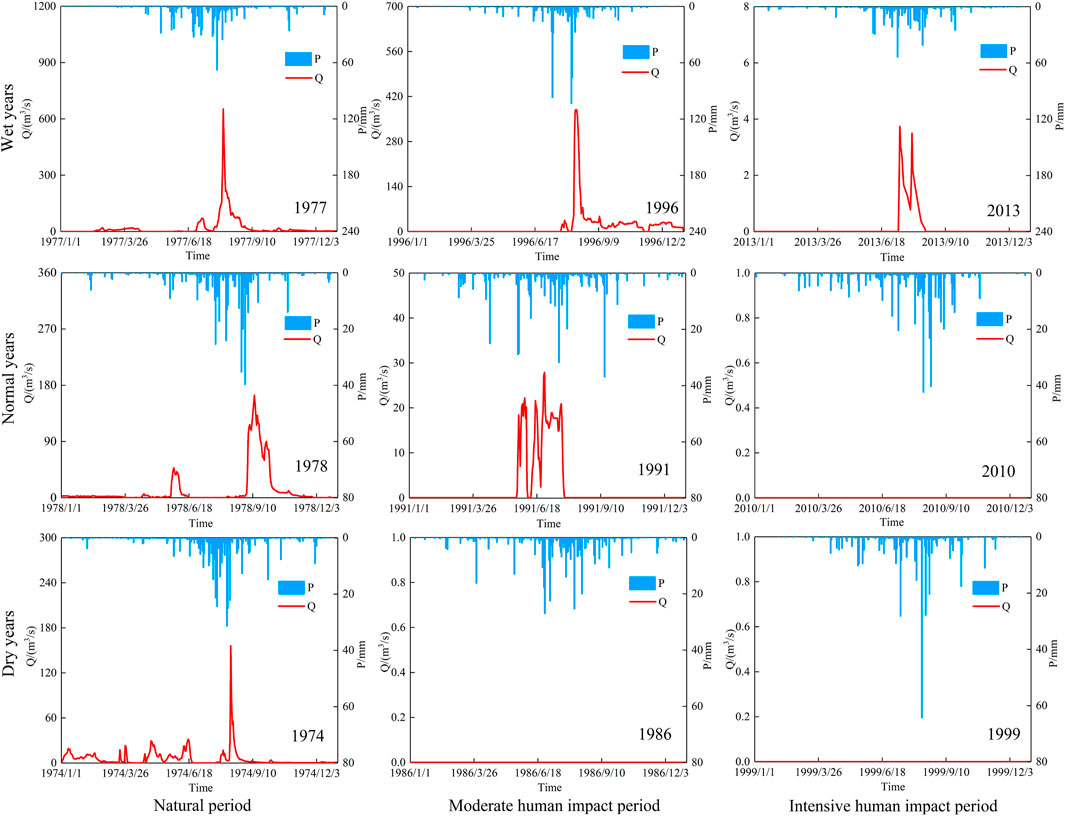
FIGURE 8. Daily discharge processes for typical years with a same precipitation situation in different periods.
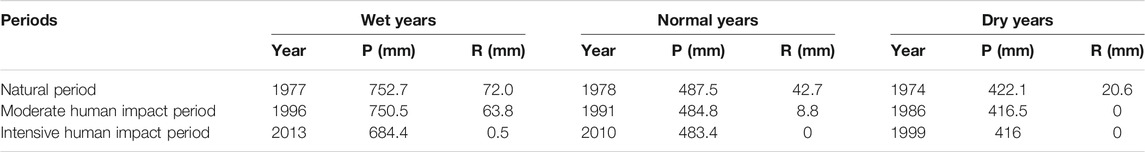
TABLE 2. Hydrological element information of typical years in different periods.
Figure 8 shows that the precipitation could always generated runoff in natural period, no matter in the wet year, normal year or dry year. During the moderate human impact period, the discharge process occurred only in wet and normal years. The flow ran dry for most time in intensive human impact period except for a certain runoff in the wet year. The peak discharge of typical years decreased with the intensification of human activities even under the same precipitation situation. The peak discharge of the wet year in natural period is 653 m³/s, it drops to 378 m³/s in moderate human impact period and 3.74 m³/s in intensive human impact period. In natural period, precipitation in dry season could produce obvious discharge (from January to June in 1974, 1977, and 1978), but the flow in dry season was almost zero in human disturbed periods and discharge processes tended to rise and fall steeply. Statistical results in Table 2 shows that the runoff of typical years varied greatly in different periods even though there was little difference in annual precipitation. Compared with the natural period, runoff in moderate and intensive human impact period decreased by 11.4 and 99.3% for wet years, 79.4 and 100% for normal years, 100 and 100% for dry years, respectively. Human activities had a greater impact in normal and dry years.
In order to evaluate the performance of streamflow simulation in the Zhulong River catchment under the complex changing environment, data series of the three periods were segmented into calibration and verification periods. Then the GR4J model was applied to simulate daily and monthly discharge. The performance of GR4J model in the Zhulong River catchment is presented in Table 3. Daily and monthly observed and simulated discharge is shown in Figure 9.
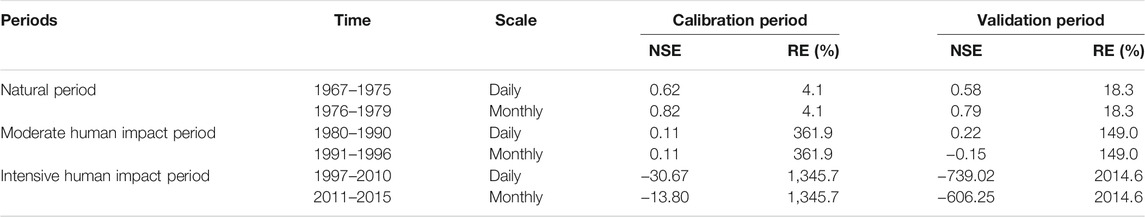
TABLE 3. Performance measurements of the GR4J model for daily and monthly discharge simulations in the Zhulong River catchment.
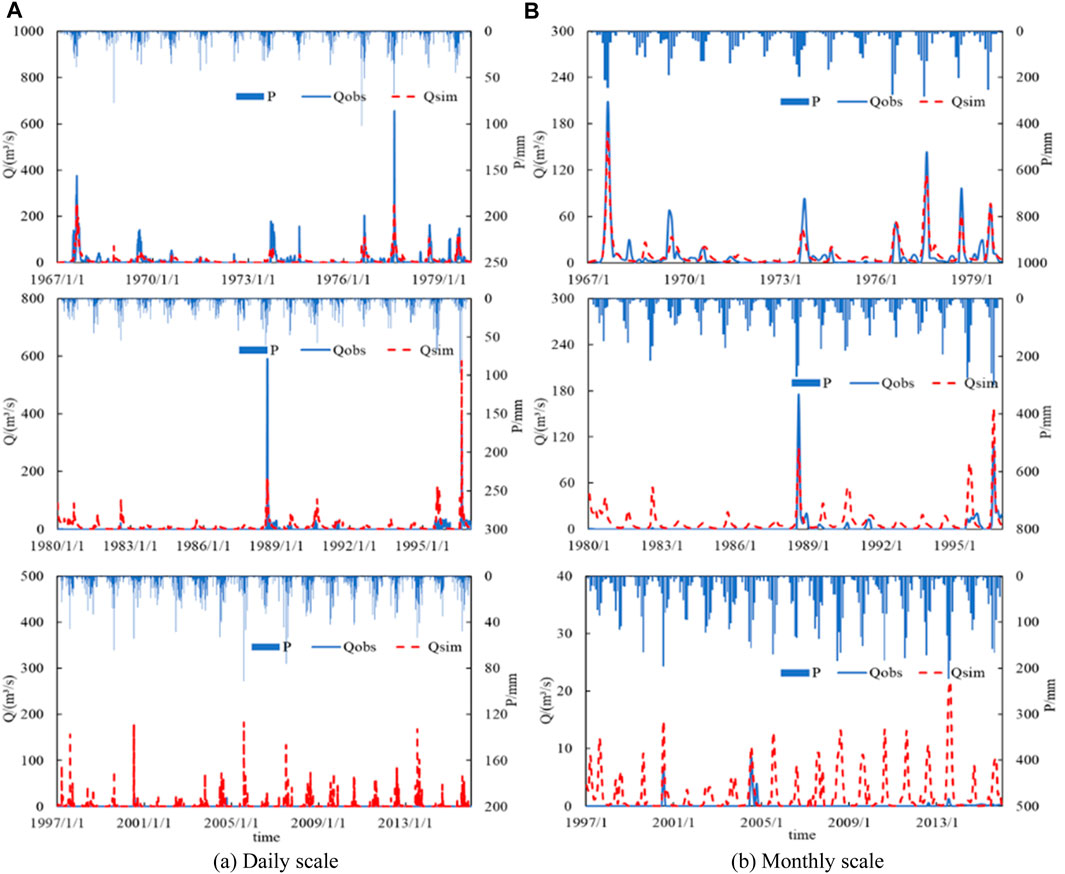
FIGURE 9. Daily (A) and monthly (B) simulated and observed discharge (m³/s) during the three periods in the Zhulong River catchment.
Tables 3 and Figure 9 show that the GR4J model could perform well in natural period (1967–1979) with daily and monthly NSEs of calibration period reaching 0.62 and 0.82, respectively, the REs were controlled within 5% on both scales. Additionally, the daily and monthly NSEs of verification period could reach 0.58 and 0.79, respectively, the REs were controlled within 20%. However, performance of the model was not satisfactory in human disturbed periods, with NSEs no greater than 0.3 during the moderate human impact period (1980–1996) and even less than zero during the intensive human impact period (1997–2015). Furthermore, the REs fluctuated with large amplitude and all exceeded 100% for both calibration and verification periods. During the moderate human impact period, the GR4J model could simulate a few flood peaks when precipitation and runoff were high enough, and discharge in the rest time was always over simulated. The observed discharge mostly approached zero during the intensive human impact period, meaning that the runoff had very little response to precipitation. This demonstrated that the GR4J model could not depict the laws of runoff yield and confluence any more under the complex changing environment. In Figure 9, most of the simulated peaks were smaller than observed ones in flood season during the natural period, which was more obvious on daily scale. This phenomenon also occurred in moderate human impact period even when there were only a few peaks being simulated. The main reason is that the Zhulong River is located in the semi-arid area, and runoff generation mechanism is dominated by the excess infiltration. While the GR4J, as a lumped hydrological model, cannot capture the changes in high intensity rainfall events accurately, resulting in smaller simulated peaks. All in all, the GR4J model may be useful for investigating streamflow simulations in the Zhulong River catchment during the natural period but gradually loses its applicability with the intensification of human activities.
Climate change and human activities are two dominant factors affecting the hydrological cycle. Climate change affects the total amount of water resources and their spatial and temporal distribution mainly through variations of precipitation and temperature. The impacts of human activities on runoff can be divided into direct ones caused by water resources development and utilization and indirect ones caused by changes in the underlying surface of the catchment. With upward trends in annual precipitation and temperature from 1967 to 2015, human activities might be a main reason for runoff decrease in the Zhulong River catchment.
Since the late 1960s, a number of large and small reservoirs (Wangkuai Reservoir and so on) have been successively established in the Zhulong River catchment. The reservoir regulation not only ensures water demand for industrial and agricultural development, but also affects the fluctuation of natural runoff. The inflow changes of Wangkuai Reservoir during 1967–2015 is shown in Figure 10.
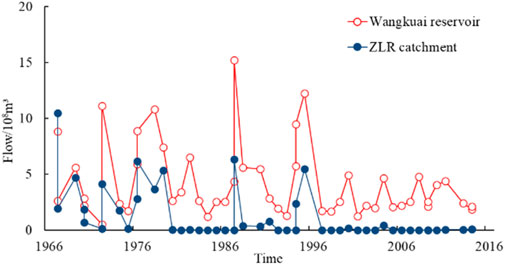
FIGURE 10. Variations of annual flow (108 m3) in the Wangkuai reservoir and Beiguocun hydrometric station.
Figure 10 shows that although the Wangkuai reservoir is located in the upstream of Zhulong River and its controlled area only accounts for 44% of the total catchment, the inflow of the reservoir during 1967–2015 is always larger than that of Beiguocun hydrometric station. The reservoir plays a crucial part in regulating natural discharge of the catchment, with flood control in high flow years and water storage in low flow years, the regulation in low flow years is more significant in the Zhulong River catchment. During the intensive human impact period (1997–2015), when flow of the catchment always ran dry, the stored water in reservoirs ensured normal production and life of this area. As one of the main agricultural areas in North China Plain, the Zhulong River catchment is mainly covered by farmland and grassland. During the study period, with decrease of runoff in this catchment, water area shrank gradually, resulting in the changes of agricultural production structure (paddy field area decreased while dry land area increased). Meanwhile, with the acceleration of urbanization, impervious area (urban and rural land) in this catchment increased significantly, shortening the confluence time of runoff.
With the influence of human activities, the contradiction between supply and demand of water resources in the Zhulong River catchment and even the whole Hai River basin gradually intensified. The annual water resources and water consumption of Hai River basin during the intensive human impact period (1997–2015) show that although industrial structure has been optimized and water use efficiency has been improved since the 21th century, the amount of water resources is always less than water consumption, with years in this period mostly normal and low flow years except for a high flow year 2012. Since 2003, water for natural environment has been included into the statistical category of water resources in China, and has grown at a rate of 170 million m³ per year in Hai River basin, which further exacerbates water stress in this area. During the intensive human impact period, the Hai River basin cannot achieve self-sufficiency in water resources, and it meets the daily needs of production and life mainly through inter-basin water transfer projects (the Yellow River Diversion Project and South-to-North Water Diversion Project), the Zhulong River catchment is the same. In general, the influence of human activities on runoff in the Zhulong River catchment is mainly reflected in reservoir regulation, land use change and water resources utilization. In addition, due to severe shortage of water resources, groundwater in this area has been seriously overexploited, which results in a decline in groundwater level, as well as a reduction of runoff in this catchment.
The influence of human activities on runoff was limited during the natural period, so the GR4J model could capture main features of hydrological processes and obtain a good simulation accuracy for the Zhulong River catchment. However, the intensification of human activities affects not only hydrological regimes, but also hydrological modelling, as it complicates the regional water cycle process. Tests of challenges to hydrological modelling in semi-arid catchments under the changing environment should be enhanced in further studies.
The annual precipitation and temperature both presented upward tends by Mann-Kendall rank test, with rising rates 10.39 mm/10 years and 0.29°C/10 years respectively, while the annual runoff exhibited a significant downward trend with a decline rate of 9.21 mm/10 years probably due to the influence of human activities. According to the degree of human disturbance and long-time variations of runoff, the research sequence was divided into three periods (natural period from 1967 to 1979, moderate human impact period from 1980 to 1996 and intensive human impact period from 1997 to 2015) to investigate the changes in hydrological process and hydrological modelling under the changing environment.
Correlations between runoff and precipitation in natural period were higher than those in periods with human disturbance on monthly and annual scales. The correlation decreased with the intensification of human activities. Runoff concentrated in flood season from July to October for all the three periods. Monthly runoff in human disturbed periods was much lower than that in natural period, particularly for the intensive human impact period. Both annual runoff and peak discharge in human disturbed periods decreased relative to those in natural period with a same precipitation situation due to the environmental changes. Human activities had a greater impact in normal and dry years.
The GR4J model performed well for streamflow simulations in the Zhulong River catchment during the natural period. However, the model’s performance was not satisfactory in periods with human disturbance. During the moderate human impact period, the GR4J model could still catch several flood peaks, but when came to the intensive human impact period, the model completely lost its applicability.
Changes of underlying surface have altered the confluence process in the catchment, and human activities like water resources utilization and water conservancy projects have a more significant and direct effect on runoff reduction, which presents more challenges for hydrological simulations in semi-arid areas. It also raises higher requirements for hydrological models to quickly assess water resources under the changing environment with complex human disturbance.
The original contributions presented in the study are included in the article/supplementary material, further inquiries can be directed to the corresponding author.
JZ and GW designed the study and analyzed results and improved the manuscript. YL performed calculations and drafted the paper. XZ collected hydro-meteorological data, and QY reviewed the document and edited the final version.
Project supported by the National Key Research and Development Program of China (No.2016YFA0601501), the National Natural Science Foundation of China (Grant Nos 41830863, 51879162, 51609242, 52079026, 51779146, 41601025) and The Belt and Road Fund on Water and Sustainability of the State Key Laboratory of Hydrology-Water Resources and Hydraulic Engineering (Grant No. 2019nkzd02).
The authors declare that the research was conducted in the absence of any commercial or financial relationships that could be construed as a potential conflict of interest.
All claims expressed in this article are solely those of the authors and do not necessarily represent those of their affiliated organizations, or those of the publisher, the editors and the reviewers. Any product that may be evaluated in this article, or claim that may be made by its manufacturer, is not guaranteed or endorsed by the publisher.
Aufar, Y., and Sitanggang, I. S. (2020). Parameter Optimization of Rainfall-Runoff Model GR4J Using Particle Swarm Optimization on Planting Calendar. Int. J. Adv. Sci. Eng. Inf. Tech. 10 (6), 2575–2581. doi:10.18517/ijaseit.10.6.9110
Boumenni, H., Bachnou, A., and Alaa, N. E. (2017). The Rainfall-Runoff Model GR4J Optimization of Parameter by Genetic Algorithms and Gauss-Newton Method: Application for the Watershed Ourika (High Atlas, Morocco). Arab J. Geosci. 10 (15), 343. doi:10.1007/s12517-017-3086-x
Bugan, R., García, C. L., Jovanovic, N., Teich, I., Fink, M., and Dzikiti, S. (2020). Estimating Evapotranspiration in a Semi-arid Catchment: A Comparison of Hydrological Modelling and Remote-Sensing Approaches. Water SA 46 (2), 158–170. doi:10.17159/wsa/2020.v46.i2.8231
Charles, S. P., Chiew, F. H. S., Potter, N. J., Zheng, H., Fu, G., and Zhang, L. (2020). Impact of Downscaled Rainfall Biases on Projected Runoff Changes. Hydrol. Earth Syst. Sci. 24 (6), 2981–2997. doi:10.5194/hess-24-2981-2020
Cui, H., Xiao, W., Zhou, Y., Hou, B., Lu, F., and Pei, M. (2019). Spatial and Temporal Variations in Vegetation Cover and Responses to Climatic Variables in the Daqing River Basin, North China. J. Coastal Res. 93 (sp1), 450–459. doi:10.2112/si93-059.1
Dai, A., Zhao, T., and Chen, J. (2018). Climate Change and Drought: a Precipitation and Evaporation Perspective. Curr. Clim. Change Rep. 4 (3), 301–312. doi:10.1007/s40641-018-0101-6
Dhemi, H., Muljana, W., and Munajat, C. M. (2010). “Rainfall-Runoff Modeling of Citarum Hulu River Basin by Using GR4J,” in Paper presented at the World Congress on Engineering, London, June 30–July 2, 2010.
Du, J., Zheng, D., Xu, Y., Hu, S., and Xu, C. (2016). Evaluating Functions of Reservoirs′ Storage Capacities and Locations on Daily Peak Attenuation for Ganjiang River Basin Using Xinanjiang Model. Chin. Geogr. Sci. 26 (6), 789–802. doi:10.1007/s11769-016-0838-6
Ghimire, U., Agarwal, A., Shrestha, N. K., Daggupati, P., Srinivasan, G., and Than, H. H. (2020). Applicability of Lumped Hydrological Models in a Data-Constrained River Basin of Asia. J. Hydrol. Eng. 25 (8), 05020018. doi:10.1061/(ASCE)HE.1943-5584.0001950
Grigg, A. H., and Hughes, J. D. (2018). Nonstationarity Driven by Multidecadal Change in Catchment Groundwater Storage: A Test of Modifications to a Common Rainfall-Run-Off Model. Hydrol. Process. 32 (24), 3675–3688. doi:10.1002/hyp.13282
Hou, B., Jiang, C., and Sun, O. J. (2020). Differential Changes in Precipitation and Runoff Discharge during 1958-2017 in the Headwater Region of Yellow River of China. J. Geogr. Sci. 30 (9), 1401–1418. doi:10.1007/s11442-020-1789-5
Hu, Z., Liu, S., Zhong, G., Lin, H., and Zhou, Z. (2020). Modified Mann-Kendall Trend Test for Hydrological Time Series under the Scaling Hypothesis and its Application. Hydrol. Sci. J. 65 (14), 2419–2438. doi:10.1080/02626667.2020.1810253
Jahfer, S., Vinayachandran, P. N., and Nanjundiah, R. S. (2020). The Role of Amazon River Runoff on the Multidecadal Variability of the Atlantic ITCZ. Environ. Res. Lett. 15 (5), 054013. doi:10.1088/1748-9326/ab7c8a
Kasei, R., Diekkrüger, B., and Leemhuis, C. (2010). Drought Frequency in the Volta Basin of West Africa. Sustain. Sci. 5 (1), 89–97. doi:10.1007/s11625-009-0101-5
Krysanova, V., Hattermann, F. F., and Kundzewicz, Z. W. (2020). How Evaluation of Hydrological Models Influences Results of Climate Impact Assessment-An Editorial. Climatic Change 163, 1121–1141. doi:10.1007/s10584-020-02927-8
Leng, G., Tang, Q., Huang, M., and Leung, L.-y. R. (2015). A Comparative Analysis of the Impacts of Climate Change and Irrigation on Land Surface and Subsurface Hydrology in the North China Plain. Reg. Environ. Change 15 (2), 251–263. doi:10.1007/s10113-014-0640-x
Li, J., Ma, Q., Tian, Y., Lei, Y., Zhang, T., and Feng, P. (2019). Flood Scaling under Nonstationarity in Daqinghe River basin, China. Nat. Hazards 98 (2), 675–696. doi:10.1007/s11069-019-03724-y
Li, J., Sun, H., and Feng, P. (2016). How to Update Design Floods after the Construction of Small Reservoirs and Check Dams: A Case Study from the Daqinghe River basin, China. J. Earth Syst. Sci. 125 (4), 795–808. doi:10.1007/s12040-016-0688-8
Liang, S. Q., Wang, W. S., Zhang, D., Li, Y. Q., and Wang, G. Q. (2020). Quantifying the Impacts of Climate Change and Human Activities on Runoff Variation: Case Study of the Upstream of Minjiang River, China. J. Hydrol. Eng. 25 (9). doi:10.1061/(ASCE)HE.1943-5584.0001980
Liu, L., Xu, Y. P., Pan, S. L., and Bai, Z. X. (2019). Potential Application of Hydrological Ensemble Prediction in Forecasting Floods and its Components over the Yarlung Zangbo River basin, China. Hydrol. Earth Syst. Sci. 23 (8), 3335–3352. doi:10.5194/hess-23-3335-2019
Maier, N., and Dietrich, J. (2016). Using SWAT for Strategic Planning of Basin Scale Irrigation Control Policies: a Case Study from a Humid Region in Northern Germany. Water Resour. Manage. 30 (9), 3285–3298. doi:10.1007/s11269-016-1348-0
Mann, H. B. (1945). Nonparametric Tests against Trend. Econometrica 13 (3), 245–259. doi:10.2307/1907187
Moine, N. L., Andreassian, V., and Mathevet, T. (2008). Confronting Surface- and Groundwater Balances on the La Rochefoucauld-Touvre Karstic System (Charente, France). Water Resour. Res. 44 (3), 893–897. doi:10.1029/2007wr005984
Molina-Navarro, E., Hallack-Alegría, M., Martínez-Pérez, S., Ramírez-Hernández, J., Mungaray-Moctezuma, A., and Sastre-Merlín, A. (2016). Hydrological Modeling and Climate Change Impacts in an Agricultural Semiarid Region. Case Study: Guadalupe River basin, Mexico. Agric. Water Manage. 175, 29–42. doi:10.1016/j.agwat.2015.10.029
Montanari, A., Young, G., Savenije, H. H. G., Hughes, D., Wagener, T., Ren, L. L., et al. (2013). "Panta Rhei-Everything Flows": Change in Hydrology and Society-The IAHS Scientific Decade 2013-2022. Hydrol. Sci. J. 58 (6), 1256–1275. doi:10.1080/02626667.2013.809088
Musuuza, J. L., Gustafsson, D., Pimentel, R., Crochemore, L., and Pechlivanidis, I. (2020). Impact of Satellite and In Situ Data Assimilation on Hydrological Predictions. Remote Sensing 12 (5), 811. doi:10.3390/rs12050811
Nash, J. E., and Sutcliffe, J. V. (1970). River Flow Forecasting through Conceptual Models Part I - A Discussion of Principles. J. Hydrol. 10, 282–290. doi:10.1016/0022-1694(70)90255-6
Oliveira, N. D., Yang, X. L., Makhlouf, Z., and Michel, C. (1999). GR3J: a Daily Watershed Model with Three Free Parameters. Hydrol. Sci. J. 44 (2), 263–277.
Omer, A., Elagib, N. A., Zhuguo, M., Saleem, F., and Mohammed, A. (2020). Water Scarcity in the Yellow River Basin under Future Climate Change and Human Activities. Sci. Total Environ. 749, 141446. doi:10.1016/j.scitotenv.2020.141446
Perrin, C., Michel, C., and Andreassian, V. (2003). Improvement of a Parsimonious Model for Streamflow Simulation. J. Hydrol. 279 (1-4), 275–289. doi:10.1016/s0022-1694(03)00225-7
Sezen, C., and Partal, T. (2019). The Utilization of a GR4J Model and Wavelet-Based Artificial Neural Network for Rainfall-Runoff Modelling. Water Sci. Technol. 19 (5-6), 1295–1304. doi:10.2166/ws.2018.189
Song, X. M., Zhang, J. Y., Zhan, C. S., and Liu, C. Q. (2013). Review for Impacts of Climate Change and Human Activities on Water Cycle. J. Hydraulic Eng. 44 (7), 779–190. (in Chinese).
Sun, F., Mejia, A., Zeng, P., and Che, Y. (2019). Projecting Meteorological, Hydrological and Agricultural Droughts for the Yangtze River basin. Sci. Total Environ. 696, 134076. doi:10.1016/j.scitotenv.2019.134076
Thatch, L. M., Gilbert, J. M., and Maxwell, R. M. (2020). Integrated Hydrologic Modeling to Untangle the Impacts of Water Management during Drought. Groundwater 58 (3), 377–391. doi:10.1111/gwat.12995
Caloiero, T. (2017). Trend of Monthly Temperature and Daily Extreme Temperature during 1951–2012 in New Zealand. Theor. Appl. Climatology 129 (1-2), 111–127. doi:10.1007/s00704-016-1764-3
Turner, S. W. D., Doering, K., and Voisin, N. (2020). Data‐Driven Reservoir Simulation in a Large‐Scale Hydrological and Water Resource Model. Water Resour. Res. Available at: https://agupubs.onlinelibrary.wiley.com/doi/epdf/10.1029/2020WR027902.
Varentsova, N. A., Kireeva, M. B., Frolova, N. L., Kharlamov, M. A., Ilich, V. P., and Sazonov, A. A. (2020). Forecasting Water Inflow into the Tsimlyansk Reservoir during Spring Flood under Current Climate Conditions: Problems and Reproducibility. Water Resour. 47 (6), 953–967. doi:10.1134/s0097807820060159
Wang, H., Mei, C., Liu, J., and Shao, W. (2018). A New Strategy for Integrated Urban Water Management in China: Sponge City. Sci. China Technol. Sci. 61 (3), 317–329. doi:10.1007/s11431-017-9170-5
Wang, W., Zhang, Y., and Tang, Q. (2020). Impact Assessment of Climate Change and Human Activities on Streamflow Signatures in the Yellow River Basin Using the Budyko Hypothesis and Derived Differential Equation. J. Hydrol. 591, 125460. doi:10.1016/J.JHYDROL.2020.125460
Wang, Y. X., Li, J. Z., Zhang, T., and Wang, B. (2019). Changes in Drought Propagation under the Regulation of Reservoirs and Water Diversion. Theor. Appl. Climatol. 138 (1-2), 701–711. doi:10.1007/s00704-019-02839-3
Wilkinson, M. E., Addy, S., Quinn, P. F., and Stutter, M. (2019). Natural Flood Management: Small-Scale Progress and Larger-Scale Challenges. Scottish Geograph. J. 135 (1-2), 23–32. doi:10.1080/14702541.2019.1610571
Yang, P., Xia, J., Zhang, Y., and Hong, S. (2017). Temporal and Spatial Variations of Precipitation in Northwest China during 1960-2013. Atmos. Res. 183, 283–295. doi:10.1016/j.atmosres.2016.09.014
Yang, Z., Zhou, Y., Wenninger, J., Uhlenbrook, S., Wang, X., and Wan, L. (2017). Groundwater and Surface-Water Interactions and Impacts of Human Activities in the Hailiutu Catchment, Northwest China. Hydrogeol J. 25 (5), 1341–1355. doi:10.1007/s10040-017-1541-0
Zeng, L., Xiong, L., Liu, D., Chen, J., and Kim, J.-S. (2019). Improving Parameter Transferability of GR4J Model under Changing Environments Considering Nonstationarity. Water 11 (10), 2029. doi:10.3390/w11102029
Zheng, X. T., Cheng, W. Q., Liu, Y. Y., Pang, L. J., Guo, W. Y., and Ran, H. D. (2020). Inflow Runoff Evolution and Analysis of Their Influencing Factors under Connection of Wangkuai and Xidayang Reservoirs. Water Resour. Power 38 (3), 21–24. (in Chinese).
Keywords: the Zhulong River catchment, semi-arid catchment, human activities, hydrological process, GR4J model, hydrological modelling
Citation: Liu Y, Zhang J, Yang Q, Zhou X and Wang G (2021) Changes in and Modelling of Hydrological Process for a Semi-Arid Catchment in the Context of Human Disturbance. Front. Earth Sci. 9:759534. doi: 10.3389/feart.2021.759534
Received: 16 August 2021; Accepted: 14 September 2021;
Published: 29 September 2021.
Edited by:
Yulei Xie, Guangdong University of Technology, ChinaReviewed by:
Qin Guanghua, Sichuan University, ChinaCopyright © 2021 Liu, Zhang, Yang, Zhou and Wang. This is an open-access article distributed under the terms of the Creative Commons Attribution License (CC BY). The use, distribution or reproduction in other forums is permitted, provided the original author(s) and the copyright owner(s) are credited and that the original publication in this journal is cited, in accordance with accepted academic practice. No use, distribution or reproduction is permitted which does not comply with these terms.
*Correspondence: Guoqing Wang, Z3F3YW5nQG5ocmkuY24=
Disclaimer: All claims expressed in this article are solely those of the authors and do not necessarily represent those of their affiliated organizations, or those of the publisher, the editors and the reviewers. Any product that may be evaluated in this article or claim that may be made by its manufacturer is not guaranteed or endorsed by the publisher.
Research integrity at Frontiers
Learn more about the work of our research integrity team to safeguard the quality of each article we publish.