 Qian Tian
 Xiaomin Fang2,3*
 Yan Bai
 Chihao Chen
 Juzhi Hou
 Tao Zhang
- 1Energy Industry Green and Low-Carbon Development Soft Science Research Base, Yan’an University, Yan’an, China
- 2Cenozoic Environment Group, State Key Laboratory of Tibetan Plateau Earth System, Resources and Environment (TPESRE), Institute of Tibetan Plateau Research, Chinese Academy of Sciences, Beijing, China
- 3College of Resource and Environment, University of Chinese Academy of Sciences, Beijing, China
- 4Alpine Paleoecology and Human Adaptation Group, State Key Laboratory of Tibetan Plateau Earth System, Resources and Environment (TPESRE), Institute of Tibetan Plateau Research, Chinese Academy of Sciences, Beijing, China
- 5School of Earth Sciences and Key Laboratory of Mineral Resources in Western China (Gansu Province), Lanzhou University, Lanzhou, China
The northeastern Tibetan Plateau (NE TP) has long been thought to be the last part of the Plateau to be raised, but this assumption has been challenged by recent analyses of fossil leaf energy, which have pointed to the possibility that the present surface altitude of ∼3,000 m above sea level (asl) in the Qaidam Basin (QB) was attained during the Oligocene. Here, for the first time, we present a record of glycerol dialkyl glycerol tetraethers (GDGTs) from a well-dated Cenozoic section in the QB. This record appears to demonstrate that the mean annual average paleotemperature of the QB was 28.4 ± 2.9°C at ∼18.0 Ma. This would suggest that the paleoelevation of the QB was only ∼1,488 m asl at that time and that a ∼1,500 m uplift was attained afterwards, in agreement with the massive shortening of the QB and the rapid drying of inland Asia since the late Miocene.
Introduction
The tectonic collision between India and Asia resulted in the formation of the Himalayan orogen, the largest and best known orogen in the world. The successive geologic evolution of the Himalayan orogen eventually led to the formation of the TP (Dewey et al., 1988; Yin and Harrison, 2000). At present, in contrast to the southern and central TP, where a variety of modern paleoaltimetries have been applied to reconstruct generally high paleoelevation during the Eocene (Rowley and Currie, 2006; Wang et al., 2008; Ding et al., 2014), the topographic history of the NE TP has been less well studied, with far fewer well-dated archives compiled (Zhuang et al., 2014; Song et al., 2020). This region has long been thought to have been uplifted much later, mostly during the Plio-Quaternary (Tapponnier et al., 2001), or since the late Miocene (Fang et al., 2005, 2007; Li et al., 2014). This process is thought to have exerted a significant impact on the East Asian Monsoon (EAM) and the aridification of Central Asia (Liu et al., 2015). Very notable is the recent finding of fossil leaves in the QB, indicating that the central part of the NE TP, i.e., the QB, was already at its present height (∼3,000 m asl) in the Oligocene (Song et al., 2020). This challenges the tectonic model and dry climate predictions above and highlights a large discrepancy with a study that reconstructed much lower topographies using the hydrogen isotopes of n-alkanes (Zhuang et al., 2014).
The huge QB received very thick and continuous deposits and therefore provides a great opportunity for detecting the Cenozoic uplift history of NE TP (Figures 1A,B). One the other hand, branched glycerol dialkyl glycerol tetraethers (brGDGTs), a suit of membrane lipids produced by unknown bacteria, offer a potential tool for paleoaltimetry reconstruction (Decelles et al., 2016; Bai et al., 2018; Deng and Jia, 2018; Chen et al., 2019, 2020; Zhuang et al., 2019). This is due to the fact that brGDGTs are sensitive to temperature variation (Weijers et al., 2007), while temperature decreases with increasing altitude. Significant relationships between brGDGT distributions and altitude have been observed along several altitudinal gradients on the TP (Peterse et al., 2009; Deng et al., 2016; Li X. M. et al., 2017; Wang et al., 2017; Bai et al., 2018; Feng et al., 2019).
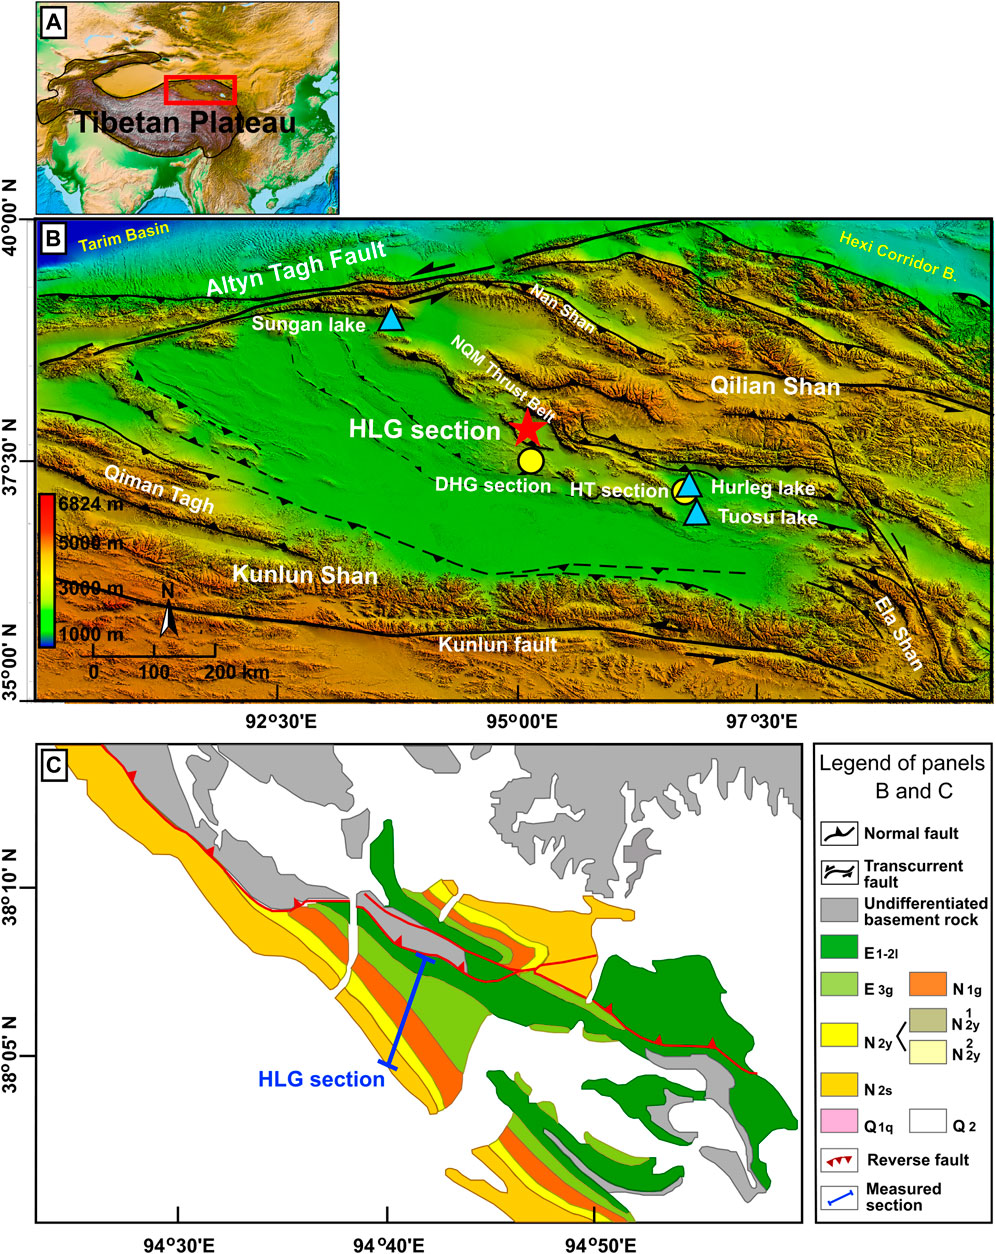
FIGURE 1. (A,B) The map of the northern Tibetan Plateau (TP) showing the locations studied and mentioned: the Hongliugou (HLG) section, Dahonggou (DHG) section, Huaitoutala (HT) section, Sugan Lake, Hurleg Lake, and Tuosu Lake in the Qaidam Basin (QB); (C) the simplified geological map of the northwestern QB (modified from Wu et al., 2021), E1-2L, Lulehe Formation (early Eocene); E3g, Xia Ganchaigou Formation (middle-late Eocene); N1g, Shang Ganchaigou Formation (Oligocene); N2y, Youshashan Formation including N12y, Xia Youshashan Formation (early-middle Miocene) and N22y, Shang Youshashan Formation (middle-late Miocene); N2s, Shizigou Formation (late Miocene-Pliocene); Q1q, Qigequan Formation (Pliocene-Pleistocene); Q2, late Pleistocene and Holocene.
Here, we present new GDGTs data from fossils and precisely paleomagnetically dated Cenozoic sedimentary rocks identified in the Hongliugou (HLG) section of the QB (Figure 1B), and quantitatively reconstruct the paleotemperature and the paleoelevation of the early Miocene in the QB.
Geological Setting
The QB (35°55′ - 39°10′ N, 90°00' - 98°20′ E; ∼58,000 km2) is the largest rhombic intermontane basin on the NE TP (Figure 1A). The QB has an average elevation of ca. 3,000 m asl and is bounded by the Kunlun Mountains, Altyn Mountains, Qilian Mountains, and Ela Mountains (elevations ∼4,500–5,500 m asl) to the south, west, north, and east, respectively (Figure 1B). The QB is covered by thick deposits of Cenozoic sediments of up to 12,000 m in depth. These have recorded a detailed history of plateau uplift, basin evolution, and climate change, making this the ideal area to reveal the growth of the TP and the mechanisms controlling this growth, and to test tectonic models. It has generally been believed that the QB was formed in response to the collision of the Indian subcontinent with Asia; this area has been subjected to continuous compression deformation and sink, although much of the shortening and uplift have occurred since the late Miocene–Pliocene (Zhou et al., 2006; Fang et al., 2007; Bao et al., 2017).
The QB lies in a continental desert climatic zone. The mean annual average temperature (MAAT) and mean annual average precipitation (MAAP) are 3.5°C and <20–200 mm, respectively, but the mean annual average evaporation is >2,000 mm. The vegetation in the QB is very sparse and mostly of desert species, e.g., Ephedra przewalskii, Haloxylon ammodendron, Salsola collina, Kalidium foliatum, Sympegma regelii, Ceratoides lateens, Nitraria roborowskii, N. tangutorum, Tamarix chinensis, and Artemisia spp. (Zhou et al., 1990). The higher-elevation slopes on the QB’s surrounding mountains are covered by shrubs adapted to cold, windy, semi-arid conditions, chiefly Berberis and Salix amnematchinesis (Wu, 1995). The QB’s soils are also desert soils (National Soil Survey Office, 1998).
The Cenozoic stratigraphy is almost completely exposed along the northern flank of the QB, where the HLG section (38°07.50′ N, 94°41.07′E) is one of the most representative outcrops (Figure 1B). It contains sediments ranging from the Eocene Lulehe Formation to the Quaternary Qigequan Formation, with a total thickness of 5,030 m (Figure 1C, Zhang et al., 2006; Fang et al., 2019; Wu et al., 2021). High-resolution paleomagnetism has dated the formation of the section to between 54.2 Ma and 1.8 Ma (Zhang et al., 2006; Fang et al., 2019; Figures 2A–F).
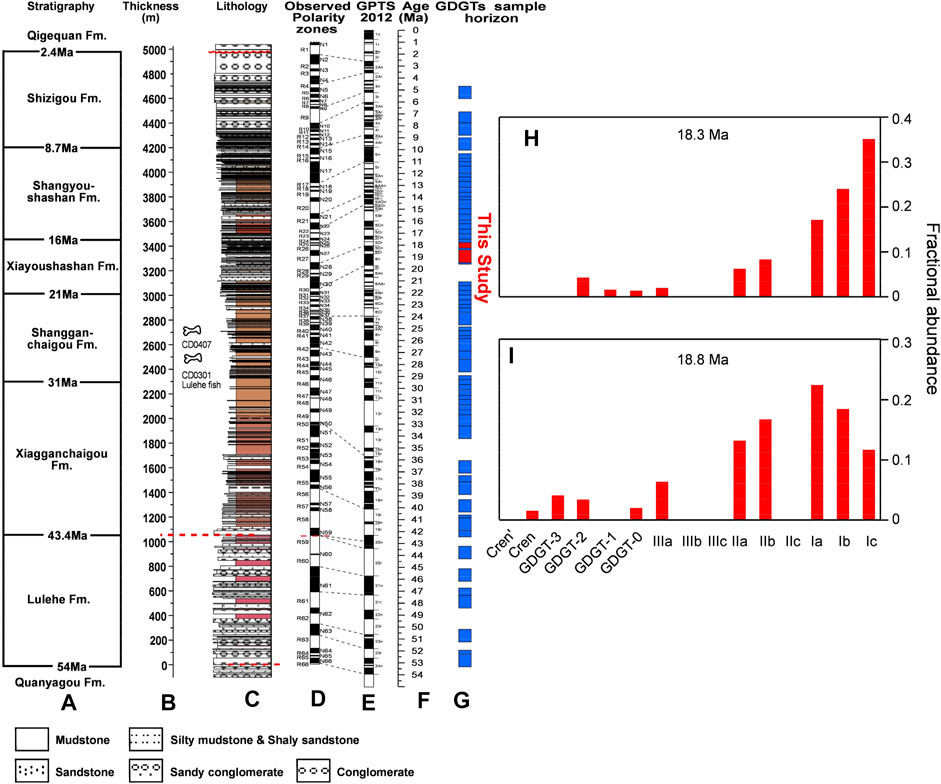
FIGURE 2. (A–G) Stratigraphy, thickness, lithology, magnetostratigraphy (Zhang et al., 2006; Gradstein and Ogg, 2012; Fang et al., 2019) and the GDGT sample horizon (the blue square is the horizon of the GDGTs not obtained, and the red is the two sample horizons of the compound obtained); (H,I) the distribution of GDGTs for 18.3 Ma and 18.8 Ma in the HLG Section.
Materials and Methods
Samples were freeze-dried, ground to fine powder (100 mesh), and homogenized. As for their lithology and ages, they are shown in Figures 2C,F; Supplementary Table S1. Then, to perform Soxhlet extraction, aliquots of samples (∼100 g) were used with dichloromethane (DCM):methanol (MeOH) (2:1, v/v) at 60°C for 72 h. The total lipid extracts were classified into polar and nonpolar fractions using n-hexane (HEX)/DCM (9:1, V:V) and DCM/MeOH (1:1, V:V) by adopting column chromatography with a neutral alumina column over activated silica gel (100–200 mesh). The polar fraction was re-dissolved in n-hexane:isopropanol (99:1, v/v), followed by being filtered through a 0.2-μm PTFE filter for GDGT analysis.
The GDGTs analysis was conducted at the Key Laboratory of Tibetan Environment Changes and Land Surface Processes, the Chinese Academy of Sciences, when an Agilent 1,200 High Performance Liquid Chromatography device coupled to an Agilent 6,100 Mass Spectrometry device with Atmospheric Pressure Chemical Ionization (HPLC-APCI-MS) is adopted. To be specific, normal phase chromatography (Grace Prevail Cyano, 150 mm × 2.1 mm, 3.0 μm) was applied at 40°C, and there was the injection volume of 20 μl and a flow rate of 0.2 ml/min to achieve the separation. Besides, mobile phase A was n-hexane, while B was n-hexane/isopropanol (9:1, v/v), when an elution gradient was adopted following Yang et al. (2014). Furthermore, to enhance detection sensitivity and reproducibility, a Single Ion Monitoring (SIM) mode was established at (M + H) + values of 1,302, 1,300, 1,298, 1,296, 1,292, 1,050, 1,048, 1,046, 1,036, 1,034, 1,032, 1,022, 1,020, and 1,018 (see Figure 3 for GDGT structures). We used the integral area of each brGDGTs component to calculate the relevant proxies, and the brGDGTs indices used in this study are calculated as follows:
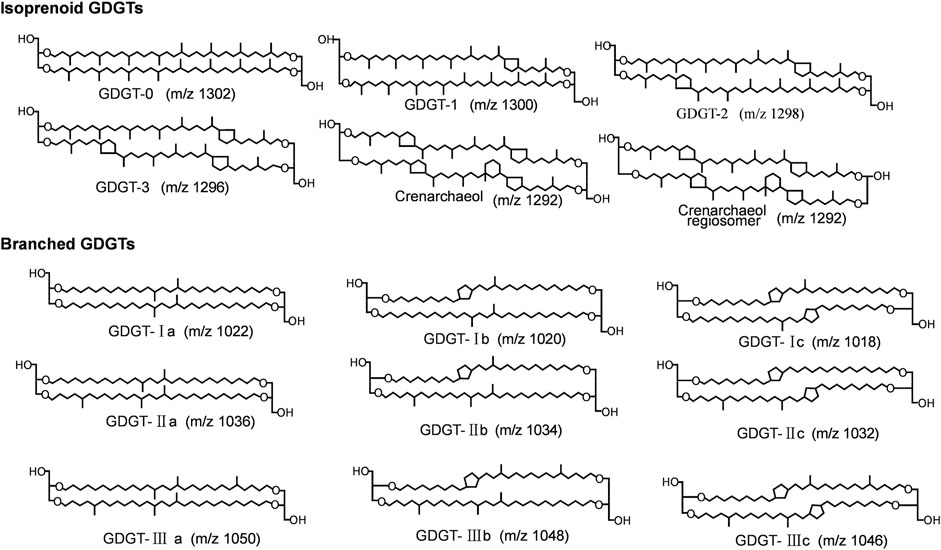
FIGURE 3. Structure of GDGT compounds (from Yang et al., 2014).
Results
We extracted and tested 33 samples from the whole section; only two GDGTs data of 18.3 Ma and 18.8 Ma were identified from the HPLC-APCI-MS (Figure 2G). GDGTs compounds were not extracted from other sample horizons, possibly related to their lithologies (Figure 2C). In the QB, it would appear that reddish mudstone is more conducive to the generation and preservation of GDGTs. In this study, the sedimentary lithologies for 18.3 Ma and 18.8 Ma are all of reddish mudstone. Additionally, all of the lacustrine sample lithologies of GDGTs compounds measured in the study of Zhuang et al. (2019) were also of reddish mudstone. It is possible that the temperature, salinity, and dissolved oxygen conditions found in Cenozoic reddish mudstones in the QB are more beneficial to the formation of GDGTs compounds. Although only two GDGTs datasets were obtained from the HLG section, these two datasets constitute a critical resource for the Cenozoic paleotemperature reconstruction of the NE TP, filling a quantitative paleotemperature and paleoelevation gap in our understanding of the early to middle Miocene period of the QB.
The MBT ratio of these two samples were 0.82 and 0.59, respectively; the CBT ratio were −0.141 and 0.006, respectively (Supplementary Table S2). Diagenesis, maturation, and exposure to oxygen during sedimentation are all likely to lead to the degradation of GDGTs (Schouten et al., 2013). Although the degradation of brGDGTs is inevitable, and can be relatively rapid, the fidelity of paleotemperature reconstructions based on brGDGTs is less affected by their preservation (Schouten et al., 2013). In an artificially simulated thermal maturation experiment, the MBT index changes little, while the CBT index increases with the temperature increase, indicating that the components containing five membered rings are relatively unstable, but also that the temperature change in the MBT/CBT calculation is small (Schouten et al., 2013). The stability of the MBT index and the MBT/CBT-reconstructed temperature were also evident in an artificially simulated oxidation experiment (Ding et al., 2013). In other words, although the degradation will lead to the reduction of GDGTs content in the formation, the environmental temperature information preserved is less affected, meaning that the paleotemperatures calculated in this study can be assumed to be relatively reliable.
Consistent with the distribution of GDGTs compounds in the surface sediments of other lakes on the TP (Günther et al., 2014; Wang et al., 2016; Wang et al., 2021), the distribution of GDGTs in the two samples in this study was principally of brGDGTs, in which the contents of Ia, Ib, and Ic were the highest. The contents of GDGT-2 and GDGT-3 in isoprenoid glycerol dialkyl glycerol tetraethers (iGDGTs) were higher, with the crenarchaeol (cren) and its isomers (cren’) content being the lowest (Figures 2H,I).
Discussion
GDGTS and Paleotemperature
In this study, the early Miocene samples (dated to 18.3 Ma and 18.8 Ma) from the HLG section contained sufficient fractional concentrations to calculate the brGDGT-based paleotemperature proxy. Sedimentary facies analyses revealed that the two samples were composed of lacustrine sediments (Figure 2C). We therefore chose lake brGDGT-temperature calibration equations to calculate the paleotemperature (Tierney et al., 2010; Pearson et al., 2011; Sun et al., 2011; Loomis et al., 2012; Günther et al., 2014; Wang et al., 2016).
The MAAT value reconstructed by the three equations of samples mainly from Africa is obviously too high (Figure 4; Supplementary Table S3; Tierney et al., 2010; Pearson et al., 2011; Loomis et al., 2012). To be specific, the MAAT of 18.3 Ma was 40.4°C, 45.0°C, and 43.5°C, respectively, while that at 18.8 Ma was 31.7°C, 38.0°C, and 36.4°C, accordingly. Compared with the equations whose samples are mainly from Africa, the other three equations whose samples are mainly collected from China (Figure 4 and Supplementary Table S3; Sun et al., 2011; Günther et al., 2014; Wang et al., 2016) seem to be more reliable. Then, the mean MAAT for 18.3 Ma and 18.8 Ma was taken as the possible paleotemperature in this area at 18.0 Ma (Figure 5), whereas at 18.0 Ma, the MAAT values calculated using these three formulae were 31.3 ± 4.3°C, −0.3 ± 1.2°C, and 25.6 ± 1.5°C, separately. Among the three equations, it is believed that the reconstructed-MAAT of Sun et al. (2011) and Wang et al. (2016) is the most reliable for the following reasons. Firstly, Sun et al. (2011) and Wang et al. (2016) have a larger number of samples (n = 100 and n = 27), including a wide range of lakes featured with various climatic conditions, lake size, and depths. Secondly, the reconstructed-MAAT values of Sun et al. (2011) and Wang et al. (2016) are closer. Thirdly, the MAAT value of 18.0 Ma calculated by Günther et al. (2014) is much lower than the late Miocene long-chain alkenone temperature (18.9 ± 0.5°C) and lacustrine carbonate oxygen isotope temperature (19.0 ± 0.5°C) in the Dahonggou (DHG) section (Figures 1B, 5, Sun et al., 2012) and Xitieshan area of the QB (Figure 5, Wu et al., 2007), which is inconsistent with the global cooling trend during Middle Miocene to late Miocene (Figure 5, Wang et al., 2003). We therefore felt it fair to assume that 31.3 ± 4.3°C and 25.6 ± 1.5°C could be taken as reliable paleotemperature values. In order to reduce any errors in the paleotemperature calculations further, our final 18.0 Ma temperature took the mean value of 31.3 ± 4.3°C and 25.6 ± 1.5°C to be 28.4°C, with the error being calculated as half of the difference between 31.3°C and 25.6°C (i.e., 2.9°C) (Figure 5).
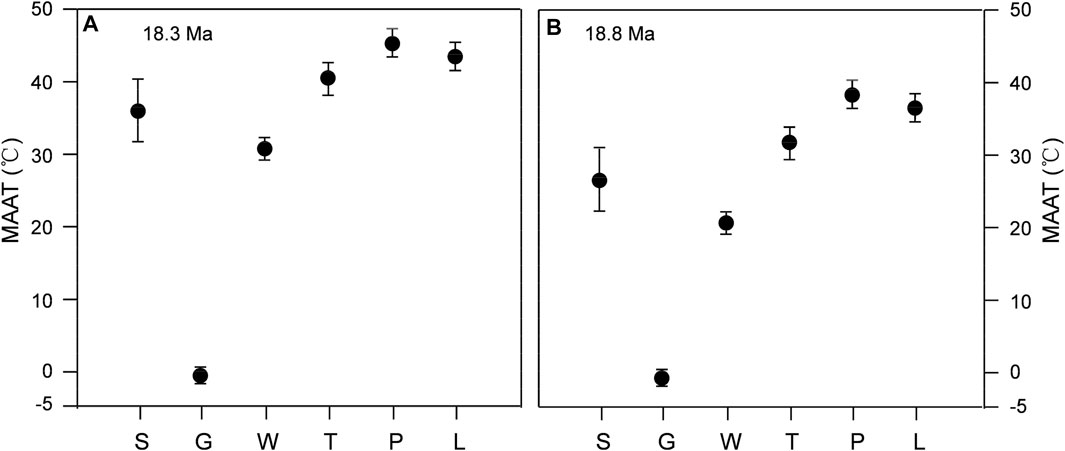
FIGURE 4. (A,B) Reconstructed temperature in 18.3 Ma and 18.8 Ma of the HLG section using different lake brGDGT-temperature calibrations; S, G, W, T, P, and L respectively represent the temperature equation from Sun et al. (2011), Günther et al. (2014), Wang et al. (2016), Tierney et al. (2010), Pearson et al. (2011), and Loomis et al. (2012).
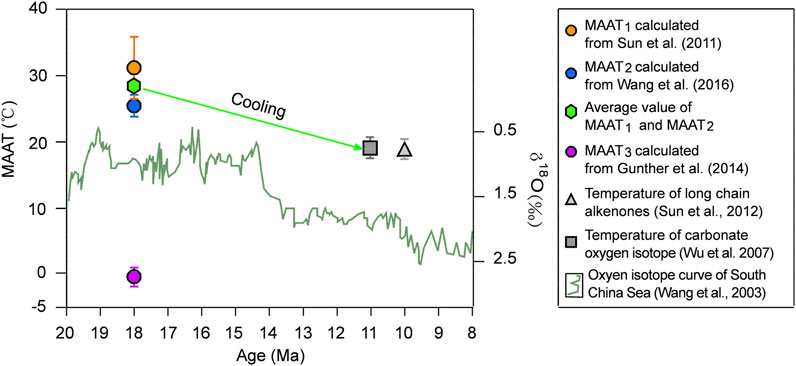
FIGURE 5. Paleotemperatures for the HLG section calculated from Sun et al. (2011) (MAAT1, yellow circle), Wang et al. (2016) (MAAT2, blue circle), and Günther et al. (2014) (MAAT3, purple circle) and the average value of MAAT1 and MAAT2 (blue hexagon) in comparison with other Miocene paleotemperature records (Wang et al., 2003; Wu et al., 2007; Sun et al., 2012; green curves, gray squares and triangles, respectively).
The climatic environment of the QB during the Miocene was quite different from that of today. A considerable corpus of fossils, sedimentary facies, and paleoclimatic evidence has pointed to this region experiencing a warm period at this time. For instance, pollen from the genus fupingensis, representative of the humid environment typical of a subtropical, warm/temperate zone, was found in the Miocene sediments of the Naoge section (Miao et al., 2016) in the QB. Large mammalian fossils from the QB such as rhinoceros and elephant can be dated to the middle to late Miocene (Wang et al., 2011). The discovery of Castor fiber fossils in the DHG section would suggest that the area was warm and humid around 13.0 Ma (Li and Wang, 2015). The discovery of a large number of Chalicothere fossils from the early Pliocene would also intimate that the QB was still a humid and treeless environment during that period (Chen et al., 2015). Additionally, during the early and middle Miocene in the QB, the development of algal limestone and the wide distribution of homogeneous fine-grained layers would indicate that a megalake dominated the Basin (Shou et al., 2003; Miao et al., 2011; Zhuang et al., 2011; Liu et al., 2014; Chang et al., 2015; Guo et al., 2018). Moreover, the hydrocarbon isotopes of leaf wax identified in the Honggouzi section in the western QB appear to show that the climate in this area was relatively warm and wet in the middle Miocene (Wu et al., 2019).
We also used the brGDGT-temperature calculation method employed in this study to recalculate the paleotemperatures of lacustrine sediments during the 9.5–5.1 Ma (mean age 7.3 Ma) period from the Huaitoutala (HT) section (Figure 1B; Zhuang et al., 2019). These calculations rendered a mean value of 17.8 ± 2.9°C. As shown in Figure 6A, the MAAT of the QB decreased from 28.4°C at 18.0 Ma to 17.8°C at 7.3 Ma (△T = 10.6°C), consistent with the significant late Miocene cooling trend recorded by the oxygen isotope record in deep-sea sediments (Zachos et al., 2008; Figure 6B).
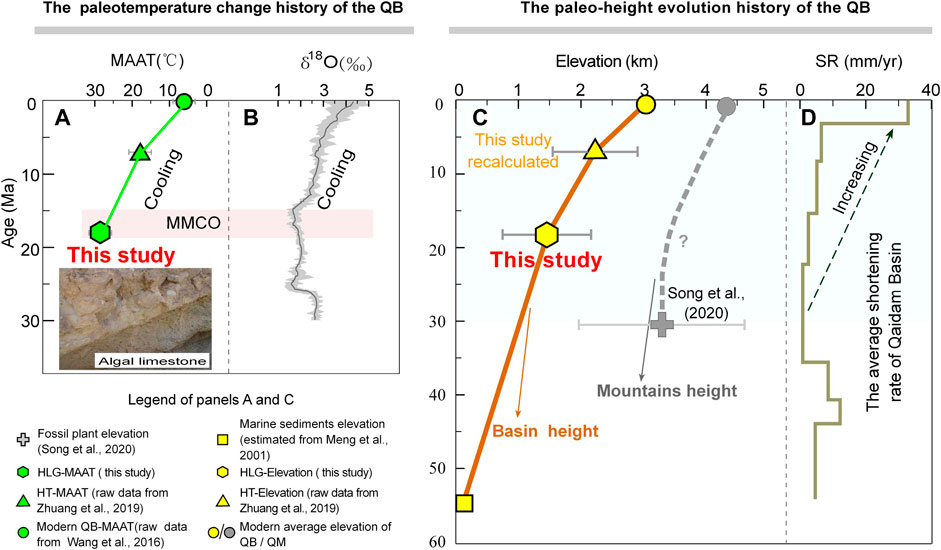
FIGURE 6. (A) Miocene-Quaternary paleotemperature variations in the QB in comparison with (B) global temperatures and ice volume changes recorded by the oxygen isotopes of marine sediments (Zachos et al., 2008); (C) Cenozoic elevation history of the QB in comparison with (D) the tectonic crustal shortening history of the QB (Bao et al., 2017).
In conclusion, numerous fossils, sedimentary facies, and paleoclimatic archives in the QB demonstrate the reliability of this study’s calculated paleotemperatures.
An Early-Middle Miocene Paleoelevation Reconstruction of the QB
The temperature lapse rate (TLR) is an important indicator of altitude and gradient. The TLR for the TP derived from long-term, near-surface air temperatures recorded at meteorological stations ranges from 4.8°C/km to 6.6°C/km (Guo et al., 2015). Due to the influence of many less well-constrained parameters such as underlying surface conditions, elevation, atmospheric circulation, and humidity (Spicer and Yang, 2010), any assumption of any paleo-TLR remains uncertain. Therefore, 6.6°C/km was regarded as the upper limit of the TLR in this study in order that the lower limit of any change in the elevation of the QB since the early Miocene might be calculated; 4.8°C/km was taken as the lower limit of the TLR so as to estimate the upper limit of any change in elevation for the same period.
In addition to determining the TLR, another important step in GDGT-paleoelevation calculation is to find the reference point of the temperature change at “Zero Altitude.” After a large number of screenings, we found three reference points that were close to the latitude and age of this study site, with the temperature proxy being either long chain alkenones or GDGTs. The first reference point was ODP Site 1,010 (30°N, 118°W) in the Pacific Ocean (LaRiviere et al., 2012), which is relatively close to the QB, though the age of its base is 13.4 Ma, quite different from that of this study. The Uk37-temperature change since 13.4 Ma at this site was 14.0°C. The second reference point was ODP Site 608 (42.8°N, 23.1°W), relatively far away from the QB, but close in age to this study (with a range of 24–0 Ma). Since 18.8 Ma, the GDGT-calculated temperature at this site has changed by 13.6°C (Super et al., 2018, 2020). Reference point three was located in the coastal lowlands of Northwest Europe (51.5°N, 6°E). Although the site is far away from the QB, its basal age is 16.5 Ma, consistent with that of this study. It is also a terrestrial environment like the QB, meaning any temperature change should be closer (Donders et al., 2009) to that identified in this study. From 16.5 Ma to now, the GDGT-based temperature change at this site was 13.9°C, very similar to 14.0°C at ODP Site 1,010 and 13.6°C at ODP Site 608. We therefore felt it appropriate to select the Northwest Europe low elevation site in as a reference point.
However, nothing is known about the latitudinal change between the low elevation point in Northwest Europe and the HLG section since the early Miocene, which will inevitably cause uncertainty in the temperature change (△t). Besides, the difference of △t between the modern “Zero Altitude” point and the HLG section was calculated. The △t of the Brussels Meteorological Station (50.9°N, 4.5°E, 55 m asl) from 1973 to 2020 that is closest to the low elevation point of Northwest Europe is 3.1°C (https://en.tutiempo.net/climate/ws-64510.html). Additionally, the △t for the Lenghu Meteorological Station (38.8°N, 93.4°E, 2,771 m asl) nearest to the HLG section from 1973 to 2020 was calculated, and it is 2.5°C (https://en.tutiempo.net/climate/ws-526020.html). During 1973–2020, the difference in △t between the “Zero Altitude” point and the HLG section was 0.6°C. Furthermore, as the latitude pattern between the Northwest Europe and the QB in the early Miocene cannot be obtained, it is assumed that the value, twice of 0.6°C (1.2°C), is the error representing the latitudinal difference between the “Zero Altitude” point and the HLG section since the early Miocene.
In order to calculate the paleoelevation of the QB in the early Miocene, firstly, the MAAT of lake surface sediments in Lake Sugan, Hurleg, and Tuosu of the QB (raw data from Wang et al., 2016) was recalculated (Figure 1B), by using the conversion equations of brGDGT-temperature from Sun et al. (2011) and Wang et al. (2016). Besides, their mean value was 6.1°C as the MAAT in the modern QB. From the early Miocene to the present day, the variation in the low elevation MAAT value for Northwest Europe is 13.9°C. The modern MAAT of the QB is 6.1°C. Therefore, if the temperature change caused by uplift in the QB between the early Miocene and the present day were to be taken as ΔT = 28.4°C − 13.9°C − 6.1°C = 8.4°C, and the upper limit of the TLR as 6.6°C/km, then the figure of 8.4°C would be equivalent to an uplift of ∼1,273 m. When the TLR is 4.8°C/km, the 8.4°C would be equivalent to an uplift of 1,750 m in the study area since the early Miocene. We took a mean value of 1,512 m from the lower limit of 1,273 m and the upper limit of 1,750 m as the change in elevation of the QB since the early Miocene. The modern mean elevation of the QB is ∼3,000 m asl, meaning that the paleoelevation of the study area would have been < ∼1,488 m asl during the early Miocene (Figure 4C). The uncertainty in this modeling was estimated to be 738 m, derived principally from the uncertainty within the calibrations of Sun et al. (2011) and Wang et al. (2016) being 2.9°C, and the difference in temperature change (△t) between the low elevation point in Northwest Europe and the HLG section caused by latitude variation is 1.2°C.
As mentioned above, the MAAT in the QB from 18.0 Ma to 7.3 Ma decreased by 10.6°C. During this period, the temperature change in the lowlands of Northwest Europe was 5.6°C (Donders et al., 2009). When the TLR is taken as 6.6°C/km, the change in elevation would be 758 m. When the TLR is 4.8°C/km, the elevational change would be 1,042 m. We took a mean value of 900 m from the upper limit and the lower limit as the variation in the paleoelevation of the QB from 18.0 Ma to 7.3 Ma. If the paleoelevation of the QB at 18.0 Ma is taken to be ∼1,488 m asl, its paleoelevation during the late Miocene would have been ∼2,388 ± 738 m asl (Figure 6C).
Clarifying the Uplift History of the TP
Using our reconstructed paleoelevations for the QB during the early Miocene and other previously published data (Meng et al., 2001; Zhuang et al., 2019), we reconstructed the Cenozoic altitudinal history of the QB (Figure 6C). This would suggest that at the initiation of the QB in the Eocene, the Basin’s surface was close to the sea level because the QB was connected with the Tarim Basin (Meng et al., 2001). Our brGDGT-based paleoaltimetry showed that the QB was still a low-elevation region (∼1,488 m asl) until ∼18.0 Ma. Even at 7.3 Ma, the brGDGT-based recalculated paleoelevation (∼2,388 m asl) of the QB shows that the Basin’s modern elevation had not yet been obtained. Subsequently, the QB was uplifted by ∼600 m, reaching the present elevation of 3,000 m asl.
However, recent fossilized plant finds in the DHG section have suggested a much earlier date at which the QB attained its present height, i.e., during the Oligocene (Figures 1B, 6C; Song et al., 2020). The plant fossil assemblages belong to a temperate-deciduous-dominated woodland environment and were buried in fluvial sandstone beds. We assumed from this finding that these plants grew on the slopes of the Qilian Mountains and were transported by river action into the Basin, most probably during flooding. This assumption can be based on the analyses of pollen spores from the QB, which indicate that, during the Oligocene, arid-tolerant species of the genera Ephedra, Chenopodiaceae, and Artemisia dominated the Basin’s surface (Exploration and Development Research Institute of Qinghai Petroleum Administration Bureau., and Nanjing Institute of Geology and Paleontology, Chinese Academy of Sciences, 1985), while deciduous Ulmus tree species and fewer numbers of Picea and Pinaceae coniferous trees grew in the Qilian Mountains (Sun et al., 1980). This forest composition would suggest an elevational range of ∼2,000–3,500 m asl when compared with the nearest modern species (Mosbrugger et al., 2018). The elevations suggested by these tree fossils thus most likely reflect the paleoelevations of the Qilian Mountains, rather than the QB. Furthermore, leaf fossil assemblages dominated by Populus and Podocarpium were found in the DHG Gulley (Song et al., 2020). Of these, the same modern Populus indicates a temperate, semi-humid climate and grows mostly along riverbanks in the Lanzhou Basin and at an elevation of ∼1,400 m asl (Sun et al., 2004). This would imply that the fossilized Populus found in the DHG Gulley in the QB most likely grew in valleys during the Oligocene at an elevation of ∼1,400 m asl; this would not support an elevation of ∼3,000 m asl for the QB at that time. Moreover, fossilized plant leaves and fruits of genera Ailanthus found in the Huatugou area in the northwestern QB and dating from the early Oligocene lend further support to our inference (Yang et al., 2020), indicating that the northwestern QB was most likely at low elevations of 500–2,000 m asl during the Oligocene. The recent discovery of fossilized Paleoschizothorax vertebrates (Cyprinidae, a genus of freshwater fish living in warm water environments and at low elevations of ∼500–1,800 m asl in southwestern China) in the Oligocene stratigraphy in the same area would appear to further support the inference of a low-elevation QB during the Oligocene (Yang et al., 2018). The pharyngeal bones of the Schizothorax subfamily or Barbinidae found in the late Miocene strata of the HT area exist purely in the original Schizothorax subfamily and Barbinidae fish, and are only distributed in areas with an elevation of 1,250–2,500 m asl or lower (Chang and Miao, 2016), indicating that the QB did not reach its modern height until the late Miocene, consistent with this study.
The above topographical histories of the QB suggest that a slow rise of the NE TP, and a lowland environment, dominated the QB for much of the Eocene and Miocene, and that the rapid uplift of the Plateau’s surface to the present-day elevation of ∼3,000 m asl occurred from the late Miocene onwards (Figure 6C).
The reconstructed Cenozoic tectonic history of the QB shows a highly variable crustal shortening rate (Figure 6D; Bao et al., 2017), being high from 43.8 Ma to 35.5 Ma and from 15.3 Ma to 0 Ma, and low from 53.5 Ma to 43.8 Ma and from 35.5 Ma to 15.3 Ma. The Miocene represents the dividing lines between these high and low rates, with ∼50% of the Basin’s total shortening occurring by the onset of the Miocene.
The reconstructed Cenozoic paleoelevation evolution of the QB can also be confirmed by overwhelming geological evidence. For instance, a low topography in the QB during the Paleogene is indicated by the age of the last-remaining marine units in the area (Meng et al., 2001), which was connected with the southwestern Tarim Basin when the region was occupied by the Paratethys Sea between the Cretaceous and the early Paleogene (e.g., Popov et al., 2004). Additionally, Yin et al. (2008) suggested that the Paleogene (65–24 Ma) Qaidam and Hoh Xil basins on both sides of the Eastern Kunlun Mountains may have been parts of a single topographic depression called the “Paleo-Qaidam Basin,” which would imply that the QB experienced a process of slow uplift during the Paleogene. During the period from the early to middle Miocene, the sedimentology, paleomagnetism, thermochronology, and structural geology (Jolivet et al., 2003; Fang et al., 2007; Clark et al., 2010; Li B. et al., 2017) all point to a rapid denudation and uplift of the QB and its surrounding mountain ranges. This body of evidence is consistent with this study’s brGDGT-based paleoelevation reconstruction. A significant number of stratigraphic, petrographic, sedimentological, thermochronological, and climate records have also demonstrated that since the late Miocene, the Qaidam region and even the entire NE TP have undergone a period of intensive uplift, laying the foundations for the region’s present-day geomorphic patterns and elevation, and causing huge climatic and environmental change (Fang et al., 2005; Li et al., 2014).
In summary, all the aforementioned geological evidence agrees well with our reconstructed Cenozoic paleoelevation history of the QB on the NE TP, a reconstruction that supports a rapid late Miocene uplift and growth of the NE TP. However, due to the difficulty in preservation of the GDGTs, the interpretation and resulting conclusion in this study is based primarily on limited datasets. Further studies with more samples from a broad region can subsequently verify and reinforce the results from this study.
Conclusion
We used a new, organic, quantitative paleotemperature/paleoaltimeter-GDGTs ratio to constrain the Cenozoic paleogeomorphology of the NE TP, so as to improve our understanding of the uplift history of the region. The GDGTs temperature indicated that the MAAT of the QB was relatively high in the early Miocene (28.4 ± 2.9°C). This would suggest that the paleoelevation of the QB at that time was relatively very low, at ∼1,488 m asl. Combined with other published paleoelevation/geological records, we reconstructed the uplift history of the Cenozoic era in the Qaidam area, and showed that at the beginning of the Eocene, the Basin’s surface was close to sea level. Until in the early Miocene, the QB was still a low-elevation region (∼1,488 m asl). Even at 7.3 Ma, the recalculated paleoelevation (∼2,388 m asl) of the QB showed that the Basin’s modern elevation had not yet been obtained. Subsequently, the QB was uplifted by ∼600 m, reaching its present elevation of 3,000 m asl.
Data Availability Statement
The original contributions presented in the study are included in the article/Supplementary Material. Further inquiries can be directed to the corresponding author.
Author Contributions
The idea was provided by the corresponding author XF, and he also guided the work and modified this paper. First author QT conducted the experiment and wrote the manuscript. YB and CC gave much advice for this manuscript. JH provided experimental guidance. TZ collected samples in the field and drew figures.
Funding
This study was co-supported by the National Natural Science Foundation of China (Grant Nos. 41972195, 41620104002, and 41801008), the Second Tibetan Plateau Scientific Expedition and Research (STEP) program (Grant No. 2019QZKK0707), and the Doctoral Research Initiation Fund of Yan’an University (Grant No. YDBK 2018-03).
Conflict of Interest
The authors declare that the research was conducted in the absence of any commercial or financial relationships that could be construed as a potential conflict of interest.
Publisher’s Note
All claims expressed in this article are solely those of the authors and do not necessarily represent those of their affiliated organizations, or those of the publisher, the editors, and the reviewers. Any product that may be evaluated in this article, or claim that may be made by its manufacturer, is not guaranteed or endorsed by the publisher.
Acknowledgments
We are very grateful to Yibo Yang for his helpful discussions. We also greatly thank the editor and reviewers for their careful work and constructive suggestions, which significantly improved the manuscript.
Supplementary Material
The Supplementary Material for this article can be found online at: https://www.frontiersin.org/articles/10.3389/feart.2021.759319/full#supplementary-material
References
Bai, Y., Chen, C., Xu, Q., and Fang, X. (2018). Paleoaltimetry Potentiality of Branched GDGTs from Southern Tibet. Geochem. Geophys. Geosyst. 19 (2), 551–564. doi:10.1002/2017GC007122
Bao, J., Wang, Y., Song, C., Feng, Y., Hu, C., Zhong, S., et al. (2017). Cenozoic Sediment Flux in the Qaidam Basin, Northern Tibetan Plateau, and Implications with Regional Tectonics and Climate. Glob. Planet. Change 155, 56–69. doi:10.1016/j.gloplacha.2017.03.006
Chang, H., Li, L., Qiang, X., Garzione, C. N., Pullen, A., and An, Z. (2015). Magnetostratigraphy of Cenozoic Deposits in the Western Qaidam Basin and its Implication for the Surface Uplift of the Northeastern Margin of the Tibetan Plateau. Earth Planet. Sci. Lett. 430, 271–283. doi:10.1016/j.epsl.2015.08.029
Chang, M.-M., and Miao, D. (2016). Review of the Cenozoic Fossil Fishes from the Tibetan Plateau and Their Bearings on Paleoenvironment. Chin. Sci. Bull. 61 (9), 981–995. doi:10.1360/N972015-01372
Chen, C., Bai, Y., Fang, X., Guo, H., Meng, Q., Zhang, W., et al. (2019). A Late Miocene Terrestrial Temperature History for the Northeastern Tibetan Plateau's Period of Tectonic Expansion. Geophys. Res. Lett. 46, 8375–8386. doi:10.1029/2019GL082805
Chen, C., Bai, Y., Fang, X., Xu, Q., Zhang, T., Deng, T., et al. (2020). Lower-altitude of the Himalayas before the Mid-pliocene as Constrained by Hydrological and thermal Conditions. Earth Planet. Sci. Lett. 545, 116422. doi:10.1016/j.epsl.2020.116422
Chen, S. K., Li, Q., and Wang, X. M. (2015). Chalicothere Fossils from the Early Late Miocene of the Qaidam Basin, and Their Paleoenvironmental Implications. Quat. Sci. 35 (3), 528–538. doi:10.11928/j.issn.1001-7410.2015.03.05
Clark, M. K., Farley, K. A., Zheng, D., Wang, Z., and Duvall, A. R. (2010). Early Cenozoic Faulting of the Northern Tibetan Plateau Margin from Apatite (U-Th)/He Ages. Earth Planet. Sci. Lett. 296 (1–2), 78–88. doi:10.1016/j.epsl.2010.04.051
Decelles, P. G., Castañeda, I. S., Carrapa, B., Liu, J., Quade, J., Leary, R., et al. (2016). Oligocene-Miocene Great Lakes in the India-Asia Collision Zone. Basin Res. 30 (S1), 228–247. doi:10.1111/bre.12217
Deng, L., and Jia, G. (2018). High-relief Topography of the Nima basin in central Tibetan Plateau during the Mid-cenozoic Time. Chem. Geology. 493, 199–209. doi:10.1016/j.chemgeo.2018.05.041
Deng, L., Jia, G., Jin, C., and Li, S. (2016). Warm Season Bias of Branched GDGT Temperature Estimates Causes Underestimation of Altitudinal Lapse Rate. Org. Geochem. 96, 11–17. doi:10.1016/j.orggeochem.2016.03.004
Dewey, J. F., Shackleton, R. M., Chang, C. F., and Sun, Y. Y. (1988). The Tectonic Evolution of the Tibetan Plateau. Phil. Trans. R. Soc. Lond. A. 327 (1594), 379–413. doi:10.1098/rsta.1988.0135
Ding, L., Xu, Q., Yue, Y., Wang, H., Cai, F., and Li, S. (2014). The Andean-type Gangdese Mountains: Paleoelevation Record from the Paleocene-Eocene Linzhou Basin. Earth Planet. Sci. Lett. 392, 250–264. doi:10.1016/j.epsl.2014.01.045
Ding, W. H., Yang, H., He, G. Q., and Xie, S. C. (2013). Effects of Oxidative Degradation by Hydrogen Peroxide on Tetraethers-Based Organic Proxies (In Chinese). Quat. Sci. 33 (1), 39–47. doi:10.3969/j.issn.1001-7410.2013.01.05
Donders, T. H., Weijers, J. W. H., Munsterman, D. K., Kloosterboer-van Hoeve, M. L., Buckles, L. K., Pancost, R. D., et al. (2009). Strong Climate Coupling of Terrestrial and marine Environments in the Miocene of Northwest Europe. Earth Planet. Sci. Lett. 281 (3), 215–225. doi:10.1016/j.epsl.2009.02.034
Exploration and Development Research Institute of Qinghai Petroleum Administration Bureau., and Nanjing Institute of Geology and Paleontology, Chinese Academy of Sciences (1985). Tertiary Palynology in Qaidam Basin. Beijing, China: Petroleum Industry Press, 35p.
Fang, X., Fang, Y., Zan, J., Zhang, W., Song, C., Appel, E., et al. (2019). Cenozoic Magnetostratigraphy of the Xining Basin, NE Tibetan Plateau, and its Constraints on Paleontological, Sedimentological and Tectonomorphological Evolution. Earth-Science Rev. 190, 460–485. doi:10.1016/j.earscirev.2019.01.021
Fang, X., Yan, M., Van der Voo, R., Rea, D. K., Song, C., Parés, J. M., et al. (2005). Late Cenozoic Deformation and Uplift of the NE Tibetan Plateau: Evidence from High-Resolution Magnetostratigraphy of the Guide Basin, Qinghai Province, China. Geol. Soc. America Bull. 117 (9–10), 1208–1225. doi:10.1130/B25727.1
Fang, X., Zhang, W., Meng, Q., Gao, J., Wang, X., King, J., et al. (2007). High-resolution Magnetostratigraphy of the Neogene Huaitoutala Section in the Eastern Qaidam Basin on the NE Tibetan Plateau, Qinghai Province, China and its Implication on Tectonic Uplift of the NE Tibetan Plateau. Earth Planet. Sci. Lett. 258 (1–2), 293–306. doi:10.1016/j.epsl.2007.03.042
Feng, X., D'Andrea, W. J., Zhao, C., Xin, S., Zhang, C., and Liu, W. (2019). Evaluation of Leaf Wax δD and Soil brGDGTs as Tools for Paleoaltimetry on the southeastern Tibetan Plateau. Chem. Geology. 523, 95–106. doi:10.1016/j.chemgeo.2019.05.005
Gradstein, F. M., and Ogg, J. G. (Editors) (2012). The Chronostratigraphic Scale in Geologic Time Scale 2012. (Amsterdam, Netherlands: Elsevier), 31–42. doi:10.1016/B978-0-444-59425-9.00002-0
Günther, F., Thiele, A., Gleixner, G., Xu, B., Yao, T., and Schouten, S. (2014). Distribution of Bacterial and Archaeal Ether Lipids in Soils and Surface Sediments of Tibetan Lakes: Implications for GDGT-Based Proxies in saline High mountain lakes. Org. Geochem. 67 (1), 19–30. doi:10.1016/j.orggeochem.2013.11.014
Guo, P., Liu, C., Huang, L., Yu, M., Wang, P., and Zhang, G. (2018). Palaeohydrological Evolution of the Late Cenozoic saline lake in the Qaidam Basin, NE Tibetan Plateau: Tectonic vs. Climatic Control. Glob. Planet. Change 165, 44–61. doi:10.1016/j.gloplacha.2018.03.012
Guo, X., Wang, L., and Tian, L. (2015). Spatio-temporal Variability of Vertical Gradients of Major Meteorological Observations Around the Tibetan Plateau. Int. J. Climatol. 36 (4), 1901–1916. doi:10.1002/joc.4468
Jolivet, M., Brunel, M., Seward, D., Xu, Z., Yang, J., Malavieille, J., et al. (2003). Neogene Extension and Volcanism in the Kunlun Fault Zone, Northern Tibet: New Constraints on the Age of the Kunlun Fault. Tectonics 22 (5), a–n. doi:10.1029/2002TC001428
LaRiviere, J. P., Ravelo, A. C., Crimmins, A., Dekens, P. S., Ford, H. L., Lyle, M., et al. (2012). Late Miocene Decoupling of Oceanic Warmth and Atmospheric Carbon Dioxide Forcing. Nature 486 (7401), 97–100. doi:10.1038/nature11200
Li, B., Yan, M., Zhang, W., Fang, X., Meng, Q., Zan, J., et al. (2017). New Paleomagnetic Constraints on Middle Miocene Strike-Slip Faulting along the Middle Altyn Tagh Fault. J. Geophys. Res. Solid Earth 122 (5), 4106–4122. doi:10.1002/2017JB014058
Li, J., Fang, X., Song, C., Pan, B., Ma, Y., and Yan, M. (2014). Late Miocene-Quaternary Rapid Stepwise Uplift of the NE Tibetan Plateau and its Effects on Climatic and Environmental Changes. Quat. Res. 81 (3), 4000246–4000423. SAOATI]2.0.CO;2. doi:10.1657/1523.0430(2005)037 doi:10.1016/j.yqres.2014.01.002
Li, Q., and Wang, X. M. (2015). Discovery of Neogene Beavers (Castoridae, Mammalia) in central Qaidam Basin, and Their Paleoenvironmental Significance (In Chinese). Quat. Sci. 35 (3), 584–595. doi:10.11928/j.issn.1001-7410.2015.03.10
Liu, W., Wang, H., Zhang, C. L., Liu, Z., and He, Y. (2013). Distribution of Glycerol Dialkyl Glycerol Tetraether Lipids along an Altitudinal Transect on Mt. Xiangpi, NE Qinghai-Tibetan Plateau, China. Org. Geochem. 57, 76–83. doi:10.1016/j.orggeochem.2013.01.011
Liu, X., Sun, H., Miao, Y., Dong, B., and Yin, Z.-Y. (2015). Impacts of Uplift of Northern Tibetan Plateau and Formation of Asian Inland Deserts on Regional Climate and Environment. Quat. Sci. Rev. 116, 1–14. doi:10.1016/j.quascirev.2015.03.010
Liu, Z., Zhang, K., Sun, Y., Liu, W., Liu, Y. C., and Quan, C. (2014). Cenozoic Environmental Changes in the Northern Qaidam Basin Inferred Fromn-Alkane Records. Acta Geologica Sinica - English Edition 88 (5), 1547–1555. doi:10.1111/1755-6724.12317
LiX., X. M., Zhu, E. L., Wang, M. D., Liang, J., Wang, Z. F., Liang, E. Y., et al. (2017). Distributions of Glycerol Dialkyl Glycerol Tetraether Lips along an Altitudinal Transect on the Southern Slope of Mt. Himalaya and Their Indicating Significance (In Chinese). Quat. Sci. 37 (6), 1226–1237. doi:10.11928/j.issn.1001-7410.2017.06.07
Loomis, S. E., Russell, J. M., Ladd, B., Street-Perrott, F. A., and Sinninghe Damsté, J. S. (2012). Calibration and Application of the Branched GDGT Temperature Proxy on East African lake Sediments. Earth Planet. Sci. Lett. 357-358, 277–288. doi:10.1016/j.epsl.2012.09.031
Meng, Q.-R., Hu, J.-M., and Yang, F.-Z. (2001). Timing and Magnitude of Displacement on the Altyn Tagh Fault: Constraints from Stratigraphic Correlation of Adjoining Tarim and Qaidam Basins, NW China. Terra Nova 13 (2), 86–91. doi:10.1046/j.1365-3121.2001.00320.x
Miao, Y., Fang, X., Herrmann, M., Wu, F., Zhang, Y., and Liu, D. (2011). Miocene Pollen Record of KC-1 Core in the Qaidam Basin, NE Tibetan Plateau and Implications for Evolution of the East Asian Monsoon. Palaeogeogr. Palaeoclimatol. Palaeoecol. 299 (1–2), 30–38. doi:10.1016/j.palaeo.2010.10.026
Miao, Y., Song, C., Fang, X., Meng, Q., Zhang, P., Wu, F., et al. (2016). Late Cenozoic Genus Fupingopollenites Development and its Implications for the Asian Summer Monsoon Evolution. Gondwana Res. 29 (1), 320–333. doi:10.1016/j.gr.2014.12.007
Mosbrugger, V., Favre, A., Muellner-Riehl, A. N., and Päckert, M. (2018). Cenozoic Evolution of Geo–Biodiversity in the Tibeto–Himalayan Region. Mountains, Clim. Biodiversity, 429–448.
Pearson, E. J., Juggins, S., Talbot, H. M., Weckström, J., Rosén, P., Ryves, D. B., et al. (2011). A Lacustrine GDGT-Temperature Calibration from the Scandinavian Arctic to Antarctic: Renewed Potential for the Application of GDGT-Paleothermometry in Lakes. Geochimica et Cosmochimica Acta 75, 6225–6238. doi:10.1016/j.gca.2011.07.042
Peterse, F., van der Meer, M. T. J., Schouten, S., Jia, G., Ossebaar, J., Blokker, J., et al. (2009). Assessment of Soil N-Alkane δD and Branched Tetraether Membrane Lipid Distributions as Tools for Paleoelevation Reconstruction. Biogeosciences 6 (5), 2799–2807. doi:10.5194/bg-6-2799-2009
Popov, S. V., Rögl, F., Rozanov, A. Y., Steininger, F. F., Shcherba, I. G., and Kovac, M. (2004). Lithological-Paleogeographic Maps of Paratethys 10 Maps Late Eocene to Pliocene. Courier Forschungsinstitut Senckenberg 250, 1–46.
Rowley, D. B., and Currie, B. S. (2006). Palaeo-altimetry of the Late Eocene to Miocene Lunpola basin, central Tibet. Nature 439 (7077), 677–681. doi:10.1038/nature04506
Schouten, S., Hopmans, E. C., and Sinninghe Damsté, J. S. (2013). The Organic Geochemistry of Glycerol Dialkyl Glycerol Tetraether Lipids: a Review. Org. Geochem. 54, 19–61. doi:10.1016/j.orggeochem.2012.09.006
Shou, J. F., Shao, W. B., Chen, Z. L., and Shen, A. J. (2003). Lithological Types and Distribution Features of Tertiary Algal-limestone in Chaixi Area, Qaidam (In Chinese). Petrol. Explor. Dev. 30 (4), 37–39. doi:10.3321/j.issn:1000-0747.2003.04.012
Song, B., Spicer, R. A., Zhang, K., Ji, J., Farnsworth, A., Hughes, A. C., et al. (2020). Qaidam Basin Leaf Fossils Show Northeastern Tibet Was High, Wet and Cool in the Early Oligocene. Earth Planet. Sci. Lett. 537, 116175. doi:10.1016/j.epsl.2020.116175
Spicer, R. A., and Yang, J. (2010). Quantification of Uncertainties in Fossil Leaf Paleoaltimetry: Does Leaf Size Matter. Tectonics 29 (6), a–n. doi:10.1029/2010TC002741
Sun, B., Yan, D., Xie, S., Cong, P., Xin, C., and Yun, F. (2004). Palaeogene Fossil Populus Leaves from Lanzhou Basin and Their Palaeoclimatic Significance. Chin.Sci.Bull. 49 (13), 1494–1501. doi:10.1007/BF03036888
Sun, Q., Chu, G., Liu, M., Xie, M., Li, S., Ling, Y., et al. (2011). Distributions and Temperature Dependence of Branched Glycerol Dialkyl Glycerol Tetraethers in Recent Lacustrine Sediments from China and Nepal. J. Geophys. Res. 116, G01008. doi:10.1029/2010JG001365
Sun, X. Y., Zhao, Y. N., and He, Z. S. (1980). Late Cretaceous-Paleogene Sporopollen Assemblages and Stratigraphic Age, Palaeovegetation and Paleoclimate in Xining-Minhe Basin (In Chinese). Petrol. Geol. Exp. 2 (04), 44–52. doi:10.11781/sysydz198004044
Sun, Y.-Y., Zhang, K.-X., Liu, J., He, Y.-X., Song, B.-W., Liu, W.-G., et al. (2012). Long Chain Alkenones Preserved in Miocene lake Sediments. Org. Geochem. 50, 19–25. doi:10.1016/j.orggeochem.2012.06.007
Super, J. R., Thomas, E., Pagani, M., Huber, M., O'Brien, C. L., and Hull, P. M. (2020). Miocene Evolution of North Atlantic Sea Surface Temperature. Paleoceanography and Paleoclimatology 35 (5), e2019PA003748. doi:10.1029/2019PA003748
Super, J. R., Thomas, E., Pagani, M., Huber, M., O’Brien, C., and Hull, P. M. (2018). North Atlantic Temperature and pCO2 Coupling in the Early-Middle Miocene. Geology 46 (6), 519–522. doi:10.1130/G40228.1
Tapponnier, P., Zhiqin, X., Roger, F., Meyer, B., Arnaud, N., Wittlinger, G., et al. (2001). Oblique Stepwise Rise and Growth of the Tibet Plateau. Science 294 (5547), 1671–1677. doi:10.1126/science.105978
Tierney, J. E., Russell, J. M., Eggermont, H., Hopmans, E. C., Verschuren, D., and Sinninghe Damsté, J. S. (2010). Environmental Controls on Branched Tetraether Lipid Distributions in Tropical East African lake Sediments. Geochimica et Cosmochimica Acta 74, 4902–4918. doi:10.1016/j.gca.2010.06.002
Wang, C., Hren, M. T., Hoke, G. D., Liu-Zeng, J., and Garzione, C. N. (2017). Soil N-Alkane δD and Glycerol Dialkyl Glycerol Tetraether (GDGT) Distributions along an Altitudinal Transect from Southwest China: Evaluating Organic Molecular Proxies for Paleoclimate and Paleoelevation. Org. Geochem. 107, 21–32. doi:10.1016/j.orggeochem.2017.01.006
Wang, C., Zhao, X., Liu, Z., Lippert, P. C., Graham, S. A., Coe, R. S., et al. (2008). Constraints on the Early Uplift History of the Tibetan Plateau. Pnas 105 (13), 4987–4992. doi:10.1073/pnas.0703595105
Wang, H., Liu, W., He, Y., Zhou, A., Zhao, H., Liu, H., et al. (2021). Salinity-controlled Isomerization of Lacustrine brGDGTs Impacts the Associated MBT5ME' Terrestrial Temperature index. Geochimica et Cosmochimica Acta 305, 33–48. doi:10.1016/j.gca.2021.05.004
Wang, M., Liang, J., Hou, J., and Hu, L. (2016). Distribution of GDGTs in lake Surface Sediments on the Tibetan Plateau and its Influencing Factors. Sci. China Earth Sci. 59, 961–974. doi:10.1007/s11430-015-5214-3
Wang, P. X., Zhao, Q. H., Jian, Z. M., Cheng, X. R., Huang, W., Tian, J., et al. (2003). Deep Sea Records in the South China Sea since 30 Ma (In Chinese). Sci. Bull. 48 (21), 2206–2215. doi:10.1360/csb2003-48-21-220610.1007/bf03037016
Wang, X. M., Xie, G. P., Li, Q., Qiu, Z. D., Tseng, Z. J., Takeuchi, G. T., et al. (2011). Early Explorations of Qaidam Basin (Tibetan Plateau) by Birger Bohlin-Reconciling Classic Vertebrate Fossil Localities with Modern Biostratigraphy. Vertebrata Palasiatica 49 (3), 285–310. doi:10.1007/s11589-011-0776-4
Weijers, J. W. H., Schouten, S., van den Donker, J. C., Hopmans, E. C., and Sinninghe Damsté, J. S. (2007). Environmental Controls on Bacterial Tetraether Membrane Lipid Distribution in Soils. Geochimica et Cosmochimica Acta 71 (3), 703–713. doi:10.1016/j.gca.2006.10.003
Wu, M., Zhuang, G., Hou, M., and Liu, H. (2021). Expanded Lacustrine Sedimentation in the Qaidam Basin on the Northern Tibetan Plateau: Manifestation of Climatic Wetting during the Oligocene Icehouse. Earth Planet. Sci. Lett. 565, 116935. doi:10.1016/j.epsl.2021.116935
Wu, M., Zhuang, G., Hou, M., and Miao, Y. (2019). Ecologic Shift and Aridification in the Northern Tibetan Plateau Revealed by Leaf Wax N-Alkane δ2H and δ13C Records. Palaeogeogr. Palaeoclimatol. Palaeoecol. 514, 464–473. doi:10.1016/j.palaeo.2018.11.005
Wu, Z. H., Zhao, X., Ye, P. S., Wu, Z. H., Hu, D. G., and Zhou, C. J. (2007). Paleo-elevation of the Tibetan Plateau Inferred from Carbon and Oxygen Isotopes of Lacustrine Deposits (In Chinese). Acta Geol. Sin. 8 (9), 1277–1288.
Yang, H., Pancost, R. D., Tang, C., Ding, W., Dang, X., and Xie, S. (2014). Distributions of Isoprenoid and Branched Glycerol Dialkanol Diethers in Chinese Surface Soils and a Loess-Paleosol Sequence: Implications for the Degradation of Tetraether Lipids. Org. Geochem. 66 (70–79), 70–79. doi:10.1016/j.orggeochem.2013.11.003
Yang, T., Jia, J. W., Chen, H. Y., Zhang, Y. X., Wang, Y., Wang, H. J., et al. (2020). Oligocene Ailanthus from Northwestern Qaidam Basin, Northern Tibetan Plateau, China and its Implications. Geol. J. 4, 1–12. doi:10.1002/gj.3904
Yang, T., Zhang, L., Li, W., Jia, J., Han, L., Zhang, Y., et al. (2018). New Schizothoracine from Oligocene of Qaidam Basin, Northern Tibetan Plateau, China, and its Significance. J. Vertebr. Paleontol. 38, e1442840. doi:10.1080/02724634.2018.1442840
Yin, A., Dang, Y.-Q., Zhang, M., Chen, X.-H., and McRivette, M. W. (2008). Cenozoic Tectonic Evolution of the Qaidam basin and its Surrounding Regions (Part 3): Structural Geology, Sedimentation, and Regional Tectonic Reconstruction. Geol. Soc. America Bull. 120 (7–8), 847–876. doi:10.1130/B26232.1
Yin, A., and Harrison, T. M. (2000). Geologic Evolution of the Himalayan-Tibetan Orogen. Annu. Rev. Earth Planet. Sci. 28, 211–280. doi:10.1146/annurev.earth.28.1.211
Zachos, J. C., Dickens, G. R., and Zeebe, R. E. (2008). An Early Cenozoic Perspective on Greenhouse Warming and Carbon-Cycle Dynamics. Nature 451 (7176), 279–283. doi:10.1038/nature06588
Zhang, W. L. (2006). Cenozoic Uplift of the Tibetan Plateau: Evidence from High Resolution Magnetostratigraphy of the Qaidam Basin. PhD thesis. Lanzhou (China): Lanzhou University.
Zhou, J., Xu, F., Wang, T., Cao, A., and Yin, C. (2006). Cenozoic Deformation History of the Qaidam Basin, NW China: Results from Cross-Section Restoration and Implications for Qinghai-Tibet Plateau Tectonics. Earth Planet. Sci. Lett. 243 (1–2), 195–210. doi:10.1016/j.epsl.2005.11.033
Zhou, L. H., Sun, S. Z., and Chen, G. C. (1990). Vegetation of Qinghai Province (1:1,000,000). Beijing: China Science and Technology Press, 23–24.
Zhuang, G., Brandon, M. T., Pagani, M., and Krishnan, S. (2014). Leaf Wax Stable Isotopes from Northern Tibetan Plateau: Implications for Uplift and Climate since 15 Ma. Earth Planet. Sci. Lett. 390, 186–198. doi:10.1016/j.epsl.2014.01.003
Zhuang, G., Hourigan, J. K., Ritts, B. D., and Kent-Corson, M. L. (2011). Cenozoic Multiple-phase Tectonic Evolution of the Northern Tibetan Plateau: Constraints from Sedimentary Records from Qaidam basin, Hexi Corridor, and Subei basin, Northwest China. Am. J. Sci. 311 (2), 116–152. doi:10.2475/02.2011.02
Keywords: paleoelevation, paleotemperature, GDGTs, early Miocene, Qaidam Basin
Citation: Tian Q, Fang X, Bai Y, Chen C, Hou J and Zhang T (2021) An Early Miocene Lowland on the Northeastern Tibetan Plateau. Front. Earth Sci. 9:759319. doi: 10.3389/feart.2021.759319
Received: 16 August 2021; Accepted: 22 November 2021;
Published: 23 December 2021.
Edited by:
Shiming Wan, Institute of Oceanology (CAS), ChinaReviewed by:
Zhonghui Liu, The University of Hong Kong, Hong Kong SAR, ChinaHuanye Wang, Institute of Earth Environment (CAS), China
Copyright © 2021 Tian, Fang, Bai, Chen, Hou and Zhang. This is an open-access article distributed under the terms of the Creative Commons Attribution License (CC BY). The use, distribution or reproduction in other forums is permitted, provided the original author(s) and the copyright owner(s) are credited and that the original publication in this journal is cited, in accordance with accepted academic practice. No use, distribution or reproduction is permitted which does not comply with these terms.
*Correspondence: Xiaomin Fang, ZmFuZ3htQGl0cGNhcy5hYy5jbg==