 Zelun Cheng
 Zuowei Xie
 Wei Tang
 Cholaw Bueh
 Yuanfa Gong1
- 1School of Atmospheric Sciences, Chengdu University of Information Technology, Chengdu, China
- 2International Center for Climate and Environment Sciences, Institute of Atmospheric Physics, Chinese Academy of Sciences, Beijing, China
- 3China Meteorological Administration Institute for Development and Programme Design, Beijing, China
- 4State Key Laboratory of Alternate Electrical Power System with Renewable Energy Sources, School of New Energy, North China Electric Power University, Beijing, China
- 5China Huaneng Group Co., Ltd., Beijing, China
The process of global warming has humidified the atmosphere and increased the occurrence of extreme-precipitation events over the Indochina Peninsula, which lies in the transition region from the South Asian monsoon to the East Asian monsoon. The annual occurrence number of days of extreme precipitation over the Indochina Peninsula exhibits a significant change in 2003, with an abnormally higher occurrence number during the period 2003–2015 than that during 1951–2002. The extreme precipitation and such decadal change are contributed by more moisture sources associated with an enhanced dipole circulation over the Indian Ocean, which could be linked to the Pacific Decadal Oscillation. The daily large-scale meteorological pattern directly associated with extreme precipitation is characterized by an enhanced dipole of the typical summer monsoon pattern, with a zonally elongated Mascarene high and a deepened monsoon trough from northern India to the South China Sea. Such an intensified dipole provides two major channels of water vapor: one along the low-level westerly jet over the Indian Ocean and the other along the gyre of monsoon trough over the South China Sea. Compared with that during the period 1951–2002, the dipole is enhanced from northern India to the Indian Ocean and weakened over the Indochina Peninsula during the period 2003–2015. Although the Lagrangian analysis shows that the trajectory of air masses is displaced southward to the Indian Ocean, the intensified low-level westerly jet increases the evaporation of water from the ocean and thus not only enhances the water channel over the Indian Ocean but also yields a parallel water channel over the Bay of Bengal. In contrast, in spite of the increased trajectory density of air masses over the South China Sea, the lingering of air mass suppresses the evaporation of water and thus provides a declined contribution to the extreme precipitation during 2003–2015.
Introduction
Global warming increases the frequency and intensity of extreme-precipitation events (Alexander et al., 2006; Zhang et al., 2020). The intensification of extreme precipitation is principally caused by enhancement of atmospheric moisture content, which plays an important role in the global water cycle and climate system (Bengtsson, 2010). Changes in the intensity and pathways of moisture transport lead to variabilities in rain belts and patterns (Zhou et al., 2001; Huang et al., 2011). The Indochina Peninsula is located in the Asian monsoon region, where there is abundant moisture content and thus a greater vulnerability to climate change (Ge et al., 2017). For example, Thailand encountered its worst floods due to heavy and widespread rainfall during the 2011 rainy season, which resulted in more than 800 deaths and affected 13.6 million people (Promchote et al., 2016). Thus, investigating the moisture change for extreme precipitation over the Indochina Peninsula against the background of climate change is an important topic for the atmospheric water cycle and could provide guidance for regional water resources management and natural disaster prediction (Christensen and Christense, 2003).
The Indochina Peninsula is a unique region that lies in the transition zone between the South Asian monsoon and the East Asian monsoon (Zhang et al., 2002). Therefore, water vapor is transported by the low-level westerly over the Indian Ocean and the southeasterly associated with the subtropical ridge over the North Pacific. The moisture transport for precipitation over the Indochina Peninsula exhibits an apparent intraseasonal variability (Chhin et al., 2019). Prior to the onset of the summer monsoon, water vapor for precipitation is mainly contributed by the enhancement of moisture transport from the Bay of Bengal. In contrast, water vapor for precipitation during the summer monsoon is largely provided by moisture transport from the South China Sea. Moreover, the identification of moisture sources has received an increasing attention in the analysis of both extreme precipitation and a changing hydrological cycle due to climate change (Gimeno et al., 2013; Stojanovic et al., 2021).
The variations of moisture transport to the Indochina Peninsula are directly related to atmospheric circulations embedded in the planetary-scale Asia–Australia monsoon system (Chang et al., 2005). After the 1990s, the warming of surface temperature and enhancement of convective activity in the Indochina Peninsula deepened the monsoon trough and thereby increased the moisture transport from the Bay of Bengal to the Indochina Peninsula. Meanwhile, the deepened monsoon trough was able to induce more tropical cyclone activity over the Bay of Bengal to the South China Sea (Faikura et al., 2020) and significantly increased precipitation over the Indochina Peninsula (Takahashi et al., 2015). The monsoon trough may comprise an import portion of daily large-scale meteorological pattern (LMP), which provides a favorable circulation pattern for triggering or intensifying synoptic processes (e.g., moisture transport) to promote the occurrence of extreme precipitation and is connected to low-frequency modes of climate variability (Grotjahn et al., 2015). Since the warming has increased the water vapor holding capacity of the atmosphere and the variability of precipitation (Zhang et al., 2021), it would be of interest to investigate how changes in moisture transport associated with the change in LMP contribute to the extreme precipitation against different climate backgrounds, taking the Pacific Decadal Oscillation (PDO) for example.
Cheng et al. (2021) found a significant upward trend in extreme precipitation over South China and the Indochina Peninsula, which they attributed to the increasing frequency of the meridional wave train over East Asia. By contrast, the reason for the upward trend in extreme precipitation over the Indochina Peninsula remains an open question. Meanwhile, much of the effort in prior studies has focused primarily on the variabilities of monsoonal precipitation and the model representation of extreme precipitation over the Indochina Peninsula (e.g., Zhang et al., 2002; Ge et al., 2021; Tang et al., 2021; Wu and Zhu, 2021). This unanswered question served as motivation for the present study, which aims to explore the change in extreme precipitation over the Indochina Peninsula from the Lagrangian perspective of water vapor transport to address two issues: the change in water vapor transport and the underlying mechanisms. To answer these two questions, we first identify the daily LMP responsible for extreme precipitation over the Indochina Peninsula, mainly in terms of composite 850-hPa stream function anomalies and associated moisture transport. Then, we construct LMP indices by projecting daily 850-hPa stream function anomalies onto the LMP and investigate their potential linkages with anomalous remote forcing.
The remainder of this paper is organized as follows: Section 2 describes the data and methods. Section 3 presents the results in terms of the changes in LMP and water vapor transport from a Lagrangian perspective and the potential influence of the PDO on extreme precipitation. Section 4 discusses associations with weather systems of the intraseasonal variability. And finally, a summary of the study’s main findings is provided in Section 5.
Data and Methods
Data
The daily precipitation dataset comes from APHRODITE (Yatagai et al., 2012). This suite of high-resolution gridded datasets is jointly constructed by the Meteorology Institute of the Japan Meteorological Agency and the Research Institute for Humanity and Nature. They use a SphereMap-type scheme based on the rainfall distribution to interpolate Global Telecommunications System–based data from gauge observations, precompiled data by other projects or organizations, and data from individual collections to produce the gridded precipitation data. In this study, we adopt APHRO_MA_V1101 (1951–2007) and APHRO_MA_V1101EX (2007–2015) on a 0.5 × 0.5° latitude–longitude grid encompassing 15°S–55°N and 60°–155°E.
We also use the ERA5 global reanalysis dataset provided by the Copernicus Climate Change Service (Hersbach et al., 2020). The ERA5 reanalysis covers the period from 1950 to the present day. The variables used here are the u- and v-components of wind at 850, 700, and 200 hPa; total column water vapor; and vertically integrated eastward and northward water vapor fluxes. The air parcel tracking requires data at a relatively high horizontal and vertical grid spacing. Thus, six-hourly surface pressure, 3D winds, and specific humidity on a 0.5 × 0.5° longitude–latitude grid at 32 vertical levels between 1,000 and 10 hPa are used as the input for the Lagrangian analysis tool LAGRANTO 2.0.
The monthly mean sea surface temperature (SST) data used in this study are from the Extended Reconstructed SST, version 5 (ERSST.v5), of the National Oceanic and Atmospheric Administration (NOAA; Huang et al., 2017). These data are provided on a 2 × 2° longitude–latitude grid for the period from 1854 to the present day. We also use the PDO index and Madden-Julian Oscillation (MJO) index based on outgoing longwave radiation (OMI) provided by the NOAA Physical Sciences Laboratory. The western North Pacific tropical cyclone database comes from China Meteorological Administration (Lu et al., 2021).
Following prior studies (Zhang et al., 2002; Yang and Wu, 2019), we focus on the rainy season over the Indochina Peninsula from 1 May to 31 October in the years 1951–2015. The OMI is available for the period from 1979 to 2015.
Definition and Objective Classification of Extreme Precipitation
Given the large spatial variability of the topography, we use the values based on the 95th percentile instead of fixed absolute values to define the extreme-precipitation threshold value for each grid point (Lai et al., 2020). In addition, a spatial coverage criterion of extreme precipitation is also required to remove any regional influence of the topography. Therefore, an extreme-precipitation event is identified if the number of grid points with precipitation above the threshold values is at least 5% of the total grid points (Zhao et al., 2017). Accordingly, we identified 1,428 extreme precipitation events with 2,775 days over the Indochina Peninsula to South China (Cheng et al., 2021).
To isolate the extreme-precipitation patterns, we apply self-organizing maps (SOM; Kohonen, 2001) to all extreme-precipitation events over the Indochina Peninsula to South China. It works by mapping high-dimensional data to a low-dimensional representative space with a neuronal structure (readers are referred to Supplementary Material for more details). The precipitation percentiles of 1,232 grid points in the study area on 2,775 extreme-precipitation days are input into the SOM with a specified number of nodes. The SOM is trained over 50,000 iterations, with each cycle of training adjusting the weights of the neurons until, finally, the SOM outputs the optimal neurons representing the spatial patterns (i.e., best matching units) of extreme precipitation.
As shown in Cheng et al. (2021), the SOM is repeated with the number of nodes (N) from 2 to 20 to determine the optimum number of clusters, which shows that four clusters are sufficiently different from each other (Supplementary Figure S1). Readers are referred to the Supplementary Material for more details. These four best-matching units are then used to determine the cluster indices of 2,775 extreme-precipitation days by finding the minimum Euclidian distance among the percentile field on each extreme-precipitation day and best-matching units. The cluster indices associated with 2,775 extreme-precipitation days are used to composite the circulations for each cluster. These four clusters are named the South China cluster, the Indochina Peninsula cluster, the Burma–Yunnan cluster, and the Southern South China–Northern Vietnam cluster according to their respective geographical distributions of cluster-mean extreme precipitation (Supplementary Figure S2). The current study simply adopts the Indochina Peninsula cluster of extreme precipitation with 543 days (Figure 1).
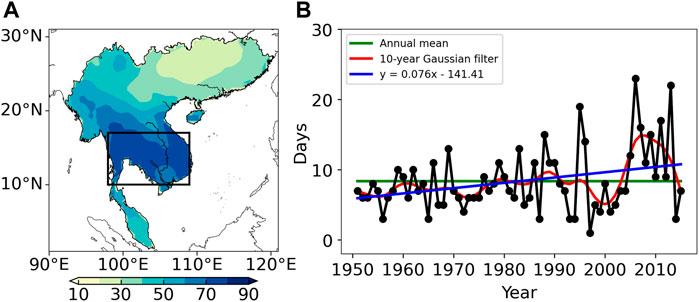
FIGURE 1. (A) Composite precipitation percentile and (B) time series of the annual number of days of extreme precipitation (black), along with the decadal variability (red) and long-term trend (blue) for extreme precipitation of the Indochina Peninsula cluster, which are adopted from Figures 5B and 9C in Cheng et al. (2021), respectively. The box in (A) denotes the starting region of the backward trajectories.
Running t-Test
We use a running t-test to detect a possible change in the series of the occurrence number of days of extreme precipitation (Fu and Wang, 1992). For time series with sample size
For the significance level
Backward Trajectories
The Lagrangian analysis tool LAGRANTO (Sprenger and Wernli, 2015) is applied to calculate 5-day backward trajectories of air parcels associated with extreme precipitation over the Indochina Peninsula. For more details, readers are referred to Sprenger and Wernli (2015), where they can find a schematic overview of the typical steps involved in computing trajectories. The advantage of LAGRANTO, compared to other trajectory tools such as FLEXTRA and HYSPLIT, is the highly flexible definition of the trajectory’s initial parcel position and height, which allows the results of each time step to be converted into trajectory density data (Schemm et al., 2017). Thus, it is a powerful Lagrangian analysis tool for the study of air mass trajectories.
Specifically, the grid points of the high-precipitation percentile area over the Indochina Peninsula are considered as initial air parcel positions, which are within the region of 10°–17°N and 98°–109°E (Figure 1A). The initial height for all grid points is 700 hPa, which is likely associated with the cloud for precipitation. The air parcels of these grid points are tracked backward for 5 days, starting from each of the extreme-precipitation days, which is sufficient to characterize the large-scale flow of air (Schemm et al., 2017). To exclude the overlap trajectory information for extremes, we select 128 out of 543 extreme-precipitation days such that there is no extreme-precipitation day within 5 days prior to an extreme-precipitation day. LAGRANTO provides information on air mass position along each trajectory in terms of longitude, latitude, and pressure height with the value of specific humidity. In addition, LAGRANTO also provides a density tool that converts all the trajectories to trajectory densities on a 1° × 1° longitude–latitude grid.
Potential Source Contribution Function Analysis
Potential source contribution function (PSCF) analysis is a method for identifying potential pollution sources based on the conditional probability function (Zeng and Hopke, 1989). The contribution of the pollution at each grid point to the pollution in the target region is calculated as the ratio of the residence time of the pollution trajectory to all trajectories. Some researchers have applied this method to investigate potential water vapor sources, which has revealed a relatively good capability of PSCF analysis in identifying moisture sources (Salamalikis et al., 2015; Meng et al., 2020). To begin with, following Wang et al. (2014), the threshold value is calculated by averaging the specific humidity along all the trajectories, which is used to determine the potential contribution of a trajectory. Then, for a grid point, the number of trajectories with the specific humidity exceeding the threshold values is counted. A larger number of counted trajectories indicates that the grid point has a high PSCF value. An area including a larger number of grid points with high PSCF values can be considered to be a potential moisture source. At the same time, in order to reduce the error of the conditional probability function that is due to the small total number of samples, a weight function
where
Results
Circulation Features of Extreme Precipitation
Figure 1 displays the composite precipitation percentile and corresponding time series of the annual number of days of extreme precipitation for the Indochina Peninsula cluster. The extreme precipitation is concentrated over the southern Indochina Peninsula (Figure 1A). Its annual occurrence number exhibits a significant upward trend at the 99% confidence level. Such an upward trend might be contributed by the amplified decadal variability in the 21st century, when there was an anomalously high number of days of extreme precipitation during 2003–2015. In contrast, the decadal variability generally fluctuates around the annual mean in the 20th century. The amplified decadal variability in the 21st century suggests a potential abrupt change in extreme precipitation over the Indochina Peninsula.
To begin with, we introduce the daily LMP in terms of stream function anomalies that are directly associated with extreme precipitation (Xie et al., 2017; Zhao et al., 2017). Figure 2 displays the composite 850- and 200-hPa stream function and corresponding anomalies and 700-hPa specific humidity anomalies overlaid with horizontal wind anomalies during days of extreme precipitation. The reason that we chose 700 hPa for specific humidity is that its value is not too small and its anomaly is stronger compared to 850 hPa (Supplementary Figure S3). The LMP is characterized by an enhanced typical summer monsoon pattern (Zhang et al., 2002). Specifically, the 850-hPa LMP features a dipole pattern with a zonally elongated Mascarene high and a deepened monsoon trough from northern India to the South China Sea (Figure 2A). Due to this intensified dipole, the low-level westerly jet is enhanced between the dipole from Somalia to the South China Sea (Figure 2C). As such, this cyclonic anomaly circulation accumulates water vapor from both the Indian Ocean and the South China Sea to the Indochina Peninsula, resulting in an increased water vapor over there. In the upper level (Figure 2B), the South Asian high is amplified from the Arab Peninsula southeastward to the Malay Peninsula. The amplified South Asian high enhances the divergent circulation in the upper level and thus the upward motions over the Indochina Peninsula, which facilitates convections for extreme precipitation. As such, the amplified South Asian high also favors the enhancement of the low-level monsoon dipole (e.g., the 850-hPa LMP). The LMP characterized by an intensification of the Asian monsoon configuration favors both water vapor transport to the Indochina Peninsula and convective activity, which tends to induce extreme precipitation.
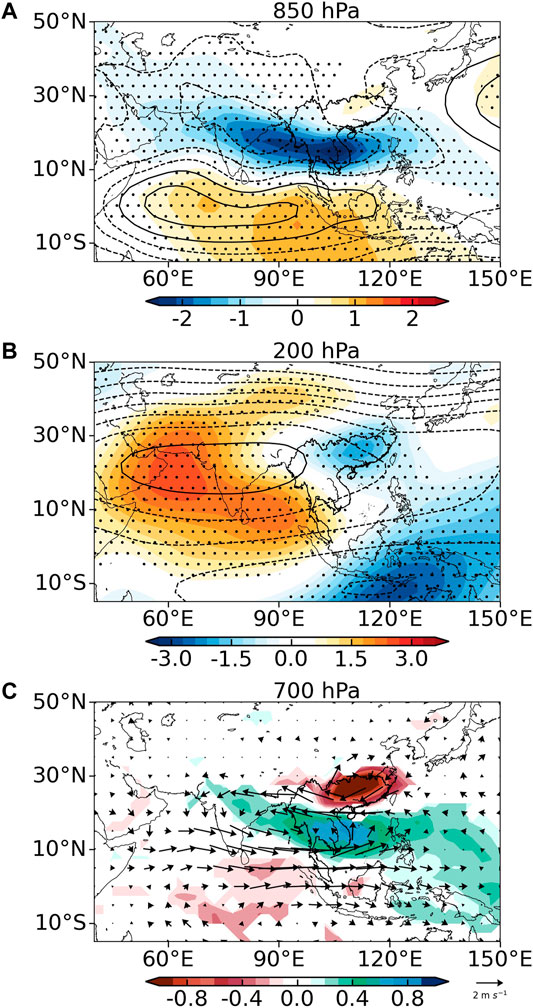
FIGURE 2. Composite stream function (contours; units: 106 m2 s−1) and corresponding anomalies relative to the climatological mean (shading) associated with extreme precipitation at (A) 850 hPa and (B) 200 hPa. Contours are drawn at intervals of 3 and 10 for (A, B), respectively. (C) is the composite 700-hPa specific humidity anomalies (shading, units: g kg−1) and horizontal wind anomalies (arrows, units: m s−1). Stippling in (A, B) and shading in (C) indicate composite values that are statistically significant at the 90% confidence level.
Change in the Large-Scale Meteorological Pattern
As mentioned above, the enhanced decadal variability of the annual occurrence of extreme precipitation in the 21st century suggests a potential transition. To verify this speculation, we apply a running t-test method to the time series of the annual number of days of extreme precipitation to obtain its change point (Fu and Wang, 1992). As anticipated, there is a transition year in 2003, which is statistically significant at the 95% confidence level (Figure 3). Accordingly, the entire period can be divided into two subperiods of 1951–2002 and 2003–2015. In comparison with the period 1951–2002, there is a greater mean number of extreme precipitation days during 2003–2015. This change coincides with decadal shifts in well-known long-term climate modes such as the PDO and the Atlantic Multidecadal Oscillation (Liu et al., 2020). We discuss the potential influence of the PDO on extreme precipitation over the Indochina Peninsula in Section 3.4.
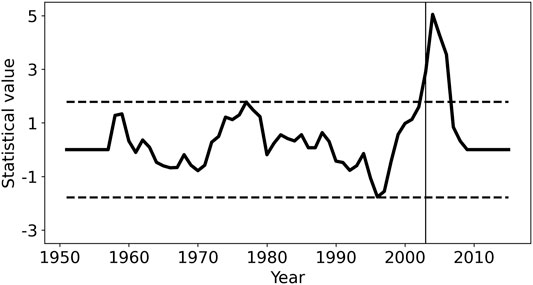
FIGURE 3. Decadal shift in the total number of days of extreme precipitation according to a running t-test and Lepage test, respectively. The dashed lines represent the critical values at the 95% significance level, and the thin vertical line denotes the change year of 2003.
Figure 4 shows the differences in the LMPs and water vapor associated with extreme precipitation during 2003–2015 and 1951–2002. In comparison with the LMPs associated with extreme precipitation during 1951–2002, the monsoon pattern is intensified during 2003–2015. In the lower troposphere (Figure 4A), the monsoon trough is deepened over northern India, whereas it is weakened over the Malay Peninsula. To the south, the zonally elongated Mascarene high magnifies and extends northward. As a result, the gradient between this dipole intensifies, which enhances the low-level westerly jet from Somalia to the Indochina Peninsula (Figure 4C), which favors the transport of water vapor from the Indian Ocean to the Indochina Peninsula. Meanwhile, a weak negative anomaly can be seen over the South China Sea, which also helps convey water vapor from the South China Sea to the Indochina Peninsula. An increased water vapor is observed over the Indochina Peninsula (Figure 4C). At 200 hPa (Figure 4B), a meridional dipole pattern resides over Asia, indicating a further amplification and westward displacement of the South Asian high, which further intensifies the upward motions for extreme precipitation over the Indochina Peninsula. Following the intensification of the LMPs, extreme precipitation becomes more frequent during the period 2003–2015 compared with 1951–2002.
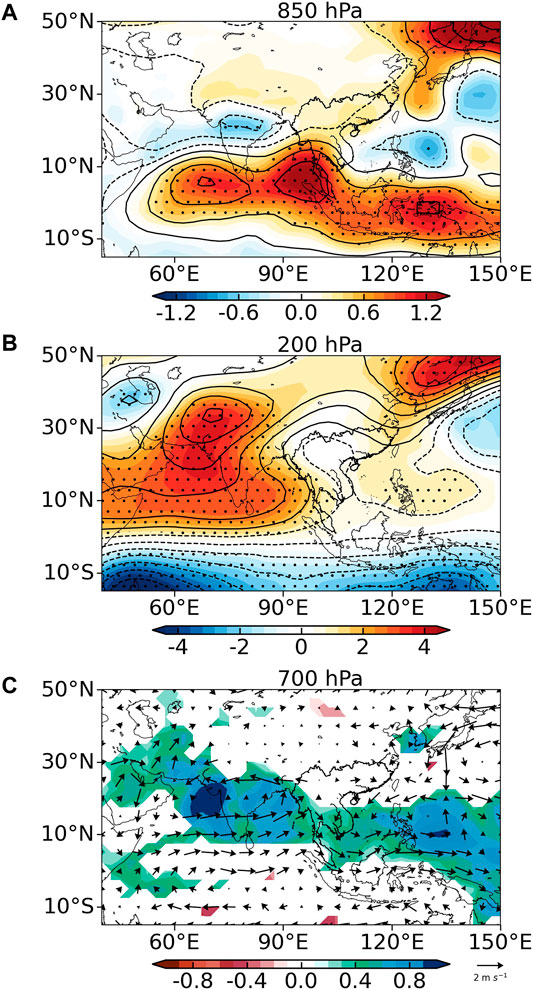
FIGURE 4. Differences in composite stream functions (contours; units: 106 m2 s−1) associated with extreme precipitation during the subperiods of 1951–2002 and 2003–2015 at (A) 850 hPa and (B) 200 hPa. Contours are drawn at intervals of 0.5 and 1 in (A, B), respectively. (C) is the differences of composite 700-hPa specific humidity (shading, units: g kg−1) and horizontal wind (arrows, units: m s−1) during the subperiods. Stippling in (A, B) and shading in (C) indicate composite values that are statistically significant at the 90% confidence level.
Change in Water Vapor Transport
Given the significant change in the LMP associated with extreme precipitation, it is of interest to investigate the change in water vapor transport and the possible driving factors. To explore these two aspects, we use the Lagrangian analysis tool LAGRANTO to calculate the 5-day backward trajectories of air masses associated with extreme precipitation over the region of 98°–109°E and 10°–17°N (Figure 1A). The trajectory density is then calculated by counting the number of trajectory points within each 1° × 1° grid box using the density tool of LAGRANTO.
Figures 5A–C show the trajectory density patterns for the extreme precipitation in the two subperiods. There are two major channels of water vapor: one along the low-level westerly jet over the Indian Ocean and the other along the gyre of the monsoon trough over the South China Sea (Figures 5A,B). In comparison with those during 1951–2002, both of water vapor channels displace southward during 2003–2015 (Figure 5C). Moreover, the water vapor channel over the Indian Ocean bends southward over Sri Lanka owing to the deepened monsoon trough over India. The different trajectory densities of the air masses suggest that the water vapor channel over the Indian Ocean is weakened over the Bay of Bengal and displaced southward in accordance with the enhanced low-level westerly jet. By contrast, although the westerly over the South China Sea weakens, the trajectory density of air masses is increased.
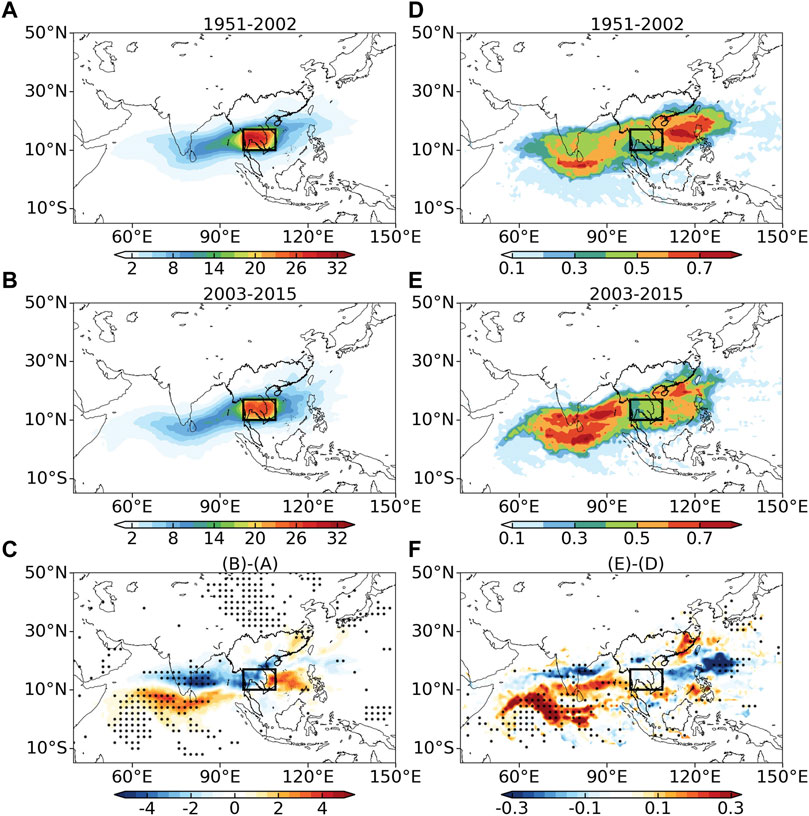
FIGURE 5. Trajectory density patterns for the extreme precipitation during (A) 1951–2002, (B) 2003–2015, and (C) their differences. (D–F) as in (A–C) but for the PSCF. Only differences that are statistically significant at the 90% confidence level are stippled in (C, F).
However, there is a deficiency in the trajectory density of air masses, in which not all trajectories include large values of water vapor for precipitation. To address this issue, we apply PSCF analysis to each air mass trajectory to reveal the potential water vapor sources (Figures 5D,E). As seen from Figure 5D, the water vapor for the extreme precipitation during the period 1951–2002 is largely contributed by the South China Sea channel, which is conveyed by the gyre of the monsoon trough. Meanwhile, the large values of water vapor in the channel over the Indian Ocean are distributed from the south to Sri Lanka northeastward to the Indochina Peninsula.
In contrast, the water vapor of extreme precipitation during the period 2003–2015 is primarily contributed by the Indian Ocean channel (Figures 5E,F). Despite the reduced trajectory density of air masses over the Bay of Bengal, the PSCF increases not only over the Bay of Bengal but also the Indian Ocean. The result suggests that there could be more water vapor in the atmosphere over the Indian Ocean during the period 2003–2015. Since the low-level westerly jet is enhanced owing to the intensification of the LMP (Figures 5A–C), the higher wind speed helps water to evaporate from the ocean. In contrast, the westerly is weakened over the South China Sea during the period 2003–2015 compared with during 1951–2002. Therefore, the decelerated wind suppresses the evaporation of water from the South China Sea. Meanwhile, the decelerated wind leads to air masses lingering over the South China Sea, which results in a higher density of air masses. In spite of the increased trajectory density of air masses over the South China Sea, the PSCF decreases.
The water vapor channel over the Indian Ocean agrees with the findings of Stojanovic et al. (2021), who identified this as the dominant moisture source for precipitation over Vietnam. In comparison with their study, we found an additional moisture source over the South China Sea and a parallel water vapor channel over the Bay of Bengal for the larger occurrence number of extreme precipitation during 2003–2015. These results are in contrast to the general view that extreme precipitation requires more water vapor sources.
In comparison with the Lagrangian perspective and PSCF analysis, water vapor flux from the Eulerian perspective may provide anomalous westward water vapor fluxes over the South China Sea due to the easterly anomaly (Figures 4C and 6F). The PSCF analysis of the backward trajectories of air masses can rule out this potential error.
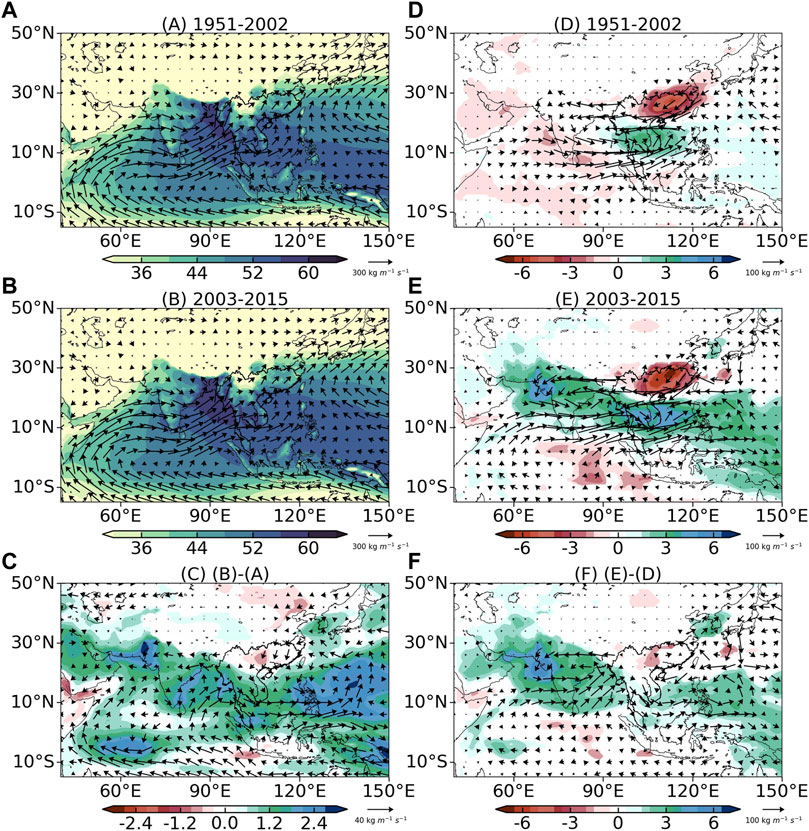
FIGURE 6. Climatological mean total column water vapor (shading; units: kg m−2) and vertically integrated water vapor flux (arrows; units: kg m−1 s−1) during (A) 1951–2002, (B) 2003–2015, and (C) their differences. (D–F) as in (A–C), but for the anomaly fields associated with extreme-precipitation days. Only differences that are statistically significant at the 90% confidence level are shaded in (C–F).
To corroborate the elevated water vapor in the 21st century, Figure 6 displays the climatological mean total column water vapor and vertically integrated water vapor flux and their anomaly fields associated with extreme precipitation for the two subperiods. The water vapor exhibits a circular distribution around the Indochina Peninsula, with the largest value over the Bay of Bengal (Figures 6A,B). These large values of water vapor are transported by the low-level westerly jet over the Indian Ocean and the cross-equatorial flow from the Australian high to the South China Sea. In comparison with that over the South China Sea, the water vapor flux is larger over the Indian Ocean and converges over the Bay of Bengal because of the topography.
Undoubtedly, water vapor increases over most of the region from the period 1951–2002 to 2003–2015 (Figure 6C), since climate warming leads to the atmosphere being able to hold more water vapor. Water vapor elevates more evidently over the Bay of Bengal than the South China Sea. A close inspection of Figure 6C shows enhanced northeastward water vapor flux associated with the deepened monsoon trough over India and the amplified Mascarene high. By contrast, the northward water vapor flux is weakened over the South China Sea. Therefore, the change of the climatological mean flow over the Bay of Bengal, compared to the South China Sea, provides a more favorable water vapor condition for the extreme precipitation over the Indochina Peninsula in 2003–2015.
Considering the days of extreme precipitation, the mean fields of total column water vapor and vertically integrated water vapor flux generally resemble those of the climatological mean field but with enhanced water vapor over the Indochina Peninsula and eastward water vapor flux over the Indian Ocean (figure not shown). During 1951–2002, the positive water vapor anomaly is confined over the Indochina Peninsula to the South China Sea, which is contributed by eastward water vapor flux from the Indian Ocean and westward water vapor flux from the South China Sea associated with the enhanced monsoon dipole (Figure 6D). In contrast, during 2003–2015, the positive water vapor anomaly dominates the Arab Sea via Indochina to the subtropical Pacific Ocean, which is associated with the eastward water vapor flux from Somalia (Figure 6E). The differences of water vapor and flux between two subperiods feature amplified water vapor and enhanced eastward transport over India via Indochina to the subtropical Pacific Ocean (Figure 6F), which is consistent with the increased climatological mean water vapor and eastward water vapor flux and the intensification of the LMP.
Association With Pacific Decadal Oscillation
It is well recognized that El Niño–Southern Oscillation (ENSO), one of the strongest SST signals in interannual climate variability, exerts a significant impact on the interannual variability of monsoon precipitation over the Indochina Peninsula (Zhang et al., 2002; Ge et al., 2021; Wu and Zhu, 2021). To investigate the potential influence of SST anomalies on the extreme precipitation over the Indochina Peninsula, we construct an LMP index by projecting each daily 850-hPa stream function anomaly pattern
where A represents the area of the LMP (15S°–30°N, 60°–125°E), which encompasses the anomalous circulation directly associated with extreme rainfall; a is the mean radius of the Earth; and
Figure 7 displays regression maps of the SST during spring and summer against the unfiltered and decadal time series of the detrended LMP index. On the interannual time scale, the LMP is obviously associated with the La Niño pattern (Figures 7A,C), which agrees with prior studies regarding the influence of ENSO on monsoon precipitation over the Indochina Peninsula (Zhang et al., 2002; Ge et al., 2021; Wu and Zhu, 2021). Ge et al. (2021) showed that La Niño induces a cyclonic circulation over both the western North Pacific and the Bay of Bengal and thus brings in more water vapor from the Pacific and Indian Oceans for the monsoon precipitation over the Indochina Peninsula.
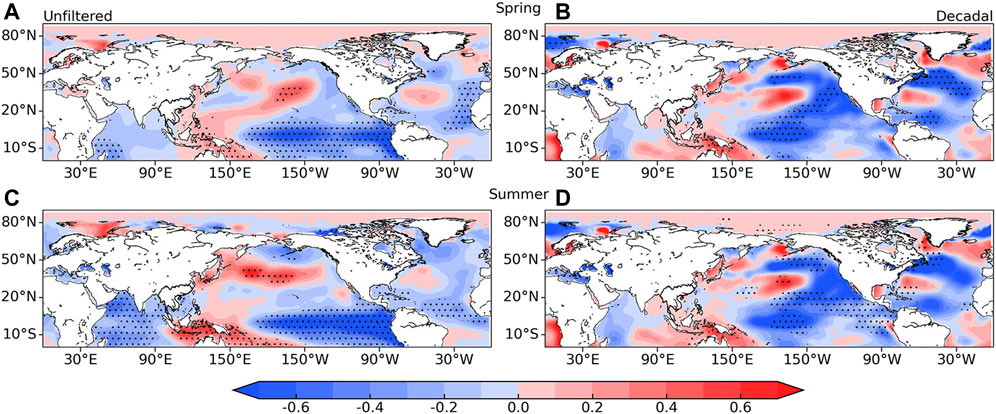
FIGURE 7. Regression maps of SST anomalies (unit: °C) during (A) spring and (B) summer against unfiltered time series of LMP indices. (C, D) as in (A, B), but for the decadal time series of LMP indices. Stippling indicates regression coefficients that are statistically significant at the 90% confidence level.
In addition, the midlatitude North Pacific central-western SST is significantly warm, and the tropical central-eastern Pacific and North Pacific North American west coast SSTs are anomalously cold, indicative of the negative phase of the PDO (Mantua et al., 1997). Given that the unfiltered time series of the LMP index is primarily contributed by the interannual variability, we remove this time scale by applying a 10-year Gaussian filter. The regression map of SST anomalies against the decadal time series of the LMP index confirms that the LMP is indeed correlated with the negative phase of the PDO. To verify the influence of the PDO on the LMP and extreme precipitation, Figure 8 displays the probability density function (PDF) of the LMP index and occurrence of extreme precipitation stratified by the PDO phases (±1 standard deviation) for summer. The PDF of LMP indices is right-skewed during the negative phase of the PDO (Figure 8A). Meanwhile, the occurrence of extreme precipitation is also most frequent during the negative phase of the PDO (Figure 8B). The result suggests that the negative phase of the PDO in the 21st century contributes substantially to the increased occurrence number of days of extreme precipitation over the Indochina Peninsula via populating larger values of the LMP indices.
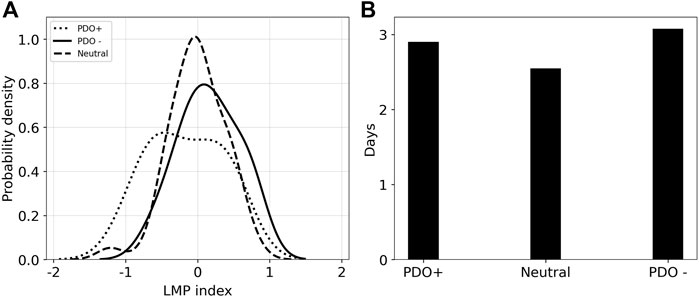
FIGURE 8. (A) PDF of LMP indices and (B) the relative frequency of extreme precipitation during different phases of the PDO.
We acknowledge that not all larger value of the LMP indices can induce extreme precipitation over the Indochina Peninsula. Even though a larger value of the LMP index does not produce extreme precipitation, it is likely to induce intense rainfall. Cheng et al. (2021) noted that the LMP in terms of stream function anomalies is contaminated by the global warming signal, which increases the stream function value in the Northern Hemisphere. If the LMP is defined in terms of relative vorticity, the relationship between such an LMP and the PDO would strengthen.
Discussion
Since the period of May–October includes the decay stage of the summer monsoon, a natural question arises: there must be some extreme precipitation that is not associated with the summer monsoon, particularly in October. To answer this question, we investigated the relationships between extreme precipitation and tropical cyclone and MJO. We calculated the relative frequency of tropical cyclone and OMI associated with extreme precipitation during periods of May–August and September–October normalized by the number of years and months.
Figure 9 displays the relative frequency of tropical cyclone center associated with extreme precipitation over 1951–2015 and its difference between two subperiods of 1951–2002 and 2003–2015. During May–August, tropical cyclones associated with extreme precipitation are confined to the northeastern Indochina Peninsula (Figure 9A). In contrast, tropical cyclones associated with extreme precipitation during September–October not only increase in number but also dominate the southern Indochina Peninsula (Figure 9B). The result suggests that tropical cyclones contribute more to extreme precipitation during the decay stage of summer monsoon than the peak of summer monsoon. Considering the difference between two subperiods (Figures 9C,D), an apparent increase is seen over central Indochina during September–October. Therefore, the increase of extreme-precipitation-associated tropical cyclone also provides some contributions to the more extreme-precipitation days during 2003–2015 compared to 1951–2002, particularly during the decaying stage of the summer monsoon.
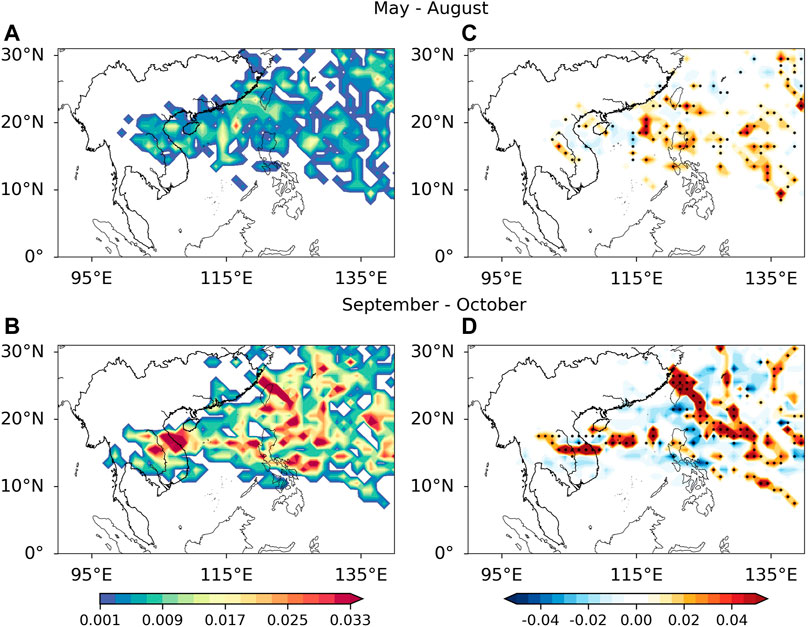
FIGURE 9. The relative frequency of tropical cyclone center associated with extreme precipitation during (A) May–August and (B) September–October over 1951–2015. (C, D) as in (A, B), but for the differences in frequency of tropical cyclone center associated with extreme precipitation during the subperiods of 1951–2002 and 2003–2015. Only differences that are statistically significant at the 90% confidence are stippled in (C, D).
A parallel analysis is performed for extreme precipitation associated with MJO (Figure 10). Extreme precipitation is mainly associated with phases 5–7 of MJO that correspond to pronounced convections from India via Indochina to the western Pacific and stream function anomalies resembling the LMP (see https://psl.noaa.gov/mjo/mjoindex/pdf/psi850.1x.20ns.omi.amp1.096.jja.7912.pdf). In comparison with May–August, there are more extreme-precipitation days associated with phases 5–7 of MJO during the decaying stage of the summer monsoon (Figures 10A,B). The result indicates that phases 5–7 of MJO contribute more to extreme precipitation during the decaying stage of the summer monsoon. Considering the change between two subperiods of 1951–2002 and 2003–2015 (Figures 10C,D), there are positive frequency anomalies of extreme precipitation associated with phases 5 and 6 of MJO, which have stronger convections over the Indochina Peninsula than phase 7 of MJO. Therefore, phases 5 and 6 act to increase occurrence frequency of extreme precipitation during 2003–2015 compared to 1951–2002, particularly during the decaying stage of the summer monsoon.
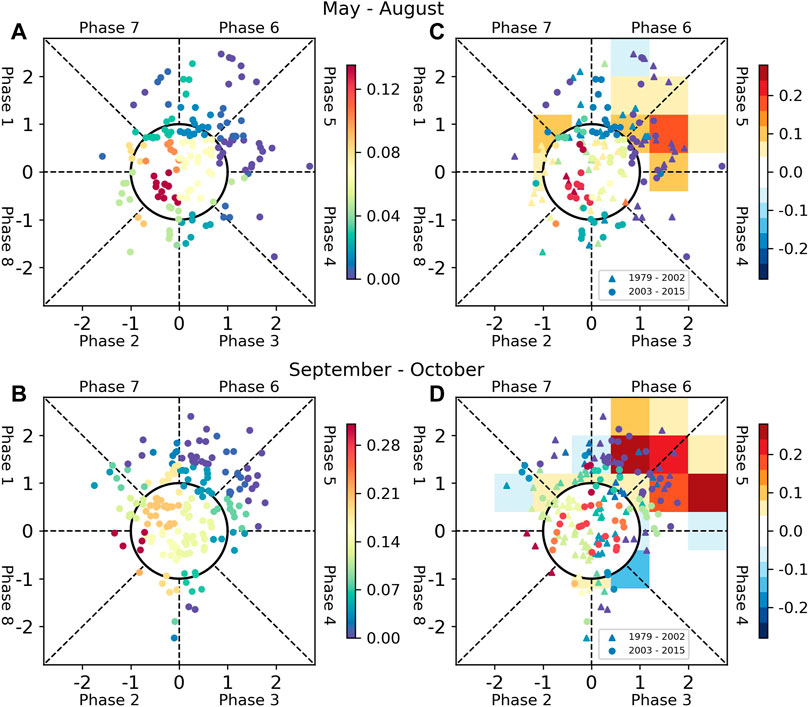
FIGURE 10. Phase plots of OMI associated with extreme precipitation during (A) May–August and (B) September–October over 1951–2015. The color shading indicates the relative frequency of OMI in each 0.7 × 0.7 bin. (C, D) as in (A, B), but for the differences (shading) in frequency of OMI during the subperiods of 1951–2002 and 2003–2015.
The tropical cyclone and MJO provide contributions to occurrence frequency of extreme precipitation during the decay stage of the summer monsoon and thus to the decadal variability of extreme precipitation over the Indochina Peninsula. However, they both carry a large amount of water vapor and may be implicitly included in the change of the foregoing water vapor analysis.
Summary
The decadal change in extreme precipitation over the Indochina Peninsula during the rainy season (May–October) during 1951–2015 is investigated in this study. The annual occurrence number of days of extreme precipitation exhibits a significant upward trend, possibly contributed by the amplified decadal variability during the period 2003–2015. A running t-test shows an abrupt change in the year 2003 for the annual occurrence number of days of extreme precipitation. Therefore, this study focuses on the change in extreme precipitation between the two subperiods of 1951–2002 and 2003–2015 in terms of changes of circulation pattern and water vapor transport from the Lagrangian perspective.
The extreme precipitation is associated with an intensified monsoon dipole pattern in which the monsoon trough is deepened from northern India to the Indochina Peninsula and the Mascarene high is amplified. Therefore, the low-level westerly jet is enhanced from Somalia to the Indochina Peninsula and a monsoon trough gyre over the South China Sea. The analysis with the Lagrangian tool shows that these two flows constitute two major water vapor channels: one along the low-level westerly jet over the Indian Ocean and the other from the South China Sea.
The monsoon pattern is intensified from the subperiod of 1951–2002 to that of 2003–2015. The monsoon trough is deepened over northern India, and the Mascarene high is amplified, which results in an intensification and southward displacement of the low-level westerly jet over the Indian Ocean. Meanwhile, the acceleration of wind speed increases the evaporation of water from the Indian Ocean. Therefore, the PSCF analysis reveals that the contributions of water vapor from the Bay of Bengal and the Indian Ocean both increase. In contrast, the wind speed is decelerated over the South China Sea and thereby leads to lingering air masses over the South China Sea, which can suppress the evaporation of water from the sea. Despite more air mass trajectories over the South China Sea, the contribution of water vapor from the South China Sea decreases.
The present study primarily focuses on the changes in the atmospheric circulation pattern and water vapor for the change in extreme precipitation and preliminarily discusses a possible influence of SST anomalies—particularly ENSO and the PDO. The negative phase of the PDO populates larger values of the LMP and thus enhances the water vapor channel over the Indian Ocean, resulting in an abnormally high frequency of extreme precipitation in the 21st century. In future work, we will carry out atmospheric general circulation model experiments to explore this pathway between the PDO and extreme precipitation over the Indochina Peninsula.
Data Availability Statement
The original contributions presented in the study are included in the article/Supplementary Material, further inquiries can be directed to the corresponding author.
Author Contributions
ZC drafted the first version of the paper. ZX writing, editing, and responding of the review. All authors provided feedback on the paper.
Funding
This research is jointly supported by the National Key Research and Development Program of China (Grant 2016YFA0601500), the National Natural Science Foundation of China (Grants 41861144014 and 41875078), and the Huaneng Group Technology Project (Phase 1) “Offshore Wind Power and Intelligent Energy System” (No. HNKJ20-H88).
Conflict of Interest
JY was employed by China Huaneng Group Co., Ltd.
The remaining authors declare that the research was conducted in the absence of any commercial or financial relationships that could be construed as a potential conflict of interest.
Publisher’s Note
All claims expressed in this article are solely those of the authors and do not necessarily represent those of their affiliated organizations, or those of the publisher, the editors and the reviewers. Any product that may be evaluated in this article, or claim that may be made by its manufacturer, is not guaranteed or endorsed by the publisher.
Acknowledgments
The authors are grateful to two reviewers for their instructive suggestions and comments. We thank the Joint Laboratory of Offshore Wind Power and Intelligent Energy System for providing the funding. We thank the Atmospheric Dynamics Group, Institute for Atmospheric and Climate Science, ETH Zurich for providing LAGRANTO via https://iacweb.ethz.ch/staff/sprenger/lagranto/ and Michael Sprenger for providing help with running it.
Supplementary Material
The Supplementary Material for this article can be found online at: https://www.frontiersin.org/articles/10.3389/feart.2021.758664/full#supplementary-material
References
Alexander, L. V., Zhang, X., Peterson, T. C., Caesar, J., Gleason, B., Klein Tank, A. M. G., et al. (2006). Global Observed Changes in Daily Climate Extremes of Temperature and Precipitation. J. Geophys. Res. 111, D05109. doi:10.1029/2005JD006290
Bengtsson, L. (2010). The Global Atmospheric Water Cycle. Environ. Res. Lett. 5, 025202. doi:10.1088/1748-9326/5/2/025202
Chang, C.-P., Wang, Z., McBride, J., and Liu, C.-H. (2005). Annual Cycle of Southeast Asia-Maritime Continent Rainfall and the Asymmetric Monsoon Transition. J. Clim. 18, 287–301. doi:10.1175/JCLI-3257.1
Cheng, Z. L., Xie, Z. W., Bueh, C., Gong, Y. F., Jian, J., and Lai, S. (2021). Spatiotemporal Characteristics of Extreme Precipitation in Indochina Peninsula and South China. Chin. J. Atmos. Sci. Accepted. in Chinese.
Chhin, R., Shwe, M. M., and Yoden, S. (2019). Time‐lagged Correlations Associated with Interannual Variations of Pre‐monsoon and post‐monsoon Precipitation in Myanmar and the Indochina Peninsula. Int. J. Climatol. 40, 3792–3812. doi:10.1002/joc.6428
Christensen, J. H., and Christensen, O. B. (2003). Severe Summertime Flooding in Europe. Nature 421, 805–806. doi:10.1038/421805a
Faikrua, A., Pimonsree, S., Wang, L., Limsakul, A., Singhruck, P., and Dong, Z. (2020). Decadal Increase of the Summer Precipitation in Thailand after the Mid-1990s. Clim. Dyn. 55, 3253–3267. doi:10.1007/s00382-020-05443-8
Fu, C. B., and Wang, Q. (1992). The Definition and Detection of the Abrupt Climatic Change. Chin. J. Atmos. Sci. 16, 482–493. doi:10.3878/j.issn.1006–9895.1992.04.11
Ge, F., Zhi, X., Babar, Z. A., Tang, W., and Chen, P. (2017). Interannual Variability of Summer Monsoon Precipitation over the Indochina Peninsula in Association with ENSO. Theor. Appl. Climatol. 128, 523–531. doi:10.1007/s00704-015-1729-y
Ge, F., Zhu, S., Sielmann, F., Fraedrich, K., Zhu, X., Zhang, L., et al. (2021). Precipitation over Indochina during the Monsoon Transition: Modulation by Indian Ocean and ENSO Regimes. Clim. Dyn. 57, 2491–2504. doi:10.1007/s00382-021-05817-6
Gimeno, L., Nieto, R., Drumond, A., Castillo, R., and Trigo, R. (2013). Influence of the Intensification of the Major Oceanic Moisture Sources on continental Precipitation. Geophys. Res. Lett. 40, 1443–1450. doi:10.1002/grl.50338
Grotjahn, R., Black, R., Leung, R., Wehner, M. F., Barlow, M., Bosilovich, M., et al. (2015). North American Extreme Temperature Events and Related Large Scale Meteorological Patterns: a Review of Statistical Methods, Dynamics, Modeling, and Trends. Clim. Dyn. 46, 1151–1184. doi:10.1007/s00382-015-2638-6
Hersbach, H., Bell, B., Berrisford, P., Hirahara, S., Horányi, A., Muñoz‐Sabater, J., et al. (2020). The ERA5 Global Reanalysis. Q.J.R. Meteorol. Soc. 146, 1999–2049. doi:10.1002/qj.3803
Huang, B., Thorne, P. W., Banzon, V. F., Boyer, T., Chepurin, G., Lawrimore, J. H., et al. (2017). Extended Reconstructed Sea Surface Temperature, Version 5 (ERSSTv5): Upgrades, Validations, and Intercomparisons. J. Clim. 30, 8179–8205. doi:10.1175/JCLI-D-16-0836.1
Huang, R. H., Chen, J. L., and Liu, Y. (2011). Interdecadal Variation of the Leading Modes of Summertime Precipitation Anomalies over Eastern China and its Association with Water Vapor Transport over East Asia. Chin. J. Atmos. Sci. 35, 589–606. doi:10.3878/j.issn.1006-9895.2011.04.01
Kohonen, T. (2001). Self-Organizing Maps. 3rd Edition. Berlin: Springer Press. doi:10.1007/978-3-642-56927-2
Lai, S., Xie, Z., Bueh, C., and Gong, Y. (2020). Fidelity of the APHRODITE Dataset in Representing Extreme Precipitation over Central Asia. Adv. Atmos. Sci. 37, 1405–1416. doi:10.1007/s00376-020-0098-3
Liu, Y., Chen, H., Zhang, G., Sun, J., Li, H., and Wang, H. (2020). Changes in Lake Area in the Inner Mongolian Plateau under Climate Change: The Role of the Atlantic Multidecadal Oscillation and Arctic Sea Ice. J. Clim. 33, 1335–1349. doi:10.1175/JCLI-D-19-0388.1
Lu, X., Yu, H., Ying, M., Zhao, B., Zhang, S., Lin, L., et al. (2021). Western North Pacific Tropical Cyclone Database Created by the China Meteorological Administration. Adv. Atmos. Sci. 38, 690–699. doi:10.1007/s00376-020-0211-7
Mantua, N. J., Hare, S. R., Zhang, Y., Wallace, J. M., and Francis, R. C. (1997). A Pacific Interdecadal Climate Oscillation with Impacts on salmon Production. Bull. Amer. Meteorol. Soc. 78, 1069–1079. doi:10.1175/1520-0477(1997)078<1069:APICOW>2.0.CO;2
Meng, H. F., Zhang, M. J., Wang, S. J., Qiu, X., Zhou, S. E., Zhang, Y. N., et al. (2020). Precipitation Isotope Characteristics and Water Vapor Source Analysis in the Upper Reaches of the Heihe River. J. Glaciol. Geocryol. 42, 937–951. doi:10.7522/j.issn.1000-0240.2020.0068
Promchote, P., Simon Wang, S.-Y., and Johnson, P. G. (2016). The 2011 Great Flood in Thailand: Climate Diagnostics and Implications from Climate Change. J. Clim. 29, 367–379. doi:10.1175/JCLI-D-15-0310.1
Salamalikis, V., Argiriou, A. A., and Dotsika, E. (2015). Stable Isotopic Composition of Atmospheric Water Vapor in Patras, Greece: A Concentration Weighted Trajectory Approach. Atmos. Res. 152, 93–104. doi:10.1016/j.atmosres.2014.02.021
Schemm, S., Nummelin, A., Kvamstø, N. G., and Breivik, Ø. (2017). The Ocean Version of the Lagrangian Analysis Tool LAGRANTO. J. Atmos. Ocean. Technol. 34, 1723–1741. doi:10.1175/JTECH-D-16-0198.1
Sprenger, M., and Wernli, H. (2015). The LAGRANTO Lagrangian Analysis Tool - Version 2.0. Geosci. Model. Dev. 8, 2569–2586. doi:10.5194/gmd-8-2569-2015
Stojanovic, M., Nieto, R., Liberato, M. L. R., Sorí, R., Vázquez, M., and Gimeno, L. (2021). Tracking the Origins of Moisture over Vietnam: The Role of Moisture Sources and Atmospheric Drivers on Seasonal Hydroclimatic Conditions. Int. J. Climatol. 41, 5843–5861. doi:10.1002/joc.7156
Takahashi, H. G., Fujinami, H., Yasunari, T., Matsumoto, J., and Baimoung, S. (2015). Role of Tropical Cyclones along the Monsoon Trough in the 2011 Thai Flood and Interannual Variability. J. Clim. 28, 1465–1476. doi:10.1175/JCLI-D-14-00147.1
Tang, B., Hu, W., and Duan, A. (2021). Assessment of Extreme Precipitation Indices over Indochina and South China in CMIP6 Models. J. Clim. 34, 7507–7524. doi:10.1175/JCLI-D-20-0948.1
Wang, A. P., Zhu, B., Yin, Y., Jin, L. J., and Zhang, L. (2014). Aerosol Number Concentration Properties and Potential Sources Areas Transporting to the Top of Mountain Huangshan in Summer. China. Environ. Sci. 34, 852–861. doi:10.3969/j.issn.1000-6923.2014.04.008
Wu, R., and Zhu, P. (2021). Interdecadal Change in the Relationship of Indochina Peninsula May Precipitation to ENSO. Int. J. Climatol. 41, 2441–2455. doi:10.1002/joc.6968
Xie, Z., Black, R. X., and Deng, Y. (2017). The Structure and Large-Scale Organization of Extreme Cold Waves over the Conterminous United States. Clim. Dyn. 49, 4075–4088. doi:10.1007/s00382-017-3564-6
Yang, Y., and Wu, R. (2019). Seasonal Variation of Precipitation over the Indochina Peninsula and its Impact on the South China Sea spring Warming. Int. J. Climatol. 39, 1618–1633. doi:10.1002/joc.5904
Yatagai, A., Kamiguchi, K., Arakawa, O., Hamada, A., Yasutomi, N., and Kitoh, A. (2012). APHRODITE: Constructing a Long-Term Daily Gridded Precipitation Dataset for Asia Based on a Dense Network of Rain Gauges. Bull. Am. Meteorol. Soc. 93, 1401–1415. doi:10.1175/BAMS-D-11-00122.1
Zeng, Y., and Hopke, P. K. (1989). A Study of the Sources of Acid Precipitation in Ontario, Canada. Atmos. Environ. (1967) 23, 1499–1509. doi:10.1016/0004-6981(89)90409-5
Zhang, R., Chu, Q., Zuo, Z., and Qi, Y. (2021). Summertime Moisture Sources and Transportation Pathways for China and Associated Atmospheric Circulation Patterns. Front. Earth Sci. 9, 756943. doi:10.3389/feart.2021.756943
Zhang, R., Sun, C., Zhu, J., Zhang, R., and Li, W. (2020). Increased European Heat Waves in Recent Decades in Response to Shrinking Arctic Sea Ice and Eurasian snow Cover. NPJ Clim. Atmos. Sci. 3, 7. doi:10.1038/s41612-020-0110-8
Zhang, Y., Li, T., Wang, B., and Wu, G. (2002). Onset of the Summer Monsoon over the Indochina Peninsula: Climatology and Interannual Variations*. J. Clim. 15, 3206–3221. doi:10.1175/1520-0442(2002)015<3206:OOTSMO>2.0.CO;2
Zhao, S., Deng, Y., and Black, R. X. (2017). A Dynamical and Statistical Characterization of U.S. Extreme Precipitation Events and Their Associated Large-Scale Meteorological Patterns. J. Clim. 30, 1307–1326. doi:10.1175/JCLI-D-15-0910.1
Keywords: extreme precipitation, Indochina, Lagrangian perspective, water vapor, monsoon, PDO
Citation: Cheng Z, Xie Z, Tang W, Bueh C, Gong Y and Yan J (2021) Change in Extreme Precipitation Over Indochina Under Climate Change From a Lagrangian Perspective of Water Vapor. Front. Earth Sci. 9:758664. doi: 10.3389/feart.2021.758664
Received: 14 August 2021; Accepted: 08 November 2021;
Published: 07 December 2021.
Edited by:
Xander Wang, University of Prince Edward Island, CanadaReviewed by:
Jing Ma, Nanjing University of Information Science and Technology, ChinaSushant Das, Abdus Salam International Centre for Theoretical Physics, Italy
Copyright © 2021 Cheng, Xie, Tang, Bueh, Gong and Yan. This is an open-access article distributed under the terms of the Creative Commons Attribution License (CC BY). The use, distribution or reproduction in other forums is permitted, provided the original author(s) and the copyright owner(s) are credited and that the original publication in this journal is cited, in accordance with accepted academic practice. No use, distribution or reproduction is permitted which does not comply with these terms.
*Correspondence: Zuowei Xie, eGllenVvd2VpQG1haWwuaWFwLmFjLmNu