 Xiangxin Liu
 Lixin Wu
 Yanbo Zhang1
 Wenfei Mao
- 1College of Mining Engineering, North China University of Science and Technology, Tangshan, China
- 2College of Resources and Civil Engineering, Northeastern University, Shenyang, China
- 3School of Geosciences and Info-Physics, Central South University, Changsha, China
- 4Lab of Geohazards Perception, Cognition and Predication, Central South University, Changsha, China
Previous experiments indicated that infrared radiation temperature (IRT) was applied in monitoring rock stress or rock mass fracturing, and abnormal IRT phenomena preceding rock failure or tectonic earthquakes were frequently reported. However, the characteristics of IRT changing with rock fracturing and frictional sliding are not clear, which leaves much uncertainties of location and pattern identification of stress-produced IRT. In this study, we investigated carefully the localized IRT enhancement of rock compressively sheared to fracturing and sliding (named as CSFS) with marble and granite specimens. Infrared thermogram and visible photos were synchronously observed in the process of rock CSFS experiment. We revealed that localized IRT enhancement was determined by local stress locking, sheared fracturing, and frictional sliding, and the relations between the Kcv of IRT and the shear force are almost linear in wave length 3.7–4.8 μm. In the process of rock CSFS, the detected
Highlights:
1) Localized IRT enhancement of the rock specimen in the process of CSFS is determined by local stress locking, sheared fracturing, and frictional sliding.
2) The Kcv of IRT and shear force displays a linear relationship before and after the rock being compressively sheared to fracturing and frictional sliding.
3) In the process of rock CSFS, the detected IRT enhancement resulted from friction effect exceeded 10 K, being 25 times about that resulted from thermoelastic effect.
Introduction
Earthquake is one of the most unexpected and most serious natural disasters, which is mainly resulted from the local locking of crustal stress and the sudden fracturing of rock mass or tectonic faults (Liu et al., 2016; Huang et al., 2018). Since Gorny et al. (1988) observed thermal infrared radiation anomalies before some medium-to-strong earthquakes in Central Asia, satellite remote sensing has been applied, or tried to be used in earthquake monitoring and precursor analysis (Saraf et al., 2009; Piroddi et al., 2014; Bhardwaj et al., 2017). Although the geoscience community has devoted decades to study the mechanism of seismicity and to seek for methods to monitoring rock fracturing and seismogenic process (Freund, 2003; Scoville and Freund, 2021), reliable abnormity recognition from remote sensing signals and accurate precursor identification are still challenging problems in the world.
Referring to the pioneering work of Geng et al. (1992) and Wu et al. (2000) in remote sensing rock mechanics (RSRM), the IRT change of stressed rock was investigated by many scholars (Wu et al., 2006a, 2006b; Liu et al., 2006; Liu et al., 2018; 2021; Wang et al., 2016; Salami et al., 2017; Huang et al., 2018; Huang et al., 2021; Zhao et al., 2019; Zhou et al., 2019; Cao et al., 2020; Huang et al., 2021; Yang et al., 2021) and applied to explore the rock fracturing behavior and related abnormal phenomenon. Wu et al. (2006a, 2006b) discovered that strong IRT emerged at the moment of rock bursting, and the anomalies of IRT image could be used as a precursor of rock fracturing. Liu et al. (2006) indicated that the fracturing mode of loaded rock affects IRT variation greatly, and IRT features were related to loading conditions and failure modes. Liu et al. (2018) also studied IRT localized enhancement in the condition of water infiltration in mine tunnels, and revealed thermogram was greatly affected by rock moisture. Wang et al. (2016) discussed specific relationship between IRT and stress, Salami et al. (2017) and Zhao et al. (2019) revealed that IRT is localized enhancement on crack tips, and Yang et al. (2021) used IRT to investigate quantitatively crack initiation, propagation, and coalescence during rock fracturing. Zhou et al. (2019) indicated that the loading rate had some impacts on IR images, and Cao et al. (2020) proposed a quantitative index of energy dissipation with the IRT ratio to analyze and monitor rock failure and instability. Besides, Watson et al. (1975) used IRT images to identify the near-surface physical state of geologic materials, by using a quantitative theoretical model for geothermal mapping and thermal inertia mapping, and Schöpa et al. (2011) utilized IRT images to determine the vent locations by stress field modeling in a Vulcano island, Italy.
Being a universal physical parameter in the process of solid material loaded to fracturing, IRT is usually used for identifying unstable rock slope (Mineo et al., 2015) and geothermal basin (Heasler and Jaworowski, 2018). There are basically two mechanisms of IRT rise: 1) force-induced thermomechanical coupling effect (Harwood et al., 1991) and 2) friction thermal effect (Wu et al., 2004). Freund et al. (2006a, 2006b) discovered that rock positive charge (P-holes) could be activated by stress and stimulate also infrared emission on the rock surface. However, the characteristics and mechanisms of localized IRT enhancement related to rock stress and local fracturing are not carefully studied or clearly interpreted.
In this study, compressively sheared to fracturing and sliding (CSFS) experiments on marble and granite specimens are conducted. IRT-localized enhancements captured by an infrared image are carefully studied both in time and space aspects. The relation between IRT enhancement and shear force is revealed, and the mechanisms of localized IRT enhancement are discussed.
Experiment Methodology
Preparation of Rock Specimens
Homogeneous marble and granite are selected to make rock specimens to avoid the anisotropic influence of mineral particles of different compositions and varied sizes. The uniform size of the specimens is 150 mm × 150 mm × 150 mm. The marble and granite specimens are labeled from “MHS-1” to “MHS-7” and “GSD-1” to “GSD-7,” respectively. The marble specimen’s mineral compositions include dolomite (60–65%), tremolite (25–30%), and calcite (5–8%). The granite specimen is an intrusive and egg-white rock with fine grains and a micrographic texture, and contains plagioclase (35–50%), potash feldspar (25–30%), quartz (20–25%), hornblende (3–5%), and biotite (2–5%).
The specimen is of glassy luster from mineral grains such as hornblende, quartz, and biotite, which are capable of inhomogeneous specular reflection. To prevent the uncertain impact of inhomogeneous specular reflection on IRT images, the specimen surface to be IRT imaged was painted evenly with black ink and then doted randomly with white chalk beforehand, which assisted in achieving a homogenous infrared reflection background, enhance the optical visibility, and improved the local identification of shear fracturing (Figure 1A). Validation test shows that the black ink and chalk dots have no negative impact on IRT detection (Figure 1B).
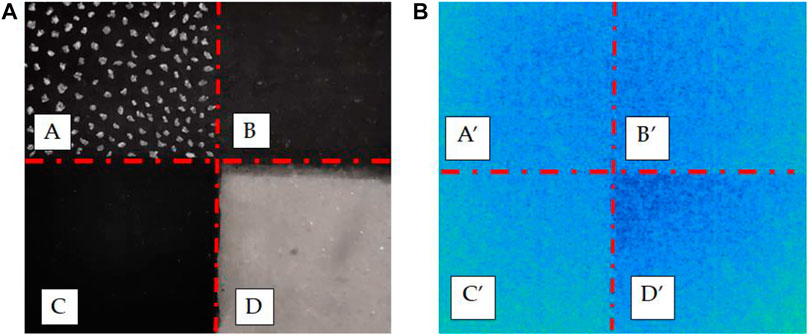
FIGURE 1. Validation of IRT imaging (A) on rock surface whose four quarters are differently treated (B). (A: thin ink painted and random chalk doted. A’: IRT image of A; B: thin ink painted. B’: IRT image of B; C: heavy ink painted. C’: IRT image of C; D: original. D’: IRT image of D).
Boundary Conditions
The boundary conditions of tested rock specimens are shown in Figure 2. The shearing plane is the place where sheared fracturing and frictional sliding will happen. The active loading boundaries are composed of a normal force boundary at the up side and a shear loading boundary at the upper left side; oppositely, both the down side and lower right side act as passive loading boundaries. With both the upper right side and lower left side remaining free, the shear loading boundary provides horizontal load as shearing force, while the normal force boundary provides vertical load as normal stress.
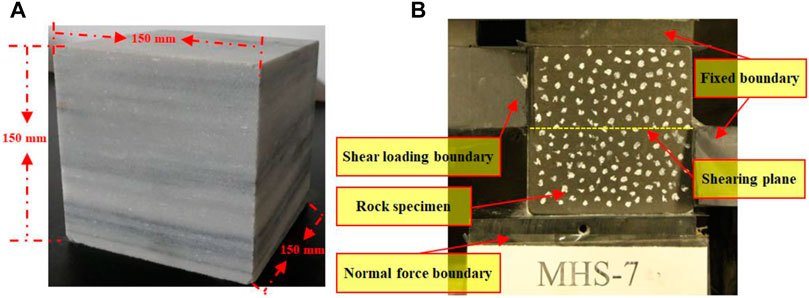
FIGURE 2. Rock specimen and its boundary conditions for IRT imaging test in the process of CSFS experiment. (A) Back view of original specimen; (B), front view of sheared specimen).
Laboratory Equipment
The experimental system (Figure 3) comprises a loading system (RLW-3000, China), an infrared imaging system (InfraTec 8,325, Germany), and a CCD camera (Pike F-421, Germany). The setup of the laboratory equipment should be consistent to guarantee the conformity of experiment data of different rock specimens (Ishida et al., 2017). The various components of the whole systems are set as follows:
1) Loading system: The vertical moving of loader along the axial direction is set as force control, and the loading rate is set as 1 kN/s. The horizontal moving of loader along shear direction is controlled by displacements, and the moving rate is set as 0.15 mm/min.
2) Infrared imaging system: The spectral range is 3.7–4.8 μm. The spatial resolution and sampling rate of the infrared monitoring system are set as 640 pixels × 512 pixels and 80 P/s, respectively. The accuracy of IRT measurement is set as ±0.1 K.
3) CCD camera: The spatial resolution and the sampling rate of CCD camera are set as 640 pixels × 512 pixels and 80 P/s, respectively.
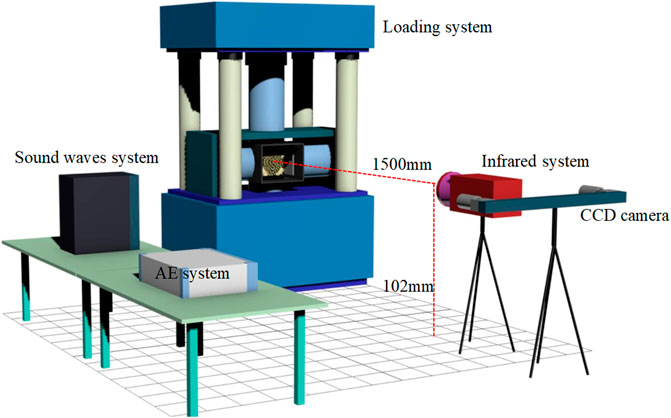
FIGURE 3. Photos of experiment system in UCUST laboratory.
The spectral range of 3–5 μm, named usually as intermediate infrared, is sensitive to be applied detecting the brightness temperature variation of objects with normal to high physical temperature. The detecting spectral range of the infrared imaging system, InfraTec 8,325, is 3.7–4.8 μm, which falls in the range of intermediate infrared, is good for detecting the IR enhancement in the process of rock loaded to fracturing.
Room temperature is controlled at 25°C approximately by an air conditioner, with temperature fluctuation being ±0.5 K. Light-blocking curtains are used to cover the laboratory windows to block sunshine and to prevent solar disturbance from outside in daytime. Furthermore, to reduce the disturbance of environmental radiation from walls and objects in the laboratory, several paper boards are set aside the rock specimen on the back, right, and left, leaving only the front side open to the infrared imaging system, as in Figure 3.
Data Analysis
Three indicators representing the variation of IRT, being AIRT,
Results
The Process of Rock Fracturing
Normal force and shear force are applied gradually with a preset rate to reach the sheared fracturing and frictional sliding. The process of CSFS of a rock specimen is depicted in Figure 4 with some typical moments in time sequence.
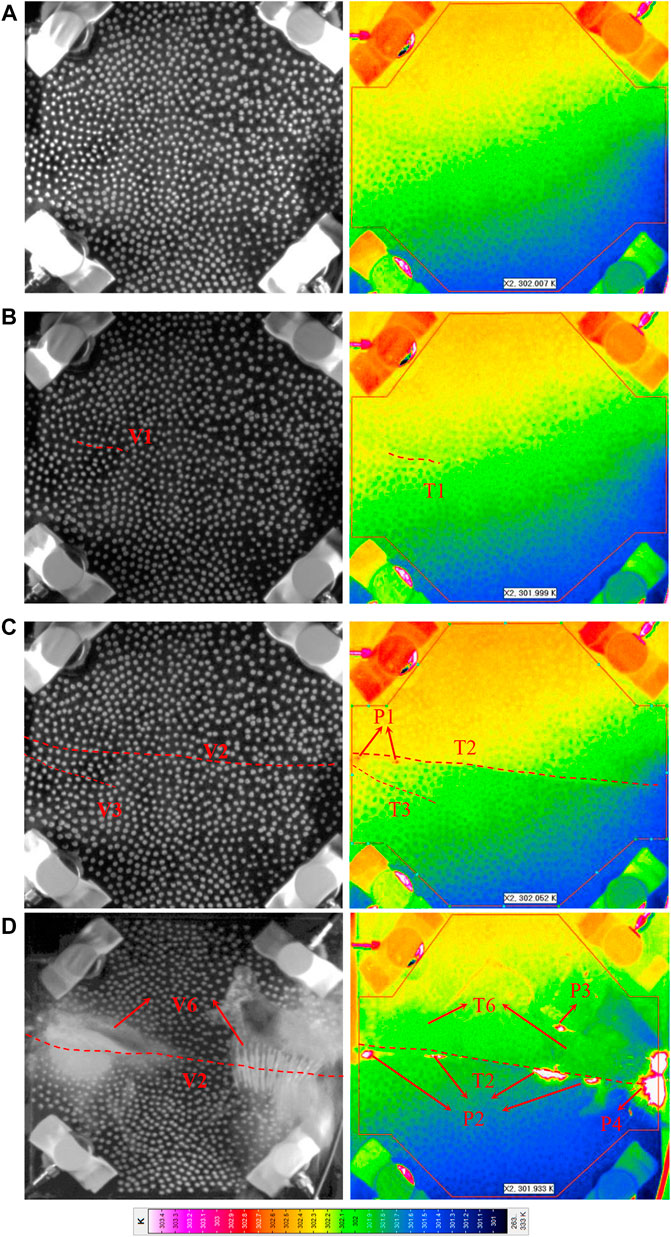
FIGURE 4. Visible pictures (left) and infrared thermogram (right) of the fracturing process of GSD-1 specimen in the CSFS process. (a) 0s; b) 747.17s; c) 1,106.10s; d) 1819.74s. V and T denote fracturing lines in visible and infrared, respectively, and P denotes fracturing points with localized IRT enhancement).
In the initial state (0s, Figure 4A), the rock specimen displayed homogeneous visible picture and infrared thermogram without structured differentiation; at 747.17s (Figure 4B), the visible picture displayed a small crack (V1), corresponding to T1 differentiation in thermogram; at 1,106.10s (Figure 4C), the visible picture appeared two cracks with V2 developing to be the shearing plane across the specimen and V3 occurred to the left end of the specimen, corresponding to T2 and T3 differentiations in thermogram. Besides, thermogram also exhibited two points (P1) of high IRT to the left end of the shearing plane along T2. At 1819.74s (Figure 4D), the visible picture displayed some fragment ejections (V6) corresponding to two low IRT zones (T6) occurred in thermogram, while several localized IRT enhancement points (P2) occurred notably along T2, which shows the undergoing compressive sliding behavior clearly.
Relationship Between Infrared Radiation Temperature and Shear Force
The relationship between IRT and shear force is beneficial to investigate IRT enhancement in the CSFS process. Accordingly, during the loading process,
1) Stage I, compressively loaded: the shear force of both marble and granite specimens kept an initial value, and the
2) Stage II, compressively shearing loaded:
3) Stage III, frictional sliding process: the curves of
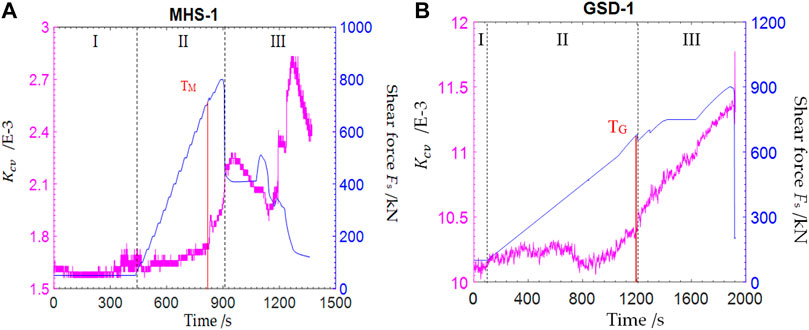
FIGURE 5. Variation of shear force Fs and IRT
Furthermore, the shear force curves also include a transition point of stress change, such as TM of specimen MHS-1 (Figure 5A) and TG of specimen GSD-1 (Figure 5B), where the elastic phase and yield phase can be distinguished. The
Previous studies on the changes of IRT and rock stress had confirmed the linear relations between IRT and uniaxial compressive stress (Wu et al., 2006c; Xu et al., 2015). Here, the distribution of fitting lines and the data points of IRT Kcv and shear force of MHS-1 and GSD-1 are shown in Figure 6. It shows that the relations between IRT Kcv and shear force of MHS-1 and GSD-1 before being sheared to fracturing are similar in a rising trend, while the relations between IRT Kcv and shear force of MHS-1 and GSD-1 after sheared to fracturing are different. The difference should be owing to the mechanical properties of marble with plastic deformation and granite with brittle fracturing. The correlation between IRT and shear force Fs before being sheared to fracturing and after being sheared to fracturing is represented by a regression model
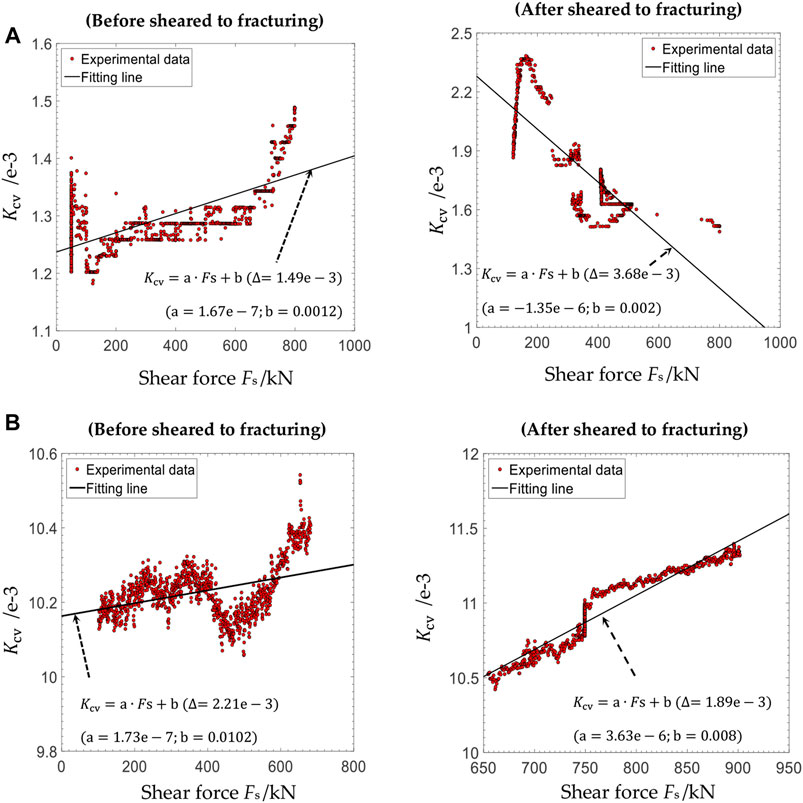
FIGURE 6. Change of IRT Kcv with shear force Fs before and after sheared to fracturing. (a, MHS-1; b, GSD-1).
The statistical results of all marble and granite specimens are shown in Table 1.
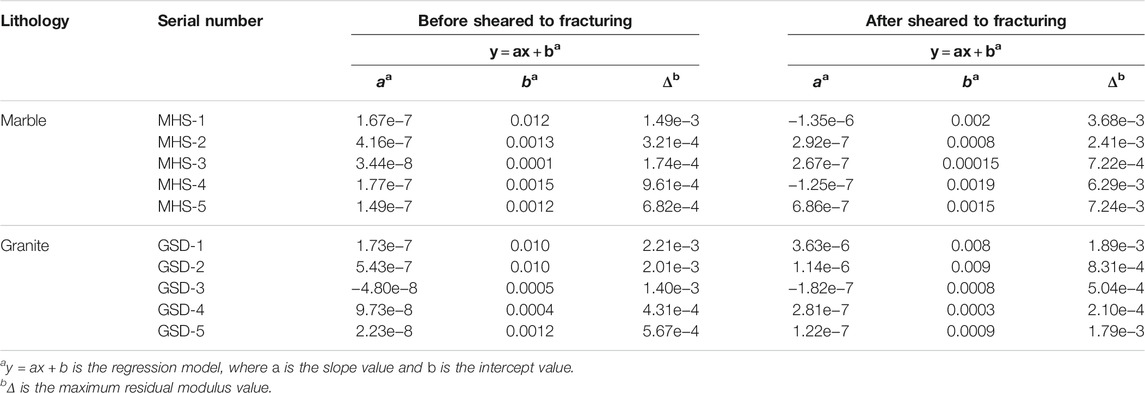
TABLE 1. Statistical information of shear force Fs and Kcv.
Localized Infrared Radiation Temperature Enhancement
In this study, the IRT enhancement,
where
where
1) Localized IRT enhancement from thermoelastic effect
As for MHS-1 in period 1,237.91s–1373.04s, the core zone of sheared fracturing increased significantly and experienced shearing stress accumulating, local locking, and delocking in sequence (Figure 7). Zone C is the stress locking region, and zone R is applied as a reference region. The IRT data obtained from the thermogram, as in Figure 7, are statistically shown in Table 2. The maximum IR enhancement occurred in the stress locking state, the value of IR enhancement is
2) Localized IRT enhancement from friction sliding
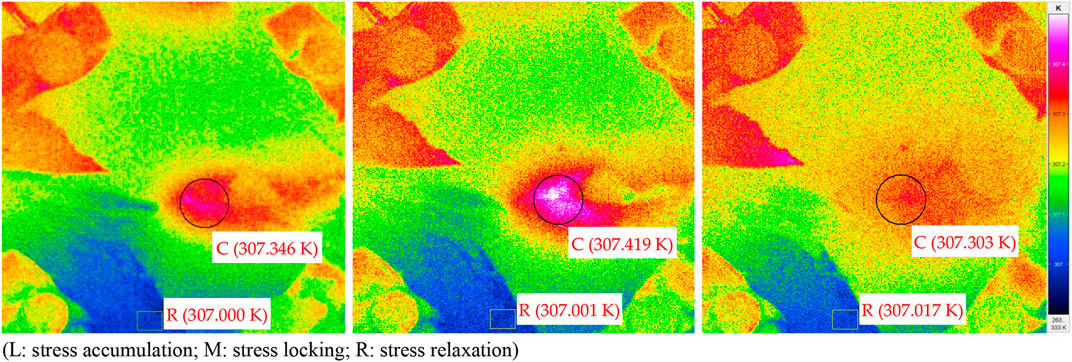
FIGURE 7. Localized IRT enhancement of MHS-1 with stress change.
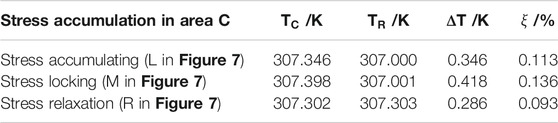
TABLE 2. Statistical information of IRT localized enhancement by thermoelastic effect.
Different kinds of stress or fracturing states (Figures 8–10) have different IRT localized enhancement forms (Table 3), for example, the pre-cracking zones on crack tip have a point-like form (X in Figure 8), the shear fracturing zones are in the form of continuous flecks (P1, P2, and P3 in Figure 9), and the sliding friction zones are ribbon-like (P1, P2, P3, P4, and P5 in Figure 10). The maximum IR enhancement appears at the moment of sliding fracturing; when
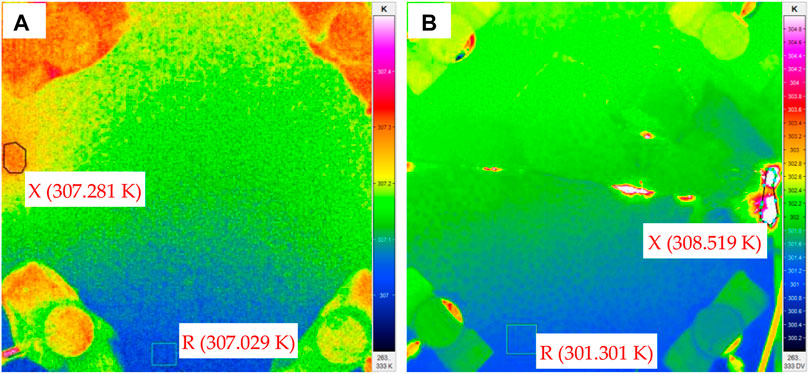
FIGURE 8. Temperature increase caused by shear concentration. (a. MHS-1; b. GSD-1).
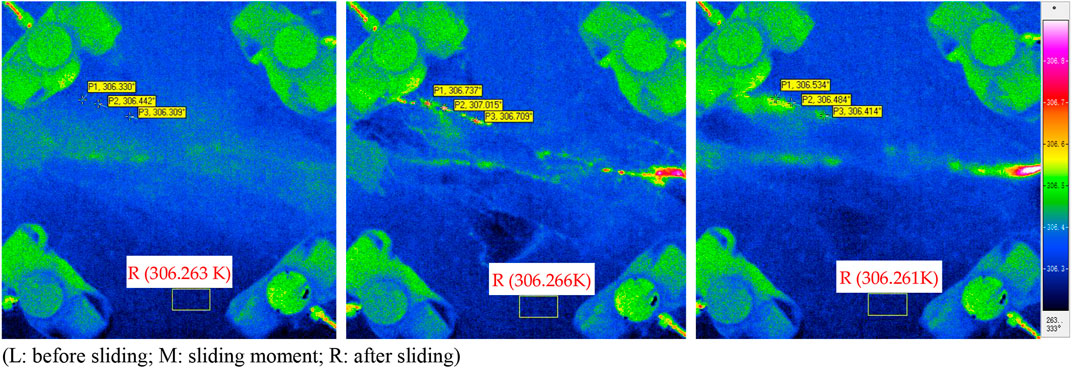
FIGURE 9. IRT of MHS-4 related with a sliding action.
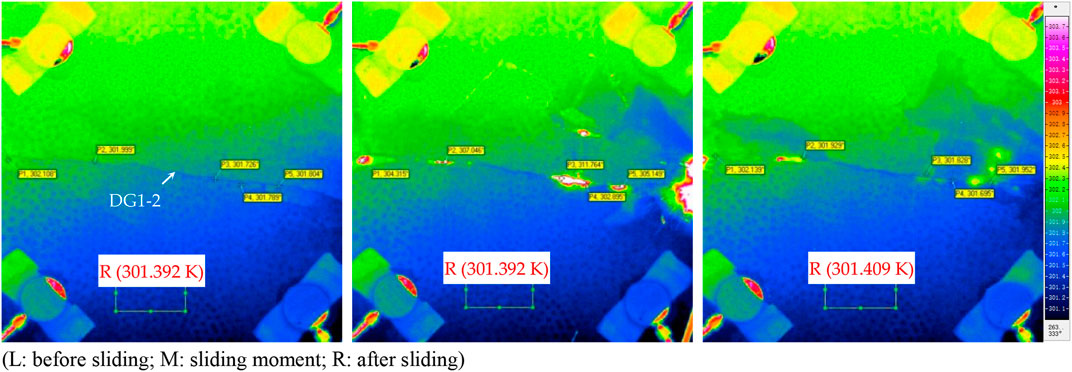
FIGURE 10. IRT of GSD-1 related with a sliding action.
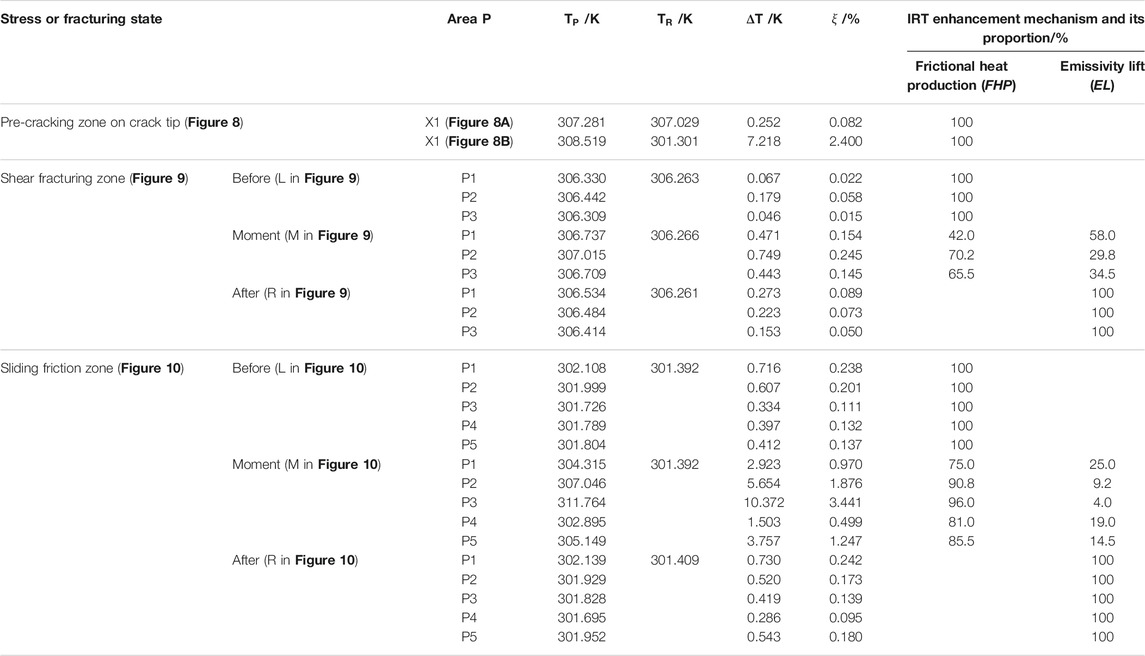
TABLE 3. Statistical information of IRT localized enhancement by friction effect.
In Figures 9, 10, the mechanisms of IRT localized enhancements in shearing plane all belong to the friction effect, including frictional heat production (Wu et al., 2004) and emissivity lift (Wu et al., 2018). “L” is the time of local stress focus, and then intergranular dislocation is generated. The mechanism of IRT localized enhancement belongs to frictional heat production; “M” is the time of local stress concentration, and then macroscopic cracks are found. The mechanism of IRT localized enhancement is the friction effect; it includes Td increased by frictional heat production and emissivity lift by surface fracturing and grinding behavior; “R” is the time of stress relaxation status, and local stress focus does not exist. The mechanism of IRT localized enhancement is only emissivity lift.
Therefore, the IRT enhancement mechanism and its proportion are calculated as in Table 3, for example, X1 in Figure 8 and L in Figures 9, 10 only belong to frictional heat production,
where
Discussion
Infrared Radiation Enhancement in the Process of Compressively Sheared to Fracturing and Sliding
According to infrared detection principles (Rees, 2001), the rock IRT, also called infrared brightness temperature as an index of infrared radiation energy detected by an infrared sensor with particular photoelectric system, is determined by both rock surface emissivity
It illustrates that both the variation of emissivity (
Accordingly, if
For example, if IRT = 300 K,
Since thermoelastic effect and friction thermal effect are able to cause local rise of
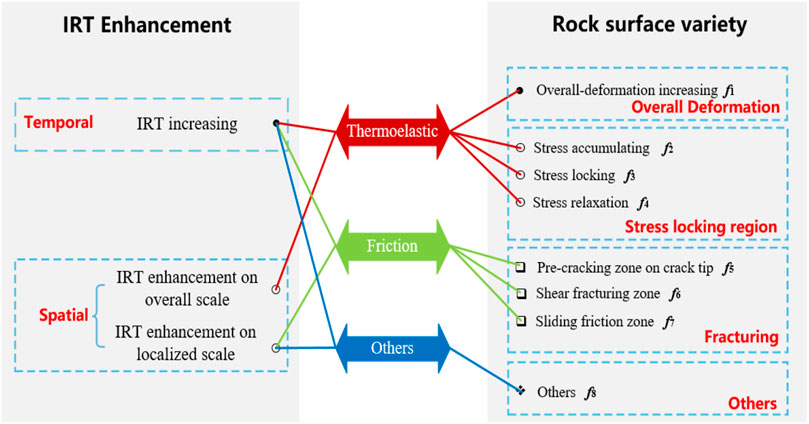
FIGURE 11. Correlation between IRT changing and deformation or fracturing or stress distributions on rock surface during the CSFS process.
According to Eq. 6, the IR enhancement,
where
Significance of the Localized Infrared Radiation Enhancement
Localized IRT enhancement is related to the stress concentration phenomenon in space–time aspects, and the different enhancement mechanisms corresponds to different IR enhancement forms. Thermoelastic effect is often expressed as a regional type of IRT enhancement, for example, elliptic or circular type (C in Figure 7). Friction thermal effect is expressed as a point-like form (X in Figure 8), a continuous fleck form (P1, P2, and P3 in Figure 9), or a ribbon-like form (P1, P2, P3, P4, and P5 in Figure 10) of IRT enhancement. In our research,
Generally, an earthquake results from tectonic motion or crustal stress field alteration (Liao et al., 2003; Yohei et al., 2010), and the satellite infrared observation has been proven effective to monitor seismicity and the seismogenous process. The features of IR localized enhancement revealed in this study have at least two aspects relevant to satellite observation on crustal stress field alteration and the seismogenous process: 1) time aspect:
Nevertheless, the localized IRT enhancement of a ground target would be affected by multiple environmental factors, such as sunlight reflecting, surface moisture, geoidal heights, viewing angle, and vegetation cover. Further experimental studies for different surface situations are demanded, even including different wavelength of electromagnetic wave for satellite observations. Detecting the infrared radiation anomaly related to earthquakes remains to be conquered due to multiple influencing factors. It is possible to extract the localized IR enhancement caused by crustal stress alteration from satellite observations, but it is especially challenging.
Conclusion
1) Localized IRT enhancement of rock specimen in the process of CSFS develops with stress variations, for example, a big bright spot reflects local stress locking, a point-like form and continuous flecks reflect the sheared fracturing, and a ribbon-like form reflects the frictional sliding.
2) The Kcv of IRT and shear force displays a linear relationship before and after the rock being compressively sheared to fracturing. There exists a close correspondence between IRT and stress in wave length 3.7–4.8 μm.
3) Different mechanisms lead to different IRT enhancement (
This experimental study provides new evidence and physical interpretation for imaging monitoring rock fracturing in the engineering scale and satellite remote sensing crustal stress field alteration in the regional scale with detection of infrared radiation brightness temperature. There are still some difficulties and challenges in the field of crustal stress monitoring by satellite infrared; further investigations are encouraged.
Data Availability Statement
The raw data supporting the conclusions of this article will be made available by the authors, without undue reservation.
Author Contributions
LX, WL, ZY, and MW participate in the test of compressively sheared to fracturing and sliding (CSFS).
Funding
This work was supported by the State Key Program of National Natural Science of China (No. 41930108) and the National Natural Science Foundation of China (Nos. 41977219 and. 51804122). All these are gratefully acknowledged.
Conflict of Interest
The authors declare that the research was conducted in the absence of any commercial or financial relationships that could be construed as a potential conflict of interest.
Publisher’s Note
All claims expressed in this article are solely those of the authors and do not necessarily represent those of their affiliated organizations, or those of the publisher, the editors, and the reviewers. Any product that may be evaluated in this article, or claim that may be made by its manufacturer, is not guaranteed or endorsed by the publisher.
References
Bhardwaj, Anshuman., Singh, Shaktiman., Sam, Lydia., Bhardwaj, Akanksha., Martín-Torres, Javier., Singh, Atar., et al. (2017). MODIS-based Estimates of strong Snow Surface Temperature Anomaly Related to High Altitude Earthquakes of 2015. Remote Sensing Environ. 188, 1–8.
Cao, K., Ma, L., Wu, Y., Khan, N. M., and Yang, J. (2020). Using the Characteristics of Infrared Radiation during the Process of Strain Energy Evolution in Saturated Rock as a Precursor for Violent Failure. Infrared Phys. Tech. 109, 103406. doi:10.1016/j.infrared.2020.103406
Freund, F. T . (2003). Rocks that Crackle and Sparkle and Glow: Strange Pre-earthquake Phenomena. J. Scientific Exploration 17, 37–71.
Freund, F. T., Takeuchi, A., Lau, B. W. S., Al-Manaseer, A., Fu, C. C., Bryant, N. A., et al. (2006a). Stimulated Infrared Emission from Rocks: Assessing a Stress Indicator. eEarth 2 (1), 97–121. doi:10.5194/eed-1-97-2006
Freund, F. T., Takeuchi, A., and Lau, B. W. (2006b). Electric Currents Streaming Out of Stressed Igneous Rocks - A Step towards Understanding Pre-earthquake Low Frequency EM Emissions. Phys. Chem. Earth 31 (4/9), 389–396. doi:10.1016/j.pce.2006.02.027
Geng, N., Cui, C., and Deng, M. (1992). Remote Sensing Detection on Rock Fracturing experiment and the Beginning of Remote Sensing Rock Mechanics. Acta Seismologica Sinica 14, 645–652.
Gorny, V. I., Sal'Man, A. G., Tronin, A. A., and Shilin, B. V. (1988). Outgoing Infrared Radiation of the Earth as an Indicator of Seismic Activity. Proc. Acad. Sci. USSR 301, 5–7.
Harwood, N., Cummings, W. M., and MacKenzie, A. K. (1991). An Introduction in Thermoelastic Stress in: Thermoelastic Stress Analysis. Adam Hilger 1, 1–34.
Heasler, H., and Jaworowski, C. (2018). Hydrothermal Monitoring of norris Geyser basin, Yellowstone national park, USA, Using Airborne thermal Infrared Imagery. Geothermics 72, 24–46. doi:10.1016/j.geothermics.2017.10.016
Huang, J., Liu, S., Gao, X., Yang, Z., Ni, Q., and Wu, L. (2018). Experimental Study of the thermal Infrared Emissivity Variation of Loaded Rock and its Significance. Remote Sensing 10 (6), 818. doi:10.3390/rs10060818
Huang, J., Liu, S., Liu, W., Zhang, C., Li, S., Yu, M., et al. (2021). Experimental Study on the thermal Infrared Spectral Variation of Fractured Rock. Remote Sensing 13, 1191. doi:10.3390/rs13061191
Ishida, T., Labuz, J. F., Manthei, G., Meredith, P. G., Nasseri, M. H. B., Shin, K., et al. (2017). ISRM Suggested Method for Laboratory Acoustic Emission Monitoring. Rock Mech. Rock Eng. 50 (3), 665–674. doi:10.1007/s00603-016-1165-z
Liao, C., Zhang, C., Wu, M., Ma, Y., and Ou, M. (2003). Stress Change Near the Kunlun Fault before and after the Ms 8.1 Kunlun Earthquake. Geophys. Res. Lett. 30 (20), 2027. doi:10.1029/2003gl018106
Liu, S., Xu, Z., Wei, J., Huang, J., and Wu, L. (2016). Experimental Study on Microwave Radiation from Deforming and Fracturing Rock under Loading Outdoor. IEEE Trans. Geosci. Remote Sensing 54 (9), 1–10. doi:10.1109/tgrs.2016.2569419
Liu, S., Wu, L., and Wu, Y. (2006). Infrared Radiation of Rock at Failure. Int. J. Rock Mech. Mining Sci. 43 (6), 972–979. doi:10.1016/j.ijrmms.2005.12.009
Liu, X., Liang, Z., Zhang, Y., Liang, P., and Tian, B. (2018). Experimental Study on the Monitoring of Rockburst in Tunnels under Dry and Saturated Conditions Using AE and Infrared Monitoring. Tunnelling Underground Space Tech. 82, 517–528. doi:10.1016/j.tust.2018.08.011
Mineo, S., Pappalardo, G., Rapisarda, F., Cubito, A., and Di Maria, G. (2015). Integrated Geostructural, Seismic and Infrared Thermography Surveys for the Study of an Unstable Rock Slope in the Peloritani Chain (NE Sicily). Eng. Geology 195, 225–235. doi:10.1016/j.enggeo.2015.06.010
Piroddi, L., Ranieri, G., Freund, F., and Trogu, A. (2014). Geology, Tectonics and Topography Underlined by L'Aquila Earthquake TIR Precursors. Geophys. J. Int. 197 (3), 1532–1536. doi:10.1093/gji/ggu123
Salami, Y., Dano, C., and Hicher, P. Y. (2017). Infrared Thermography of Rock Fracture. Géotechnique Lett. 7 (1), 1–5. doi:10.1680/jgele.16.00131
Saraf, A. K., Rawat, V., Choudhury, S., Dasgupta, S., and Das, J. (2009). Advances in Understanding of the Mechanism for Generation of Earthquake thermal Precursors Detected by Satellites. Int. J. Appl. Earth Observation Geoinformation 11 (6), 373–379. doi:10.1016/j.jag.2009.07.003
Schöpa, A., Pantaleo, M., and Walter, T. R. (2011). Scale-dependent Location of Hydrothermal Vents: Stress Field Models and Infrared Field Observations on the Fossa Cone, Vulcano Island, Italy. J. Volcanology Geothermal Res. 203 (3), 133–145. doi:10.1016/j.jvolgeores.2011.03.008
Scoville, J., and Freund, F. T. (2021). Infrared Emission from Rocks in the Thermal Infrared (TIR) Window. Eur. Phys. J. Spec. Top. 230, 85–109. doi:10.1140/epjst/e2020-000246-4
Wang, C., Lu, Z., Liu, L., Chuai, X., and Lu, H. (2016). Predicting Points of the Infrared Precursor for limestone Failure under Uniaxial Compression. Int. J. Rock Mech. Mining Sci. 88 (10), 34–43. doi:10.1016/j.ijrmms.2016.07.004
Watson, K. (1975). Geologic Applications of thermal Infrared Images. Proc. IEEE 63 (1), 128–137. doi:10.1109/proc.1975.9712
Wu, L., Liu, S., Wu, Y., and Li, Y. (2004). Remote-sensing-rock Mechanics (IV) - Laws of thermal Infrared Radiation from Compressively-Sheared Fracturing of Rock and its Meanings for Earthquake Omens. Chin. J. Rock Mech. Eng. 23 (4), 539–544.
Wu, L., Mao, W., and Liu, S. (2018). Mechanisms of Altering Infrared-Microwave Radiation from Stressed Rock and Key Issues on Crust Stress Remote Sensing. J. Remote Sensing 22, 146–161.
Wu, L., Tang, C., and Zhong, S. (2006c). Comparison of thermal Infrared Radiation from Discontinuous Jointed Faults Fracturing with its Acoustic Emission and Stress Field. Chin. J. Rock Mech. Eng. 25 (6), 1111–1117.
Wu, L., Cui, C., Geng, N., and Wang, J. (2000). Remote Sensing Rock Mechanics (RSRM) and Associated Experimental Studies. Int. J. Rock Mech. Mining Sci. 37 (6), 879–888. doi:10.1016/s1365-1609(99)00066-0
Wu, L., Liu, S., Wu, Y., and Wang, C. (2006a). Precursors for Rock Fracturing and Failure-Part I: IRR Image Abnormalities. Int. J. Rock Mech. Mining Sci. 43 (3), 473–482. doi:10.1016/j.ijrmms.2005.09.002
Wu, L., Liu, S., Wu, Y., and Wang, C. (2006b). Precursors for Rock Fracturing and Failure-Part II: IRR T-Curve Abnormalities. Int. J. Rock Mech. Mining Sci. 43 (3), 483–493. doi:10.1016/j.ijrmms.2005.09.001
Xu, Z., Liu, S., and Wu, L. (2015). Comparative Study on the Variation Features of Infrared and Microwave Radiation in Deformation and Fracture Process of Rock. J. Northeast. Univ. (Natural Science) 36 (12), 1738–1742.
Yang, H., Liu, B., and Karekal, S. (2021). Experimental Investigation on Infrared Radiation Features of Fracturing Process in Jointed Rock under Concentrated Load. Int. J. Rock Mech. Mining Sci. 139, 104619. doi:10.1016/j.ijrmms.2021.104619
Yohei, Y., Yoshihisa, I., and Shigeki, H. (2010). Detailed Spatial Changes in the Stress Field of the 1984 Western Nagano Earthquake Region. J. Geophys. Res. Solid Earth 115 (B6), 1–17.
Zhao, D., Zhang, S., Zhao, Y., and Wang, M. (2019). Experimental Study on Damage Characteristics of Granite under Ultrasonic Vibration Load Based on Infrared Thermography. Environ. Earth Sci. 78 (14), 419. doi:10.1007/s12665-019-8450-6
Keywords: remote sensing rock mechanics (RSRM), infrared radiation temperature, localized IRT enhancement, compressively shearing to fracturing and sliding (CSFS), seismogenic process
Citation: Liu X, Wu L, Zhang Y and Mao W (2021) Localized Enhancement of Infrared Radiation Temperature of Rock Compressively Sheared to Fracturing Sliding: Features and Significance. Front. Earth Sci. 9:756369. doi: 10.3389/feart.2021.756369
Received: 10 August 2021; Accepted: 17 August 2021;
Published: 05 October 2021.
Edited by:
Faming Huang, Nanchang University, ChinaReviewed by:
Lu Zheng, Fuzhou University, ChinaChunlai Wang, China University of Mining and Technology, Beijing, China
Zhilu Chang, Nanchang University, China
Copyright © 2021 Liu, Wu, Zhang and Mao. This is an open-access article distributed under the terms of the Creative Commons Attribution License (CC BY). The use, distribution or reproduction in other forums is permitted, provided the original author(s) and the copyright owner(s) are credited and that the original publication in this journal is cited, in accordance with accepted academic practice. No use, distribution or reproduction is permitted which does not comply with these terms.
*Correspondence: Lixin Wu, d3VseDY2QGNzdS5lZHUuY24=; Xiangxin Liu, bGl1eGlhbmd4aW45QDE2My5jb20=