
94% of researchers rate our articles as excellent or good
Learn more about the work of our research integrity team to safeguard the quality of each article we publish.
Find out more
ORIGINAL RESEARCH article
Front. Earth Sci., 07 December 2021
Sec. Quaternary Science, Geomorphology and Paleoenvironment
Volume 9 - 2021 | https://doi.org/10.3389/feart.2021.755084
This article is part of the Research TopicEnvironmental Change in Drylands: Past, Present, FutureView all 21 articles
 Johanna Lomax1*
 Daniel Wolf2
 Urs Tilmann Wolpert1
 Lilit Sahakyan3
 Hayk Hovakimyan3Dominik Faust2Markus Fuchs1
The loess-palaeosol section Achajur is part of the Sevkar loess area in north-eastern Armenia and comprises three prominent pedocomplexes with intercalated loess units, probably spanning at least three glacial-interglacial cycles. With its central position between the Black Sea and the Caspian Sea, the Sevkar loess area serves as important bridge between loess sections in southeastern Europe and Central Asia. Establishing a numerical chronology of the Achajur loess section enables correlation with other loess-palaeosol sections and a palaeoenvironmental reconstruction of the region. In this paper, we focus on the chronology of the last glacial-interglacial cycle using luminescence dating on fine grain (4–11 µm) material. We compare two post-IR-IRSL protocols on polymineral fine grain using different stimulation temperatures, in order to evaluate the influence of fading and potential unbleachable residuals on our samples. For a backup of the younger ages (<50 ka), we also applied a single aliquot protocol on the quartz fine grain fraction. The results indicate that the upper loess unit was deposited during MIS3 and 4, while MIS2 ages are not present. The underlying pedocomplex and loess unit fall into MIS5 and MIS6, respectively. This confirms that the loess was deposited during dry phases and pedocomplexes formed during wetter phases, as is also shown by comparison with other palaeoenvironmental proxies from the area.
Loess-palaeosol sequences (LPS) play an important role in reconstructing Quaternary climates and environments. They provide information on past climate conditions by comparison with Marine Isotope Stages (MIS) and pollen records (e.g. Antoine et al., 2019; Rousseau et al., 2020; Wolf et al., 2021) or by analyses of mollusc assemblages (e.g. Moine et al., 2005; Richter et al., 2020), on loess source areas (Ujvari et al., 2012; Ujvari et al., 2014), on past vegetation cover (e.g. Hatté et al., 1998, Hatté et al., 2013; Trigui et al., 2019) and former soil formation conditions (e.g. Buggle et al., 2011).
For such environmental reconstructions, precise chronologies are essential. Loess as windblown sediment is considered as ideal material for optically stimulated luminescence (OSL) dating (e.g. Fuchs et al., 2013; Lomax et al., 2019). However, quartz luminescence ages are often underestimated in high dose ranges, explained by an aberrant behaviour of the laboratory generated dose response curve, which restricts quartz OSL dating to around 50–65 ka in loess when using fine to medium sized grains (Chapot et al., 2012; Timar-Gabor and Wintle, 2013; Avram et al., 2020). Upper age limits in feldspars are much higher (e.g. Avram et al., 2020), but anomalous fading may lead to an unwanted loss of the infrared stimulated luminescence (IRSL) signal (Spooner, 1994) and thus to underestimated IRSL ages. In the recent decade however, feldspar luminescence protocols have been developed which decrease or even overcome the problem of fading in feldspar dating. These protocols use a first lower temperature IRSL which empties luminescence traps prone to fading, followed by a second or consecutive IRSL steps at elevated temperatures, which sample the luminescence of more stable traps (Thomsen et al., 2008; Buylaert et al., 2009; Li and Li, 2011, 2012; Thiel et al., 2011; Zhang and Li, 2020). This measurement procedure is usually termed post-IR-IRSL (pIRIR) dating. Because there seems to be a negative relation between first and second stimulation temperature and fading, and a positive relation between first and second stimulation temperature and residual signals (e.g. Kars et al., 2014), a careful consideration of these two problems needs to be carried out. Younger samples, which usually show smaller fading rates, but in which residuals can contribute largely to the palaeodose, are often measured using lower first and second stimulation temperatures (e.g. Reimann and Tsukamoto, 2012), whereas for older samples, the opposite is the case (Zhang and Li, 2020). For these reasons, there is so far no general protocol for feldspar samples, and therefore, a wide range of protocols and approaches exist and their application is dependent on the individual local geoconditions.
LPS in north-eastern Armenia provide excellent conditions for reconstructing palaeoenvironmental conditions. They contain multiple sequences of loess and pedocomplexes indicating that they represent several glacial-interglacial cycles. Furthermore, several tephra layers within the loess sections provide the possibility of reconstructing past volcanic eruptions and for using these tephra layers as chronological marker horizons. Studies on the chronology of north-eastern Armenian loess sections are rare so far. Wolf et al. (2016) present five pIRIR ages and two OSL ages of the loess section Sevkar, which is located close to the section Achajur studied in this paper. Together with studies of Trigui et al. (2019) and Richter et al. (2020) it is shown that during glacials, dry conditions promoted shrub-steppe and loess accumulation in the area, whereas interglacials were accompanied by forest- and high-grass-steppe and landscape stability with soil formation. The aim of this paper is to refine the chronology of LPS in the Sevkar loess area for the last glacial-interglacial cycle, to enable a correlation between the loess sections Sevkar and Achajur, and to test the reliability of the obtained luminescence ages. Therefore, three different protocols were applied on different mineral fractions, dating a total of 13 samples. The quartz fine grain fraction was measured using a 1) SAR protocol (Murray and Wintle, 2000; 2003) in order to provide reliable ages for the younger part of the loess section. Furthermore, two different pIRIR protocols, namely a 2) pIRIR-225 protocol (Buylaert et al., 2009) and a 3) pIRIR-290 protocol (Thiel et al., 2011; Li and Li, 2012), were applied to the polymineral fine grain fraction. The aim of this approach is to test which protocol yields the most reliable ages, especially for the older part (>50 ka) of the section, in order to apply this protocol to further sections from the Sevkar loess area. For evaluating the reliability of these polymineral feldspar ages, a comparison with the quartz ages from the younger part of the section, stratigraphic information and comparison with regional palaeoclimatic records is used as age control.
The Achajur loess section within the Sevkar loess area is located approximately 75 km north of Lake Sevan in north-eastern Armenia (Tavush region) (Figure 1). The section is part of a larger area of loess deposits stretching along the north-eastern foothills of the Southern Caucasus, which forms a NW-SE stretching boundary to the Kura depression. Some of the loess deposits of the Sevkar area form dune-like ridges and show a strong inclination of loess units and soil horizons (Wolf et al., 2016). Furthermore, most of the loess sections contain prominent tephra layers, derived from volcanoes in Armenia, Georgia and Turkey (Neill et al., 2013; Sherriff et al., 2019). The nearby Aghstev River drains the Southern Caucasus and joins the Kura River in Azerbaijan, which in turn drains into the Caspian Sea.
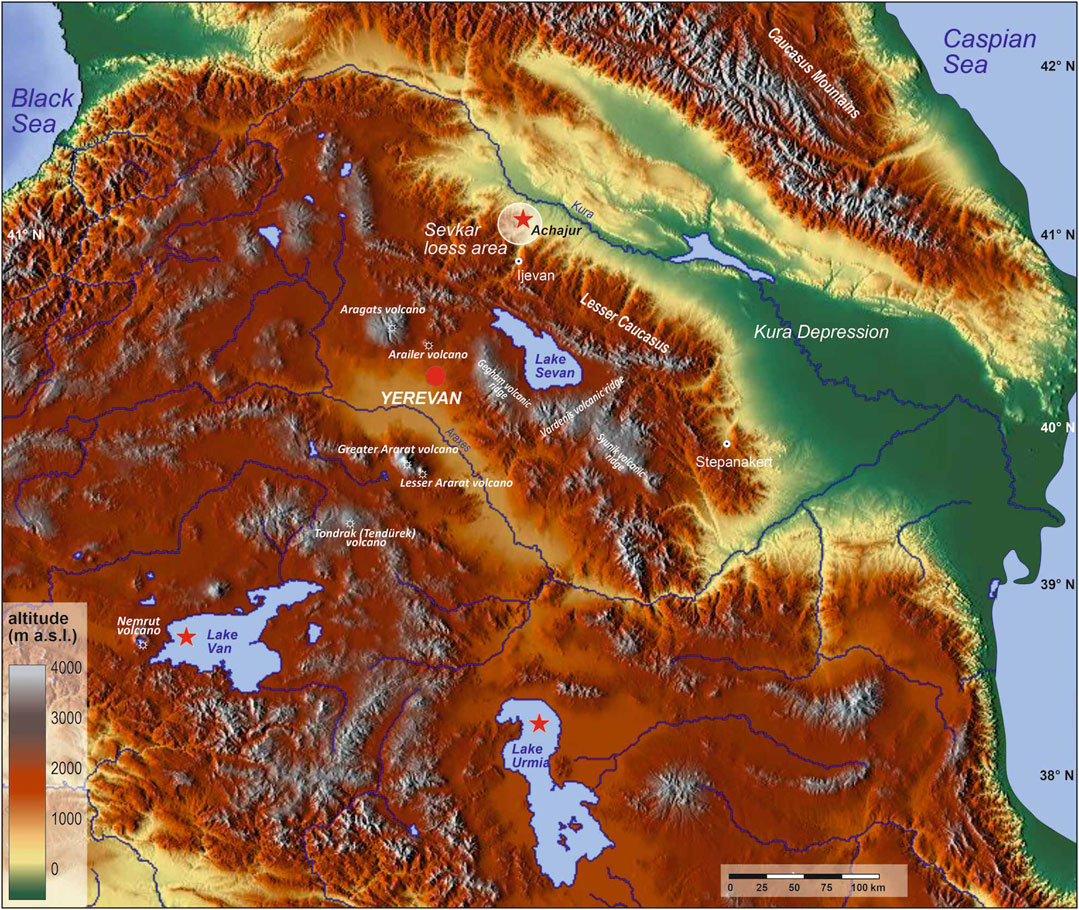
FIGURE 1. Study area showing the location of the Achajur section and sites of important palynological studies discussed for palaeoclimatic interpretation. (Map modified from maps-for-free.com).
At present, annual precipitation in the study area ranges between 450 and 550 mm with a maximum in May and a minimum in winter. The mean annual temperature averages ca. 11°C (Wolf et al., 2016). The most common type of vegetation of the adjacent Kura Basin is steppe vegetation in lower areas, associated with patches of oak forests on the slopes of the Southern Caucasus.
The section Achajur is located at 41°0′17″N, 45°9′22″E and 891 m a.s.l. The composite profile is derived from compiling four sub-sections and reaches a total thickness of 24 m. It comprises three palaeosol complexes (P-3, P-2, P-1) and the Holocene soil (P-0), intercalated by the loess units L-3, L-2 and L-1 (Figure 2). This indicates that the section most probably reaches down to at least the third last glacial.
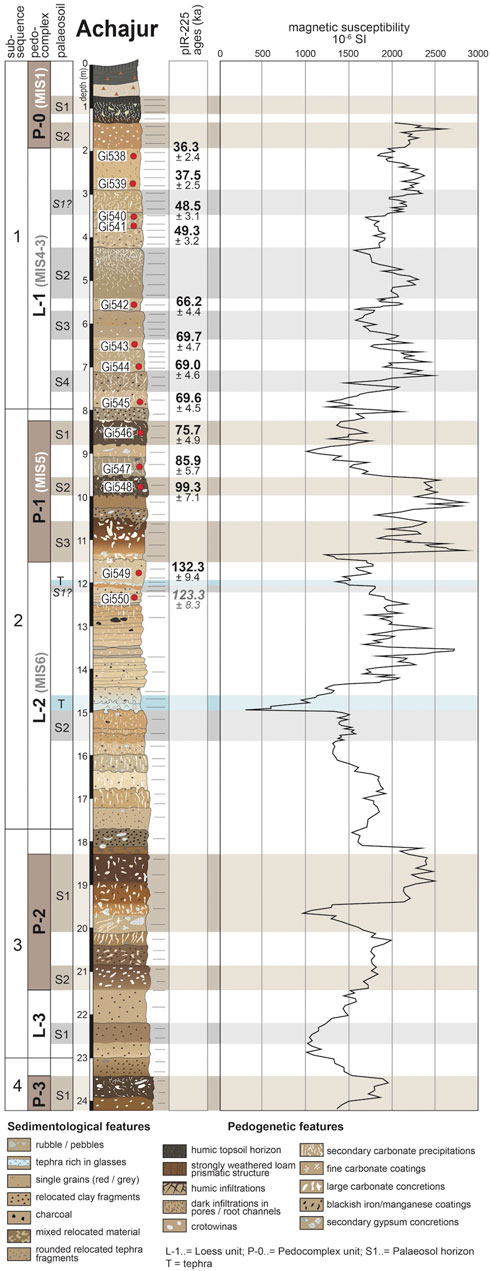
FIGURE 2. Loess section Achajur with pIRIR-225 ages. The age of Gi550 is set in italics, because it likely underestimates the true depositional age. Magnetic susceptibility (χ) measurements were carried out with a portable Bartington susceptibility meter at an interval of 5 cm.
A short stratigraphic description deals with the section (Figure 2) from the bottom to the top: Above a blackish horizon that marks the upper part of pedocomplex P-3, sub-sequence 3 represents a succession of loess deposits (L-3), ending with the formation of pedocomplex P-2. Loess unit L-3 comprises another weakly developed brownish soil (L-3/S1). The lower part of pedocomplex P-2 (P-2/S2) exhibits a greyish-brown soil with large (∼10 cm) calcium-carbonate enrichments. Above at least two layers of relocated material, which are characterised by small rounded clay-pebbles (<6 mm), the upper part of pedocomplex P-2 (P-2/S1) reveals another strong dark-brown to reddish-brown soil containing big calcium-carbonate enrichments and concretions. Sub-sequence 3 ends with a greyish colluvial layer. Sub-sequence 2 is characterised by the deposition of thick layers of loess material (L-2) bearing features of strong relocation such as rock fragments or isolated clay-pebbles. Based on field observations, no prominent interstadial palaeosols seem to be present in this unit. A pale bluish tephra layer interrupts unit L-2, while a couple of relocated greyish tephra-bearing layers are admixed above. Weakly weathered palaeosols were found below the bluish tephra (L-2/S2) as well as in the upper part (L-2/S1). Sub-sequence 2 ends with pedocomplex P-1 that shows a succession of three well-developed palaeosols. While the lowermost palaeosol (P-1/S3) is characterized by a ∼60 cm thick strongly weathered brown horizon with large calcium-carbonate enrichments, the overlying palaeosols (P-1/S1 and P-1/S2) reveal a blackish color and crumbly structure and can be classified as chernozems. The uppermost sub-sequence 1 is characterised by a succession of loess deposits (L-1) with interposed pale greyish-brown palaeosols (L-1/S1-S4). At the top of the section, a reddish-brown soil (P-0/S2) with small calcium-carbonate concretions is present and is covered by a sequence of colluvial deposits.
For a further characterisation of the loess section, field magnetic susceptibility (MS) measurements were carried out using a portable Bartington MS2F probe (580 Hz), taking measurements at an interval of 5 cm. Often, MS values represent the degree of soil formation, with high MS values in palaeosols due to the formation of iron oxides during soil formation, and low values in pure loess (Evans and Heller, 1994). In the Sevkar loess area however, high values of magnetic minerals within the loess units, probably related to tephric material, hamper a clear distinction between loess layers and soil horizons (Wolf et al., 2016). Due to this, the loess layers can yield higher MS values than some of the palaeosols.
Eight samples for luminescence dating (Gi538-545) were taken in the L-1 loess layer, and three samples in palaeosols (Gi546 and Gi548) and intercalated loess layers (Gi547) of the pedocomplex P-1. Further two samples (Gi549 and Gi550) are derived from the younger part of the L-2 loess, above the bluish tephra layer at 15 m. At Achajur, it was not possible to take samples below the tephra, since these layers were heavily disturbed by erosional processes, and therefore, a stratigraphical assignment was not possible.
The fine grain fraction (4–11 µm) was separated by settling using Stokes’ law. To receive the quartz rich fraction, the polymineral samples were subjected to HCl (10%) and H2O2 (10%), and subsequently etched in 34% pre-treated H2SiF6 for several days (Fuchs et al., 2005). Removal of the feldspar fraction was tested through IR stimulation in the luminescence reader. 1 mg of material were pipetted onto stainless steel cups, preparing ca. 25 cups per sample.
Luminescence measurements were performed on a Lexsyg Smart luminescence reader using green LEDs for stimulation (525 ± 25 nm, power density 65 mW/cm2). Signals were detected with a Hamamatsu H7360 photomultiplier after passing a filter combination of a Semrock HC377/50 and a Schott BG3. This combination restricts the detected wavelength to ca. 350–400 nm, encompassing the peak OSL emission of quartz (Huntley et al., 1991; Lomax et al., 2015).
The polymineral fine grain fraction was extracted following the same laboratory procedure as for extracting the quartz fine grain fraction, without the etching step at the end. As for quartz, 1 mg of material was pipetted onto stainless steel cups. Signals were stimulated in a Lexsyg Smart luminescence reader using IR LEDs (830 ± 3 nm, 300 or 250 mW/cm2) and signal detection through an interference filter (AHF Brightline HC414/46 + Schott BG39) centred at 410 nm. All samples were analysed using the R luminescence package (Kreutzer et al., 2012b).
For De determination, a single aliquot regenerative (SAR) protocol after Murray and Wintle (2000, 2003) was applied. Preheat and cutheat temperatures in the standard measurements were set to 240–220°C, following preheat and preheat-dose recovery tests (Supplementary Figure S1).
OSL signals were measured for 50 s at 125°C and the initial and background integrals were set to 0–0.5 s and 40–50 s. Rejection criteria were set to 10% for each the recycling ratio, the IR depletion ratio (Duller, 2003), the test dose error and the total palaeodose error, and to 5% for the recuperation ratio. An exponential plus linear fit was used for generating a growth curve. Typical OSL and TL signals for sample Gi538 are shown in Supplementary Figure S2. A typical growth curve for the fine grain quartz fraction is provided in Figure 3.
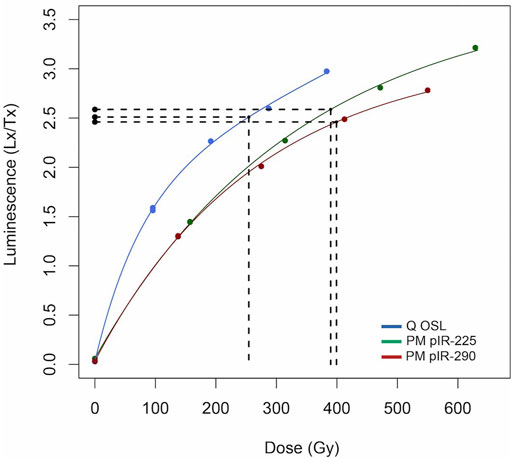
FIGURE 3. Typical growth curves of one aliquot each of sample Gi549, showing Lx/Tx values, Ln/Tn values and the respective palaeodoses for the quartz fine grain fraction, and the polymineral fine grain fraction measured with an pIRIR-225 and an pIRIR-290 protocol.
Per sample, 15 aliquots were measured and at least 14 aliquots passed the rejection criteria. As expected for fine grains, where OSL signals and corresponding doses are averaged over thousands of grains, overdispersion values were low, averaging 2.8%, with a maximum overdispersion of 5.8%. The arithmetic mean was used for final De calculation.
A pIRIR-225 following Buylaert et al. (2009) and a pIRIR-290 protocol following Thiel et al. (2011) and Li and Li (2012) were applied for dating the polymineral fine grain fraction. Table 1 gives details for the individual settings of the two protocols. In comparison to the original protocols of Thiel et al. (2011) and Li and Li (2012), the stimulation time in our study was increased to 600 s for the pIRIR-290 protocol, in order to fully deplete the IRSL signals. The first IRSL stimulation temperature was set to 130°C, hence to a larger temperature than the commonly used 50°C stimulation temperature (e.g. Thiel et al., 2011). An even higher first stimulation temperature of 200°C is recommended by Li and Li (2012) in order to reduce fading especially for older samples >400 Gy. We tested first stimulation temperatures of 50, 90, 130, 170 and 210°C for sample Gi544. For the two highest first stimulation temperatures of 170 amd 210°C, the post-IR signal became too weak to clearly distinguish it from the background level (Supplementary Figure S3). Apart from this observation, the pIRIR-290 palaeodose agrees within errors for first stimulation temperatures of 50, 90, 130 and 170°C for sample Gi544 (Supplementary Figure S4). We therefore decided for 130°C as first stimulation temperature, in order to account for possibly higher fading rates in the older samples, but still yielding a detectable post-IR signal with a low measurement error.
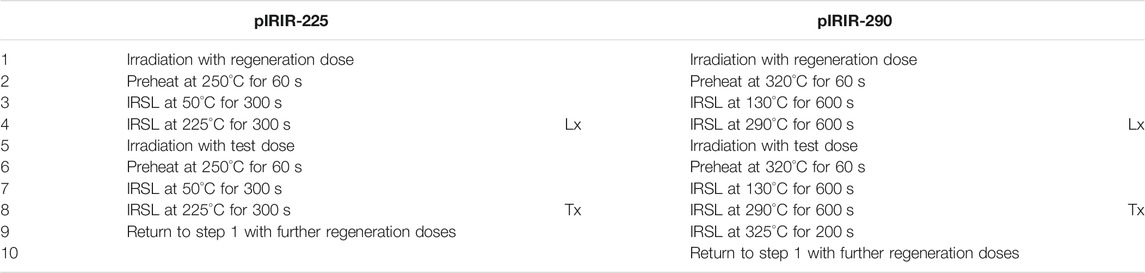
TABLE 1. Details of the pIRIR-225 and pIRIR-290 protocols used for dating the Achajur polymineral fine grain samples.
Signals for both protocols were integrated over the first 5 s of the signal, subtracted by a background derived from the last 50 or 100 s for the pIRIR-225 and pIRIR-290 protocol, respectively. Typical growth curves for the pIRIR-225 and pIRIR-290 signal are shown in Figure 3. For standard measurements, 10 aliquots for each sample were measured for the pIRIR-225 protocol and five to nine aliquots for the pIRIR-290 protocol. Rejection thresholds were set to 10% each for the recycling ratio, 5% for the recuperation ratio and 15% for the test dose error and the total palaeodose error. Average overdispersion values of 1.8% for the pIRIR-225 and 2.5% for the pIRIR-290 protocol were noticed. For both protocols, the arithmetic mean was applied for final De estimation.
Residuals were determined either after bleaching in natural sunlight (2 or 7 days) or after bleaching for 24 h in the solar simulator of the Lexsyg reader, using the sunlight spectrum (Frouin et al., 2015). Respective residuals along with bleaching type and duration are given in Table 2, consisting of arithmetic mean values of two to three aliquots per measurement. Assuming that the residual of Gi549 is an outlier, the pIRIR-225 protocol produces lower residuals as the pIRIR-290 protocol. Translating these residuals into ages by dividing them by a typical dose rate for our samples of 3.3 Gy/ka, the pIRIR-225 protocol yields residuals of around 2–3 ka, whereas the pIRIR-290 protocol yields a residual of around 6 ka. For final age calculation, residuals for the pIRIR-225 protocol are neglected, whereas for ages based on the pIRIR-290 protocol, a residual of 18.3 Gy is subtracted from each De value, representing the arithmetic mean of the two lowest residuals.
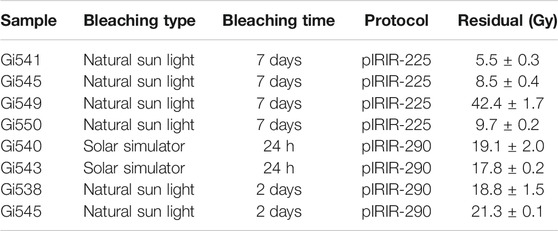
TABLE 2. Residual signals measured for the pIRIR-225 and pIRIR-290 protocol.
Dose recovery tests were carried out after either 2 or 7 days of exposure to natural daylight or after 24 h bleaching in the solar simulator (Frouin et al., 2015). Subsequently, different known doses were administered in the Lexsyg reader and recovered with either the pIRIR-225 or the pIRIR-290 protocol. At least three aliquots were measured for each test and the dose recovery ratios provided in Table 3 are based on the arithmetic mean of the three De values. Ratios are given with and without residual subtraction.
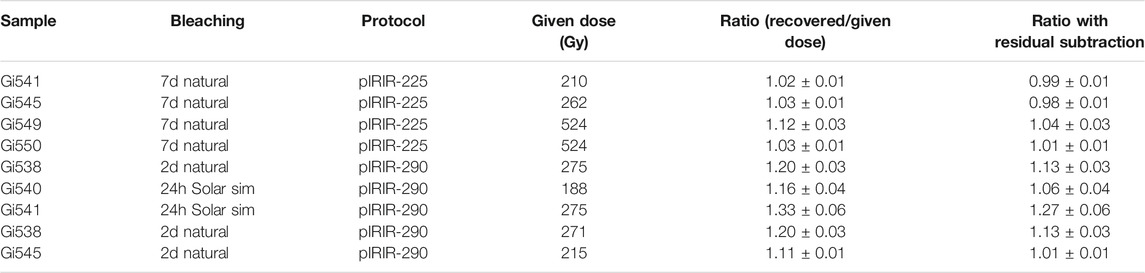
TABLE 3. Results of dose recovery tests using a pIRIR-225 and a pIRIR-290 protocol.
For the pIRIR-225 protocol, dose recovery ratios range between 1.02 ± 0.01 and 1.12 ± 0.03, when no residual subtraction is applied and between 0.98 ± 0.01 and 1.04 ± 0.03, when residual subtraction is applied. Dismissing sample Gi549, which showed an outlier in the recovered dose as well as in the residual dose, the protocol yields acceptable dose recovery ratios without residual subtraction. Therefore, De values and ages based on the pIRIR-225 protocol are calculated without residual subtraction in the final results.
The pIRIR-290 protocol yielded one unsatisfactory result in the dose recovery test, with a ratio of 1.33 before and 1.27 after residual subtraction. The reason for the overestimation of the given dose is possibly related to a too low test dose, which in this test was set to 23% of the given dose. In a further dose recovery test, the test dose size was increased to 33% of the given dose, yielding more satisfactory ratios of 1.16 ± 0.04 and 1.06 ± 0.04 (Gi540) and 1.20 ± 0.03 and 1.13 ± 0.03 (Gi538) before and after residual dose subtraction. Dose recovery ratios in dependence of the test dose size were already reported by e.g. Yi et al. (2016). They noticed an overestimation of the given dose in dose recovery tests, when the test dose was below 15% of the total (natural plus given) dose in a pIRIR-290 protocol with a first stimulation temperature of 50°C. It is followed that for the standard measurements, a test dose of 30% of the palaeodose is more appropriate for the samples in this study. Furthermore, the pIRIR-290 seems to perform better with a residual subtraction, therefore, De values and ages produced with this protocol are reported after a residual subtraction.
Fading rates for the pIRIR-225 protocol were determined by subjecting the samples to different storage times up to approximately 2 days after irradiation and preheat, following Auclair et al. (2003). From these storage times, a g-value was calculated (Huntley and Lamothe, 2001). Table 4 provides g-values for the pIRIR-225 protocol in relation to different irradiation times.
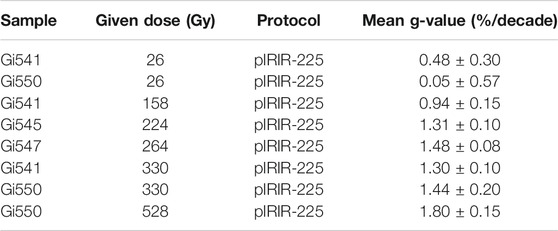
TABLE 4. g-values measured for the pIRIR-225 protocol, following the procedure of Auclair et al. (2003).
As visualised also in Figure 4, g-values are higher when the given dose is higher, and possibly the data set can be fitted by a logarithmic function. A similar relationship was recognised by Li and Li (2008), both in modelled and experimental datasets. It is thus likely that the older samples with higher palaeodoses have undergone higher rates of fading. In many studies, fading rates of below ca. 1.5% are treated as laboratory artefacts and are not used for a fading correction (e.g. Thiel et al., 2011; Buylaert et al., 2012). In our dataset, only one sample yields a g-value above 1.5%, which is sample Gi550 with a g-value of 1.8%. So far it is unclear, to which extent this value is a combination of a potential laboratory artefact and a true fading rate. At the current stage of research, we will thus not correct the pIRIR-225 ages for fading, and will treat sample Gi550 as minimum age. In a successive study on further sections from the same area, the need for a fading correction of the older samples may become clearer, because in these sections, a known age tephra is encompassed by luminescence samples. For the pIRIR-290 protocol, no fading tests were carried out, based on the assumption that the signal of the pIRIR-290 protocol does not fade (Thiel et al., 2011; Buylaert et al., 2012). The latter ages are thus used for an internal check on the degree of fading of the pIRIR-225 ages.
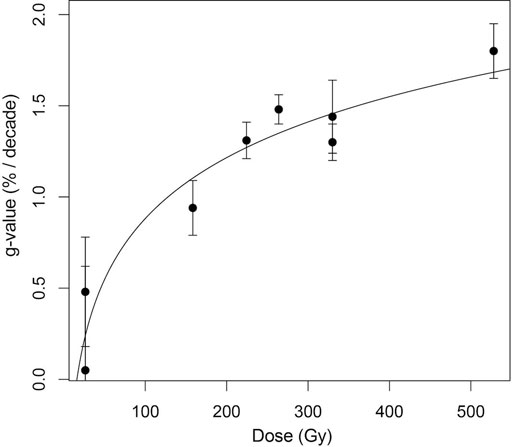
FIGURE 4. Measured fading rates versus given dose in the fading test, and the potential logarithmic relation between the data.
The dose rate for OSL age calculation was determined by thick source α-counting (U and Th) and ICP-OES (K) at the University of Bayreuth. Cosmic-ray dose rates were calculated according to Prescott and Hutton (1994). An a-value of 0.035 ± 0.02 was applied for the quartz fine grain fraction (Mauz et al., 2006) and of 0.086 ± 0.004 (Rees-Jones, 1995) for the polymineral fraction. For the latter, an internal K-content of 12.5 ± 0.5% (Huntley and Baril, 1997) was also included in dose rate calculation. The water content of the samples was estimated to 15.0 ± 7.5%. Calculation of the total dose rate was carried out using the program DRAC (Durcan et al., 2015).
Table 5 summarises radionuclide concentrations and resulting dose rates for the quartz and the polymineral fine grain fraction. Table 6 and Figure 5 show all luminescence ages, obtained from quartz and from uncorrected polymineral fine grain De values. It is observed that between 35 and 55 ka, ages of the three protocols and mineral fractions agree very well. Assuming that the quartz ages are reliable in this age range, this argues for negligible fading of the polymineral fine grain ages for samples <55 ka, and for the correctness of the residual subtraction procedure of the polymineral fraction. The quartz ages are younger than the polymineral ages from ca. 60 ka onward, but agree within errors for samples up to ca. 85 ka. Sample Gi549 below the P-1 pedocomplex shows a discrepancy between the quartz and the polymineral fine grain fraction, most likely caused by an underestimation of the quartz fine grain fraction. Underestimation of the quartz fine grain fraction from ca. 60 ka onward have been shown for loess samples from Eastern Europe (e.g. Timar-Gabor et al., 2011, 2015a; Kreutzer et al., 2012a; Constantin et al., 2015). The reason for the underestimation is not yet totally understood, but is probably linked to differences in natural and laboratory generated growth curves (Chapot et al., 2012; Timar-Gabor and Wintle, 2013; Timar-Gabor et al., 2015b; Avram et al., 2020). All polymineral ages, measured with the pIRIR-225 and pIRIR-290 protocol agree within errors, and the mean ratio (pIRIR-290/pIRIR-225) between the two datasets is 1.03. This suggests that there is no significant difference in fading between the two protocols for our samples.
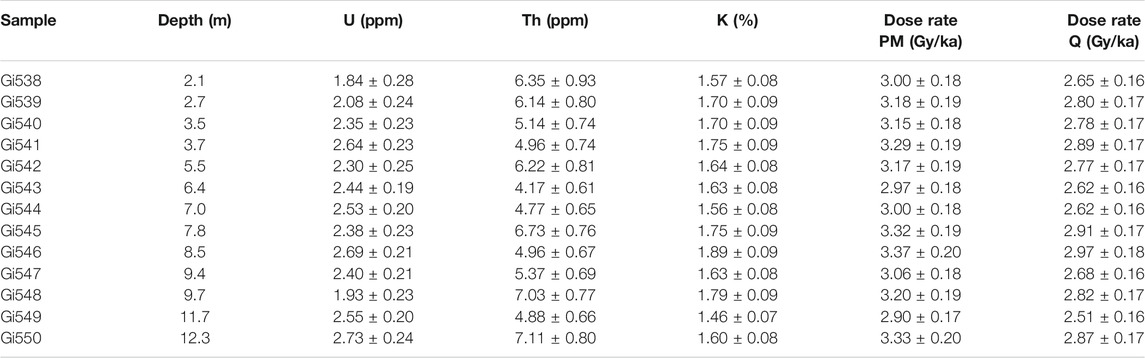
TABLE 5. Radionuclide concentrations and resulting dose rates based on Durcan et al. (2015) for the quartz and polymineral fine grain fraction.
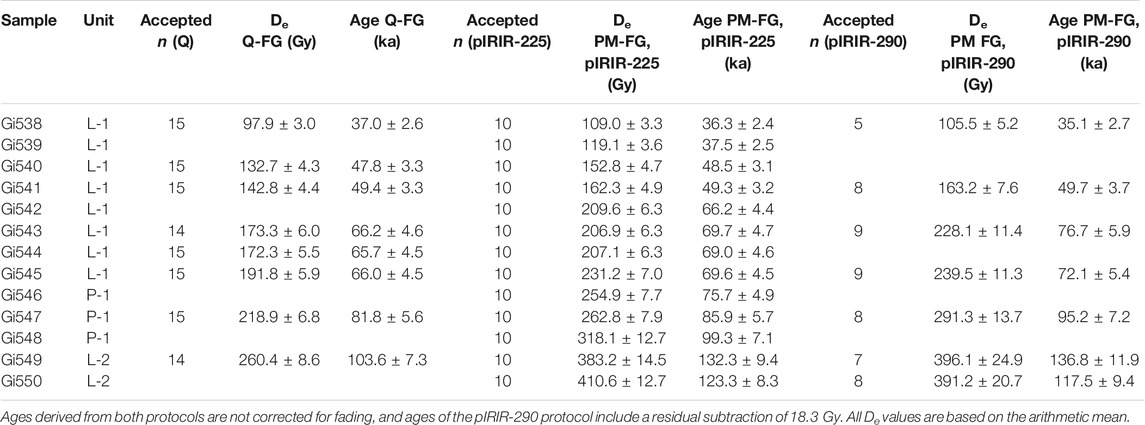
TABLE 6. Luminescence ages for the quartz (Q-FG) and polymineral fine (PM-FG) grain fraction.
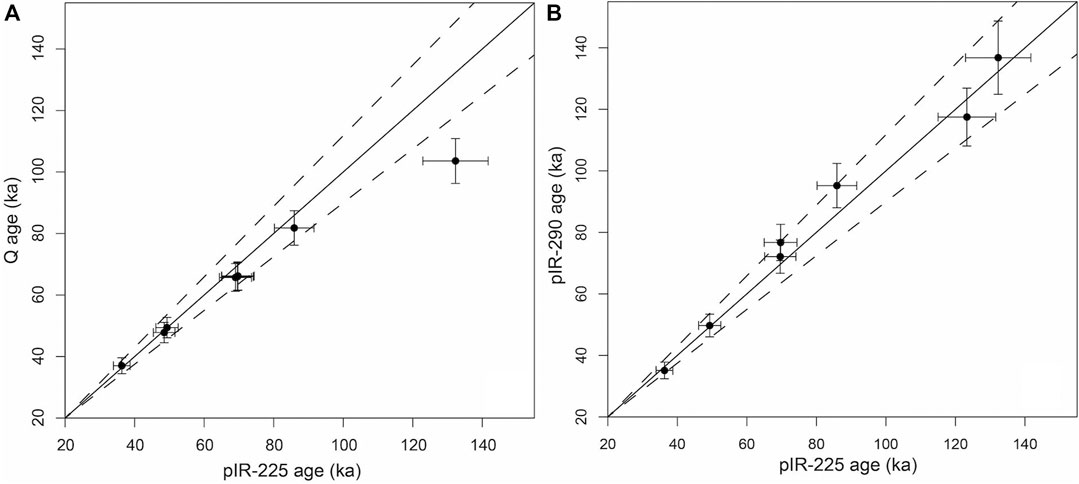
FIGURE 5. Comparison of luminescence ages, comparing (A) quartz fine grain ages with pIRIR-225 polymineral fine grain ages, and (B) pIRIR-225 and pIRIR-290 polymineral fine grain ages. The dotted lines indicate 10% deviations from the 1:1 line.
Results of the field magnetic susceptibility measurements are not standardized to mass or volume. However, a comparison with results from other loess areas measured with the same device shows that maximum MS values of the Achajur section are at least 10 times the maximum values in eastern German loess sections (e.g. Meszner et al., 2011) or 100 times the maximum values of loess sections in central Spain (Wolf et al., 2018). Most probably, this is due to a strong admixture of magnetic minerals derived from volcanic clastics such as tephra material or weathered volcanic bedrock.
The sequence of the L-2 loess gives a good impression about how the incorporation of volcanic material affects the magnetic susceptibility. Lowest values of ∼300 × 10−6 SI-units are linked to the bluish tephra (∼15 m), possibly indicating rhyolitic volcanism. Three meters above this tephra numerous thinner and darker tephra layers as well as volcanic rock fragments originating from neighbouring slopes are present. Magnetic susceptibility shows background values in the pure loess of about 1700 × 10−6 SI-units, while in loess with volcanic contaminations, values rise to ca. 2700 × 10−6 SI-units. This clearly illustrates the importance of the respective proportion of volcanic clasts within loess deposits for MS results. Furthermore, it shows that a simple scheme of low MS in loess and pedogenic enrichment of MS in palaeosols is not applicable to the Achajur section.
Considering the polymineral fine grain ages as reliable, the LPS Achajur shows a chronology in line with the expected stratigraphy, with the prominent pedocomplex P-1 falling into MIS5, and the overlying loess unit L-1 falling into MIS4 and 3. The MIS2 does not seem to be present at Achajur. The loess unit below the P-1 pedocomplex should probably fall into MIS6, according to stratigraphic expectations, which ends at around 130 ka (Lisiecki and Raymo, 2005). Likewise, at Lake Van in eastern Anatolia, full interglacial conditions assigned to MIS5 are established at ca. 129 ka, following an initial warming phase from ca. 131 ka onwards (Pickarski et al., 2015). The ages of sample Gi550, i.e. 117 ± 9 (pIRIR-290) and 123 ± 8 (pIRIR-225) underestimate this stratigraphic expectation, and they are also slightly younger than the overlying sample Gi549, which in turn agrees with the stratigraphic expectation. Possibly, the age discrepancy can partially be explained by an inaccurate estimation of the dose rate, since both samples and both protocols show agreeing palaeodoses. O’Gorman et al. (2021) for example showed that tephras can have very low internal potassium contents in IR-sensitive grains, e.g. due to a dominance of sanidine which is typical in rhyolitic rocks. The internal K-content of 12.5 ± 0.5% (Huntley and Baril, 1997) used for all our samples may thus be an overestimate in those samples with a large tephric contribution. Nonetheless, the effect on the pIRIR age would be small. For example, a theoretical internal K-content of 5% would only increase the age of sample Gi550 by 0.5%.
A further explanation could be a stronger rate of signal loss due to fading for sample Gi550 due to a thin (relocated?) tephra layer between sample Gi549 and Gi550. Since volcanic feldspar is known to fade to a higher degree than non-volcanic feldspar (Wintle, 1973), this tephra could indeed be responsible for a higher fading rate in sample Gi550. For the pIRIR-225 protocol, the sample showed a measured g-value of 1.8%, higher than for other samples for which g-values were measured. At this stage of research, we can only speculate on the underestimation of sample Gi550 and will thus treat the ages of this sample as most likely underestimated in the following.
With the resulting luminescence ages, the Achajur section provides a similar chronostratigraphy as the nearby LPS Sevkar, published by Wolf et al. (2016). They also present a “too young” age of 110 ± 17 ka for the loess unit below the P-1, and MIS4 to MIS3 ages for the loess unit above the P-1 palaeosol complex. Again, at this stage of research, we consider the age below the P-1 at the Sevkar section as true age underestimate. A similar chronostratigraphy is also recognised in LPS from northern Iran, with high loess deposition rates during MIS4, a three-fold palaeosol assigned to MIS5 and further loess deposition during MIS6 (Lauer et al., 2017; Kehl et al., 2021). In the latter two studies, a non-fading corrected pIRIR-290 protocol (Toshan loess section, Lauer et al., 2017) and a fading-corrrected pIRIR-225 protocol (Neka-Abelou, Kehl et al., 2021) were applied to polymineral fine grain samples. Similar to our results at Achajur, some age uncertainties, i.e. a potential age underestimation at Toshan and potential age overestimation at Neka-Abelou are noted for the MIS5 and MIS6 deposits. This demonstrates that–despite the huge advances made since the development of pIRIR protocols–dating of loess samples >100 ka still remains challenging. In contrast to the LPS at Achajur, the Iranian loess section Toshan also comprises units of significant loess deposition younger than 35 ka (MIS3-MIS2) (Lauer et al., 2017). At Neka Abelou however, the MIS2 is also not fully represented, with a youngest age of 28 ± 2 ka relatively near to the surface (Kehl et al., 2021).
In the following, the chronostratigraphy is compared with the well dated palynological records of Lake Van in Turkey (Litt et al., 2014; Stockhecke et al., 2014) and Lake Urmia in Iran (Djamali et al., 2008). Further comparisons are made with the studies of Richter et al. (2020) and Trigui et al. (2019), who reconstructed palaeoenvironments directly in the Sevkar loess area by gastropod analyses and leaf wax n-alkane analyses, respectively.
The L-2 loess unit is presented by samples Gi550 and Gi549, which we expect to represent MIS6 with a slight underestimation. The prominent tephra at 15 m, located ca. 2.5 m below sample Gi550 cannot be bracketed with luminescence ages in this study, because the underlying loess unit was not sampled. However, the age of sample Gi549 provides a minimum age of around 132 ± 9 ka (pIRIR-225) and 137 ± 12 ka (pIRIR-290) for the tephra. A further, thin tephra is located between samples Gi550 and Gi549 at ca. 12 m. Interestingly, the tephra at 15 m is associated with a potential underlying incipient soil unit. The thinner tephra between samples Gi549 and Gi550 also shows a reddish layer below, which may also indicate weak pedogenesis. Possibly, the high vulnerability of volcanic glasses to weathering processes is connected to soil formation processes below the tephra layers (Kirkman and McHardy, 1980). However, relatively low values of magnetic susceptibility (Figure 2) do not indicate strong pedogenesis within the respective layers. Thus we are not able to undoubtedly clarify the development of the reddish units below the tephra layers.
A potential derivation of the tephra at 15 m is Nemrut volcano, which is situated ca 350 km to the southwest. Nemrut volcano shows an increase in volcanic activity from 200 ka onward (Sumita and Schmincke, 2013), and Lake Van shows several tephra layers in the MIS6 layers (Stockhecke et al., 2014). Lake Van also provides the possibility for correlation with a nearby palaeoclimatic record derived from the pollen assemblage archived in the lake sediments. In the vicinity of the lake, vegetation is characterised by dwarf-shrub steppe and desert steppe, with very little arboreal pollen during MIS6, indicating dry and cold conditions (Litt et al., 2014). A similar assemblage of Artemisa steppe and grasses is found at Lake Urmia in NE-Iran (Djamali et al., 2008). Richter et al. (2020) deduced a species-poor shrub steppe from gastropod assemblages found in other loess sections from the Sevkar area during MIS6. They also found indications that the limiting factor for tree growth during glacials in north-eastern Armenia is related to dry conditions rather than low temperatures. Similar conclusions were drawn by Trigui et al. (2019) from leaf wax n-alkanes in the Sevkar area.
Three samples were dated within the P-1 palaeosol complex, which are Gi548, Gi547 and Gi546. Field observations show a three-fold character of this unit, with three palaeosol horizons intercalated by two thin loess layers or relocated loessic material, respectively. The magnetic susceptibility record shows a significant increase in MS values for the lower two palaeosols of the P-1 complex. The uppermost palaeosol (P-1/S1) however is not as pronounced, and only shows a little increase in the magnetic susceptibilty in relation to the over- and underlying loess. Hence, especially the field observations seem to follow the three-fold character of MIS5 with its interglacial period 5e, its two interstadial periods 5c and 5a, and the two stadial periods 5d and 5b in between (e.g. Martinson et al., 1987; Lisiecki and Raymo, 2005). The relatively large errors of the pIRIR-ages and the partially diverging ages between the pIRIR-290 and the pIRIR-225 protocols make it difficult to assign the sediments in the P-1 pedocomplex to substages of MIS5. Furthermore, it needs to be considered that luminescence methods do not necessarily date soil formation but the loess deposition prior to pedogenesis, although a rejuvenation of the OSL age may occur in phases of strong bioturbation (e.g. Reimann et al., 2017). Sample Gi548 with an age of 99 ± 7 ka (pIRIR-225) was taken in unit P-1-S2, hence in the older of the two chernozem-like horizons, and is centred at MIS5c (Martinson et al., 1987). The overlying intercalated loess layer with sample Gi547 has a pIRIR-225 age of 86 ± 6 ka and a pIRIR-290 age of 95 ± 7 ka. These two ages cover MIS stages 5a to 5c, with a weighted mean of the two ages of ca. 91 ka centred at MIS5b. Sample Gi546 is located in the younger chernozem-like horizon of unit P-1/S1. With an age of 76 ± 5 ka, deposition of this unit falls into MIS5a/MIS4, hence the soil formation probably postdates MIS5a. With these luminescence ages, it seems plausible that the main pedogenesis developed in the pedocomplex P-1 took place during warmer substages of MIS5e and 5c. However, for the uppermost soil, an assignment to an interstadial of MIS5 is difficult.
Lake Van records a high percentage of arboreal pollen for MIS5e, dominated by Quercus and Pinus nigra. As pine is not present in today’s vegetation, Litt et al. (2014) deduced a higher degree of seasonality during MIS5e as compared to today, with colder winters and warmer summers than today. MIS5d is recognised as tree-less stadial and MIS5c again shows a prominent peak of arboreal pollen, although with a lower percentage of Quercus than MIS5e. MIS5b is again associated with colder and/or dryer conditions due to a decline of arboreal pollen (Litt et al., 2014). MIS5a is subdued at Lake Van, which, according to Litt et al. (2014), could possibly be the result of high tephra input, concealing the pollen assemblage in this part of the record. However, Lake Urmia also shows a subdued MIS5a, with only slightly higher arboreal pollen than during the following MIS4 (Djamali et al., 2008), arguing for near-glacial conditions during the late part of MIS5 in the region. For two nearby LPS in the Sevkar area, high-grass steppe and forest-steppe conditions during formation of the P-1 pedocomplex are reconstructed from gastropod and n-alkane analyses (Trigui et al., 2019; Richter et al., 2020).
With the exception of the pIRIR-290 age of sample Gi543, the samples Gi542-Gi545 yield ages between 66 ± 4 and 72 ± 5 ka, arguing for high rates of loess deposition during MIS4, indicating dry environmental conditions. A similar finding was reported by Malinsky-Buller et al. (2020) who assigned the onset of aeolian sediment deposition in the Hrazdan Valley in central Armenia to the transition from MIS5 to MIS4. Pronounced environmental dryness during MIS4 is likewise supported by the pollen records of Lake Van and Lake Urmia, which are dominated by steppe and desert steppe vegetation (Djamali et al., 2008; Litt et al., 2014), and by the gastropod fauna and n-alkanes at LPS in the Sevkar area (Trigui et al., 2019; Richter et al., 2020).
Further loess deposition is noted at around 49 ± 3 ka (Gi540 and Gi541) and at around 37 ± 3 ka (Gi538 and Gi539). Between these loess layers, the Achajur section incorporates weekly developed palaeosols. Based on the luminescence ages, the most prominent of these palaeosols (L-1/S2) falls into a period between 66 ± 4 and 49 ± 3 ka and can possibly be related to the pronounced Greenland interstadial 14 from 55 to 51.5 ka (Rasmussen et al., 2014). At the site Kalavan 2, 50 km south of the Sevkar loess area, a juxtaposition of surface erosion and pedogenesis was interpreted as evidence for strong seasonality changes in line with a sequence of stadials and interstadials at the end of MIS4 and the beginning of MIS3 (Malinsky-Buller et al., 2021). Intermediate climate conditions during this stage of MIS3 are recognised at Lake Van with a minor increase in Quercus pollen between 50 and 60 ka. Relatively wet conditions–especially with enhanced winter rainfall–are also recorded at the Karaca Cave in NW-Turkey (Rowe et al., 2012), whereas Lake Urmia does not show an increase in arboreal pollen during this time. The maximum of the last glacial, MIS2, does not seem to be present at the Achajur site.
In conclusion, the LPS Achajur is generally in line with the expected global stratigraphy and with nearby pollen records of Lake Van and Lake Urmia. It indicates dry glacials promoting loess deposition and wetter interglacials and interstadials with soil formation. The LGM is not represented in the section, either due to prior deposition and later erosion or due to a lack of loess formation. With exception of the lowermost sample, which is located near an overlying tephra, polymineral fine grain samples measured with a pIRIR-225 and pIRIR-290 protocol do not seem to require a fading correction. Quartz ages older than 60 ka appear slightly underestimated, especially for the MIS6 loess layer. Future research will concentrate on the relation between soil and tephra layers and an explanation for the lacking LGM loess layers.
The raw data supporting the conclusions of this article will be made available by the authors, without undue reservation.
JL carried out part of the luminescence dating, wrote the paper and prepared some of the figures. DW carried out field work, prepared some of the figures and is responsible for the stratigraphic description of the loess section, UTW carried out part of the luminescence dating and contributed in field work, LS is the project leader in the Armenian research team, HH carried out field work, and DF and MF are the project leaders of the TU Dresden and the JLU Giessen research teams.
This work was funded by the German Research Foundation (DFG, FU 417/26-1 and FA 239/21-1).
The authors declare that the research was conducted in the absence of any commercial or financial relationships that could be construed as a potential conflict of interest.
All claims expressed in this article are solely those of the authors and do not necessarily represent those of their affiliated organizations, or those of the publisher, the editors and the reviewers. Any product that may be evaluated in this article, or claim that may be made by its manufacturer, is not guaranteed or endorsed by the publisher.
We thank Manfred Fischer (University of Bayreuth) for carrying out the determination of radionuclide concentrations, and Lisett Diehl for help with the figures. We also thank SY, XM and AD for their very constructive and helpful reviews.
The Supplementary Material for this article can be found online at: https://www.frontiersin.org/articles/10.3389/feart.2021.755084/full#supplementary-material
Antoine, P., Lagroix, F., Jordanova, D., Jordanova, N., Lomax, J., Fuchs, M., et al. (2019). A Remarkable Late Saalian (MIS 6) Loess (Dust) Accumulation in the Lower Danube at Harletz (Bulgaria). Quat. Sci. Rev. 207, 80–100. doi:10.1016/j.quascirev.2019.01.005
Auclair, M., Lamothe, M., and Huot, S. (2003). Measurement of Anomalous Fading for Feldspar IRSL Using SAR. Radiat. Measurements 37, 487–492. doi:10.1016/s1350-4487(03)00018-0
Avram, A., Constantin, D., Veres, D., Kelemen, S., Obreht, I., Hambach, U., et al. (2020). Testing Polymineral post‐ IR IRSL and Quartz SAR ‐ OSL Protocols on Middle to Late Pleistocene Loess at Batajnica, Serbia. Boreas 49, 615–633. doi:10.1111/bor.12442
Buggle, B., Glaser, B., Hambach, U., Gerasimenko, N., and Marković, S. (2011). An Evaluation of Geochemical Weathering Indices in Loess-Paleosol Studies. Quat. Int. 240, 12–21. doi:10.1016/j.quaint.2010.07.019
Buylaert, J.-P., Jain, M., Murray, A. S., Thomsen, K. J., Thiel, C., and Sohbati, R. (2012). A Robust Feldspar Luminescence Dating Method for Middle and Late Pleistocene Sediments. Boreas 41, 435–451. doi:10.1111/j.1502-3885.2012.00248.x
Buylaert, J. P., Murray, A. S., Thomsen, K. J., and Jain, M. (2009). Testing the Potential of an Elevated Temperature IRSL Signal from K-Feldspar. Radiat. Measurements 44, 560–565. doi:10.1016/j.radmeas.2009.02.007
Chapot, M. S., Roberts, H. M., Duller, G. A. T., and Lai, Z. P. (2012). A Comparison of Natural- and Laboratory-Generated Dose Response Curves for Quartz Optically Stimulated Luminescence Signals from Chinese Loess. Radiat. Measurements 47, 1045–1052. doi:10.1016/j.radmeas.2012.09.001
Constantin, D., Cameniţă, A., Panaiotu, C., Necula, C., Codrea, V., and Timar-Gabor, A. (2015). Fine and Coarse-Quartz SAR-OSL Dating of Last Glacial Loess in Southern Romania. Quat. Int. 357, 33–43. doi:10.1016/j.quaint.2014.07.052
Djamali, M., de Beaulieu, J.-L., Shah-hosseini, M., Andrieu-Ponel, V., Ponel, P., Amini, A., et al. (2008). A Late Pleistocene Long Pollen Record from Lake Urmia, NW Iran. Quat. Res. 69, 413–420. doi:10.1016/j.yqres.2008.03.004
Duller, G. A. T. (2003). Distinguishing Quartz and Feldspar in Single Grain Luminescence Measurements. Radiat. Measurements 37, 161–165. doi:10.1016/s1350-4487(02)00170-1
Durcan, J. A., King, G. E., and Duller, G. A. T. (2015). DRAC: Dose Rate and Age Calculator for Trapped Charge Dating. Quat. Geochronol. 28, 54–61. doi:10.1016/j.quageo.2015.03.012
Evans, M. E., and Heller, F. (1994). Magnetic Enhancement and Palaeoclimate: Study of a Loess/palaeosol Couplet Across the Loess Plateau of China. Geophys. J. Int. 117, 257–264. doi:10.1111/j.1365-246x.1994.tb03316.x
Frouin, M., Huot, S., Mercier, N., Lahaye, C., and Lamothe, M. (2015). The Issue of Laboratory Bleaching in the Infrared-Radiofluorescence Dating Method. Radiat. Measurements 81, 212–217. doi:10.1016/j.radmeas.2014.12.012
Fuchs, M., Kreutzer, S., Rousseau, D.-D., Antoine, P., Hatté, C., Lagroix, F., et al. (2013). The Loess Sequence of Dolní Věstonice, Czech Republic: A New OSL-Based Chronology of the Last Climatic Cycle. Boreas 42, 664–677. doi:10.1111/j.1502-3885.2012.00299.x
Fuchs, M., Straub, J., and Zöller, L. (2005). Residual Luminescence Signal of Recent River Flood Sediments: A Comparison Between Quartz and Feldspar of fine- and Coarse-Grain Sediments. Ancient TL 2, 25–30.
Hatté, C., Fontugne, M., Rousseau, D.-D., Antoine, P., Zöller, L., Laborde, N. T., et al. (1998). δ13C Variations of Loess Organic Matter as a Record of the Vegetation Response to Climatic Changes During the Weichselian. Geol 26, 583–586. doi:10.1130/0091-7613(1998)026<0583:cvolom>2.3.co;2
Hatté, C., Gauthier, C., Rousseau, D.-D., Antoine, P., Fuchs, M., Lagroix, F., et al. (2013). Excursions to C4 Vegetation Recorded in the Upper Pleistocene Loess of Surduk (Northern Serbia): An Organic Isotope Geochemistry Study. Clim. Past 9, 1001–1014. doi:10.5194/cp-9-1001-2013
Huntley, D., and Baril, M. (1997). The K Content of the K-Feldspars Being Measured in Optical Dating or in Thermoluminescence Dating. Ancient TL 15, 11–13.
Huntley, D. J., Godfrey-Smith, D. I., and Haskell, E. H. (1991). Light-induced Emission Spectra from Some Quartz and Feldspars. Int. J. Radiat. Appl. Instrumentation. D. Nucl. Tracks Radiat. Measurements 18, 127–131. doi:10.1016/1359-0189(91)90104-p
Huntley, D. J., and Lamothe, M. (2001). Ubiquity of Anomalous Fading in K-Feldspars and the Measurement and Correction for it in Optical Dating. Can. J. Earth Sci. 38, 1093–1106. doi:10.1139/e01-013
Kars, R. H., Reimann, T., Ankjaergaard, C., and Wallinga, J. (2014). Bleaching of the post-IR IRSL Signal: New Insights for Feldspar Luminescence Dating. Boreas 43, 780–791. doi:10.1111/bor.12082
Kehl, M., Vlaminck, S., Köhler, T., Laag, C., Rolf, C., Tsukamoto, S., et al. (2021). Pleistocene Dynamics of Dust Accumulation and Soil Formation in the Southern Caspian Lowlands - New Insights from the Loess-Paleosol Sequence at Neka-Abelou, Northern Iran. Quat. Sci. Rev. 253, 106774. doi:10.1016/j.quascirev.2020.106774
Kirkman, J. H., and McHardy, W. J. (1980). A Comparative Study of the Morphology, Chemical Composition and Weathering of Rhyolitic and Andesitic Glass. Clay miner. 15, 165–173. doi:10.1180/claymin.1980.015.2.07
Kreutzer, S., Fuchs, M., Meszner, S., and Faust, D. (2012a). OSL Chronostratigraphy of a Loess-Palaeosol Sequence in Saxony/Germany Using Quartz of Different Grain Sizes. Quat. Geochronol. 10, 102–109. doi:10.1016/j.quageo.2012.01.004
Kreutzer, S., Schmidt, C., Fuchs, M., Dietze, M., and Fischer, M. (2012b). Introducing an R Package for Luminescence Dating Analysis. Ancient TL 30, 1–8.
Lauer, T., Frechen, M., Vlaminck, S., Kehl, M., Lehndorff, E., Shahriari, A., et al. (2017). Luminescence-chronology of the Loess Palaeosol Sequence Toshan, Northern Iran - A Highly Resolved Climate Archive for the Last Glacial-Interglacial Cycle. Quat. Int. 429, 3–12. doi:10.1016/j.quaint.2015.03.045
Li, B., and Li, S.-H. (2012). A Reply to the Comments by Thomsen et al. on "Luminescence Dating of K-feldspar from Sediments: A Protocol Without Anomalous Fading Correction". Quat. Geochronol. 8, 49–51. doi:10.1016/j.quageo.2011.10.001
Li, B., and Li, S.-H. (2008). Investigations of the Dose-dependent Anomalous Fading Rate of Feldspar from Sediments. J. Phys. D: Appl. Phys. 41, 225502. doi:10.1088/0022-3727/41/22/225502
Li, B., and Li, S.-H. (2011). Luminescence Dating of K-Feldspar from Sediments: A Protocol Without Anomalous Fading Correction. Quat. Geochronol. 6, 468–479. doi:10.1016/j.quageo.2011.05.001
Lisiecki, L., and Raymo, M. (2005). A Pliocene‐Pleistocene Stack of 57 Globally Distributed Benthic δ18O Records. Paleocean 20, 1–17. doi:10.1029/2004pa001071
Litt, T., Pickarski, N., Heumann, G., Stockhecke, M., and Tzedakis, P. C. (2014). A 600,000 Year Long Continental Pollen Record from Lake Van, Eastern Anatolia (Turkey). Quat. Sci. Rev. 104, 30–41. doi:10.1016/j.quascirev.2014.03.017
Lomax, J., Fuchs, M., Antoine, P., Rousseau, D.-D., Lagroix, F., Hatté, C., et al. (2019). A Luminescence-Based Chronology for the Harletz Loess Sequence, Bulgaria. Boreas 48, 179–194. doi:10.1111/bor.12348
Lomax, J., Mittelstrass, D., Kreutzer, S., and Fuchs, M. (2015). OSL, TL and IRSL Emission Spectra of Sedimentary Quartz and Feldspar Samples. Radiat. Measurements 81, 251–256. doi:10.1016/j.radmeas.2015.02.018
Malinsky-Buller, A., Glauberman, P., Ollivier, V., Lauer, T., Timms, R., Frahm, E., et al. (2021). Short-term Occupations at High Elevation During the Middle Paleolithic at Kalavan 2 (Republic of Armenia). PLOS ONE 16, e0245700. doi:10.1371/journal.pone.0245700
Malinsky-Buller, A., Glauberman, P., Wilkinson, K., Li, B., Frahm, E., Gasparyan, B., et al. (2020). Evidence for Middle Palaeolithic Occupation and Landscape Change in Central Armenia at the Open-Air Site of Alapars-1. Quat. Res. 99, 223–247. doi:10.1017/qua.2020.61
Martinson, D. G., Pisias, N. G., Hays, J. D., Imbrie, J., Moore, T. C., and Shackleton, N. J. (1987). Age Dating and the Orbital Theory of the Ice Ages: Development of a High-Resolution 0 to 300,000-year Chronostratigraphy. Quat. Res. 27, 1–29. doi:10.1016/0033-5894(87)90046-9
Mauz, B., Packman, S., and Lang, A. (2006). The Alpha Effectiveness in Silt-sized Quartz: New Data Obtained by Single and Multiple Aliquot Protocols. Ancient TL 24, 47–52.
Meszner, S., Fuchs, M., and Faust, D. (2011). Loess-Palaeosol-Sequences from the Loess Area of Saxony (Germany). E&g Quat. Sci. J. 60, 47–65. doi:10.3285/eg.60.1.03
Moine, O., Rousseau, D.-D., and Antoine, P. (2005). Terrestrial Molluscan Records of Weichselian Lower to Middle Pleniglacial Climatic Changes from the Nussloch Loess Series (Rhine Valley, Germany): The Impact of Local Factors. Boreas 34, 363–380. doi:10.1080/03009480510013060
Murray, A. S., and Wintle, A. G. (2000). Luminescence Dating of Quartz Using an Improved Single-Aliquot Regenerative-Dose Protocol. Radiat. Measurements 32, 57–73. doi:10.1016/s1350-4487(99)00253-x
Murray, A. S., and Wintle, A. G. (2003). The Single Aliquot Regenerative Dose Protocol: Potential for Improvements in Reliability. Radiat. Measurements 37, 377–381. doi:10.1016/s1350-4487(03)00053-2
Neill, I., Meliksetian, K., Allen, M. B., Navarsardyan, G., and Karapetyan, S. (2013). Pliocene-Quaternary Volcanic Rocks of NW Armenia: Magmatism and Lithospheric Dynamics Within an Active Orogenic Plateau. Lithos 180-181, 200–215. doi:10.1016/j.lithos.2013.05.005
O'Gorman, K., Tanner, D., Sontag-González, M., Li, B., Brink, F., Jones, B. G., et al. (2021). Composite Grains from Volcanic Terranes: Internal Dose Rates of Supposed 'potassium-Rich' Feldspar Grains Used for Optical Dating at Liang Bua, Indonesia. Quat. Geochronol. 64, 101182. doi:10.1016/j.quageo.2021.101182
Pickarski, N., Kwiecien, O., Djamali, M., and Litt, T. (2015). Vegetation and Environmental Changes During the Last Interglacial in Eastern Anatolia (Turkey): A New High-Resolution Pollen Record from Lake Van. Palaeogeogr. Palaeoclimatol. Palaeoecol. 435, 145–158. doi:10.1016/j.palaeo.2015.06.015
Prescott, J. R., and Hutton, J. T. (1994). Cosmic Ray Contributions to Dose Rates for Luminescence and ESR Dating: Large Depths and Long-Term Time Variations. Radiat. Measurements 23, 497–500. doi:10.1016/1350-4487(94)90086-8
Rasmussen, S. O., Bigler, M., Blockley, S. P., Blunier, T., Buchardt, S. L., Clausen, H. B., et al. (2014). A Stratigraphic Framework for Abrupt Climatic Changes During the Last Glacial Period Based on Three Synchronized Greenland Ice-Core Records: Refining and Extending the INTIMATE Event Stratigraphy. Quat. Sci. Rev. 106, 14–28. doi:10.1016/j.quascirev.2014.09.007
Rees-Jones, J. (1995). Optical Dating of Young Sediments Using Finegrain Quartz. Ancient TL 13, 9–14.
Reimann, T., Román-Sánchez, A., Vanwalleghem, T., and Wallinga, J. (2017). Getting a Grip on Soil Reworking - Single-Grain Feldspar Luminescence as a Novel Tool to Quantify Soil Reworking Rates. Quat. Geochronol. 42, 1–14. doi:10.1016/j.quageo.2017.07.002
Reimann, T., and Tsukamoto, S. (2012). Dating the Recent Past. Quat. Geochronol. 10, 180–187. doi:10.1016/j.quageo.2012.04.011
Richter, C., Wolf, D., Walther, F., Meng, S., Sahakyan, L., Hovakimyan, H., et al. (2020). New Insights into Southern Caucasian Glacial-Interglacial Climate Conditions Inferred from Quaternary Gastropod Fauna. J. Quat. Sci. 35, 634–649. doi:10.1002/jqs.3204
Rousseau, D.-D., Antoine, P., Boers, N., Lagroix, F., Ghil, M., Lomax, J., et al. (2020). Dansgaard-Oeschger-like Events of the Penultimate Climate Cycle: The Loess point of View. Clim. Past 16, 713–727. doi:10.5194/cp-16-713-2020
Rowe, P. J., Mason, J. E., Andrews, J. E., Marca, A. D., Thomas, L., van Calsteren, P., et al. (2012). Speleothem Isotopic Evidence of Winter Rainfall Variability in Northeast Turkey Between 77 and 6 Ka. Quat. Sci. Rev. 45, 60–72. doi:10.1016/j.quascirev.2012.04.013
Sherriff, J. E., Wilkinson, K. N., Adler, D. S., Arakelyan, D., Beverly, E. J., Blockley, S. P. E., et al. (2019). Pleistocene Volcanism and the Geomorphological Record of the Hrazdan Valley, Central Armenia: Linking Landscape Dynamics and the Palaeolithic Record. Quat. Sci. Rev. 226, 105994. doi:10.1016/j.quascirev.2019.105994
Spooner, N. A. (1994). The Anomalous Fading of Infrared-Stimulated Luminescence from Feldspars. Radiat. Measurements 23, 625–632. doi:10.1016/1350-4487(94)90111-2
Stockhecke, M., Sturm, M., Brunner, I., Schmincke, H. U., Sumita, M., Kipfer, R., et al. (2014). Sedimentary Evolution and Environmental History of L Ake V an ( T Urkey) over the Past 600 000 Years. Sedimentology 61, 1830–1861. doi:10.1111/sed.12118
Sumita, M., and Schmincke, H.-U. (2013). Impact of Volcanism on the Evolution of Lake Van II: Temporal Evolution of Explosive Volcanism of Nemrut Volcano (Eastern Anatolia) During the Past Ca. 0.4Ma. J. Volcanology Geothermal Res. 253, 15–34. doi:10.1016/j.jvolgeores.2012.12.009
Thiel, C., Buylaert, J.-P., Murray, A., Terhorst, B., Hofer, I., Tsukamoto, S., et al. (2011). Luminescence Dating of the Stratzing Loess Profile (Austria) - Testing the Potential of an Elevated Temperature post-IR IRSL Protocol. Quat. Int. 234, 23–31. doi:10.1016/j.quaint.2010.05.018
Thomsen, K. J., Murray, A. S., Jain, M., and Bøtter-Jensen, L. (2008). Laboratory Fading Rates of Various Luminescence Signals from Feldspar-Rich Sediment Extracts. Radiat. Measurements 43, 1474–1486. doi:10.1016/j.radmeas.2008.06.002
Timar-Gabor, A., Constantin, D., Buylaert, J. P., Jain, M., Murray, A. S., and Wintle, A. G. (2015b). Fundamental Investigations of Natural and Laboratory Generated SAR Dose Response Curves for Quartz OSL in the High Dose Range. Radiat. Measurements 81, 150–156. doi:10.1016/j.radmeas.2015.01.013
Timar-Gabor, A., Constantin, D., Marković, S. B., and Jain, M. (2015a). Extending the Area of Investigation of Fine Versus Coarse Quartz Optical Ages from the Lower Danube to the Carpathian Basin. Quat. Int. 388, 168–176. doi:10.1016/j.quaint.2014.09.065
Timar-Gabor, A., Vandenberghe, D. A. G., Vasiliniuc, S., Panaoitu, C. E., Panaiotu, C. G., Dimofte, D., et al. (2011). Optical Dating of Romanian Loess: A Comparison Between Silt-sized and Sand-Sized Quartz. Quat. Int. 240, 62–70. doi:10.1016/j.quaint.2010.10.007
Timar-Gabor, A., and Wintle, A. G. (2013). On Natural and Laboratory Generated Dose Response Curves for Quartz of Different Grain Sizes from Romanian Loess. Quat. Geochronol. 18, 34–40. doi:10.1016/j.quageo.2013.08.001
Trigui, Y., Wolf, D., Sahakyan, L., Hovakimyan, H., Sahakyan, K., Zech, R., et al. (2019). First Calibration and Application of Leaf Wax N-Alkane Biomarkers in Loess-Paleosol Sequences and Modern Plants and Soils in Armenia. Geosciences 9 (6), 263. doi:10.3390/geosciences9060263
Újvári, G., Varga, A., Ramos, F. C., Kovács, J., Németh, T., and Stevens, T. (2012). Evaluating the Use of Clay Mineralogy, Sr-Nd Isotopes and Zircon U-Pb Ages in Tracking Dust Provenance: An Example from Loess of the Carpathian Basin. Chem. Geology. 304-305, 83–96. doi:10.1016/j.chemgeo.2012.02.007
Újvári, G., Varga, A., Raucsik, B., and Kovács, J. (2014). The Paks Loess-Paleosol Sequence: A Record of Chemical Weathering and Provenance for the Last 800ka in the Mid-carpathian Basin. Quat. Int. 319, 22–37. doi:10.1016/j.quaint.2012.04.004
Wintle, A. G. (1973). Anomalous Fading of Thermo-Luminescence in Mineral Samples. Nature 245, 143–144. doi:10.1038/245143a0
Wolf, D., Baumgart, P., Meszner, S., Fülling, A., Haubold, F., Sahakyan, L., et al. (2016). Loess in Armenia - Stratigraphic Findings and Palaeoenvironmental Indications. Proc. Geologists' Assoc. 127, 29–39. doi:10.1016/j.pgeola.2016.02.002
Wolf, D., Kolb, T., Alcaraz-Castaño, M., Heinrich, S., Baumgart, P., Calvo, R., et al. (2018). Climate Deteriorations and Neanderthal Demise in Interior Iberia. Sci. Rep. 8, 7048. doi:10.1038/s41598-018-25343-6
Wolf, D., Kolb, T., Ryborz, K., Heinrich, S., Schäfer, I., Calvo, R., et al. (2021). Evidence for Strong Relations Between the Upper Tagus Loess Formation (Central Iberia) and the Marine Atmosphere off the Iberian Margin During the Last Glacial Period. Quat. Res. 101, 84–113. doi:10.1017/qua.2020.119
Yi, S., Buylaert, J.-P., Murray, A. S., Lu, H., Thiel, C., and Zeng, L. (2016). A Detailed Post-IR IRSL Dating Study of the Niuyangzigou Loess Site in Northeastern China. Boreas 45, 644–657. doi:10.1111/bor.12185
Keywords: loess, post-IR-IRSL, quartz, fine grain dating, Armenia, luminescence dating, palaeoenvironment, tephra
Citation: Lomax J, Wolf D, Wolpert UT, Sahakyan L, Hovakimyan H, Faust D and Fuchs M (2021) Establishing a Luminescence-Based Chronostratigraphy for the Last Glacial-Interglacial Cycle of the Loess-Palaeosol Sequence Achajur (Armenia). Front. Earth Sci. 9:755084. doi: 10.3389/feart.2021.755084
Received: 07 August 2021; Accepted: 08 November 2021;
Published: 07 December 2021.
Edited by:
Zhiwei Xu, Nanjing University, ChinaReviewed by:
Shuangwen Yi, Nanjing University, ChinaCopyright © 2021 Lomax, Wolf, Wolpert, Sahakyan, Hovakimyan, Faust and Fuchs. This is an open-access article distributed under the terms of the Creative Commons Attribution License (CC BY). The use, distribution or reproduction in other forums is permitted, provided the original author(s) and the copyright owner(s) are credited and that the original publication in this journal is cited, in accordance with accepted academic practice. No use, distribution or reproduction is permitted which does not comply with these terms.
*Correspondence: Johanna Lomax, am9oYW5uYS5sb21heEBnZW9nci51bmktZ2llc3Nlbi5kZQ==
Disclaimer: All claims expressed in this article are solely those of the authors and do not necessarily represent those of their affiliated organizations, or those of the publisher, the editors and the reviewers. Any product that may be evaluated in this article or claim that may be made by its manufacturer is not guaranteed or endorsed by the publisher.
Research integrity at Frontiers
Learn more about the work of our research integrity team to safeguard the quality of each article we publish.