 Xu Li
Xu Li Jingong Cai
 Bo Gao1
- 1State Key Laboratory of Shale Oil and Gas Enrichment Mechanisms and Effective Development, SINOPEC, Beijing, China
- 2State Key Laboratory of Marine Geology, Tongji University, Shanghai, China
Fluid flow is critical for the efficient exploitation of shale resources and can be split into two stages: the flow in the artificial fractures and, more importantly, the flow from shale formations to the artificial fractures. In this study, X-ray diffraction, N2 adsorption, mercury intrusion, and ethylene glycol monoethyl ether adsorption were conducted on the shales collected from Es3middle, Es3lower, and Es4upper sub-members in the Dongying Sag to reveal the potential effects of the characteristics and properties of pores and surfaces on the fluid flow in shale formations. The results are indicated as follows: 1) The shales from Es3middle and Es3lower contain more I/S and detrital minerals but less illite and carbonate minerals than those of Es4upper. 2) The shales from Es3middle and Es3lower are mainly composed of smaller pores present in larger surface areas and lead to the steeper slope between the BrunauerEmmettTeller specific surface area (BET-SSA) and pore volumes. 3) Clay minerals mainly contribute to pore development, and carbonate minerals inhibit pore development. All kinds of surface areas (especially the inner surface area) are sourced by clay minerals, while I/S and illite present opposite effects. 4) Pore size and surface properties affect significantly the fluid flow in shale formations. The shales from Es4upper are the favorable interval for shale oil accumulation and flow, especially for the shales with depth ranges of 3360∼3410 m, which possess high carbonates, illite and total organic carbon content, low clay mineral content, large pore volume, high large pore content, and small surface areas. Additionally, fluid composition needs to be paid more concern in the future.
Introduction
Hydraulic fracturing is one of the most important technologies for the successful exploitation of unconventional oil and gas resources with ultra-low porosity and permeability, especially for shale resources (Osiptsov, 2017; Wang and Sheng, 2017; Lu et al., 2018; Aadnøy and Looyeh, 2019; Yang and Guo, 2019; Lu et al., 2020; Shi et al., 2020; Xie et al., 2020; Wang et al., 2022). One of the key concerns of the exploitation of shale resources is the evaluation of the production performance after fracturing (Jarvie et al., 2007; Wang and Gale, 2009; Jin et al., 2014; Tang et al., 2019; Wei et al., 2020). Previous studies have observed that the fracturing fluids interact significantly with minerals and change their properties such as wettability, morphology, composition, water-bearing properties, and cation exchange capacity (CEC) (Chen et al., 2016; Chen et al., 2018a; Chen et al., 2018b; Lu et al., 2018; Sari et al., 2019; Zeng et al., 2019), leading to problems such as low flowback recovery of fracturing fluids, environment hazard, hydration, expansion, and rheology of clay minerals (O'Brien and Chenevert, 1973; Makhanov et al., 2014; Al-Ameri et al., 2018; Sui et al., 2018; Aadnøy and Looyeh, 2019; Zeng et al., 2019) and will impact seriously on the production progress. Therefore, to better understand the mechanisms of these problems and their potential effect on production performance, a detailed analysis of the characteristics of shale pores and surface structures and their potential interactions with the fracturing fluids and the confined fluids in shale formations is of great significance.
The fluid flow after hydraulic fracturing in the shales can be divided into two stages: the flow from shale formations to the fractures and the flow in the fractures. Because the ultimate and the most important purpose of hydraulic fracturing is to release oil and gas occluded in pores or adsorbed on surfaces as much as possible, the former stage is more important and is affected more significantly by pore and surface attributes. The international union of pure and applied chemistry (IUPAC) classified the pores into micropore (<2 nm), mesopore (2∼50 nm), and macropore (>50 nm) according to the pore size, adsorption properties, and capillary condensation (Sing, 1985). Shale presents pores with a wide diameter range, and the capillary pressure that relates closely to fluid flow differs according to the pore size if the properties of pore walls are the same. More importantly, the fluid flow in nanopores and the space close to surfaces do not follow Darcy’s law because of the strong interactions between fluids and pore walls (Zeng et al., 2011; Wang et al., 2015; Wang Z. et al., 2016; Wang and Sheng, 2017; Yu et al., 2017; Song et al., 2018; Cheng et al., 2019). Pore walls are constructed by minerals or organic matter (OM) that presents significant divergences in their physical and chemical properties. Differences in the origin of the pores result in the differences in the morphology, size, and attributes of pore walls (surfaces). For example, the pores formed by plate-like clay minerals tend to be slit-like (Curtis et al., 2012; Kuila and Prasad, 2013; Mathia et al., 2016); micropores and small mesopores are mainly related to clay minerals and organic matter (Chalmers and Bustin, 2008; Klaver et al., 2012; Zhang et al., 2012; Kuila and Prasad, 2013; Kuila et al., 2014). Therefore, the distribution of confined fluids differs greatly according to the shale pore structure and surface properties, which are closely related to the shale mineral composition and burial evolution. For example, nanopores with higher elastic buckling pressure increase with increasing depth (Curtis et al., 2012; Kuila and Prasad, 2013); mineral composition changes significantly due to diagenesis including illitization, dolomitization, recrystallization (Li W. et al., 2016; Wilson et al., 2016a; Mathia et al., 2016; Bai et al., 2018; Cai et al., 2018; Liang et al., 2018; Du et al., 2019; Wang and Guo, 2019), leading to the changes of pore and surface properties (Klaver et al., 2012; Li W. et al., 2016; Wilson et al., 2016b; Wang and Guo, 2019). In summary, shale pores and surfaces are complex, and their characteristics and properties change significantly according to the mineral composition and burial evolution. These complexities control the interactions between pore walls and confined fluids, and they must affect the shale oil mobility and production performance.
To further illustrate the potential impacts of the complexity of the characteristics and properties of pores and surfaces on the fluid flow from shale formation to fractures, the interactions between fluids and pores or surfaces in different fracturing stages were summarized. During the pumping stage, fracturing fluids are pumped into shale formation and forming fractures. Then, fracturing fluids gradually intrude into shale rocks under high fluid pressure. After pumping, the well will be shut. Shut-in is commonly used and is important for the formation of stable fractures and provides time for the water blockage removal (Al-Ameri et al., 2018; Wijaya and Sheng, 2019). During this stage, fracturing fluids imbibe into the formation spontaneously. It is important to note that spontaneous imbibition also happens during the fluid pumping, the flowback, and the long-term production stage (Al-Ameri et al., 2018; Zeng et al., 2019). The strength of the imbibition is greatly affected by the wettability, the pore structure, and the pore connectivity of the rock (Dehghanpour et al., 2012; Xu and Dehghanpour, 2014; Wilson et al., 2016b; Zolfaghari et al., 2016; Sun et al., 2017; Yu et al., 2017; Yang et al., 2018). In addition, the wettability of some surfaces can be changed from oil wetting to water wetting due to imbibition (Chen et al., 2016; Roshan et al., 2016; Chen et al., 2018a; Chen et al., 2018b; Zeng et al., 2019), and the pore structure can also be changed by fracturing fluids and surfactant (Xu and Dehghanpour, 2014; Lu et al., 2019), which will further change the flow characteristics conversely. During the flowback stage, part of the fracturing fluids is adsorbed by the minerals (especially the clay minerals) or trapped into the pores with narrow throat, leading to low flowback recovery of the fracturing fluids (Xu and Dehghanpour, 2014; Al-Ameri et al., 2018; Wijaya and Sheng, 2019). Meanwhile, the chemical properties of the flowback fluids change obviously due to the mass exchange between the fracturing fluids and the pore fluids or the mineral components (Haluszczak et al., 2013; Engle and Rowan, 2014; Zolfaghari et al., 2016). Additionally, the strength of the impacts differs according to mineral types because of the divergences in their physical and chemical properties (Zolfaghari et al., 2016). For example, smectite and I/S impact more on the flowback water chemical properties than illite (Zolfaghari et al., 2016). In summary, characteristics and properties of pores and surfaces will impact the absolute permeability of shale and, more importantly, the relative permeability of oil. Thus, the analysis of the characteristics and properties of shale pores and surfaces is important for the evaluation of shale oil potential, but they are seldomly considered previously.
In this study, shale samples with different mineral compositions and degrees of evolution were collected from different shale formations in the Dongying Sag, Jiyang Depression. The complete shale pore’s size distribution and surfaces with different properties were analyzed by N2 adsorption, mercury intrusion porosimetry, and EGME adsorption methods. Then, the mineral composition, pore, and surface characteristics and properties were compared among the shales at different intervals. Based on all these detections and comparisons, the fluids flow from shale formation to the hydraulic fractures was evaluated, and the favorable interval for shale oil storage and flow was obtained on the profile from the perspective of potential fluid flow properties. This study can benefit the selection of fracturing fluids, the implementation of fracturing, and the accurate evaluation of shale oil production performance.
Materials and Methods
Materials
The Dongying Sag locates in the southeastern of Bohai Bay Basin, northern China. Previous exploration has confirmed the great shale oil potential in the third and fourth members of Shahejie Formation (Li Z. et al., 2016; Li et al., 2020). In order to characterize the influence of pore structure on the fracturing of the shales with different compositions, thirty-four argillaceous source rocks were selected for detection, which were taken from well NY1, N38, and N872 at depths of 3000∼3500 m in the middle and lower section of the third member (Es3middle and Es3lower) and upper section of the fourth member (Es4upper) of Shahejie Formation (Figure 1; Table 1) in the Dongying Sag. All the bulk samples were detected by X-ray diffraction (XRD), Rock-Eval VI pyrolysis, N2 adsorption, mercury injection porosimetry (MIP), and ethylene glycol monoethyl ether (EGME) adsorption methods. The clay fraction of each sample was detected by XRD to obtain the clay mineral composition. For the separation of the clay-sized fractions, the bulk rocks were ground to less than 1 mm and were then soaked in deionized water within a 2000-ml beaker at room temperature via natural sedimentation.
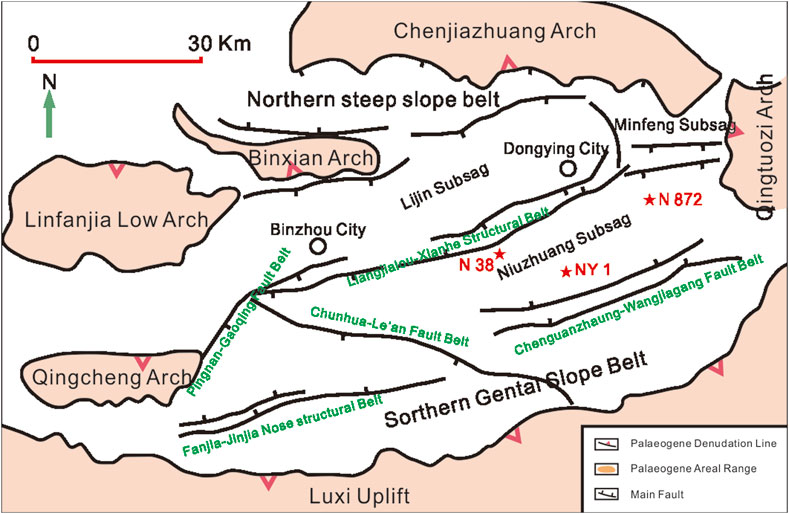
FIGURE 1. Structural map and sampling well locations of the Dongying Sag (modified from Li et al., 2020).
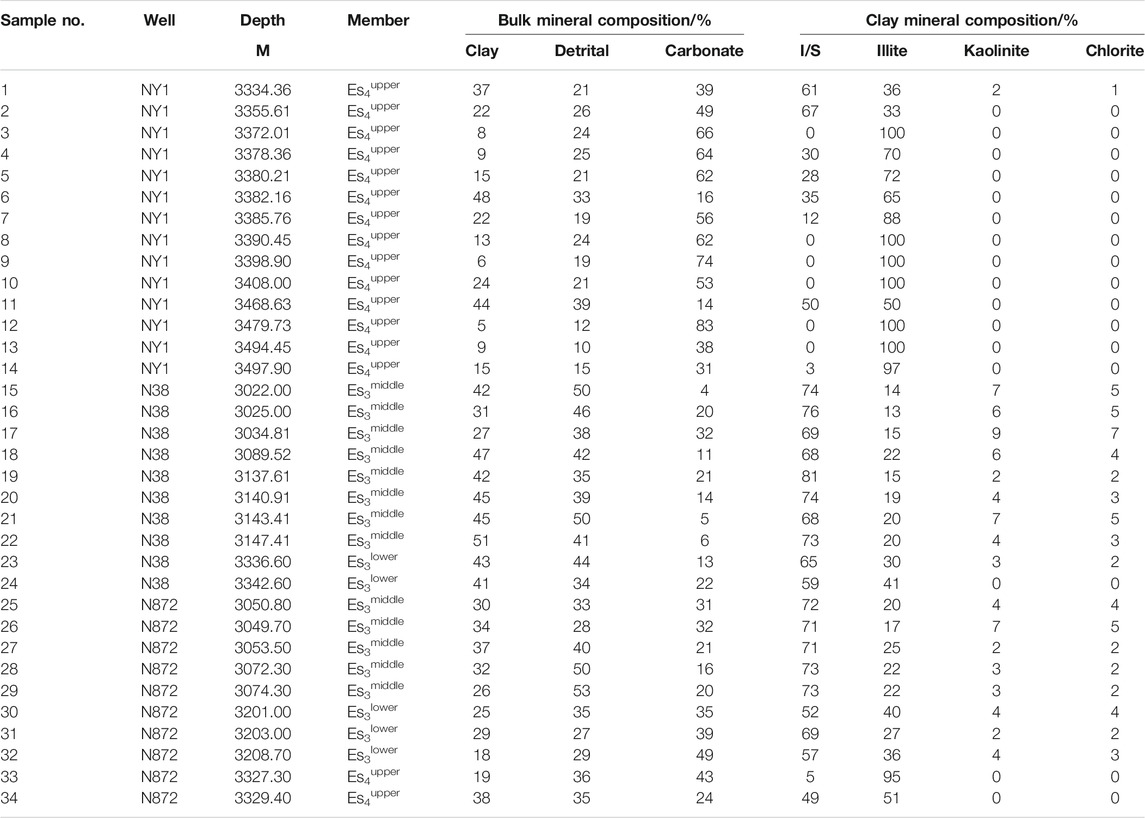
TABLE 1. Sample information and mineral composition.
Methods
X-Ray Diffraction (XRD)
An X’pert-MPD diffraction instrument (Philips Corp) was employed for XRD measurements. The samples were crushed to a particle size of 320 mesh. The test conditions include a copper butt, pipe pressure of 30 kV, conduit flow of 40 mA, and scanning speed of 2° (2θ)/min. The bulk mineral composition was detected by a natural thin section of bulk rock. The clay mineral composition detection was conducted on natural ethylene glycol saturated and 550 C heated orientation sheet of clay fractions. The ethylene glycol-saturated orientation sheet was made by exposing the naturally oriented sheet in ethylene glycol vapor at 60°C for 8 h, and 550°C heated orientation sheet was made by heating at 550°C for 2 h.
Pore Characteristics Determination
N2 Adsorption
Pore size distribution (PSD) of pores with diameters ranging from approximately 1–50 nm was conducted with the low-temperature (77 K) N2 adsorption methods on the JW-BK adsorption instrument (Beijing JWGB SCI & Tech Corp). Approximately 2∼4 g of sample was crushed to a particle size smaller than 3 mm and degassed by heating at 80°C for more than 6 h under vacuum (10 μm Hg) to remove adsorbed moisture and volatile matter prior to the analysis. Measurements in adsorption mode were performed over the relative pressure (P/P0) range of 0.1 ∼ 0.95 to obtain the adsorption isotherm. The PSD was obtained by inverting the adsorption branch of the isotherm using BarrettJoynerHalenda (BJH) method (Barrett et al., 1951).
Mercury Intrusion Porosimetry
The PSD of pores with diameters ranging from approximately 3.2 nm–40 μm was determined using the mercury intrusion method on a Micromeritics Autopore IV 9500 series apparatus. Samples (2∼4 g) were crushed to a particle size smaller than 3 mm and were oven-dried (80°C) and evacuated under vacuum (30 μm Hg) for 30 min prior to mercury intrusion. The measured pressure ranged from 0.5 to 60,000 psia, and the PSD was calculated by the Washburn equation (Schmitt et al., 2013). In our calculations, the interfacial tension of Hg was 485 mN/m, the wetting angle was 140°, and the density of Hg was 13.5335 g/ml.
Combination of N2 Adsorption and MIP and Calculation of Pore Characteristics Parameters
Previous researchers have established several methods to combine N2 adsorption method and MIP for obtaining the complete PSD of shales (Spitzer et al., 1976; Echeverria et al., 1999; Schmitt et al., 2013; Kenvin et al., 2015). In this study, we obtained the complete PSD referring to the method proposed by Schmitt et al. (2013) and Li et al. (2020). The junction point of each sample is listed in Table 2. After achieving the complete PSD, the total pore volume (Vt) was calculated.
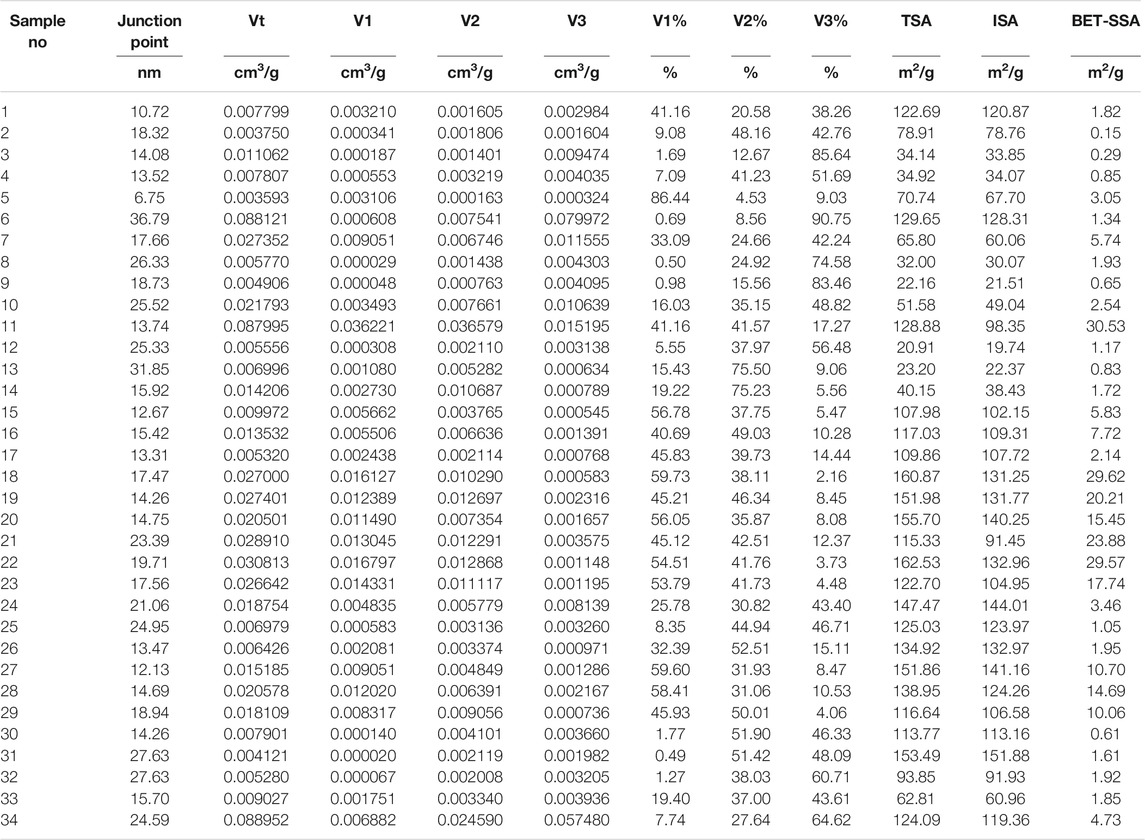
TABLE 2. Junction points, pore volumes and contents, surface areas.
Surface Areas Measurement
N2 Adsorption
The determination procedure is the same as the Surface Areas Measurement section. After obtaining the adsorption isotherms, the outer surface area (BET-SSA) for each sample was determined by inversion of the adsorption branch of the isotherm using the BrunauerEmmettTeller (BET) analysis procedure (Brunauer et al., 1938), with a relative pressure range of 0.05 ∼ 0.3. The molecular sectional area of N2 was 0.162 nm2.
EGME Adsorption
For the EGME procedure, a vacuum pump (with a vacuum pressure of 609 mmHg) and an electronic analytical balance (with an accuracy of 0.0001 g) were employed. Approximately 1 g of sample was weighed and put in the oven at 80°C for more than 6 h. Then, the sample was taken out and put in the aluminum tare (with a diameter of 5 cm and a height of 8 mm), and 3 ml EGME solution (analytical grade) was quickly added to the sample with a pipette and swirled gently until the sample was soaked. Afterward, the aluminum tares with mixture were placed in a sealed desiccator with EGME solution, calcium chloride (CaCl2), and phosphorus pentoxide (P2O5). The desiccator was evacuated for approximately 1 hour to remove water vapor. More than 8 h later, the tares were weighed after the desiccator was evacuated again. The process of evacuation was repeated, and they were weighed until a constant weight was attained (the mass difference between the two measurements was less than 0.001 g). Finally, the total surface area (TSA) of the sample was calculated based on the absorbed quantity of EGME molecules (the conversion factor is 2.86 × 10⁻⁴ g/m2), and the inner surface area (ISA) was the differences between TSA and BET-SSA.
Results
Mineral Composition
Bulk Mineral Composition
It is found from the XRD curves of typical bulk rocks (Figure 2A) that although clay, quartz, calcite are the main mineral types of all the shales, the relative contents of different types of minerals vary greatly among the shales from different sections. For example, the shales from Es4upper contain more dolomite, especially for the deeper burial samples. Comparison of bulk mineral composition of the shales from different sections (Figure 2B) shows that the shales from Es3middle contain the most amount of clay (37.62%) and detrital (41.92%) minerals and the least amount of carbonate (17.92%) minerals; the shales from Es4upper are composed of much more calcite (31.94%) and dolomite (15.31%) than those of Es3middle and Es3lower; the shales from Es3lower contain moderate content of almost all types of minerals.
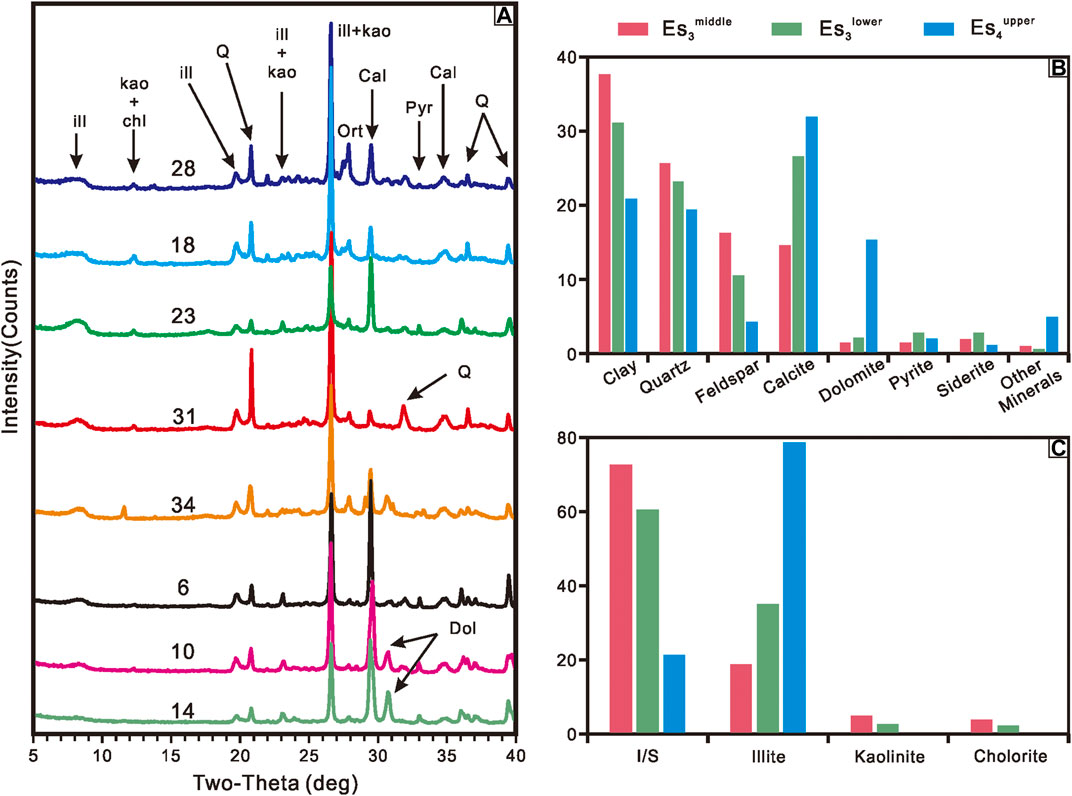
FIGURE 2. Mineral compositions of the shales from different sections. (A) XRD curves of typical samples from Es3middle (28, 18), Es3lower (23, 31), and Es4upper (24, 6, 10, 14). The burial depths of the samples from each member increase from top to bottom. (B) Bulk mineral composition. (C) Clay mineral composition.
Clay Mineral Composition
From the analysis of the composition of clay minerals (Table 1; Figure 2C), the average contents of mixed-layer illite/smectite (I/S) (46.62%) and illite (49.26%) of all the shales were found to be high, while there are also great differences among the shales from different sections. The shales from Es3middle contain the most amount of I/S (72.54%) and the least amount of illite (18.77%); the shales from Es4upper are composed of much more illite (78.56%) than those of Es3middle and Es3lower; the shales from Es3lower contain moderate content of I/S (60.40%) and illite (34.80%).
Pore and Surface Characteristics
Surface Characteristics
From the results of the N2 adsorption measurement (Tables 2; Figure 3A), the shales from Es3middle have the largest average BET-SSA (13.30 m2/g), which ranges from 1.05 to 29.62 m2/g; the BET-SSA of the shales from Es3lower ranges from 0.61 to 17.74 m2/g with an average of 5.07 m2/g; the shales from Es4upper possess BET-SSA ranges from 0.15 to 30.53 m2/g, with 3.70 m2/g on average. According to the EGME measurement (Table 2; Figure 3C), the shales from Es3middle possess the largest average TSA (134.51 m2/g), which ranges from 107.98 to 162.53 m2/g; the TSA of the shales from Es3lower ranges from 93.85 to 153.49 m2/g with an average of 126.26 m2/g; the shales from Es4upper present minimal TSA ranges from 20.91 to 129.65 m2/g, with 65.17 m2/g on average. Based on N2 adsorption and EGME measurements (Table 2; Figure 3B), the ISA can be calculated. The results show that the shales from Es3middle and Es3lower also present larger ISA (with 121.21 m2/g and 121.19 m2/g on average, respectively), while the shales from Es4upper have much smaller ISA (61.47 m2/g).
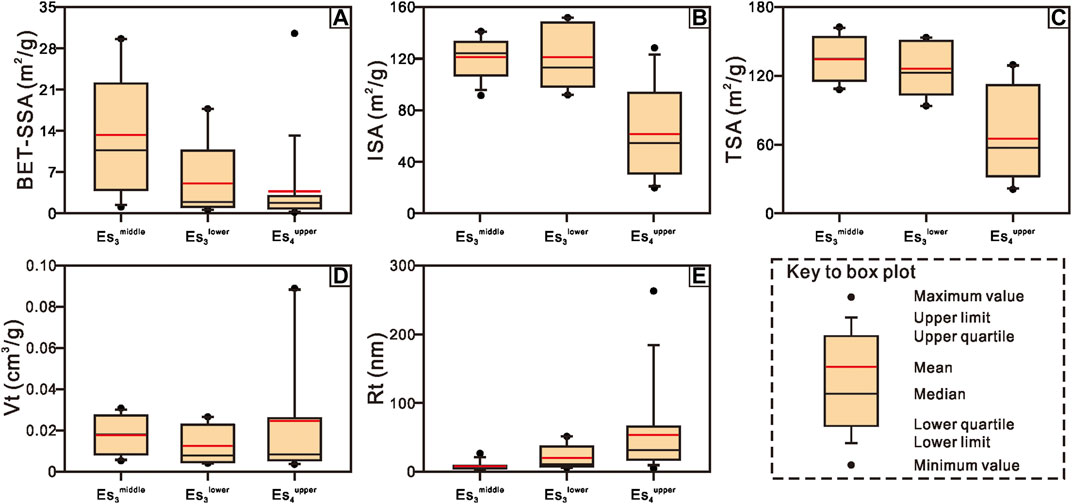
FIGURE 3. Box plot of the outer surface area [BET-SSA, (A)], inner surface area [ISA, (B)], total surface area [TSA, (C)], total pore volume [Vt, (D)], and calculated average pore diameter [Rt = 4 × Vt/(BET-SSA), (E)] of the shales from different sections.
Pore Characteristics
According to the complete pore size distribution (PSD) curves of the shales from different sections (Figure 4), most of the shales are mainly composed of the large mesopore (10∼50 nm) and small macropore (50∼100 nm), while most of the shales from Es4upper contain a significant amount of pores with diameter >100 nm (Figures 4A–D). In addition, the PSD of the shales from different sections shows great differences. Qualitatively, the shales from Es4upper contain more pores with larger diameter than the shales from Es3middle and Es3lower, while the shales from Es3middle present a very low amount of larger pores. Considering the characteristics of the PSD curves, the volumes of the pores with diameter <10 nm (V1), 10∼100 nm (V2), and >100 nm (V3) were further calculated by interpolation (Table 2).
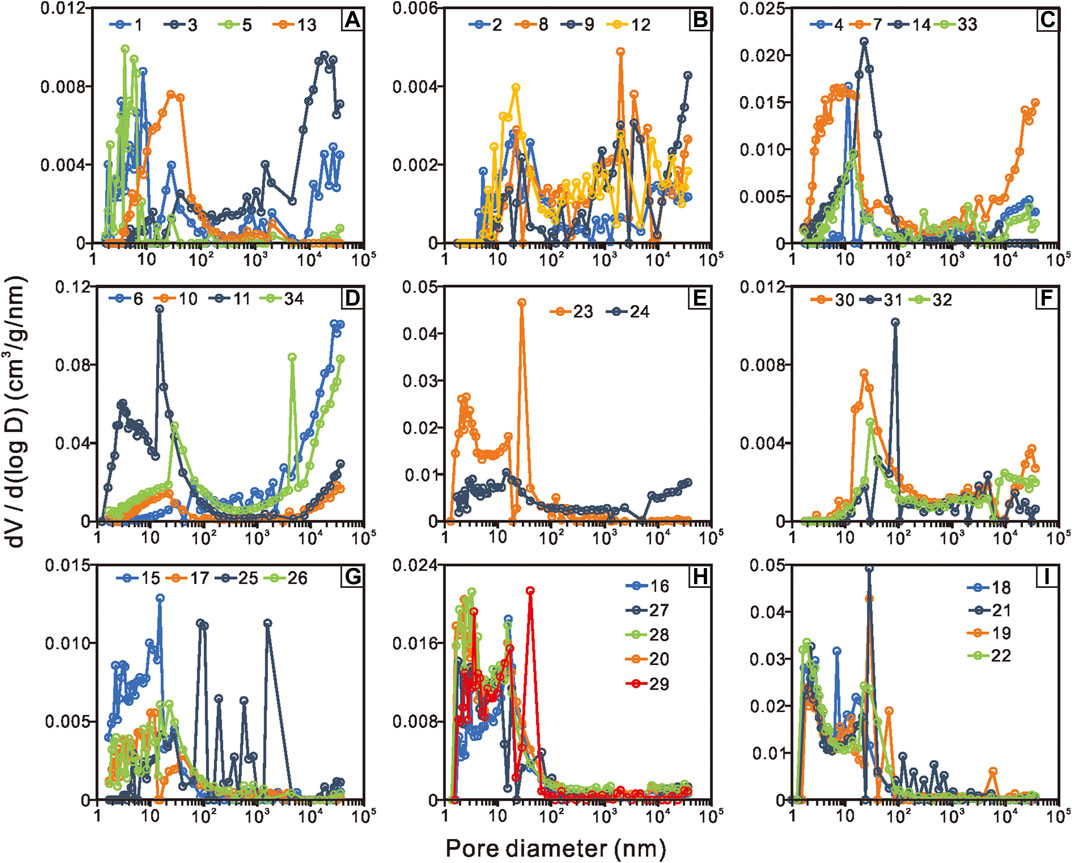
FIGURE 4. Pore size distribution of all the shale samples. (A–D) shales from Es4upper; (E, F) shales from Es3lower; (G–I) shales from Es3middle.
Based on these findings, Vt, V1, V2, and V3 and their relative contents of the shales from different sections were further calculated and compared (Table 2; Figures 3D,E, 5). The Vt of the shales from Es3middle ranges from 0.005320 to 0.030813 cm3/g, with 0.017748 cm3/g on average; the Vt of the shales from Es3lower ranges from 0.004121 to 0.026642 cm3/g, with 0.012539 cm3/g on average; the Vt of the shales from Es4upper ranges from 0.003593 to 0.088952 cm3/g, with an average of 0.024668 cm3/g (Table 2; Figure 3D). Further comparing the pore volumes of the pores with different diameter ranges (Figures 5A–C), it can be found that the shales from Es3middle have the largest V1 (0.008885 cm3/g) and V2 (0.007294 cm3/g) and minimal V3 (0.001569 cm3/g); the shales from Es3lower possess minimal V1 (0.003879 cm3/g) and V2 (0.005025 cm3/g) and moderate V3 (0.003636 cm3/g), while the shales from Es4upper have maximal V3 (0.013135 cm3/g) and moderate V1 (0.004350 cm3/g) and V2 (0.007183 cm3/g). Viewing from the contents of V1, V2, and V3 (Figures 5D–F), the shales from Es3middle contain the most amount of V1 (46.81%) and the least amount of V3 (11.53%), the shales from Es3lower possess minimal V1 (16.62%) and maximal V2 (42.78%), the shales from Es4upper present maximal V3 (47.74%) and minimal V2 (33.18%).
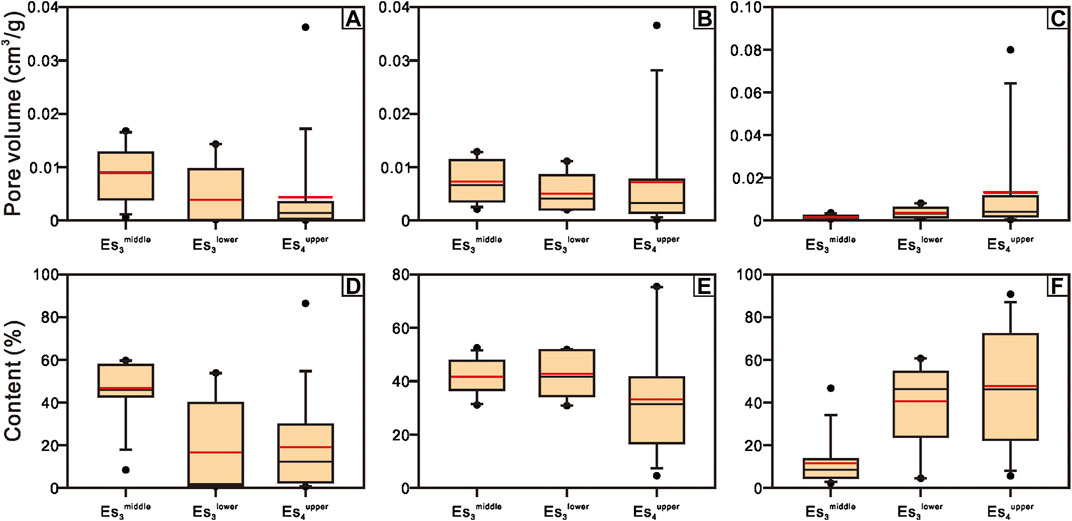
FIGURE 5. Box plot of the pore volumes and contents of the pores with diameter <10 nm (A, D), between 10–100 nm (B, E) and >100 nm (C, F) of the shales from different sections, respectively.
Discussions
Relationships Between Pores and Surfaces
Pores and outer surfaces are the places where shale oil occurs. Their relationships depend on the relative contribution of free oil and adsorbed oil. Therefore, the relationships between pore volumes and the BET-SSA were analyzed firstly. It can be found that Vt of the shales from Es3middle and Es3lower presents a better relationship with BET-SSA (especially for Es3middle) than that of Es4upper (Figure 6A). Viewing from the pores with different diameter ranges (Figures 6B,C), the correlation coefficients of the relationships between V1 of the shales from each section with BET-SSA are high (>0.95), while the correlation coefficients of the relationships between V2 of the shales from each section are smaller, especially for the shales from Es4upper; there are no relationships between V3 and BET-SSA (the data were not shown in Figure 6). These observations coincide well with previous researches; that is, the pores with small size contribute primarily to the outer surface area, while the pores with larger size mainly contribute to the pore volume (Beliveau, 1993; Chalmers et al., 2012; Curtis et al., 2012; Wang and Guo, 2019). Further comparison of the shales from different sections suggests that (Figure 6) the slopes of the shales from Es3middle and Es3lower are steeper than those of Es4upper, especially for V2 and Vt, indicating the differences in their pore size and in the ratio between pore volume and outer surface area. It has been confirmed previously that pores with different sizes have different ratios between pore volume and outer surface area, leading to the difference in the proportion of oil with different occurrence states (Chalmers et al., 2012; Curtis et al., 2012; Wang and Guo, 2019). MDSs and spontaneous imbibition experiments also showed that the intensity of the interfacial interaction of the pores with different pore volume/surface area ratios (or pore diameter) differs significantly (Xu and Dehghanpour, 2014; Yu et al., 2017). The pores with smaller pore volume and larger surface area possess stronger interfacial interaction intensity and larger capillary force, leading to larger adsorption potential to wetting phase fluids and stronger inhibition to non-wetting phase fluids (Wang et al., 2015; Wang S. et al., 2016; Yu et al., 2017; Zeng et al., 2019). Therefore, the shales from Es4upper which present larger pore volume and smaller surface area are more conducive to fluid flow without considering the properties of the pore walls. However, shales are composed of varieties of minerals which present divergence attributes. Thus, to analyze the properties of pore walls and their influence on fluid mobility of the shales from different sections, the relationships between minerals and pores/surfaces were further analyzed.
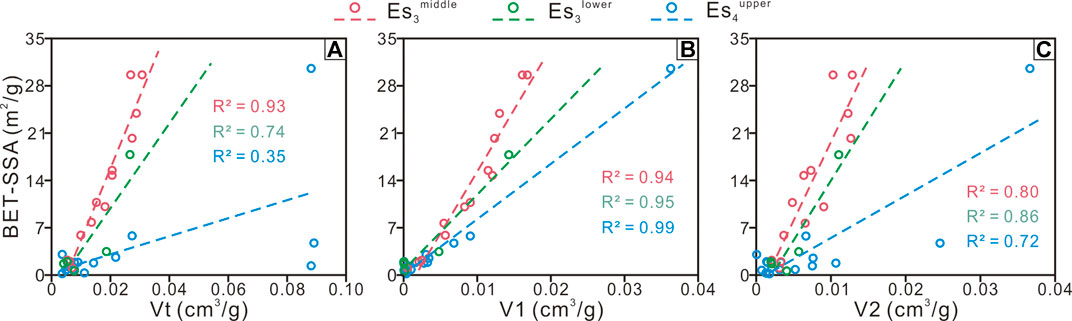
FIGURE 6. (A) relationships between BET-SSA and Vt; (B) relationships between BET-SSA and V1; (C) relationships between BET-SSA and V2.
Contributions of Mineral Components to Pores and Surfaces
Pores
Clay minerals (I/S, illite), detrital minerals (quartz, feldspar), and carbonate minerals (calcite, dolomite) are the main bulk mineral components in shale rocks (Table 1; Figure 2). According to the relationships between bulk mineral compositions with Vt (Figure 7), it is found that Vt positively correlates with clay and detrital mineral content but negatively correlates with carbonate mineral content for the shales from all sections and generally presents a high correlation coefficient. These correlations indicate that inorganic pores are the main pore type of the studied area, while clay and detrital minerals contribute to the shale pores and carbonate minerals generally inhibit the development of pores. These findings are similar to previous studies on the shales from similar locations (Zhang et al., 2016; Zhu et al., 2019; Zhang et al., 2019; Liu et al., 2019). Previous studies have confirmed the chemical instability of carbonate minerals, and they probably destroy or block the pores by digenesis such as dissolution, precipitation, and recrystallization (Chalmers et al., 2012; Gaines et al., 2012; Loucks et al., 2012; Liu et al., 2019). In addition, the correlations between Vt and clay and carbonate mineral are usually better than those of detrital minerals, indicating the stronger control of clay and carbonate minerals in shale pores.
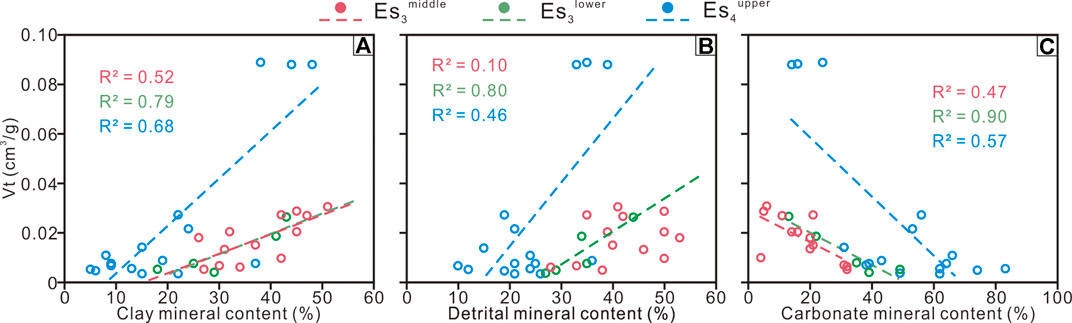
FIGURE 7. (A) relationships between Vt and clay mineral content; (B) relationships between Vt and detrital mineral content; (C) relationships between Vt and carbonate mineral content.
Comparison of the correlations of the shales from different sections shows that the slopes of the shales from Es4upper are much larger than those of the other two sections (Figure 7), suggesting the greater role of mineral components in the development of pores, especially for the relatively larger pores. The conclusion can be certificated by the previous studies indicating that clay minerals mainly relate to micropores and small mesopores while carbonate minerals generally correlate well with pores with larger diameter (Chalmers et al., 2012; Klaver et al., 2012; Kuila and Prasad, 2013; Mathia et al., 2016; Liu et al., 2019; Zhang et al., 2020) and the relatively high carbonate mineral content of the shales from Es4upper. Moreover, based on the relationships between clay mineral content and pore volumes of pores with different diameter range (Figure 8), it can be found that V3 of the shales from Es4upper correlates well with clay mineral content while present no obvious relationships for the shales from Es3middle and Es3lower. On the contrary, the correlation coefficients between V1 and clay mineral contents for the shales from Es3middle and Es3lower are much higher than that of Es4upper (Figure 8). The results indicate that although clay minerals mainly benefit the development of pores, the relative contributions of clay minerals to pores with different diameters for the shales from different sections differ significantly. Previous studies indicated that illitization, dolomitization, and dissolution benefit the shale reservoir properties and create more macropores for oil accumulation and flow (Chalmers et al., 2012; Li W. et al., 2016; Mathia et al., 2016; Bai et al., 2018; Liang et al., 2018; Wang and Guo, 2019). Thus, considering differences in mineral composition of different sections (Figure 2), we attribute these divergences to the clay mineral composition of the shales from different sections. In summary, the shales from Es4upper contain more carbonate minerals and undergone a higher degree of illitization and dolomitization than those of Es3middle and Es3lower, thus leading to more pores with larger diameter (Table 2; Figures 3–5). Therefore, the shales from Es4upper present a higher potential for oil accumulation and flow from shale formations to fractures.
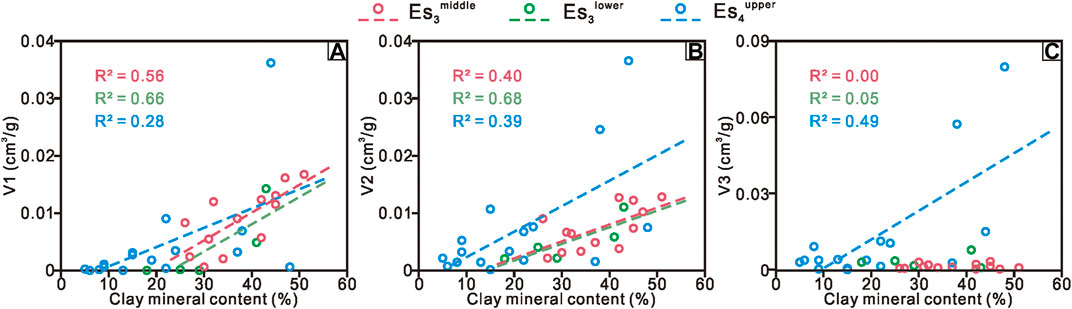
FIGURE 8. (A) relationships between V1 and clay mineral content; (B) relationships between V2 and detrital mineral content; (C) relationships between V3 and carbonate mineral content.
Surfaces
Clay minerals correlate with smaller pores with large correlation coefficients (Figure 8) (Kuila and Prasad, 2013) and possess larger outer surface area than detrital and carbonate minerals (Beliveau, 1993; Chalmers and Bustin, 2008; Chalmers et al., 2012; Kuila and Prasad, 2013; Zhu et al., 2015; Saidian et al., 2016). Additionally, clay minerals such as smectite and I/S have inner surface areas between clay sheets, and ISA is usually one or two orders of magnitude larger than the outer surface area (Macht et al., 2011; Zhu et al., 2015). Thus, we only analyze the contributions of clay minerals to surface areas. Comparison of the clay mineral composition of the shales from different sections (Table 1) indicates that I/S and illite contents of the shales from Es3middle and Es3lower only distribute in a narrow range (≈20∼30%), which is much smaller than that of Es4upper. Therefore, it is more appropriate to put all the shales from different sections together when analyzing the relationships between clay mineral composition and surface areas. The results show that all kinds of surface areas correlate with clay mineral content, in which BET-SSA mainly trend correlates with clay mineral contents, while ISA and TSA present excellent correlations with clay mineral contents (Figures 9A–C). Further comparison of the relationships between surfaces areas and specific clay mineral types indicates that all types of surface areas positively correlate with I/S content while negatively correlate with illite content (Figures 9D–I). Also, BET-SSA only shows trend relations with I/S and illite contents, while ISA and TSA present an excellent correlation with I/S and illite contents. These findings indicate that surfaces are mainly constructed by clay minerals, especially for ISA, while I/S and illite present the opposite effect. Therefore, the lower clay mineral content and higher illite content of the shales from Es4upper lead to its smaller surface areas (Figures 2, 3).
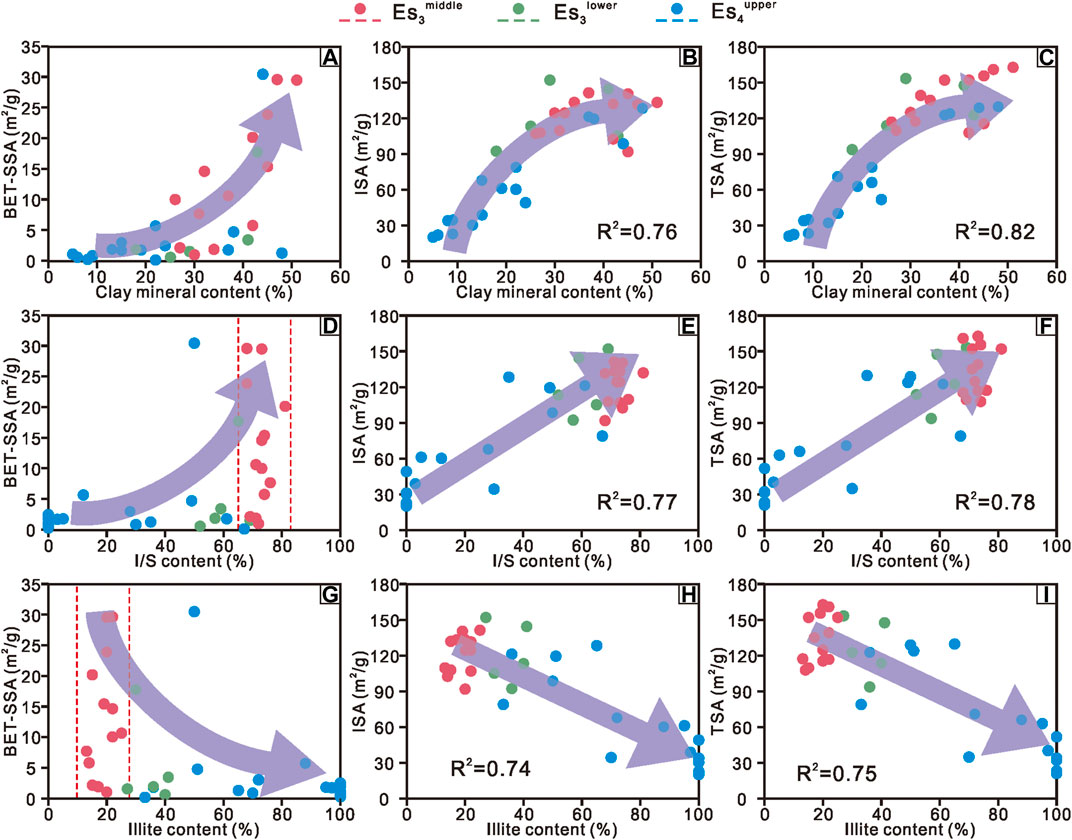
FIGURE 9. Relationships between surface areas and clay mineral contents (A–C), I/S contents (D–F) and illite (G–I) contents of the shales from different sections.
According to Figure 9, the correlation coefficients for BET-SSA are much worse than those of ISA. To understand these differences, it must be noted that the measured surface areas are the surface areas after the release of hydrocarbon or other confined fluid during coring and subsequent sample preservation (Jiang et al., 2016; Li et al., 2020; Wang et al., 2022). It has been demonstrated that free and physically adsorbed hydrocarbons or OM is mainly occurred on the outer surface, and they vaporize much easier and faster than chemically adsorbed hydrocarbons or OM which mainly occur on the inner surface (Jiang et al., 2016; Zhu et al., 2016). Therefore, the outer surface area is affected by hydrocarbons or OM that is confined in the shale pores more remarkably, and leading to relatively poor relationships between BET-SSA and mineral compositions.
To summarize, pores and surfaces are all greatly affected by mineral components, especially clay minerals. Previous studies have indicated that the physical and chemical properties differ significantly according to mineral types and clay minerals are more active. For example, clay minerals mainly correlate with smaller pores; smectite and I/S are easier to hydrate and swell than illite and kaolinite (Zolfaghari et al., 2016; Al-Ameri et al., 2018; Sui et al., 2018), and their higher CEC will lead to stronger impacts on the chemical properties of flowback water (Greenland, 1971; Han et al., 2016; Saidian et al., 2016; Zolfaghari et al., 2016); along with burial evolution, smectite with large ISA will transfer to illite with no ISA by illitization, leading to the decreasing of ISA (Zhu et al., 2015; Wilson et al., 2016b; Singh et al., 2016) and the change of pore structure and BET-SSA (Wu et al., 2015; Wang and Guo, 2019). These differences will result in divergences in the interactions between pore walls and fluids and then affect the fluid flow significantly.
Effects of Pore and Surface Characteristics and Properties on Fluid Flow
Based on the discussions above, a hypothesis model was established to illustrate the effects of the characteristics and properties of pores and surfaces on the fluid flow from shale formation to hydraulic fractures (Figure 10). It has been confirmed that the affinity to fluids of different minerals follows the order: I/S > illite > carbonate minerals ≈ detrital minerals (Zhang et al., 2012; Singh et al., 2016; Zolfaghari et al., 2016; Al-Ameri et al., 2018; Saikia et al., 2018). Therefore, if the pore size and fluid condition are assumed to be the same: for the pores constructed by I/S, more fluids will be adsorbed onto the pore walls, and the mobility pore diameter is much smaller than the real pore diameter (Figure 10A); for the pores related to illite, the thickness and distribution range of residual fluids are smaller than those of the I/S (Figure 10B); for the pores related to carbonate and detrital minerals, the thickness of the residual fluids reduces further and the distribution is localized (Figure 10C).
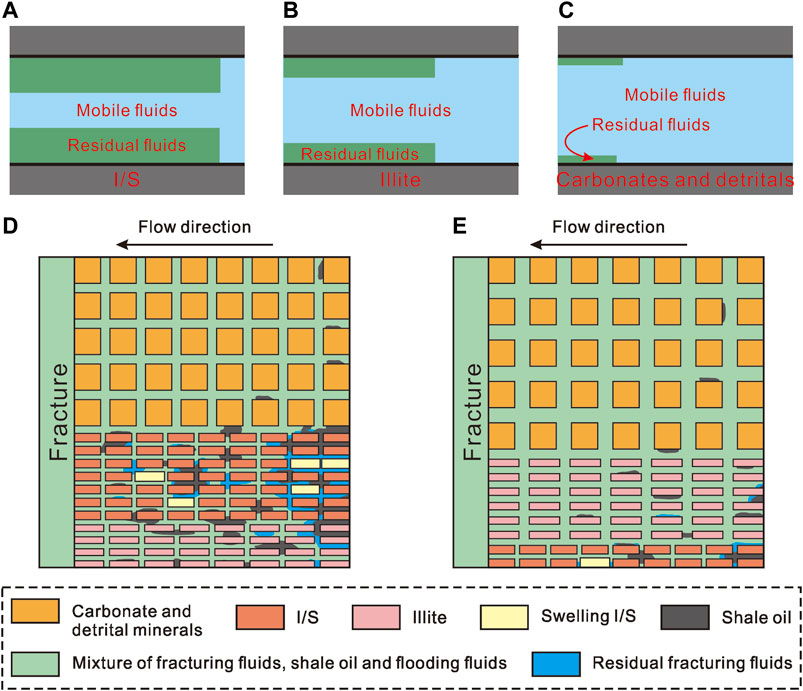
FIGURE 10. Hypothetical model to explain the effects of characteristics and properties of pores and surfaces on the fluid flow from shale formation to fractures. (A–C) Distribution of mobile and residual fluids in the pores with different surface properties. (D) Distribution of fluids after flow from shale formation to fractures for the shales from Es3middle and Es3lower. (E) Distribution of fluids after flow from shale formation to fractures for the shales from Es4upper.
Combined with the features and the differences in the mineral composition and pore and surface characteristics of the shales from different sections (Figures 2–9), the fluid distribution and flow pattern were established to illustrate the differences in the production potential of the shales from different sections (Figures 10D,E). Comparison of the fluid flow characteristics between the same mineral types of the shales from different sections indicates that because the interfacial interaction strength of pores with a smaller diameter is much larger than that of larger pores (Wang S. et al., 2016; Yu et al., 2017), more oil is retained in shale formation (Figures 10D,E) for the shales from Es3middle and Es3lower than that of Es4upper (Figures 4, 5). In addition, fracturing fluids that intruded into the shales may also be trapped more seriously in the shales with smaller pores and leading to more oil blocked in shale formation if the trapped fracturing fluids block the pores or pore throat (Figures 10D,E). Further comparison of the fluid flow characteristics between different mineral types shows that (Figures 10D,E) more oil and intruded fracturing fluids are trapped in shale formations due to the generally smaller pore size of the pores correlate to clay minerals than those of carbonate and detrital minerals (Klaver et al., 2012; Kuila and Prasad, 2013; Malik and Lu, 2015; Li W. et al., 2016; Mathia et al., 2016) and the larger affinity to fluids of clay minerals, especially for I/S (Zhang et al., 2012; Singh et al., 2016; Zolfaghari et al., 2016; Al-Ameri et al., 2018; Saikia et al., 2018). In summary, the fluid flow in shale formation is controlled both by the pore size and by the properties of pore walls (surfaces). Due to the larger Vt, V2, V3, and smaller surface areas, as well as the high carbonate and illite content, the shales from Es4upper possess better production potential (Figures 10D,E).
Significances and Prospects
The breakability of shale is one of the key characteristics that depend on the fracturing and extraction of oil and gas occluded within shale play (Aadnøy and Looyeh, 2019). Brittle mineral content is the main concern when evaluating breakability. Jarvie et al. (2007) viewed quartz as the main brittle mineral in the Barnett Shale and used its relative content for stimulation evaluation (Jarvie et al., 2007). In addition to quartz, Wang and Gale (2009) also regarded dolomite as a brittle mineral (Wang and Gale, 2009). Based on the study of the mechanical properties of minerals, Jin et al. (2014) further classified feldspar, calcite, and mica as brittle minerals (Jin et al., 2014). In summary, it is widely accepted that breakability relates closely to mineral composition. The rocks with relatively high detrital minerals and carbonate minerals and low amount of clay mineral content present better breakability (Aadnøy and Looyeh, 2019). However, to efficiently exploit shale resources, brittle mineral content is not the only concerning factor, characteristics and properties of pores and surfaces should also be paid attention to because of their significant effects on fluid flow in shale formation (Figure 10). On the one hand, pores with different diameters present divergence capillary force and specific surface area, leading to differences in the adsorption potential and flow profile. On the other hand, the physical and chemical properties of minerals and their relationships with pores and surfaces differ significantly according to mineral types, leading to divergences in the interfacial interactions between the pore walls and the confined fluids. These divergences will change the distribution, occlusion, and flow of fracturing fluid and oil. Furthermore, water is the main component in fracturing fluids, and it will interact with clay minerals (especially I/S) significantly during the pumping, flowback, and production stages (O'Brien and Chenevert, 1973; Makhanov et al., 2014; Xu and Dehghanpour, 2014; Sui et al., 2018; Shi et al., 2020) and might lead to the low flowback recovery, the changes of pore and surface properties, and the reduction of oil relative permeability. Therefore, characteristics and properties of pores and surfaces are the indispensable factors that need to be taken into the evaluation of shale oil potential. Take the research area as an instance, based on the burial evolution profile of TOC, pore volume, surface areas, mineral composition, and composition of pores, the deep burial shales from Es4upper are the favorable interval for shale oil accumulation and flow, especially for the shales with depth ranges of 3360∼3410 m (Figure 11), which present high carbonate minerals, illite and TOC content, low clay mineral content, large total pore volume, more pores with a larger diameter and small surface areas.
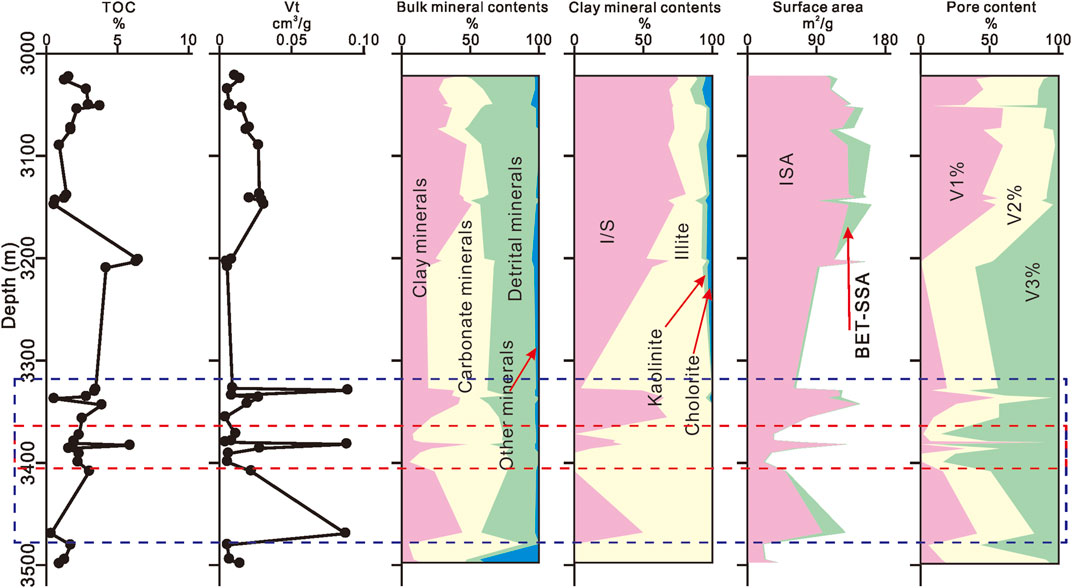
FIGURE 11. Burial evolution of mineral composition, pores, and surfaces.
Remarkable changes of mineral composition and pore structure along with burial evolution are some of the most important characteristics of shale resources. For example, diagenesis such as compaction, recrystallization, and cementation increases the brittleness of rocks and result in the increase of breakability of rocks; diagenesis such as illitization, dissolution, and dolomitization improves reservoir properties by forming more large pores and reducing surface areas (Chalmers et al., 2012; Li W. et al., 2016; Mathia et al., 2016; Zhang et al., 2016; Bai et al., 2018; Liang et al., 2018; Wang and Guo, 2019); I/S that contains interlayer space decreases by illitization and forms illite that without interlayer space (Wilson et al., 2016a; Wilson et al., 2016b; Saidian et al., 2016), thus leading to the decreases in the clay mineral swelling, the retention of fracturing fluids, and the effects on flowback water chemical properties (Zolfaghari et al., 2016; Al-Ameri et al., 2018). Furthermore, the flow properties are greatly affected by the fluid composition due to the divergences in the physical and chemical properties of different components and the interfacial interactions of different components with pore walls (Xu and Dehghanpour, 2014; Wang S. et al., 2016; Chen et al., 2016). Additionally, the fluid composition also changes along with the maturation of OM and the generation of lighter hydrocarbons, leading to the increase of the mobility of shale oil (Wang et al., 2022). Ion is the other chemical additive that is important for the efficient production of shale resources. Previous studies have confirmed that the wettability of mineral surfaces or bulk rocks is significantly affected by brine (Chen et al., 2018a; Chen et al., 2018b; Zeng et al., 2019). In summary, evaluation of the hydraulic fracturing and production performance of shale resources need to consider not only the brittleness of minerals but also the characteristics and properties of pores and surfaces. In addition, diagenesis, shale oil composition, and chemical composition of fracturing and flooding fluids are also important factors that need to be paid more attention in the future.
Conclusion
In this study, shales samples were collected from different sections and were detected by XRD, N2 adsorption, EGME adsorption, and mercury intrusion methods to analyze the characteristics of pores and surfaces and their potential effects on fluid flow from shale formation to hydraulic fractures. The main conclusions were listed as below:
1) The shales from Es3middle and Es3lower contain more clay minerals (especially I/S) and less carbonate minerals than those of Es4upper. Clay minerals mainly contribute to pore development, and carbonate minerals inhibit pore development. More importantly, the contributions of clay minerals to pores with different diameter ranges differ according to sections, and we attribute these divergences to clay mineral composition. All kinds of surface areas are mainly sourced by clay minerals, while I/S correlates positively to surface areas and illite correlates negatively to surfaces areas, especially for ISA.
2) Pores with smaller diameters present larger outer surface area while large pores contribute minor to surface area. The shales from Es3middle and Es3lower are mainly composed of smaller pores, leading to the larger surface areas and steeper slope between pore volume and surface area.
3) Mineral composition, fluid composition, pore structure, and surface properties are the factors that need to be considered for the evaluation of fluid flow in shale formation. The shales with high carbonate and illite content, larger total pore volume, larger pores, and smaller surface areas present better shale oil accumulation and fluid flow conditions. To better evaluate shale oil flow and production potential, fluid compositions of both the fracturing fluids and shale oil need more concern in the future.
Data Availability Statement
The original contributions presented in the study are included in the article/Supplementary Material, and further inquiries can be directed to the corresponding author.
Author Contributions
XL: conceptualization, methodology, investigation, data curation, formal analysis, writing—original draft preparation, writing—review and editing. JC: conceptualization, resources, supervision, project administration, methodology. BG: methodology, data curation, writing—review and editing. SL: resources, funding acquisition. DF: funding acquisition, project administration. ZP: resources. BG: data curation. All authors contributed to the article and approved the submitted version.
Conflict of Interest
XL, BG, SL, DF, and ZP were employed by SINOPEC.
The remaining authors declare that the research was conducted in the absence of any commercial or financial relationships that could be construed as a potential conflict of interest.
Publisher’s Note
All claims expressed in this article are solely those of the authors and do not necessarily represent those of their affiliated organizations, or those of the publisher, the editors, and the reviewers. Any product that may be evaluated in this article, or claim that may be made by its manufacturer, is not guaranteed or endorsed by the publisher.
Acknowledgments
We sincerely thank the Shengli Oil field, SINOPEC, for sampling. We also thank the experimental research center of Wuxi Research Institute of Petroleum Geology of SINOPEC for N2 adsorption and mercury intrusion detections.
References
Aadnøy, B. S., and Looyeh, R. (2019). “Shale Oil, Shale Gas, and Hydraulic Fracturing,” in Petroleum Rock Mechanics. Editors B. S. Aadnøy, and R. Looyeh. 2nd Edn (Cambridge, United States: Gulf Professional Publishing), 357–389.
Al-Ameri, A., Gamadi, T., and Ispas, I. (2018). Evaluation of the Near Fracture Face Formation Damage Caused by the Spontaneously Imbibed Fracturing Fluid in Unconventional Gas Reservoirs. J. Pet. Sci. Eng. 171, 23–36. doi:10.1016/j.petrol.2018.07.021
Bai, C., Yu, B., Liu, H., Xie, Z., Han, S., Zhang, L., et al. (2018). The Genesis and Evolution of Carbonate Minerals in Shale Oil Formations from Dongying Depression, Bohai Bay Basin, China. Int. J. Coal Geology. 189, 8–26. doi:10.1016/j.coal.2018.02.008
Barrett, E. P., Joyner, L. G., and Halenda, P. P. (1951). The Determination of Pore Volume and Area Distributions in Porous Substances. I. Computations from Nitrogen Isotherms. J. Am. Chem. Soc. 73 (1), 373–380. doi:10.1021/ja01145a126
Beliveau, D. (1993). Honey, I Shrunk the Pores!. J. Can. Petrol. Technol. 32 (8), 309–319. doi:10.2118/93-08-01
Brunauer, S., Emmett, P. H., and Teller, E. (1938). Adsorption of Gases in Multimolecular Layers. J. Am. Chem. Soc. 60 (2), 309–319. doi:10.1021/ja01269a023
Cai, J., Du, J., Chen, Z., Lei, T., and Zhu, X. (2018). Hydrothermal Experiments Reveal the Influence of Organic Matter on Smectite Illitization. Clays Clay Miner. 66 (1), 28–42. doi:10.1346/ccmn.2017.064084
Chalmers, G. R. L., and Bustin, R. M. (2008). Lower Cretaceous Gas Shales in Northeastern British Columbia, Part I: Geological Controls on Methane Sorption Capacity. Bull. Can. Pet. Geology. 56 (1), 1–21. doi:10.2113/gscpgbull.56.1.1
Chalmers, G. R., Bustin, R. M., and Power, I. M. (2012). Characterization of Gas Shale Pore Systems by Porosimetry, Pycnometry, Surface Area, and Field Emission Scanning Electron Microscopy/transmission Electron Microscopy Image Analyses: Examples from the Barnett, Woodford, Haynesville, Marcellus, and Doig Units. Bulletin 96 (6), 1099–1119. doi:10.1306/10171111052
Chen, T., Liu, F., Huang, S., Zhang, W., Wang, H., Hou, Q., et al. (2016). “Peeling off” Mechanism of Asphaltenes from Solid/Liquid Interface in the Presence of a Highly Charged Amphiphilic Macromolecule. Energy Fuels 30, 9250–9259. doi:10.1021/acs.energyfuels.6b01971
Chen, Y., Xie, Q., Pu, W., and Saeedi, A. (2018a). Drivers of pH Increase and Implications for Low Salinity Effect in sandstone. Fuel 218, 112–117. doi:10.1016/j.fuel.2018.01.037
Chen, Y., Xie, Q., Sari, A., Brady, P. V., and Saeedi, A. (2018b). Oil/Water/Rock Wettability: Influencing Factors and Implications for Low Salinity Water Flooding in Carbonate Reservoirs. Fuel 215, 171–177. doi:10.1016/j.fuel.2017.10.031
Cheng, Z., Ning, Z., Wang, Q., Zeng, Y., Qi, R., Huang, L., et al. (2019). The Effect of Pore Structure on Non-Darcy Flow in Porous media Using the Lattice Boltzmann Method. J. Pet. Sci. Eng. 172, 391–400. doi:10.1016/j.petrol.2018.09.066
Curtis, M. E., Sondergeld, C. H., Ambrose, R. J., and Rai, C. S. (2012). Microstructural Investigation of Gas Shales in Two and Three Dimensions Using Nanometer-Scale Resolution Imaging. Bulletin 96 (4), 665–677. doi:10.1306/08151110188
Dehghanpour, H., Zubair, H. A., Chhabra, A., and Ullah, A. (2012). Liquid Intake of Organic Shales. Energy Fuels 26, 5750–5758. doi:10.1021/ef3009794
Du, J., Cai, J., Chen, Z., Lei, T., Zhang, S., and Xie, Z. (2019). A Contrastive Study of Effects of Different Organic Matter on the Smectite Illitization in Hydrothermal Experiments. Appl. Clay Sci. 168, 249–259. doi:10.1016/j.clay.2018.11.016
Echeverría, J. C., Morera, M. T., Mazkiarán, C., and Garrido, J. J. (1999). Characterization of the Porous Structure of Soils: Adsorption of Nitrogen (77 K) and Carbon Dioxide (273 K), and Mercury Porosimetry. Eur. J. Soil Sci. 50 (3), 497–503. doi:10.1046/j.1365-2389.1999.00261.x
Engle, M. A., and Rowan, E. L. (2014). Geochemical Evolution of Produced Waters from Hydraulic Fracturing of the Marcellus Shale, Northern Appalachian Basin: A Multivariate Compositional Data Analysis Approach. Int. J. Coal Geology. 126, 45–56. doi:10.1016/j.coal.2013.11.010
Gaines, R. R., Hammarlund, E. U., Hou, X., Qi, C., Gabbott, S. E., Zhao, Y., et al. (2012). Mechanism for Burgess Shale-Type Preservation. Proc. Natl. Acad. Sci. 109 (14), 5180–5184. doi:10.1073/pnas.1111784109
Greenland, D. J. (1971). Interactions between Humic and Fulvic Acids and Clays. Soil Sci. 111 (1), 34–41. doi:10.1097/00010694-197101000-00004
Haluszczak, L. O., Rose, A. W., and Kump, L. R. (2013). Geochemical Evaluation of Flowback Brine from Marcellus Gas wells in Pennsylvania, USA. Appl. Geochem. 28, 55–61. doi:10.1016/j.apgeochem.2012.10.002
Han, L., Sun, K., Jin, J., and Xing, B. (2016). Some Concepts of Soil Organic Carbon Characteristics and Mineral Interaction from a Review of Literature. Soil Biol. Biochem. 94, 107–121. doi:10.1016/j.soilbio.2015.11.023
Jarvie, D. M., Hill, R. J., Ruble, T. E., and Pollastro, R. M. (2007). Unconventional Shale-Gas Systems: The Mississippian Barnett Shale of North-Central Texas as One Model for Thermogenic Shale-Gas Assessment. Bulletin 91 (4), 475–499. doi:10.1306/12190606068
Jiang, C., Chen, Z., Mort, A., Milovic, M., Robinson, R., Stewart, R., et al. (2016). Hydrocarbon Evaporative Loss from Shale Core Samples as Revealed by Rock-Eval and Thermal Desorption-Gas Chromatography Analysis: Its Geochemical and Geological Implications. Mar. Pet. Geology. 70, 294–303. doi:10.1016/j.marpetgeo.2015.11.021
Jin, X. C., Shah, S. N., Roegiers, J. C., and Zhang, B. (2014). Fracability Evaluation in Shale Reservoirs - An Integrated Petrophysics and Geomechanics Approach. Spe J. 20 (3), 518–526. doi:10.2118/168589-ms
Kenvin, J., Jagiello, J., Mitchell, S., and Pérez-Ramírez, J. (2015). Unified Method for the Total Pore Volume and Pore Size Distribution of Hierarchical Zeolites from Argon Adsorption and Mercury Intrusion. Langmuir 31 (4), 1242–1247. doi:10.1021/la504575s
Klaver, J., Desbois, G., Urai, J. L., and Littke, R. (2012). BIB-SEM Study of the Pore Space Morphology in Early Mature Posidonia Shale from the Hils Area, Germany. Int. J. Coal Geology. 103, 12–25. doi:10.1016/j.coal.2012.06.012
Kuila, U., and Prasad, M. (2013). Specific Surface Area and Pore-Size Distribution in Clays and Shales. Geophys. Prospect. 61 (2), 341–362. doi:10.1111/1365-2478.12028
Kuila, U., McCarty, D. K., Derkowski, A., Fischer, T. B., Topór, T., and Prasad, M. (2014). Nano-scale Texture and Porosity of Organic Matter and clay Minerals in Organic-Rich Mudrocks. Fuel 135, 359–373. doi:10.1016/j.fuel.2014.06.036
Li, W., Lu, S., Xue, H., Zhang, P., and Hu, Y. (2016a). Microscopic Pore Structure in Shale Reservoir in the Argillaceous Dolomite from the Jianghan Basin. Fuel 181, 1041–1049. doi:10.1016/j.fuel.2016.04.140
Li, Z., Zou, Y.-R., Xu, X.-Y., Sun, J.-N., Li, M., and Peng, P. A. (2016b). Adsorption of Mudstone Source Rock for Shale Oil - Experiments, Model and a Case Study. Org. Geochem. 92, 55–62. doi:10.1016/j.orggeochem.2015.12.009
Li, X., Cai, J. G., Liu, H. M., Zhu, X. J., Li, Z., and Liu, J. (2020). Characterization of Shale Pore Structure by Successive Pretreatments and its Significance. Fuel 269, 117412. doi:10.1016/j.fuel.2020.117412
Liang, C., Cao, Y., Liu, K., Jiang, Z., Wu, J., and Hao, F. (2018). Diagenetic Variation at the Lamina Scale in Lacustrine Organic-Rich Shales: Implications for Hydrocarbon Migration and Accumulation. Geochimica et Cosmochimica Acta 229, 112–128. doi:10.1016/j.gca.2018.03.017
Liu, H., Zhang, S., Song, G., Xuejun, W., Teng, J., Wang, M., et al. (2019). Effect of Shale Diagenesis on Pores and Storage Capacity in the Paleogene Shahejie Formation, Dongying Depression, Bohai Bay Basin, east China. Mar. Pet. Geology. 103, 738–752. doi:10.1016/j.marpetgeo.2019.01.002
Loucks, R. G., Reed, R. M., Ruppel, S. C., and Hammes, U. (2012). Spectrum of Pore Types and Networks in Mudrocks and a Descriptive Classification for Matrix-Related Mudrock Pores. Bulletin 96 (6), 1071–1098. doi:10.1306/08171111061
Lu, Y., Wang, H., Guan, B., Liu, P., Guo, L., Wu, J., et al. (2018). Reasons for the Low Flowback Rates of Fracturing Fluids in marine Shale. Nat. Gas Industry B 5 (1), 35–40. doi:10.1016/j.ngib.2017.11.006
Lu, Y., Yang, M., Ge, Z., Zhou, Z., Chai, C., and Zhao, H. (2019). Influence of Viscoelastic Surfactant Fracturing Fluid on Coal Pore Structure under Different Geothermal Gradients. J. Taiwan Inst. Chem. Eng. 97, 207–215. doi:10.1016/j.jtice.2019.01.024
Lu, Y., Wang, L., Ge, Z., Zhou, Z., Deng, K., and Zuo, S. (2020). Fracture and Pore Structure Dynamic Evolution of Coals during Hydraulic Fracturing. Fuel 259, 116272. doi:10.1016/j.fuel.2019.116272
Macht, F., Eusterhues, K., Pronk, G. J., and Totsche, K. U. (2011). Specific Surface Area of clay Minerals: Comparison between Atomic Force Microscopy Measurements and Bulk-Gas (N2) and -liquid (EGME) Adsorption Methods. Appl. Clay Sci. 53 (1), 20–26. doi:10.1016/j.clay.2011.04.006
Makhanov, K., Habibi, A., Dehghanpour, H., and Kuru, E. (2014). Liquid Uptake of Gas Shales: A Workflow to Estimate Water Loss during Shut-In Periods after Fracturing Operations. J. Unconventional Oil Gas Resour. 7, 22–32. doi:10.1016/j.juogr.2014.04.001
Malik, Z., and Lu, S. G. (2015). Pore Size Distribution of Clayey Soils and its Correlation with Soil Organic Matter. Pedosphere 25 (2), 240–249. doi:10.1016/S1002-0160(15)60009-1
Mathia, E. J., Bowen, L., Thomas, K. M., and Aplin, A. C. (2016). Evolution of Porosity and Pore Types in Organic-Rich, Calcareous, Lower Toarcian Posidonia Shale. Mar. Pet. Geology. 75, 117–139. doi:10.1016/j.marpetgeo.2016.04.009
O'Brien, D. E., and Chenevert, M. E. (1973). Stabilizing Sensitive Shales with Inhibited, Potassium-Based Drilling Fluids. J. Petrol. Technol. 25 (09), 1089–1100.
Osiptsov, A. A. (2017). Fluid Mechanics of Hydraulic Fracturing: A Review. J. Pet. Sci. Eng. 156, 513–535. doi:10.1016/j.petrol.2017.05.019
Roshan, H., Al-Yaseri, A. Z., Sarmadivaleh, M., and Iglauer, S. (2016). On Wettability of Shale Rocks. J. Colloid Interf. Sci. 475, 104–111. doi:10.1016/j.jcis.2016.04.041
Saidian, M., Godinez, L. J., and Prasad, M. (2016). Effect of clay and Organic Matter on Nitrogen Adsorption Specific Surface Area and Cation Exchange Capacity in Shales (Mudrocks). J. Nat. Gas Sci. Eng. 33, 1095–1106. doi:10.1016/j.jngse.2016.05.064
Saikia, B. D., Mahadevan, J., and Rao, D. N. (2018). Exploring Mechanisms for Wettability Alteration in Low-Salinity Waterfloods in Carbonate Rocks. J. Pet. Sci. Eng. 164, 595–602. doi:10.1016/j.petrol.2017.12.056
Sari, A., Chen, Y., Xie, Q., and Saeedi, A. (2019). Low Salinity Water Flooding in High Acidic Oil Reservoirs: Impact of pH on Wettability of Carbonate Reservoirs. J. Mol. Liquids 281, 444–450. doi:10.1016/j.molliq.2019.02.081
Schmitt, M., Fernandes, C. P., da Cunha Neto, J. A. B., Wolf, F. G., and dos Santos, V. S. S. (2013). Characterization of Pore Systems in Seal Rocks Using Nitrogen Gas Adsorption Combined with Mercury Injection Capillary Pressure Techniques. Mar. Pet. Geology. 39 (1), 138–149. doi:10.1016/j.marpetgeo.2012.09.001
Shi, W., Wang, X., Guo, M., Shi, Y., Feng, A., Liang, R., et al. (2020). Water Use for Shale Gas Development in China's Fuling Shale Gas Field. J. Clean. Prod. 256, 120680. doi:10.1016/j.jclepro.2020.120680
Sing, K. S. W. (1985). Reporting Physisorption Data for Gas/solid Systems with Special Reference to the Determination of Surface Area and Porosity (Recommendations 1984). Pure Appl. Chem. 57 (4), 603–619. doi:10.1351/pac198557040603
Singh, M., Sarkar, B., Biswas, B., Churchman, J., and Bolan, N. S. (2016). Adsorption-Desorption Behavior of Dissolved Organic Carbon by Soil clay Fractions of Varying Mineralogy. Geoderma 280, 47–56. doi:10.1016/j.geoderma.2016.06.005
Song, W., Yao, J., Li, Y., Sun, H., and Yang, Y. (2018). Fractal Models for Gas Slippage Factor in Porous media Considering Second-Order Slip and Surface Adsorption. Int. J. Heat Mass Transfer 118, 948–960. doi:10.1016/j.ijheatmasstransfer.2017.11.072
Spitzer, Z., Bíba, V., and Kadlec, O. (1976). The Complete Pore Structure Analysis of Fine Porous Solids. Carbon 14 (3), 151–156. doi:10.1016/0008-6223(76)90095-6
Sui, W., Tian, Y., and Yao, C. (2018). Investigation of Microscopic Pore Structure Variations of Shale Due to Hydration Effects through SEM Fixed-Point Observation Experiments. Pet. Exploration Develop. 45 (5), 955–962. doi:10.1016/s1876-3804(18)30099-5
Sun, M., Yu, B., Hu, Q., Yang, R., Zhang, Y., and Li, B. (2017). Pore Connectivity and Tracer Migration of Typical Shales in south China. Fuel 203, 32–46. doi:10.1016/j.fuel.2017.04.086
Tang, J., Li, J., Tang, M., Du, X., Yin, J., Guo, X., et al. (2019). Investigation of Multiple Hydraulic Fractures Evolution and Well Performance in Lacustrine Shale Oil Reservoirs Considering Stress Heterogeneity. Eng. Fracture Mech. 218, 106569. doi:10.1016/j.engfracmech.2019.106569
Wang, F. P., and Gale, J. F. W. (2009). Screening Criteria for Shale-Gas Systems. Gulf Coast Assoc. Geol. Societies Trans. 59, 779–793.
Wang, F., and Guo, S. (2019). Influential Factors and Model of Shale Pore Evolution: A Case Study of a Continental Shale from the Ordos Basin. Mar. Pet. Geology. 102, 271–282. doi:10.1016/j.marpetgeo.2018.12.045
Wang, X., and Sheng, J. J. (2017). Effect of Low-Velocity Non-Darcy Flow on Well Production Performance in Shale and Tight Oil Reservoirs. Fuel 190, 41–46. doi:10.1016/j.fuel.2016.11.040
Wang, S., Feng, Q., Javadpour, F., Xia, T., and Li, Z. (2015). Oil Adsorption in Shale Nanopores and its Effect on Recoverable Oil-In-Place. Int. J. Coal Geology. 147-148, 9–24. doi:10.1016/j.coal.2015.06.002
Wang, S., Javadpour, F., and Feng, Q. (2016a). Molecular Dynamics Simulations of Oil Transport through Inorganic Nanopores in Shale. Fuel 171, 74–86. doi:10.1016/j.fuel.2015.12.071
Wang, Z., Jin, X., Wang, X., Sun, L., and Wang, M. (2016b). Pore-Scale Geometry Effects on Gas Permeability in Shale. J. Nat. Gas Sci. Eng. 34, 948–957. doi:10.1016/j.jngse.2016.07.057
Wang, E., Li, C., Feng, Y., Song, Y., Guo, T., Li, M., et al. (2022). Novel Method for Determining the Oil Moveable Threshold and an Innovative Model for Evaluating the Oil Content in Shales. Energy 239 (A), 121848. doi:10.1016/j.energy.2021.121848
Wei, S., Jin, Y., Xia, Y., and Lin, B. (2020). The Flowback and Production Analysis in Sub-saturated Fractured Shale Reservoirs. J. Pet. Sci. Eng. 186, 106694. doi:10.1016/j.petrol.2019.106694
Wijaya, N., and Sheng, J. J. (2019). Effect of Desiccation on Shut-In Benefits in Removing Water Blockage in Tight Water-Wet Cores. Fuel 244, 314–323. doi:10.1016/j.fuel.2019.01.180
Wilson, M. J., Shaldybin, M. V., and Wilson, L. (2016a). Clay Mineralogy and Unconventional Hydrocarbon Shale Reservoirs in the USA. I. Occurrence and Interpretation of Mixed-Layer R3 Ordered Illite/smectite. Earth-Science Rev. 158, 31–50. doi:10.1016/j.earscirev.2016.04.004
Wilson, M. J., Wilson, L., and Shaldybin, M. V. (2016b). Clay Mineralogy and Unconventional Hydrocarbon Shale Reservoirs in the USA. II. Implications of Predominantly Illitic Clays on the Physico-Chemical Properties of Shales. Earth-Science Rev. 158, 1–8. doi:10.1016/j.earscirev.2016.04.005
Wu, S., Zhu, R., Cui, J., Cui, J., Bai, B., Zhang, X., et al. (2015). Characteristics of Lacustrine Shale Porosity Evolution, Triassic Chang 7 Member, Ordos Basin, NW China. Pet. Exploration Develop. 42 (2), 185–195. doi:10.1016/s1876-3804(15)30005-7
Xie, J. N., Xie, J., Ni, G. H., Sheìk, R., Sun, Q., and Wang, H. (2020). Effects of Pulse Wave on the Variation of Coal Pore Structure in Pulsating Hydraulic Fracturing Process of Coal Seam. Fuel 264, 116906. doi:10.1016/j.fuel.2019.116906
Xu, M., and Dehghanpour, H. (2014). Advances in Understanding Wettability of Gas Shales. Energy Fuels 28 (7), 4362–4375. doi:10.1021/ef500428y
Yang, X., and Guo, B. (2019). Productivity Analysis of Multi-Fractured Shale Oil wells Accounting for the Low-Velocity Non-Darcy Effect. J. Pet. Sci. Eng. 183, 106427. doi:10.1016/j.petrol.2019.106427
Yang, R., Hu, Q., He, S., Hao, F., Guo, X., Yi, J., et al. (2018). Pore Structure, Wettability and Tracer Migration in Four Leading Shale Formations in the Middle Yangtze Platform, China. Mar. Pet. Geology. 89, 415–427. doi:10.1016/j.marpetgeo.2017.10.010
Yu, H., Chen, J., Zhu, Y., Wang, F., and Wu, H. (2017). Multiscale Transport Mechanism of Shale Gas in Micro/nano-Pores. Int. J. Heat Mass Transfer 111, 1172–1180. doi:10.1016/j.ijheatmasstransfer.2017.04.050
Zeng, B., Cheng, L., and Li, C. (2011). Low Velocity Non-linear Flow in Ultra-low Permeability Reservoir. J. Pet. Sci. Eng. 80 (1), 1–6. doi:10.1016/j.petrol.2011.10.006
Zeng, L., Chen, Y., Hossain, M. M., Saeedi, A., and Xie, Q. (2019). Wettability Alteration Induced Water Uptake in Shale Oil Reservoirs: A Geochemical Interpretation for Oil-Brine-OM Interaction during Hydraulic Fracturing. Int. J. Coal Geology. 213, 103277. doi:10.1016/j.coal.2019.103277
Zhang, T., Ellis, G. S., Ruppel, S. C., Milliken, K., and Yang, R. (2012). Effect of Organic-Matter Type and thermal Maturity on Methane Adsorption in Shale-Gas Systems. Org. Geochem. 47, 120–131. doi:10.1016/j.orggeochem.2012.03.012
Zhang, J., Jiang, Z., Jiang, X., Wang, S., Liang, C., and Wu, M. (2016). Oil Generation Induces Sparry Calcite Formation in Lacustrine Mudrock, Eocene of east China. Mar. Pet. Geology. 71, 344–359. doi:10.1016/j.marpetgeo.2016.01.007
Zhang, P., Lu, S., and Li, J. (2019). Characterization of Pore Size Distributions of Shale Oil Reservoirs: A Case Study from Dongying Sag, Bohai Bay basin, China. Mar. Pet. Geology. 100, 297–308. doi:10.1016/j.marpetgeo.2018.11.024
Zhang, S., Liu, H., Liu, Y., Wang, Y., Wang, M., Bao, Y., et al. (2020). Main Controls and Geological Sweet Spot Types in Paleogene Shale Oil Rich Areas of the Jiyang Depression, Bohai Bay basin, China. Mar. Pet. Geology. 111, 576–587. doi:10.1016/j.marpetgeo.2019.08.054
Zhu, X., Cai, J., Song, G., and Ji, J. (2015). Factors Influencing the Specific Surface Areas of Argillaceous Source Rocks. Appl. Clay Sci. 109-110, 83–94. doi:10.1016/j.clay.2015.02.016
Zhu, X., Cai, J., Liu, W., and Lu, X. (2016). Occurrence of Stable and Mobile Organic Matter in the Clay-Sized Fraction of Shale: Significance for Petroleum Geology and Carbon Cycle. Int. J. Coal Geology. 160-161, 1–10. doi:10.1016/j.coal.2016.03.011
Zhu, X., Cai, J., Liu, Q., Li, Z., and Zhang, X. (2019). Thresholds of Petroleum Content and Pore Diameter for Petroleum Mobility in Shale. Bulletin 103 (3), 605–617. doi:10.1306/0816181617517009
Keywords: pore characteristics, surface characteristics, mineral composition, interfacial interaction, fluid flow
Citation: Li X, Cai J, Gao B, Long S, Feng D, Peng Z and Guo B (2021) Characteristics of Shale Pores and Surfaces and Their Potential Effects on the Fluid Flow From Shale Formation to Fractures. Front. Earth Sci. 9:751543. doi: 10.3389/feart.2021.751543
Received: 01 August 2021; Accepted: 20 September 2021;
Published: 22 October 2021.
Edited by:
Min Wang, China University of Petroleum (Huadong), ChinaReviewed by:
Rui Yang, China University of Geosciences Wuhan, ChinaEnze Wang, Peking University, China
Shansi Tian, Northeast Petroleum University, China
Copyright © 2021 Li, Cai, Gao, Long, Feng, Peng and Guo. This is an open-access article distributed under the terms of the Creative Commons Attribution License (CC BY). The use, distribution or reproduction in other forums is permitted, provided the original author(s) and the copyright owner(s) are credited and that the original publication in this journal is cited, in accordance with accepted academic practice. No use, distribution or reproduction is permitted which does not comply with these terms.
*Correspondence: Jingong Cai, amdjYWlAdG9uZ2ppLmVkdS5jbg==