 Pedro A. Hernández1,2*Kenji Nogami3Eleazar Padrón1,2
 Luis Somoza4Cecilia Amonte1,2Toshiya Mori5
 Gladys V. Melián1,2Hirochicka Sumino6
 Yoshikazu Kikawada7
 Nemesio M. Pérez1,2
- 1Instituto Volcanológico de Canarias (INVOLCAN), Santa Cruz de Tenerife, Spain
- 2Instituto Tecnológico y de Energías Renovables (ITER), Santa Cruz de Tenerife, Spain
- 3Tokyo Institute of Technology, Meguro, Japan
- 4Marine Geology Division, Instituto Geológico y Minero de España (IGME), Madrid, Spain
- 5Geochemical Research Center, Graduate School of Science, The University of Tokyo, Bunkyo, Japan
- 6Department of Basic Science, Graduate School of Arts and Sciences, The University of Tokyo, Bunkyo, Japan
- 7Department of Materials and Life Sciences, Faculty of Science and Technology, Sophia University, Chiyoda, Japan
The gases dissolved in the waters of volcanic lakes can present a serious hazard if the physical-chemical conditions change due to variations in the supply of magmatic gases. The monitoring of gases such as CO2 and He help us understand the degassing process and their connection with magmatic/hydrothermal system. One of the most acidic volcanic lakes on the planet is the Yugama, on Kusatsu Shirane volcano (Japan). We report the results of an interdisciplinary study carried out in August 2013 at Yugama consisting of the first estimation of rate of diffuse CO2 emission, the chemical and isotopic analysis of water and dissolved gases in samples from vertical lake profiles, and an echo-sounding survey. The lake water has an average temperature of 24-25°C, pH 1.01, concentrations of SO42- between 1,227 and 1,654 mgL−1 and Cl− between 1,506 and 2,562 mgL−1, with gas bubbling at several locations and floating sulfur globules with sulfide inclusions. A total of 66 CO2 efflux measurements were taken at the lake surface by means of the floating accumulation chamber method to estimate the diffuse CO2 output from the studied area. CO2 efflux values ranged from 82 up to 25,800 g m−2 d−1. Estimation of the diffuse CO2 emission at Yaguma Crater Lake was 30 ± 12 t d−1. Normalized CO2 emission rate (assuming an area of 0.066 km2) was 454 t km−2 d−1, a value within the range of acid volcanic lakes. Vertical profiles of major ions and dissolved gases showed variations with increases in ion content and dissolved CO2 and He with depth. Acoustic imaging shows the presence of intense bubbling and provides important information on the bathymetry of the lake. The 50–200 kHz echograms exhibit frequent vertical plumes of rising gas bubbles. Within the crater-lake, three circular submarine vents have been identified showing flares due to a significant activity of sublacustrine emissions. This work shows the first data of diffuse CO2 degassing, dissolved gases in water and echosounding (ES) from Yugama Crater Lake. Periodic hydrogeochemical and hydroacoustic surveys at Yugama Crater Lakemay thus help to document changes in the state of activity of this high-risk volcanic area.
Introduction
Volcanic lakes may have their origin in processes that disturb the watershed: explosion craters, collapse calderas as well as streams and rivers that were cut off by volcanic products like lava flows, lahars, ash flows (Varekamp, 2015). After the gas disasters at lakes Monoun (1984) and Nyos (1986), both in Cameroon (Sigurdsson et al., 1987; Sigvaldason, 1989), the sudden release of CO2 accumulated in volcanic lakes has become a well-known hazard (Le Guern and Sigvaldason, 1989, 1990; Evans et al., 1994; Kling et al., 2005; Kusakabe et al., 2008). Since a large amount of magmatic gases can be dissolved in water, CO2 degassing from volcanic lakes should be monitored (Arpa et al., 2013; Burton et al., 2013; Hernández et al., 2011, 2017; Melián et al., 2016:; Padrón et al., 2008; Pérez et al., 2011). Degassing through the lake surface occurs by bubbling (convective/advective degassing) or by diffusion through the water/air interface (Padrón et al., 2008; Mazot and Taran, 2009).
Acidic lakes (pH < 2–3) like Yugama, at Kusatsu-Shirane volcano, Japan, release CO2 freely into the atmosphere, which makes the lake chemically transparent to CO2, in contrast to HCl and SO2-H2S, which are the cause of acidity. This means that CO2 represents a transitory phase during its ascent through a lake of pH < 2. In this case, the dissolved gas concentrations are transient and the degassing dynamics is controlled by this “low solubility” of CO2 throughout the water column. On the other hand, high-pH lakes (pH 6–9) are able to store (or even precipitate) CO2 depending on the P-T conditions along the vertical profile of a lake. Therefore, in this case CO2 is not a transient gas and has a long residence time in the lake, especially in the deeper water layers due to hydrostatic loading (Rouwet, 2021).
Chemical and isotopic analysis of lake water samples, as well as fumarolic gases, allow us to assess the importance of magmatic-hydrothermal contributions to crater lakes. Dissolved gases in the lake waters provide a better understanding of the evolution of the crater lakes and their underlying hydrothermal systems (Caudron et al., 2012; Hernández et al., 2017; Jolie, 2019). Finally, hydroacoustic studies provide important information on the characteristics of rising gas bubbles in the water column and the lakebed bathymetry via echo-sounding (ES) surveys (Hernández et al., 2017). Gas bubbles in the water column produce strong ES backscatter signals that allow the detection and quantification of gas fluxes from subaqueous fumaroles (Greinert et al., 2006).
Since diffuse degassing, dissolved gas in water and echosounding (ES) studies had never been performed at Yugama Crater Lake (hereinafter YCL), this work shows the first results that will help to understand degassing dynamics at this active lake. Chemical and isotopic compositions of water samples and dissolved gases are also presented. This report includes a study of the hydroacoustic characteristics of the rising gas bubbles in the water column and a bathymetry of the lakebed by means of echosounder (ES) survey.
Geological Setting
Kusatsu-Shirane volcano (2,165 m a.s.l.) is one of the most active volcanoes in Japan (Figure 1A), and thirteen eruptions since 1805 have been recorded. It is located near the meeting point of the Northeast Japan Arc and the Izu-Mariana Arc (Sugimura, 1960), and developed on a Tertiary volcanic basement that dips eastward and southward at 2000 m a.s.l. The summit area of this volcano comprises three young pyroclastic cones, Moto-shirane, Ai-no-mine, and Shirane, aligned north-south. Moto-shirane pyroclastic cone, located 2.3 km south of Shirane pyroclastic cone, is the youngest and was formed after effusion of large-scale lava flows 3,000 years ago (Hayakawa and Yui, 1989). The top of this cone is the highest elevation on this mountain. In 2018, a phreatic eruption occurred unexpectedly at the northern extremity of this cone after 1,500 years of dormancy, causing one death and eleven persons injured. Ai-no-mine pyroclastic cone is monogenic and no historical eruptions have occurred. All the historical eruptions at Kusatsu-Shirane volcano were phreatic and occurred intensively at Shirane pyroclastic cone (Hayakawa and Yui, 1989).
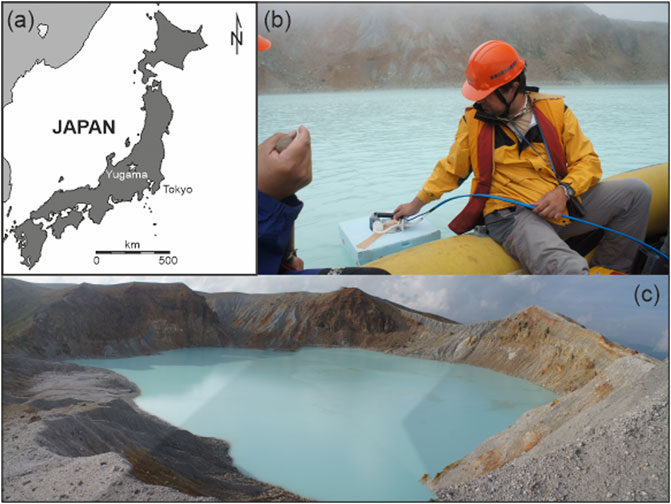
FIGURE 1. (A) Geographical location of Kusatsu Shirane volcano, Japan. (B) Personnel performing diffuse CO2 efflux measurements at Yugama crater lake. (C) Panoramic view of Yugama Crater Lake.
At the top of Shirane pyroclastic cone, there are three crater lakes, Mizugama, Yugama, and Karegama aligned in a northeast-southwest direction. Yugama is the main crater lake (Figure 1B) with a diameter of 200 m and a depth of 25 m in average, filled with strongly acidic water with a pH of less than 1.2 (Ohba et al., 2008; Terada and Hashimoto, 2017). Volcanic gases with water are discharged ceaselessly from the many vents located at the bottom of the crater lake. Since no thermal activity at Mizugama and Karegama crater lakes is recognized, YCL is currently the focus of volcanic activity because it is the only one that shows thermal anomalies, very acidic waters and gas emission. Since 2008, an area of thermal anomaly with fumaroles has initiated on the northeast shore of the lake, and access to the crater rim without permission has been prohibited due to the risk of sudden eruption. From 2014 to 2017, microearthquake swarms were accompanied by ground deformation, increased water temperature, and changes in the chemical concentrations of the water in YCL (including the detection of Cl and SO4 ions), but no eruption occurred (Kuwahara et al., 2017; Terada et al., 2018). These signals, together with drastic changes in the chemical composition of fumarolic gases, suggested imminent eruption at the Kusatsu pyroclastic cone, but no eruption occurred.
Materials and Methods
In August 2013, a field campaign was carried out at YCL consisting of the measurement of the diffuse CO2 efflux through the lake surface (Figure 1C), an echo-sounding (ES) survey, and water sampling at different depths along three vertical profiles: CW (crater wall), YC (Yugama center) and 83-C (1983 crater; Figure 2A). Water samples were collected using a 2.2 L WaterMark horizontal PVC water bottle.
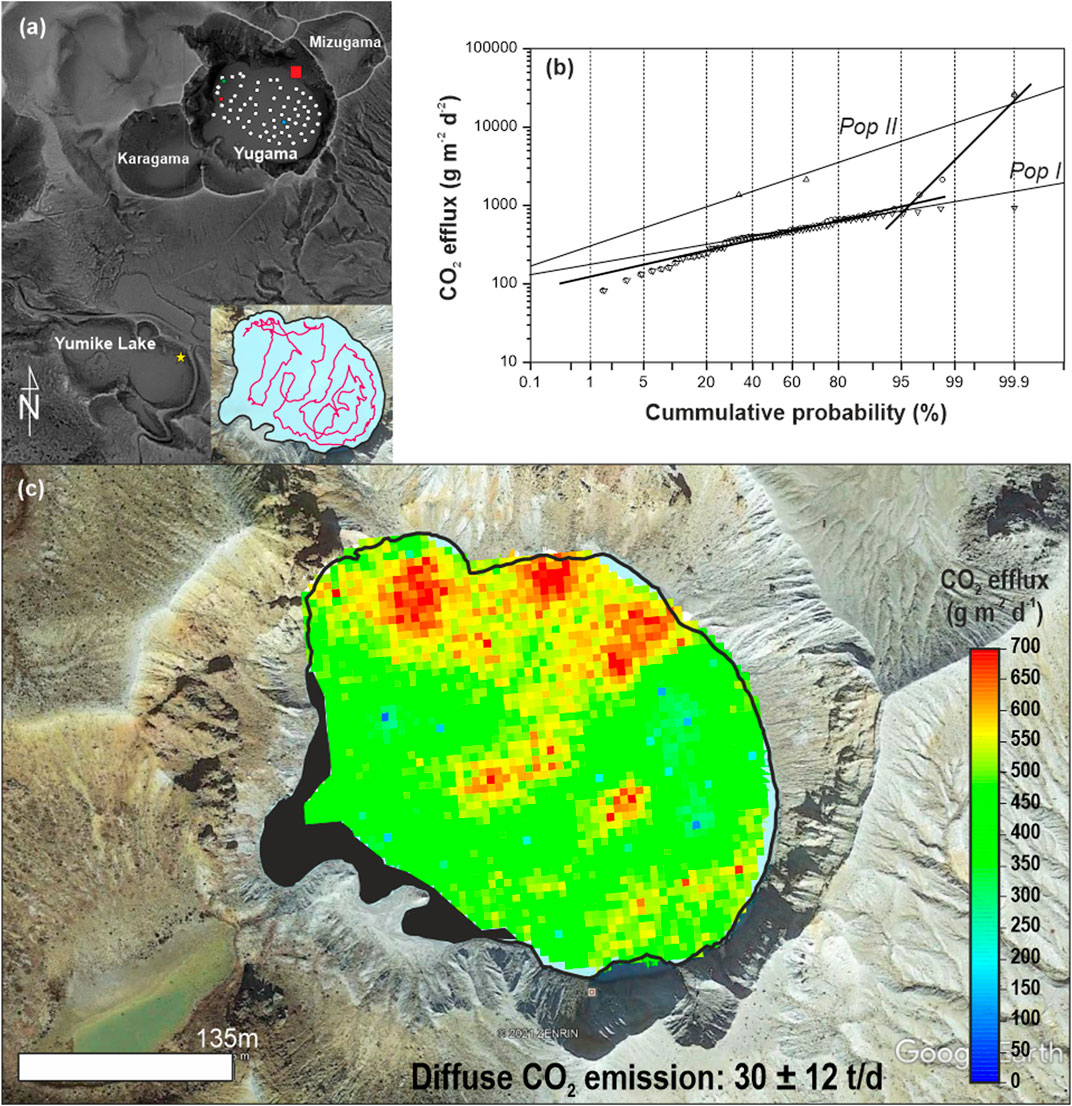
FIGURE 2. (A) Spatial distribution of diffuse CO2 efflux measurement points and the three vertical profiles for water sampling. (B) Sinclair FCO2 at Yugama.
Diffuse CO2 Efflux Measurements
The CO2 efflux survey was performed under stable weather conditions (no wind and sunny). A total of 66 sampling sites were selected at the surface of YCL to obtain a homogeneous distribution of the sampling points over an area of 0.066 km2 (Figure 2A). The GPS position of each measurement point was recorded with a resolution ±5 m. The accumulation chamber method (Parkinson 1981) was modified in order to work on the lake surface by using a floating chamber (Mazot and Taran, 2009) (Figure 1B). Measurements of CO2 were performed in-situ by means of a portable non-dispersive infrared (NDIR) CO2 analyzer (LICOR-800 system). The LICOR analyzer was interfaced to a hand size computer that runs data acquisition software. A map of the spatial distribution of diffuse CO2 emission was constructed using sequential Gaussian simulation (sGs) algorithms provided by GSLIB software (Deutsch and Journel, 1998; Cardellini et al., 2003).
Chemical and Isotopic Analysis of Water and Dissolved Gases
Water samples for laboratory analyses of major and minor elements (Ca+2, Mg+2, K+, Na+, NH4+, Cl−, SO4−2 and F−) and for stable hydrogen and oxygen isotope ratios (2H/1H and 18O/16O) were collected and stored for analysis at ITER lab. Chemical analyses of anions (Cl−, SO4−2, F−) were performed by means of a Dionex DX-500 ion-chromatograph, whereas analyses of cations (Ca+2, Mg+2, K+, Na+) were performed with a Metrohm 861 Advanced Compact ion-chromatograph, both in filtered samples (0.45 µm). Accuracy of the analysis was estimated approximately in 2.0–3.5 and 5.0% for the main and minor compounds, respectively. A water sample was collected at Yumiike lake (a rainwater lagoon), located a few hundred meters south of YCL to compare with YCL samples.
Dissolved gases in water were analyzed for 83-C vertical profile samples and stored in 60 ml glass bottles sealed in the field with silicon/rubber septa using special pliers. Before sealing the glass bottle, CuCl2 was added to prevent any biological activity. All the water samples were collected taking care to avoid even the tiniest bubbles to prevent atmospheric contamination (Hernández et al., 2017). Chemical analyses were performed later on the gas phase extracted after the attainment of the equilibrium (at constant temperature) between the water sample and the gaseous phase after the introduction of a host gas (Argon), injected inside the sampling bottle (Sugisaki and Taki, 1987; Capasso and Inguaggiato, 1998; Capasso et al., 2000; Melián et al., 2016; Hernández et al., 2017). A variety of gases dissolved in YCL samples were analyzed (H2, N2, O2, CH4, CO2, and He) by means of a Quadrupole Mass Spectrometer (QMS) model Pfeiffer Omnistar 422 (accuracy 0.2%). The detection limit for He was estimated to be about 0.05 ppmv, whereas the analytical accuracy was c. 2.5 and 5% for the main gas components and minor gas compounds, respectively. The QMS was calibrated at the laboratory with bottles containing standards of the measured gases which were used to determine the characteristic fragmentation patterns, sensitivity factors and mass calibration for the dissolved gases in water (Padron et al., 2013).
Hydrogen and oxygen isotopic values of waters were obtained by mass spectrometry (Thermo-Finnigan MAT 253) at ITER laboratory. The results are expressed as δ (‰), defined as:
where δ is the isotopic deviation in ‰, s is the sample, p, the international reference, and R is the isotopic ratio (2H/1H, 18O/16O). Accuracies for δD and δ18O are ±0.5‰ and ±0.1‰ (vs Vienna Standard Mean Ocean Water or V-SMOW), respectively.
Nitrogen isotopic composition of a fumarole sample (YGC) collected during the survey was determined at ITER lab facilities following the method described by Grassa et al. (2010). A Thermo Finnigan MAT253 isotope ratio mass spectrometer, coupled with a Thermo TRACE Gas Chromatograph and a Thermo GC/C III interface were used. 3He/4He ratios of dissolved gas from YCL were analyzed at the lab facilities of the Geochemical Research Center (GRC) of The University of Tokyo, Japan. Lead-glass sampling bottles with volumes of about 50 cm3 and with high-vacuum stopcocks at both ends were totally filled with water to sample for dissolved gas. The gas was then extracted by ultrasonic vibration and quantitatively collected into a small volume (10 cm3) following the method described in Padron et al. (2013). The determination of helium isotopic ratios as well as 4He and 20Ne concentrations was done following the method described by Sumino et al. (2001). Air standards are measured frequently during analyses to determine sensitivities of the mass spectrometer. The correction factor for helium isotope ratios was determined by measurement of an inter-laboratory helium standard named HESJ, with recommended 3He/4He ratio of 20.63 ± 0.10 RA (Matsuda et al., 2002). Uncertainties associated with reported 3He/4He ratios are 1 sigma of each measurement, including error in the measured raw 3He/4He ratio. Errors in concentrations are estimated to be 10% based on reproducibility of noble gas sensitivity of the mass spectrometer after repeated air standard analyses.
Bathymetry and Hydroacoustics
The echo sounder (ES) survey was carried out by means of a Lowrance HDS-5 equipped with a dual frequency (50 and 200 kHz) transducer. The digital ES echograms were processed using Sonar Viewer 2.1.2 software. Extracted bathymetric data were converted from the Lowrance-type Mercator projection to Universal Tranverse Mercator (UTM 54N) using Arc Gis 10.2.1. Bathymetric data from the two frequencies (50 and 200 kHZ) were interpolated using Grapher software and 3-D surface analyses were performed using Fledermaus IVS software. We have followed the same methodology as at Taal crater lake in the Philippines (Hernández et al., 2017), and crater lakes on São Miguel Island in the Azores (Melián et al., 2016). The ES survey was conducted along and crossing the lines shown in Figure 2A.
Results
Diffuse CO2 Degassing From Yugama Crater Lake
The CO2 efflux values ranged from 82 up to 25,800 g m−2 d−1 with an average value of 872 g m−2 d−1. In order to distinguish different source contributions to the CO2 efflux, a statistical-graphical analysis (Sinclair, 1974) was done to check whether there were one or more statistical populations. The statistical-graphical analysis method is based on the recognition of inflection points along a curve defined by plotting data cumulatively on a Log-normal probability scale. The resulting probability graph (Figure 2B) allowed the separation of two geochemical populations: population I showing a mean of 451 g m−2 d−1 and represented by 96.2% of the total data; and population II, showing a mean of 1,058 g m−2 d−1 and represented by 3.8% of the total data. Population I represents those sites where CO2 emission is low, whereas Population II represents the CO2 efflux values where vigorous CO2 emissions occur. One possible mechanism to explain the exsolution of CO2 is that CO2 bubbles may have escaped from the hydrothermal fluid during the ascent when the hydrostatic pressure decreases, with a strong deep source of magmatic origin. The advective mechanism represents an important contribution in Population II, with direct transport to the surface and bubble degassing contributing to the dissolved CO2, increasing the CO2 gradient between the bottom and the surface of the lake.
A total of 100 simulations were carried out following the variogram model to construct a spatial distribution map for CO2 efflux. The experimental variogram was fitted with a spherical model. An average map was then constructed using the average of the different values simulated at each cell. Since quantification of the uncertainty of the total CO2 is an important task, the mean and standard deviation of the 100 simulated values of diffuse CO2 output were assumed to be characteristic of the CO2 efflux and its uncertainty (Cardellini et al., 2003). Figure 2C shows the diffuse CO2 efflux distribution map at YCL based on the mean simulated total CO2 output values. Estimated diffuse CO2 emission from YCL was 30 ± 12 t d−1.
Physico-Chemical Parameters and Chemical Composition of Yugama Crater Lake Waters
The YCL water is highly acidic, with high concentrations of sulfur, chloride and major cations during the 2013 sampling survey. Physical and chemical parameters are reported in Table 1. The average pH of the YCL was 1.1, whereas water temperature was 24.8°C. Total dissolved solids were high at TDS = 4,010–11,387 mg L−1, indicating a high degree of water–rock interaction occurring at deeper levels and/or an enhanced evaporation. All YCL water samples showed high concentrations of Na+ (22.7–168.4 mg L−1), and moderately high concentrations of K+ (10.8–89.6 mg L−1), Mg2+ (18.8–108.2 mg L−1) and Ca2+ (62.3–115.3 mgL−1) and were rich in Cl− (1,506–2,562 mg L−1) and SO42− (1,227–1,654 mg L−1), comparable to data reported in Ohba et al. (2008) and Terada et al. (2018). The water chemistry is presented with a Piper type diagram (Figure 3A), where a main group of water is defined: Ca–Cl type water, typical for acidic active volcanic crater lakes. The sample from Yumiike freshwater lake showed low values of both major cations and anions (see Table 1). Following Ohba et al. (1994), most of chloride in YCL is derived from thermal waters or vapor from the bottom of the lake. In the Na–SO4–Mg ternary plot (Figure 3B), most samples plot close to the SO4 end-member, suggesting the dissolution of acidic sulphur gases in the YCL waters.
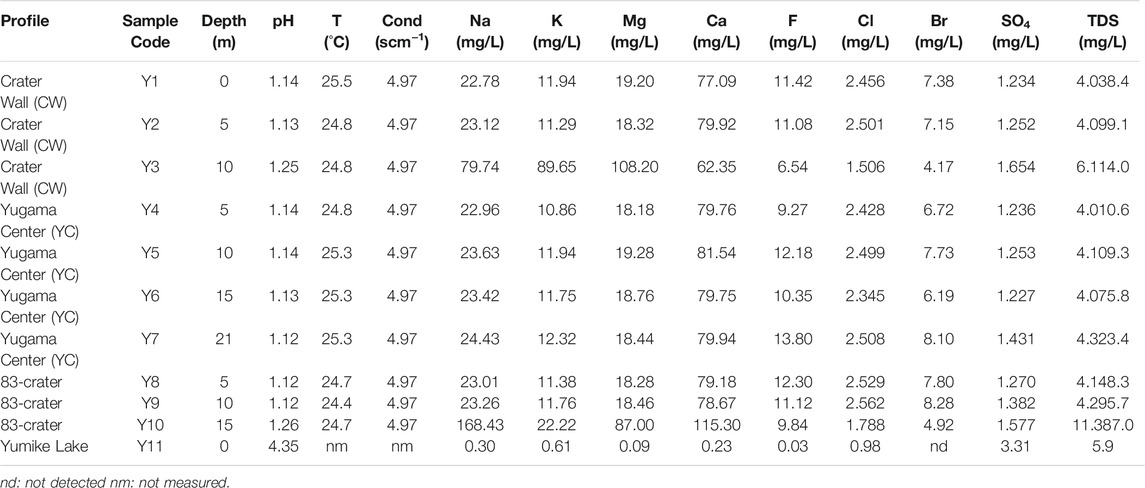
TABLE 1. Chemical composition of the YCL water.
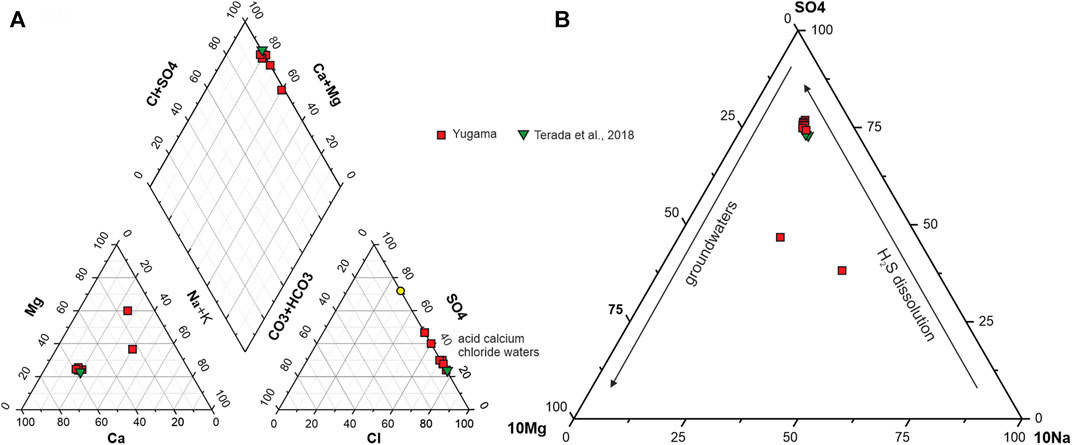
FIGURE 3. (A) Piper diagram of YCL waters. (B) Na–SO4–Mg ternary diagram for YCL water samples collected during August 2013 survey.
Stable Isotopes of Water (δ18O and δD), and Isotopes of Gases (3He/4He, δ15N).
The stable isotope composition for the YCL waters showed variations in δ18O, ranging from −6.34 to -5.77‰, and in δD from −48 to -46‰ (Table 1). The 3He/4He ratios measured in the water samples collected at the 83-C site ranged from 2.08Ra to 3.43Ra, with 4He/20Ne ratios between 0.30 and 0.38. The δ15N value of sample collected at the YGC fumarole was 3.4‰ (vs air) with a N2/36Ar ratio of 72,646.
Dissolved Gases at Yugama Crater Lake
Table 2 shows the chemical composition of dissolved gases sampled at the 83-C site at YCL. Dissolved CO2 in the YCL waters ranged from 28.5 to 45.4 cm3 STP L−1 (average 34.9 cm3 STP L−1), two orders of magnitude higher than that of water in equilibrium with the atmosphere (0.32 cm3 STP L−1, DSR 8.5%). Dissolved H2, O2 and CH4 concentration values ranged from 2.5 × 10⁻³—2.3 × 10⁻², 0.13–2.36 and 1.7410–4—3.3410–4 cm3 STP L−1, respectively. Regarding to the He contents, measured concentrations ranged between 1.72 × 10⁻⁵ and 7.79 × 10⁻⁵ cm3 STP L−1.
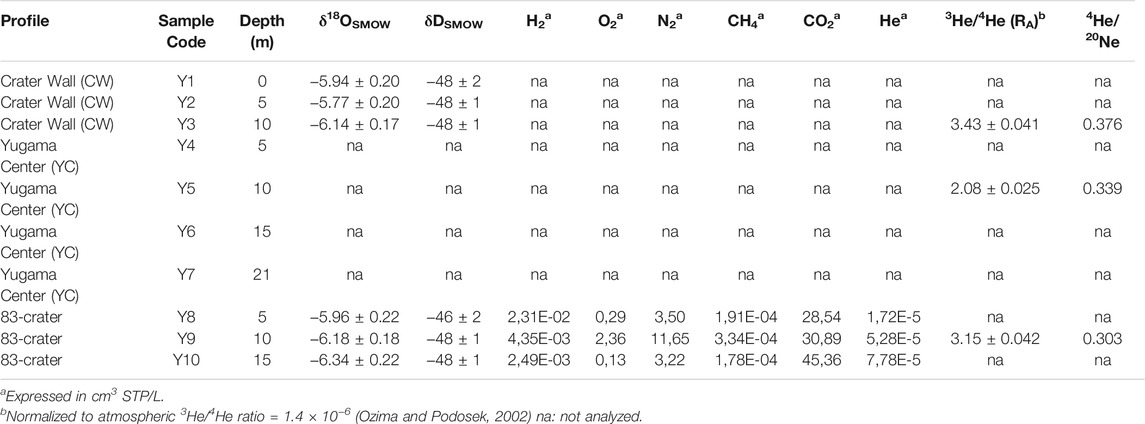
TABLE 2. δ18O vs δD composition of YCL waters and chemical and isotopic composition of dissolved gases in YCL waters.
Bathymetry Data
Bathymetry data from the YCL extend over an oval 225 by 170 m, covering a total surface of 38,100 m2 (Figure 2A). The bottom of the YCL is located at 9–11 m water depths showing a NW-SE elongated central depression with slight slope 1-2°. A peripheral minor crater lake is located to the NW of the main crater lake, also with oval shape 70 by 55 m, a surface of 3,500 m2 and an irregular bottom averaging depth of 12–14 m. (Figures 4A,B).
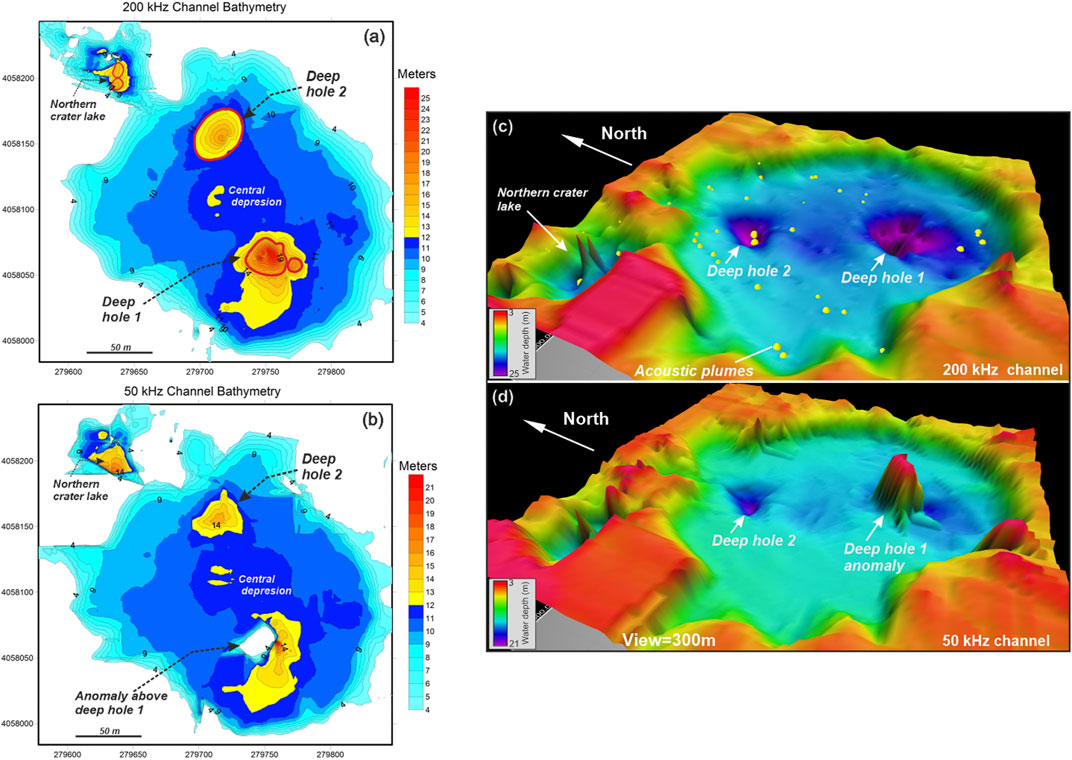
FIGURE 4. (a) Bathymetry maps of the Yugama crater lake derived from the two frequency channels: (A) 200 kHz and (B) 50 KHz. The two deep holes (DH1 and DH2) with water depths below 12 m are located along the NW-SE central depression. A minor crater lake is located to the NW of the main lake. (C) 3D image obtained with 200 kHz frequency channel of the bathymetry at Yugama crater lake, and (D) with 50 kHz frequency channel. Yellow points are the location of acoustic plumes. DH1 and DH2 are clearly identified on 200 kHz bathymetry. The 50 kHz bathymetry shows a peak rising from DH1, interpreted as a dense acoustic plume only observable at low frequencies.
Within the YCL crater lake, two step deep holes (DH1 and DH2) have been identified along the NW-SE central depression at its northern and southern sides (Fig. 54c). The southern hole (DH1) is narrow cone-shape with a diameter of 40 m and maximum depth of 23 m detected with the 200 kHz high-frequency (Figure 4C). The depression around DH1 is elliptically shaped with steep slopes up 40° in the north and 20–30° in the south (Figure 4C). On the contrary, 50 kHz bathymetry shows a positive anomaly masking this DH1 hole (Figure 4D).
The DH2 hole appear as an oval depression 35 m in diameter with a maximum depth of 17 m and steep walls up 40° identified on the 200 kHz frequency bathymetry incising the bottom of the lake located at 9 m (Figure 4C). Conversely to DH1, the DH2 hole does not show positive anomalies in the 50 kHz frequency but the same depression hole identified on the 200 kHz frequency (Figure 4D).
A secondary crater lake is located at the NW side of the main crater lake with only 35 m in diameter, steep walls of 20–30°, and a maximum water depth of 15 m which is separated from the main crater lake by a narrow strait of 4 m water depth. The bottom of this minor crater lake shows two acoustic peaks interpreted as degassing plumes.
Discussion
Geochemistry of Yugama Crater Lake Waters
Figure 5 shows the correlation diagrams between the major cations Na+, Ca2+ and Mg2+ and the anion SO42- versus the Cl−. Chloride is a conservative element and a good geochemical tracer in volcanic and geothermal fluids when its concentration is compared with that of other ions in solution (Michard, 1990). Hypothetical mixing lines between the sample from Yumiike Lake (representing meteoric water) and YCL data are also shown. Water samples in the Na+ vs Cl− diagram Figure 6A) suggest strong Cl− contributions due to the input of magmatic volatiles (Ohba et al., 2000). The Ca-Cl water samples from 2013 (this study) and in 2017 (Terada et al., 2018) show similar trends. However, the Na, K, Ca, Mg and SO4 contents of two samples (Y3 and Y10) show a different trend, with a different linear correlation versus Cl− and different slopes. This could be explained in terms of increased hydrothermal activity at the bottom of YCL at the Crater Wall and 83-C vertical profile sampling points, since both samples are close to the bottom of YCH.
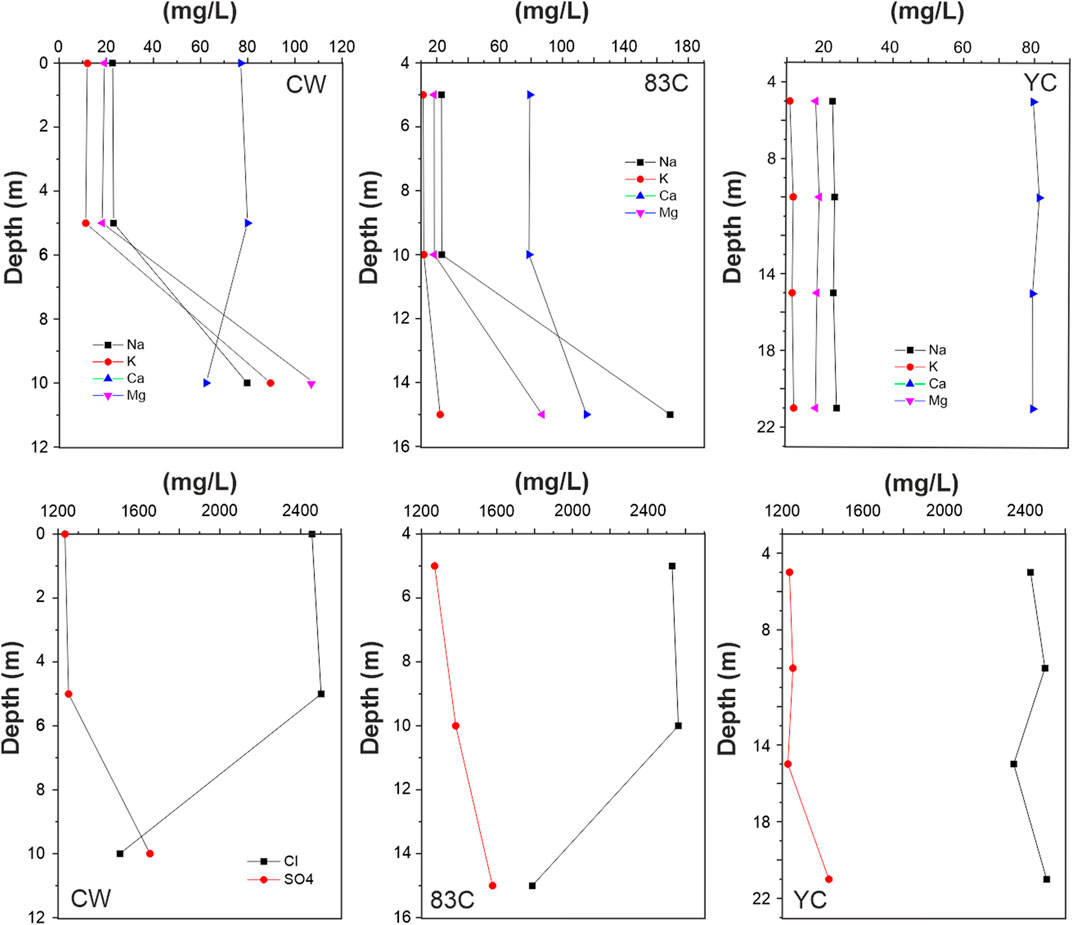
FIGURE 5. Vertical profiles of major cations and anions at YCL.
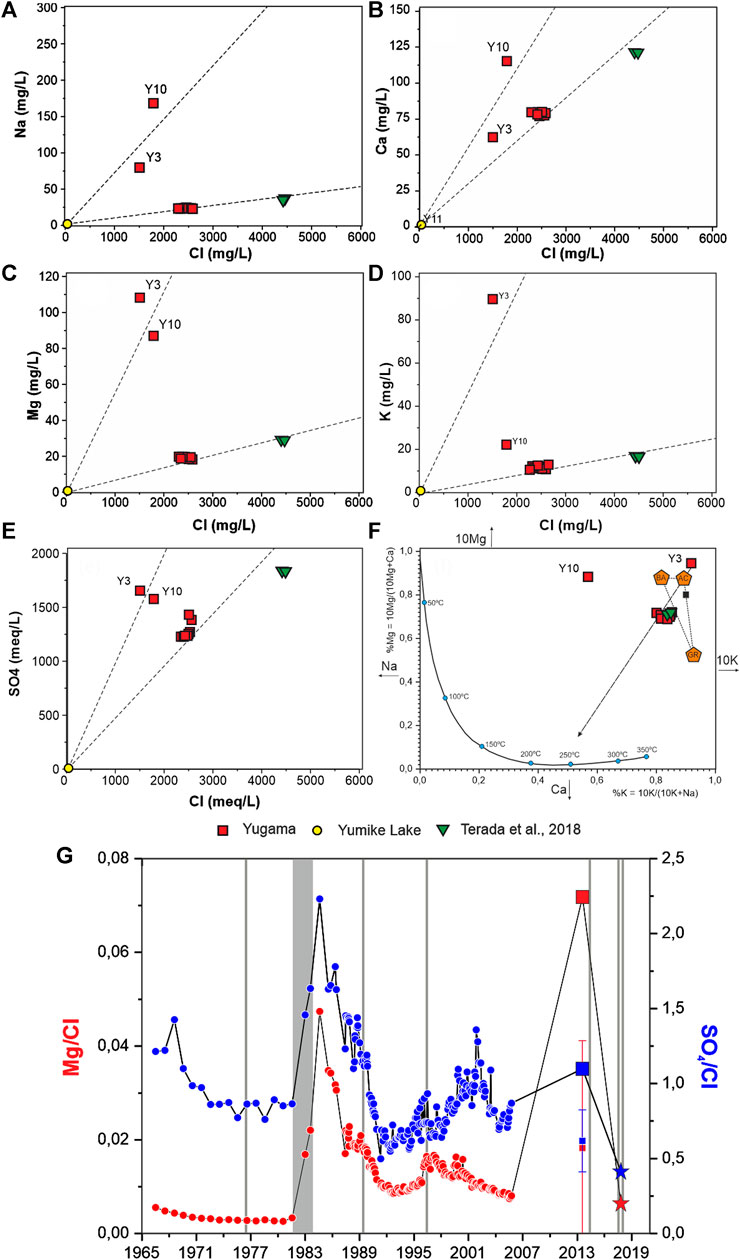
FIGURE 6. Relationships between Cl and Na (A), Ca (B), Mg (C), K (D) and SO4 (E) (in mg/L) for YCL water samples collected during August 2013 survey. Also shown data from Terada et al. (2018). (F) Na-K/Mg-Ca diagram for YCL (based on Giggenbach, 1988). (G) Temporal evolution of Mg/Cl together with SO4/Cl at YCL waters since 1966 (data from Minami et al., 1952; Ossaka et al., 1997, Ohba et al., 2008, Terada et al., 2018 and this study).
Positive correlations are observed between Na+ vs Cl− (Figure 6A), Ca2+ vs Cl− (Figure 6B), Mg2+ vs Cl− (Figure 6C), K+ vs Cl− (Figure 6D) and SO42- vs Cl− (Fig. 65e) in all YCL waters may reflect mixing of hydrothermal waters with meteoric waters (Han et al., 2010). However, the observed high Na/Cl ratios may be controlled by water-rock interactions. The relatively high concentrations of Na and Ca in YCL waters suggest strong interaction with Na- and Ca-rich minerals, possibly occurring in the reservoir and/or in the recharge area (Alçiçek et al., 2018). Ca/Na and Ca/Mg ratios also support the existence of ion exchange processes. Finally, the observed low Na/Cl and K/Cl ratios in YCL waters may indicate short and shallow flow paths (Han et al., 2010). The very low Ca/Cl ratios in the YCL waters could be the result of the high Cl contents in YCL water or due to precipitation of CaSO4 depleting the fluids in Ca2+.
Is important to point out that all YCL waters, except sample Y3, show SO4/Cl ratios >1, which makes Cl the most abundant anion. Following Takano et al. (1997), sulfate within Yugama Lake has two origins: magmatic SO2 gas and biogenic sulfate (Takano et al., 1997). The biogenic sulfate is produced in the soil around Yugama lake, and is transported to the lake within surface meteoric water. This flux is not affected by volcanic activity, and is therefore expected to be approximately stable over years. We observed a decrease in Cl− and SO42− concentrations at YCL, indicating a decreasing flux in the supply of magmatic volatiles.
Figure 6F shows the Na-K/Mg-Ca diagram of Giggenbach (1988) in terms of the major cations applied to the YCL waters. Data are compared with the composition of waters produced through isochemical dissolution of crustal rocks (BA: Basalts; GR: Granite and AC: average crust) and the composition of waters expected for equilibrium with an isochemically recrustallized, thermodynamically stable average crustal rock (Giggenbach 1984, 1988). This figure shows clearly that there is no equilibrium between reservoir rocks and YCL waters. In addition, all samples have Mg/Ca and K/Na ratios similar to those of volcanic rocks and/or magmas with which they are in contact, suggesting that cationic constituents of YCL waters derive dominantly from dissolution of local volcanic rocks or magmas. This diagram also allows us to infer the reservoir temperatures, which in our case would be close to 240°C. Ohba et al. (2000) proposed a hydrothermal model for Kusatsu Shirane volcano in terms of δD, δ18O and Cl− concentrations, in which a high temperature magmatic fluid is mixed with low enthalpy meteoric water, and hydrothermal reservoir separated in vapor and liquid phases, is created at 200°C. This value, also reported in Ohba et al. (2019), is of the same order and close to the value of 240°C previously estimated.
Following Giggenbach (1974) and Ohba et al. (2008), the Mg/Cl ratio is a very valuable geochemical parameter to assess the phreatic activity of Ruapehu, one of New Zealand’s most active volcanoes, and Yugama crater lakes. This is partly because the combination of Mg and Cl concentration eliminates the effect of meteoric water dilution, and temporal variations in this relationship may be due to changes in the magmatic-hydrothermal activity of the volcano. SO4/Cl ratio is also expected to increase before a forthcoming volcanic crisis due to the input of sulphurous magmatic gases into the YCL water. Figure 5G shows the temporal evolution of Mg/Cl together with SO4/Cl since 1966 (data from Minami et al., 1952; Ossaka et al., 1997; , Ohba et al., 2008; Terada et al., 2018). A good temporal correlation between volcanic activity and Mg/Cl ratio is observed. As it was reported by Ohba et al. (2008), the Mg/Cl ratio increased sharply during the eruptive period in 1982–1984. At the activity in 1996, the Mg/Cl ratio showed a synchronized increase. Figure 6G shows that the Mg/Cl and SO4/Cl ratios increase before increases in volcanic activity. In the specific case of the samples taken during the 2013 campaign, a clear increase is observed in both relationships (the squares in Figure 6G represent the maximum measured value of both relationships) to later decrease substantially in 2017 (Terada et al., 2018, stars in Figure 6G). This increase occurs 1 year before the onset of the unrest period (2014–2017), which was characterized by microearthquake swarms, ground deformation, increased water temperature, and changes in the chemical concentrations of the water (Kuwahara et al., 2017; Terada et al., 2018).
Vertical profiles of T and pH did not show variations with depth, indicating the absence of any significant thermal stratification. Figure 5 shows the vertical distribution of the major cations and anions at the three vertical profiles, Crater Wall (CW), Crater 1983 (83-C) and Yugama Crater (YC). In relation to the cations, a significant increase can be observed as the depth increases in the vertical profiles CW and 83-C, mainly in Na, K and Mg. In the YC profile, located close to the center of the YCL, no significant variations are observed. Something similar occurs with anions, in which significant variations are observed in Cl and SO4 but again only in the vertical profiles CW and 83-C. In both, an increase in SO4 with depth is observed, possibly due to the emission of magmatic gases rich in H2S and SO2 and a decrease in Cl. This decrease may be due to greater evaporation in the shallower levels of the YCL, being enriched in conservative ions such as Cl. The small variations observed in the ionic content of the vertical profile YC may be due to the fact that in this area the hydrothermal activity in the bottom of the lake (central depression in Figure 4) is very low compared to CW and 83-C.
The stable isotope data from the waters provide an insight into the various water end-members as well as the evaporation processes in the lake (e.g. Varekamp and Kreulen, 2000) and are also representative of the degree of water-rock interaction, and of boiling and mixing processes (Clark and Fritz, 1997). The δ18O-δD water compositions from YCL collected in this study are compared to the samples collected in 2017 (Terada et al., 2018), from 1988 to 1992 (Ohba et al., 2000), Local Meteoric Water Line (δD = 8δ18O+ 16; Ohba et al., 2000), the Global Meteoric Water Line (GMWL; δD = 8 δ18O+ 10; Craig, 1961) as well as data from medium and strong fumaroles and a magmatic water vapor component (Ohba et al., 2000).
The YCL waters are all enriched in both δD and δ18O (Table 2) relative to local meteoric values in a δD vs δ18O diagram. The YCL waters plot far from the Local Meteoric Line in the δD vs δ18O diagram (Figure 7A). This enrichment in both δD and δ18O relative to the meteoric values may be the result of mixing with volcanic hydrothermal fluids (VHF) and/or evaporation. Ohba et al. (2000) explained the high isotopic ratio of YCL water as a result of a larger degree of evaporation at elevated temperatures, and also by mixing between local meteoric water and an isotopically heavy fluid, such as a high-temperature volcanic gas (HTVG), the andesitic water of Giggenbach (1992). Marked differences are observed between YCL waters collected in 2017 by Terada et al. (2018), samples reported by Ohba et al. (2000) between 1988 and 1992, and this study. Samples collected in 2013 show similar δD values to those sampled in 2017, with values ranging from -48.6‰ to -46‰. However, both set of data differ from the samples collected between 1988 and 1992 (between -66‰ and -50‰). Assuming that meteoric waters during the last 20 years have had a similar isotopic composition, the δD values have shown a clear shift to heavier ratios. This shift towards heavier δD values could be explained by increases in the magmatic water vapor component (andesitic water) and/or changes in evaporation rate because of increased water temperature. Hydrogen exchange between H2S and H2O could be also an explanation for the observed changes. H2S and SO2 have different solubility in water (Symonds et al., 2001), and their relative abundances are mainly controlled by temperature (T), pressure (P) and redox conditions (Giggenbach, 1987). Hydrothermal emissions from the bottom of the crater may have similar H2S and SO2 proportions, and under those conditions, most of SO2 dissolves in water whereas H2S remains insoluble, having more capability to produce a hydrogen isotopic exchange with water (Hernández et al., 2017). This exchange could be produced by higher dissolution of acid gases rich in H2S during the 2013–2017 unrest. δ18O values show significant changes between 2013 and 2017, towards heavier values. This shift (average value of -6.05‰ for 2013 survey and -3.73‰ for 2017 survey) can be explained by an increase in the water-rock interaction processes, again most likely due to the increase in volcanic activity.
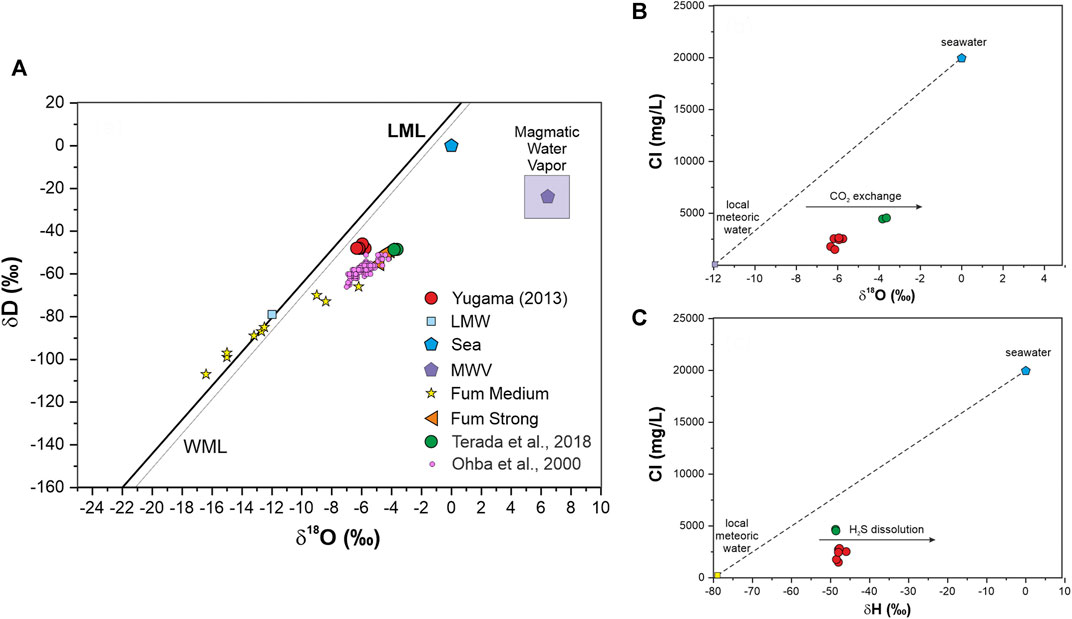
FIGURE 7. (A) Diagram of δ18O vs δD in YCL waters. Data from Ohba et al., 2000 and Terada et al., 2018 are also shown. (B) δ18O vs Cl and (C) δD vs Cl binary diagrams for the YCL water samples collected during August 2013 survey. Also shown are data from Terada et al., 2018.
Data collected before 2013 align along a mixing line with AW and evaporation processes. The data from this 2013 study present a similar direction, but are aligned with heavier values of δD, most likely due to different evaporation scales. Changes in lake and/or air temperature may be responsible for the observed differences. Hydrothermal fluids are probably a mixture of AW and deep meteoric waters, so the water/rock interaction can cause a change of δ18O in addition to the mixing of those fluids with shallow MW in the lake environment. Finally, the δ18O values can be influenced by the rebalancing of CO2 and the equilibrium of H2S. Therefore, the final mixture resulting from all these processes will evaporate, creating a trend in δ18O and δD dependent on local T and H. More detailed analysis of all trends in the Cl—δ18O and Cl-δD and S—δ18O and S—δD diagrams will be necessary to derive which processes are the most important determining stable isotope values.
The distribution of YCL water samples in the Cl− vs δD and Cl− vs δ18O binary diagrams (Figures 7B,C) diverges from the mixing line between an isotopically light meteoric end-member (Yumiike lake sample) and sea water, suggesting the contribution of different isotopically sources. Figure 7B shows a shift in δ18O from 2013 to 2017 water samples towards lighter values, which may represent an increase on CO2 exchange between water and a rich deep-seated CO2 end-member. However, not significant changes are observed for δD, which may indicate similar H2S dissolution rates. Since no data of diffuse CO2 emission are available for 2017, we cannot rule out that other processes may have affected the δ18O isotopic composition. Modelling the evaporation of a mixture with variable proportions of endmembers over time is possible (Varekamp and Kreulen, 2000) but such simulations have many degrees of freedom and may not provide truly new insights (Hernández et al., 2017).
The chemical composition of dissolved gases in samples collected during the August 2013 survey at YCL is shown in Table 2. Figure 8A shows the relative amounts of dissolved H2, O2, CH4, CO2 and He in YCL waters. No significant trend was observed in the H2, O2 and CH4 vertical profiles. However, a clear increase in the concentrations of dissolved gases CO2 and He is observed with depth. Diffuse CO2 emission rate measured at the water surface of YCL (30 ± 12 t d−1) is representative of the observed CO2 content in the water. Assuming an area of 0.66 km2, the normalized diffuse CO2 emission from YCL would be ∼454 t km−2 d−1. This CO2 emission rate value is within the range typical of acid volcanic lakes (average 614.2 t km−2 d−1, Pérez et al., 2011).
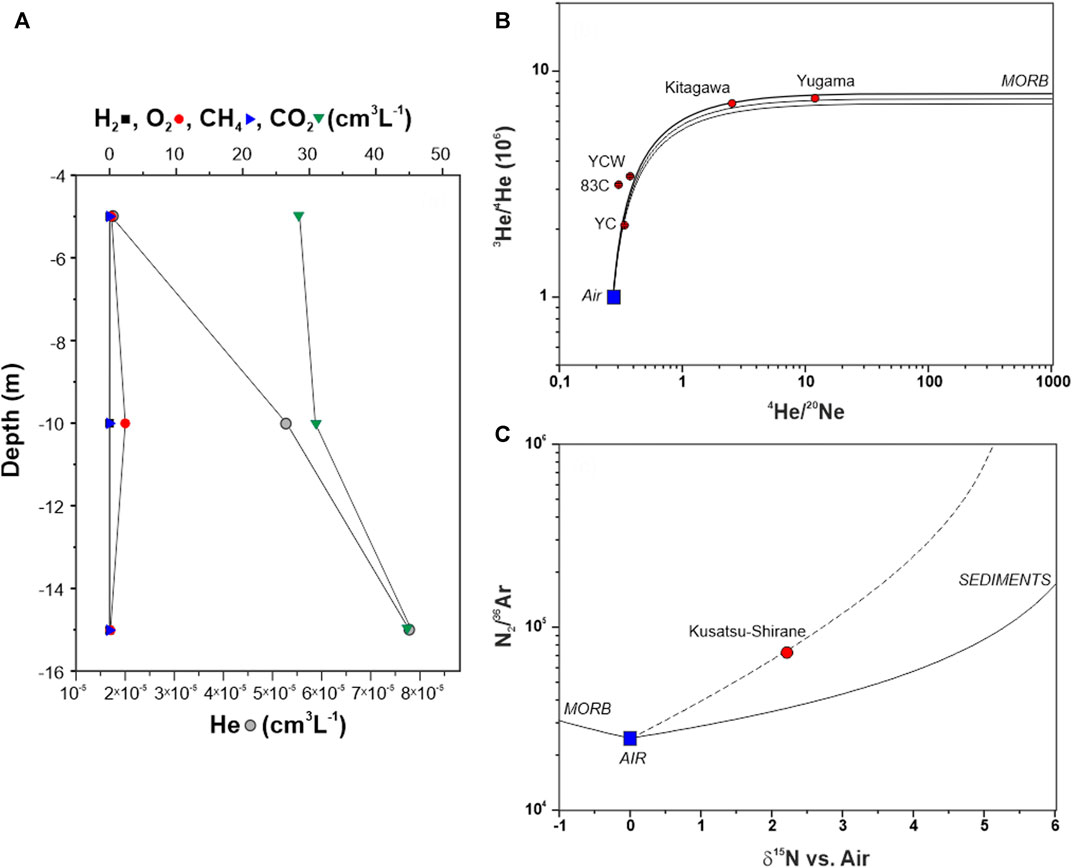
FIGURE 8. Vertical profile 83-C of dissolved gases in YCL waters. (B) Diagram of He isotopes (normalized to the atmosphere) vs 4He/20Ne ratios. The samples represent a mixing between the atmosphere and a mantle type end member. The mixing boundary lines have the following end members: atmosphere (as dissolved air) R/Ra = 1 and He/Ne = 0.285; Mantle R/Ra = 6.5 and He/Ne = 1,000; continental crust R/Ra = 0.01 and He/Ne = 1,000. (C) δ15N vs N2/36Ar diagram. Collected fumarole sample is plotted together with the mixing lines relative to MORB, atmosphere and crustal sediments. Theoretical mixing curves between air and the Kusatsu-Shirane volcanic component (dashed line) are also represented along with Kitagawa and Yugama are fumarole data.
The deepest water sample of 83-C vertical profile also showed discrete enrichments in He (Figure 8A). Assuming that the He concentrations in the YCL can be described by the observed concentration profile, it is possible to estimate the He emissions at the water surface by applying a pure diffusive model (Melián et al., 2016). According to Fick’s law, the gas flux at the surface of the water is driven by the concentration gradients along the depth and the diffusivity of the gas in water:
where Fi is the flux of gas i (in kg m−2 s−1), Di(w) is the diffusion coefficient in water (in m2 s−1), Ci(w) is the concentration of i in water (in kg m−3) and ζ is the depth (in m). For He, we have used a value for DHe(w) at the average temperature of YCL waters (∼25°C) of c. 2.12 × 10⁻⁹ m2 s−1. This value was calculated as an interpolation of the values between 10°C and 20°C reported by Verhallen et al. (1984). The observed concentrations of He at different depths in 83-C vertical profile were fitted with the following exponential decay function:
With the derivative respect to depth at ζ = 0 (lake surface), is possible to estimate the He emission through the water surface (0.066 km2), obtaining a result of 0.012 mg d−1. This value is approximately two orders of magnitude lower that those estimated by Melian et al. (2017), for crater lakes on the island of São Miguel in the Azores. However, this value is subject to uncertainties due to the occurrence of changes in the rate of He input at greater depths. Bubble transfer of He in the CO2 bubbles, which dissolve during ascent, can change the He concentration independently of diffusion in the water column. The reason for this difference could be due to the fact that in YCL most of the gas (in our case He) is emitted into the atmosphere through bubbles and a small portion of this gas is dissolved in the lake water as He is poorly soluble and hence tends to be liberated in the gas phase, i.e. bubble.
The 3He/4He ratios measured in dissolved gases at YCL waters along the vertical profile 83-C range from 208.4 to 3.43 R/Ra (where Ra m is the atmospheric 3He/4He ratio of 1.39 × 10⁻⁶; Mamyrin & Tolstikhin 1984) with 4He/20Ne ratios in the range of 0.30–0.38 (Table 2). Sano et al. (1994) reported the chemical compositions, He/Ne ratios, He and C isotopes of 14 gas samples collected from the YCL, fumaroles and hot springs associated with Kusatsu-Shirane volcano. The 3He/4He and 4He/20/Ne ratios vary from 1.51 to 7.21 Ra and from 0.35 to 11.8, respectively. Fluids from mantle degassing show high R/Ra ratios up to 20 or more in hot spot/plume gases, whereas R/Rair ratios for crustal gases are as low as 0.01 (Craig and Lupton, 1976). The measured 3He/4He values reveal a major contribution from a mantle-type source. Figure 8B shows the diagram of uncorrected R/Ra vs 4He/20Ne values. There is a positive correlation between the 3He/4He and 4He/20Ne ratios suggesting mixing between mantle derived He and atmospheric noble gases. All samples have 3He/4He values above the ASW, and the measured ratios fall on a mixing line between a local mantle type and an atmosphere-derived end member. Data from Kitagawa fumarole and Yugama Lake bubbling (Sano et al., 1994) show that the 3He/4He isotopic ratios remain quite constant at ∼7.5 Ra, indicating that this ratio is characteristic of mantle contribution at Yugama fumarolic discharges and is not affected by atmospheric contamination. YCL is a high activity volcanic lake affected by the addition of significant amounts of hot hydrothermal-magmatic fluids, and advection seems the main physical process responsible of the observed vertical distribution, as observed for other crater lakes e.g., Taal in Philippines (Hernández et al., 2017).
To investigate the origin of the gases emitted by the Yugama crater, a gas sample was taken from a fumarole located on the northern shore of the lake (red square in Figure 2A). In addition to the analysis of the chemical composition of the sample, the isotopic composition of nitrogen was analyzed. Figure 8C shows δ15N vs N2/36Ar together with the mixing lines relative to MORB, atmosphere (AIR-ASW) and crustal sediments. Correlation between observed δ15N value and N2/36Ar ratio (dashed line in Figure 8C) might suggests a mixing trend between air (δ15N = 0‰, N2/36Ar = 2.48×10⁴) and the component of the volcanic gas source at Kusatsu-Shirane volcano, which must be a mixture of magma-derived and crustal components.
Acoustic Plumes
Based on the 200 and 50 kHz echograms, more than 48 vertical acoustic plumes or flares (acoustic signature of bubble plumes) 1.5–22 m in height have been identified sourced from the bottom of the main and secondary crater lakes of Kusatsu-Shirane (Figure 9). Acoustic plumes ranging 12–30 m high are located within the deep holes (DH1 and DH2) whereas numerous minor acoustic plumes 8–9 m high are located at the periphery of the YCL and at the northern peripheral crater (Figure 9). At the same time, horizontal plumes at 2–5 m water depth were identified.
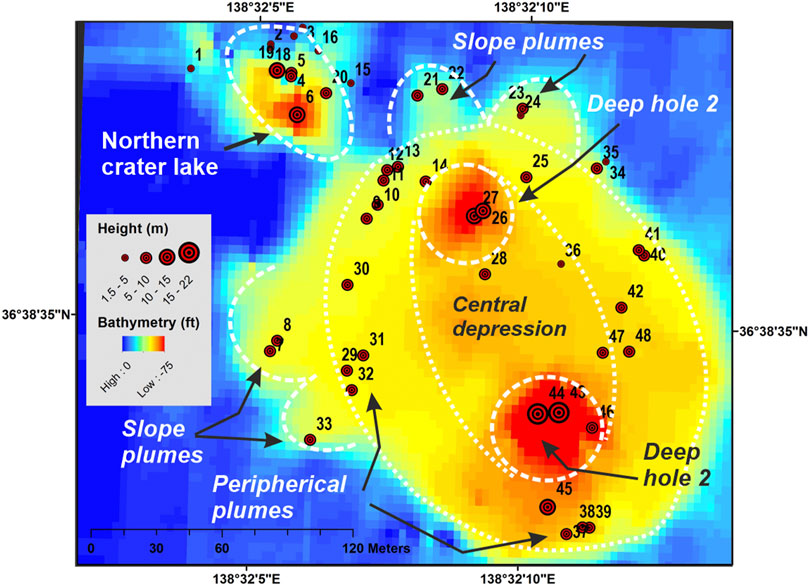
FIGURE 9. Bathymetric map with location and length of acoustic plumes detected on the echogram. Numbers are the identify the plumes shown in the following figures.
Deep Hole 1 (DH1)
Two major acoustic plumes 19–20 m in height are identified sourced from the DH1 hole (Figure 10). These acoustic plumes are separated by 15 m, and are sourced in deep holes at 24.5 and 23.6 m water depths, excavated to almost 12 m below the bottom of the lake. These acoustic plumes have a funnel shape due to their lateral expansion from the source as they ascend. The plume is linked to a sub-horizontal stratified plume located at two to five and 1.3 m below the lake surface (Figure 10) The entire acoustic plume sourced from the DH1 has a mushroom shape, showing a rain of high-backscatter elongated spots detached from the main plumes with descending trajectories, inferred as particles sourced from the deep hole and gravitationally falling to the bottom lake. Low backscatter mounds indicating recent deposits observed on the bottom of the YCL are linked to areas of falling particle material (Figure 10A). Aditionally, lighthouse-like plumes, 12 m in height, are also identified on the flanks of the main depression (Figure 10B, location in Figure 2).
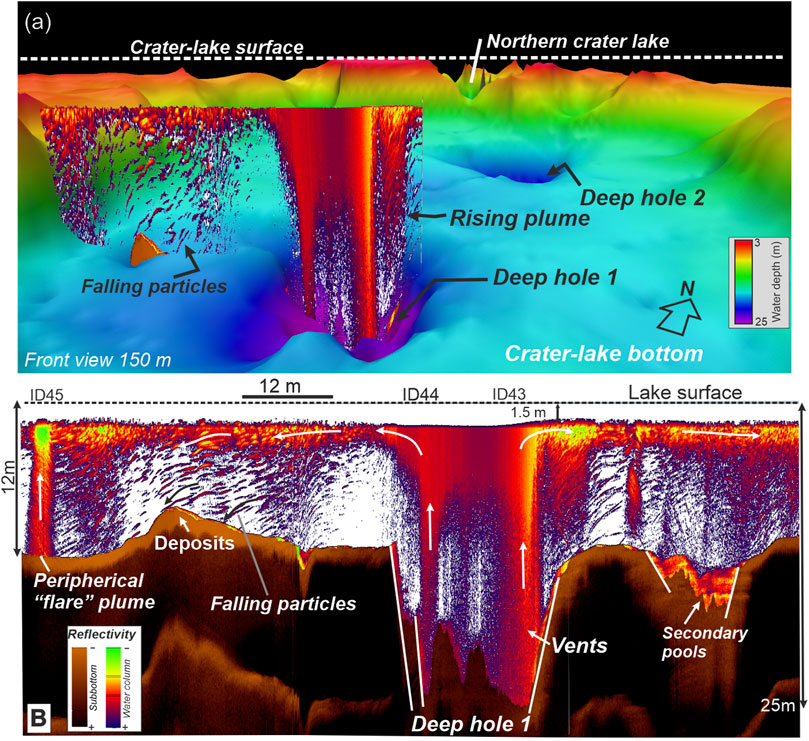
FIGURE 10. (A) Composition of 3D bathymetry and vertical echogram profile crossing the DH1 hole. (B) Echogram crossing the DH1 showing a dense funnel-shaped plume rising from the deep hole DH1. Bright spots sourced from the plumes are falling to the lake bottom. Flare-like plumes are also identified along the flanks of the NW-SE depression. ID location of plumes in Figure 5.
The comparison between the bathymetry of the DH1 obtained with the two frequencies (200 y 50 khZ) allows us to construct a 3D model that relates this deep hole, the acoustic plumes and surrounded bottom deposits (Figure 11). The superposition of the bathymetry data obtained with the two frequencies (Figure 11) shows a series of lobes sourced from the DH1 which is marked by a pronounced peak observed with the 50 kHz frequency. These lobes are interpreted to be non-consolidated recent sediments expulsed by the plume sourced from the DH1 which are detected with the 200 kHz high frequency data but not for the 50 kHz frequency (Figure 11).
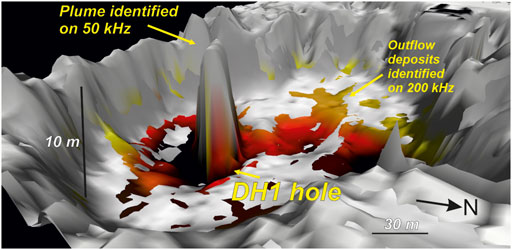
FIGURE 11. 3D view of the DH1 hole obtained by overlaying the two-frequency bathymetric data: 50 kHz in grey scale and 200 kHz in color scales. The peak identified on 50 kHz within the DH1 is interpreted as dense acoustic plume. The red colors surrounding the deep hole and identified on 200 kHz are interpreted as recent deposits formed on the bottom lake, sourced from the plume.
Deep Hole 2 (DH2)
Two giant funnel-shaped acoustic plumes 13–14 m in height and separated by 9 m are identified, with a source at the DH2 hole (Figure 12A). Around the hole, numerous flare-like acoustic plumes 6–7 m in height appear sourced from the flat bottom of the YCL (Figure 11B). Both funnel-shaped and flares acoustic-type plumes appear linked upwards by a continuous stratified plume located at 0.5 and 3 m below the surface of the lake. As occurred around DH1 hole, numerous elongated high-backscatter hotspots with descending trajectories are identified surrounding the DH2 hole (Figure 12A).
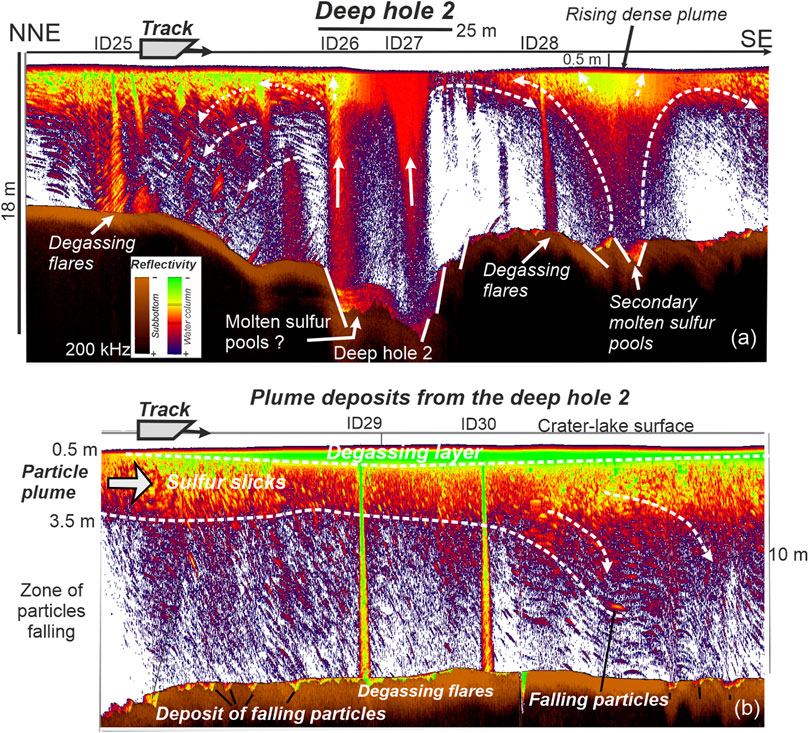
FIGURE 12. (A) Echogram profile crossing DH2 down to 18 m water depth shows high backscatter “funnel”-like plumes rising from the hole; (B) Echogram profile from the central depression (10 m water depth) showing “flare-like” plumes, zones of falling particle material and the stratified sub-horizontal plume.
Mounded-type deposits along the bottom lake associated to falling solid particles.
Mound-type deposits are identified with the echograms along the bottom of the YCL (Figure 13). These mounds are 1–2 m in height and characterized by low-acoustic reflectivity regarding the bottom of the lake. Most of these mounds are located below zones of elongated backscatter hotspots observed within the water column (Figure 13B). Such backscatter anomalies showing descending trajectories (following the track of the boat) interpreted as solid particles falling gravitationally to the bottom of the lake, forming mounds.
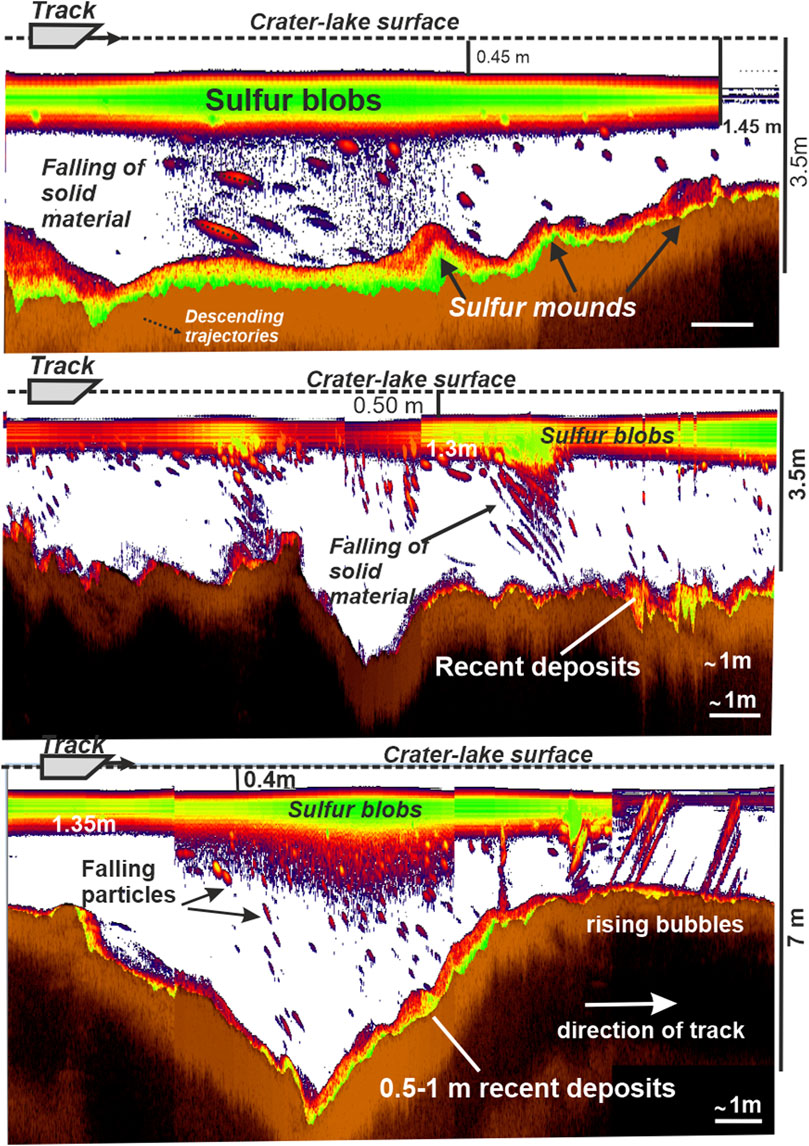
FIGURE 13. Echogram profiles from shallow water zone (3.5–7 m) located along the flanks of the crater lake show the formation of mounded-type deposits by particle material falling from the floating sub-horizontal plumes. Mounded deposits are characterized by low backscatter, in contrast to the high-backscatter values of the volcanic-derived deposits of the bottom lake.
Hydroacoustic Evidence of Subaqueous Molten Sulfur Pools and Sulfur Spherules
Many active crater lakes contain subaqueous molten sulfur pools at the places of highest thermal activity on their lake floors (e.g., Takano et al., 1994). Volcanic gases discharging through the subaqueous molten sulfur pools convey sulphur spherules of various shapes to the lake surface almost continuously. Occurrence of spherules of solid native sulfur up 4–5 mm in diameter with sulfide inclusions (mainly corroded FeS2) are commonly reported in acid carter lakes (e.g., Takano et al., 1994) as: Yugama, Kusatsu-Shirane volcano, Japan; Poás volcano Costa Rica, Crater Lake, Ruapehu volcano, New Zealand; and Bannoe lake and Maly Semiachik, Kamchakta, Russia. Sulphur spherules are most likely produced as hot gases (e.g., H2S or SO2) released at the bottom of the lake create turbulence in pools of liquid suphur.
In the YCL, the most active zones showing effervescence on the lake surface bring up sulfur slicks of various shapes from the subaqueous vents (Ossaka et al., 1980). Since 1805 more than 10 phreatic eruptions have been recorded (Hayakawa and Yui, 1989), often describing ejection of molten sulfur. Based on morphology and mineralogy of the sulfur slicks sampled in the YCL, Takano et al. (1994) propose four stages (I-IV) for the categorization of thermal state of the crater lakes. Stage I: Weak fumarolic activity is restricted to subaqueous vent discharges of low temperature gases (>119°C); Stage II, Moderate fumarolic activity, when temperature of fumarolic gases exceeding 119°C (melting point of orthorhombic sulfur), is high enough to melt sulfur within sulfur- and pyrite-rich bottom lake sediments. Subaqueous molten sulfur pools (d = 1,500–1800 kg/m3) are formed on the lake floor and encrusted with the solidified sulfur layer. Two types of floating spherules are sourced from the bottom lake: 1) Black hollow spherules of sulphur are floating from the deeper higher temperature zones; 2) Yellow, plastic sulfur blobs come from the low temperature region, broken to pieces of thin film as they go up to the lake surface. The broken blobs stick together to form a yellow mat on the lake surface. At this stage, the temperature is not enough to maintain vigorous convention within the molten sulfur pools. Stage III; Frequent mud plumes. Intensive gas discharge and much more active convection of the pool due to the low viscosity H2S, SO2 dissolving liquid sulfur. Sulfur slicks are composed of yellow mats and black hollow spherules (3–5 mm in diameter) with tails in various lengths (a few cm) 3). Sulfur blobs 4) are accumulated around the vents. Immediately after the mud plume 5) eruption, a sheet of white sulfur bubbles 6) is often observed on the lake surface. Stage IV: Phreatic or geyser like eruptions.
We suggest that our hydroacoustic images display most of subaqueous fumarolic activity described by Takano et al. (1994) within YCL, based on the morphology and mineralogy of sulfur slicks. Based on these descriptions, we interpret hydroacoustic images of the morphology of the deep holes DH1 and DH2 as deep depressions filled by low-reflective sediments and molten sulfur pools formed by venting high T volcanic gases through the main vent conduit. Furthermore, intense gas discharges from DH1 are reflected on the dense acoustic plumes venting from the hole, forming vigorous convention cells in the water column. These convective cells, well identified on acoustic images, contain reflective particle material inferred to be black hollow sulfur spherules (3–5 mm in diameters) formed within the molten pools, enough to be detected with the 200 kHz echosounder.
Sediments identified around the DH1 are interpreted as sulfur blobs accumulated around the pools by gravitational falling of particle material within the ascending mud plume. These plumes ascend almost to the surface, only ∼1 m below, and may cause the effervescence observed at the lake surface.
From our hydroacoustic images, DH1 seems more active, formed by higher temperature fumarolic activity than DH2, with a strong peak anomaly identified only on 50 kHz and attributed to a dense plume of (pyrite-enriched?) sulfur spherules and muds sourced from the molten sulfur pool.
Based on the work of Takano et al. (1994), we agree that the plumes sourced from the two deep holes (DH1 and DH2) are formed by fluids at temperature >150°C due to the presence of gravitationally accumulated sulfur blobs around the vents from strong convection currents. According to the Takano et al. (1994) model, the formation and accumulation of heavy black hollow spherules around the molten sulfur pools take place only during the Stage III. Increase in the pressure of these plumes may cause the black mud plumes with an elevation of up 5 m above the lake surface as identified in the YCL. Otherwise, at this stage, yellow sulfur tail spherules up to a few centimeters form floating sulfur slicks at the lake surface.
Mound Sulfurs Formed From Sinking of Floating Sulfur Spherules
The floating sulfur slicks of spherules progressively lose their buoyancy, and fall to the shallow-water bottom lake. These types of sub-aqueous sulfur mounds have been reported in exhumed zones of the Waiotapu geothermal area, Rotorua, New Zealand (Simmons et al., 1993). Mounds are > 2 m high and composed of small (<0.5 cm) hollow spheres, and occasionally teardrop-shaped globules resulting from rapid deposition of sulfur globules formed when fumarolic gases are discharged through molten sulfur pools. The morphology of these floating teardrops spherules is similar to that of those tailed spherules described in the YCL for the Stage III (Takano et al., 1994). Thus, based on hydroacoustic images, the formation of sulfur mounds takes place in shallow-water areas (3–5 m water depth) of the crater-lake, as a consequence of rapid deposition of sulfur globules detaching from floating sulfur blobs.
Conclusion
One of the most notable findings in our study is the identification and characterization of the main areas of magmatic-hydrothermal fluid discharges at the bottom of YCL. Our data indicate a strong input of a hot volcanic fluid rich in S and other volatiles. Among them and due to the acidity of the lake waters, most of the CO2 and He are emitted in a visible form (bubbling). Chemical and isotopic composition of YCL waters showed a potential relationship with changes in volcanic activity, with increases on the Mg/Cl and SO4/Cl ratios before the 2013–2017 unrest and changes in the δ18O and dH values to heavier ones when the 2013 data are compared with the 2017 data, due possibly to an increase in magmatic water vapor component (andesitic water) and/or changes in evaporation rate because of increased water temperature.
Major cations and anions dissolved in YCL water and the distribution of dissolved CO2 and He gases in the water column show a clear inhomogeneous distribution. The lake water contains contributions of meteoric water and magmatic-hydrothermal fluids. Contents of chemical species in the lake are considerably higher near the lake bottom as a consequence of strong water-rock interaction due to hydrothermal fluid discharges into the lake. The strong emission of magmatic gases also affects the chemistry of the lake. This study allowed us to estimate for the first time the diffuse CO2 emission from YCL at 30 ± 12 t d−1, with a normalized CO2 emission rate of 454 t km−2 d−1, assuming an area of 0.066 km2, within the range of acid volcanic lakes.
Intense degassing from the bottom lake of the YCL is observed on hydroacoustic images. Based on a comparison between the geochemical and mineralogical model of Takano et al. (1994) and our hydroacoustic images of subaqueous fumarole activity, we conclude that the deep holes (DH1 and DH2), 35–40 m in diameter and 20–25 m incised into the bottom of the lake, are interpreted as molten sulfur pools formed on the lake floor by high T degassing. Acoustic plumes, 20–25 m in height, are dense plumes including particle material and hollow spherules of solidified molten sulfur formed by volcanic gasses passing through the molten sulfur pools. Rain of these particles around the deep holes is interpreted as falling sulfur blobs rapidly accumulated around the molten sulfur pools. High-density particles enable rapid gravitational deposition around the vents, and are formed of heavy black spherules (pyrite-enriched) formed only at temperatures >150°C of the molten sulfur pools (Takano et al., 1994). Buoyant acoustic plumes identified 0.5–3 m below the lake surface are interpreted as floating yellow sulfur tail spherules, forming visible sulfur slicks at the lake surface.
Mounds, 1–2 m high, identified along the bottom of shallow water parts of the crater lakes and associated with falling particles released from sub-stratified plumes are interpreted as sulfur mounds by rapid deposition of yellow sulfur spherules. These types of sub-aqueous sulfur mounds have never been reported in modern crater lakes by echosounder imaging. In agreement with the model of Takano et al. (1994), we propose that the fumarolic temperature of the deep holes must be > 150°C to enable the formation of a rain of heavy black spherules around the vents the molten sulfur viscosity increases. Finally, the fumarolic activity of the deep holes of the YCL, at the time of the survey, was at Stage III. Otherwise, peripheral shallow-water parts showed only degassing flare-like plumes related to Stage I. The activity of the YCL is mainly focused on the two deep holes identified on hydroacoustic images.
This study greatly contributes to a better understanding of the dynamics of the YCL, identifying the areas of major hydrothermal activity and serving as the basis for future studies that will help to improve the early warning system of the volcano monitoring program for Kusatsu-Shirane volcano.
Data Availability Statements
The geochemical data supporting this study are stored on servers at ITER and can be made available by reasonable arrangement with the corresponding author.
Author Contributions
PH participated in planning of the survey, field work, chemical and isotopic analysis of samples, treatment of data and writing the manuscript. KN participated in planning of the survey, field work, and writing the manuscript. LS participated in treatment of echosounding data and writing the manuscript. EP, TM, and YK participated in the field work. CA, GM, and HS participated in the chemical and isotopic analysis of samples. NP participated in writing the manuscript.
Funding
This research was financed by the Japan Society for the Promotion of Science (Fellow’s ID No: L13527) and the projects TFvolcano and TFassistance of the Program Tenerife INNOVA, Cabildo Insular de Tenerife.
Conflict of Interest
The authors declare that the research was conducted in the absence of any commercial or financial relationships that could be construed as a potential conflict of interest.
Publisher’s Note
All claims expressed in this article are solely those of the authors and do not necessarily represent those of their affiliated organizations, or those of the publisher, the editors, and the reviewers. Any product that may be evaluated in this article, or claim that may be made by its manufacturer, is not guaranteed or endorsed by the publisher.
Acknowledgments
Thanks to Beverley Coldwell for assistance with the written English.
References
Alçiçek, H., Bülbül, A., Brogi, A., Liotta, D., Ruggieri, G., Capezzuoli, E., et al. (2018). Origin, Evolution and Geothermometry of the thermal Waters in the Gölemezli Geothermal Field, Denizli Basin (SW Anatolia, Turkey). J. Volcanology Geothermal Res. 349, 1–30. doi:10.1016/j.jvolgeores.2017.07.021
Arpa, M. C., Hernández, P. A., Padrón, E., Reniva, P., Padilla, G. D., Bariso, E., et al. (2013). Geochemical Evidence of Magma Intrusion Inferred from Diffuse CO2 Emissions and Fumarole Plume Chemistry: the 2010-2011 Volcanic Unrest at Taal Volcano, Philippines. Bull. Volcanol. 75 (747). doi:10.1007/s00445-013-0747-9
Burton, M. R., Sawyer, G. M., and Granieri, D. (2013). 11. Deep Carbon Emissions from Volcanoes. Earth. Rev. Min. Geochem. 75, 323–354. doi:10.1515/9781501508318-013
Capasso, G., Favara, R., and Inguaggiato, S. (2000). Interaction between Fumarolic Gases and thermal Groundwaters at Vulcano Island (Italy): Evidences from Chemical Composition of Dissolved Gases in Waters. J. Volcanology Geothermal Res. 102, 309–318. doi:10.1016/s0377-0273(00)00193-1
Capasso, G., and Inguaggiato, S. (1998). A Simple Method for the Determination of Dissolved Gases in Natural Waters. An Application to thermal Waters from Vulcano Island. Appl. Geochem. 13, 631–642. doi:10.1016/s0883-2927(97)00109-1
Cardellini, C., Chiodini, G., and Frondini, F. (2003). Application of Stochastic Simulation to CO2 Flux from Soil: Mapping and Quantification of Gas Release. J. Geophys. Res. 108 (B9), 2425. doi:10.1029/2002jb002165
Caudron, C., Mazot, A., and Bernard, A. (2012). Carbon Dioxide Dynamics in Kelud Volcanic lake. J. Geophys. Res. 117, a–n. doi:10.1029/2011JB008806
Clark, I. D., and Fritz, P. (1997). Environmental Isotopes in Hydrogeology. New York: Lewis Publishers.
Craig, H. (1961). Isotopic Variations in Meteoric Waters. Science 133, 1702–1703. doi:10.1126/science.133.3465.1702
Craig, H., and Lupton, J. E. (1976). Primordial Neon, Helium, and Hydrogen in Oceanic Basalts. Earth Planet. Sci. Lett. 31, 369–385. doi:10.1016/0012-821x(76)90118-7
Deutsch, C. V., and Journel, A. G. (1998). GSLIB: Geostatistical Software Library and User Guide. 2nd ed. New York: Oxford University Press.
Evans, W. C., White, L. D., Tuttle, M. L., Kling, G. W., Tanyileke, G., and Michel, R. L. (1994). Six Years of Change at Lake Nyos, Cameroon, Yield Clues to the Past and Cautions for the Future. Geochem. J. 28, 139–162. doi:10.2343/geochemj.28.139
Giggenbach, W. F. (1988). Geothermal Solute Equilibria. Derivation of Na-K-Mg-Ca Geoindicators. Geochimica et Cosmochimica Acta 52, 2749–2765. doi:10.1016/0016-7037(88)90143-3
Giggenbach, W. F. (1992). Isotopic Shifts in Waters from Geothermal and Volcanic Systems along Convergent Plate Boundaries and Their Origin. Earth Planet. Sci. Lett. 113, 495–510. doi:10.1016/0012-821x(92)90127-h
Giggenbach, W. F. (1984). Mass Transfer in Hydrothermal Alteration Systems-A Conceptual Approach. Geochimica et Cosmochimica Acta 48, 2693–2711. doi:10.1016/0016-7037(84)90317-x
Giggenbach, W. F. (1987). Redox Processes Governing the Chemistry of Fumarolic Gas Discharges from White Island, New Zealand. Appl. Geochem. 2, 143–161. doi:10.1016/0883-2927(87)90030-8
Giggenbach, W. (1974). The Chemistry of Crater lake, Mt. Ruapehu (New Zealand) during and after the 1971 Active Period. N. Z. J. Sci. 17, 33–45.
Grassa, F., Capasso, G., Oliveri, Y., Sollami, A., Carreira, P., Rosário Carvalho, M., et al. (2010). Nitrogen Isotopes Determination in Natural Gas: Analytical Method and First Results on Magmatic, Hydrothermal and Soil Gas Samples. Isotopes Environ. Health Stud. 46 (2), 141–155. doi:10.1080/10256016.2010.491914
Greinert, J., Artemov, Y., Egorov, V., Debatist, M., and McGinnis, D. (2006). 1300-m-high Rising Bubbles from Mud Volcanoes at 2080m in the Black Sea: Hydroacoustic Characteristics and Temporal Variability. Earth Planet. Sci. Lett. 244, 1–15. doi:10.1016/j.epsl.2006.02.011
Han, D. N., Liang, X., Jin, M. G., Currell, M. J., Song, X. F., and Liu, C. M. (2010). Evolution of Groundwater Hydrochemical Characteristic and Mixing Behavior in the Daying and Qicum Geothermal Systems, Xinzhou Basin. J. Volcanol. Geotherm. Res. 189, 99–104. doi:10.1016/j.jvolgeores.2009.10.011
Hayakawa, Y., and Yui, M. (1989). Eruptive History of the Kusatsu Shirane Volcano. Daiyonki-kenkyu 28, 1–17. (in Japanese). doi:10.4116/jaqua.28.1
Hernández, P. A., Melián, G. V., Somoza, L., Arpa, M. C., Pérez, N. M., Bariso, E., et al. (2017). The Acid Crater lake of Taal Volcano, Philippines: Hydrogeochemical and Hydroacoustic Data Related to the 2010-11 Volcanic Unrest. Geol. Soc. Lond. Spec. Publications 437, 131–152. doi:10.1144/SP437.17
Hernández, P. A., Mori, T., Padrón, E., Sumino, H., and Pérez, N. (2011). Carbon Dioxide Emission from Katanuma Volcanic lake, Japan. Earth Planet. Sp 63 (11), 1151–1156. doi:10.5047/eps.2011.06.038
Jolie, E. (2019). Detecting Gas-Rich Hydrothermal Vents in Ngozi Crater Lake Using Integrated Exploration Tools. Sci. Rep. 9, 12164. doi:10.1038/s41598-019-48576-5
Kling, G. W., Evans, W. C., Tanyileke, G., Kusakabe, M., Ohba, T., Yoshida, Y., et al. (2005). From the Cover: Degassing Lakes Nyos and Monoun: Defusing Certain Disaster. Proc. Natl. Acad. Sci. 102, 14185–14190. doi:10.1073/pnas.0502274102
Kusakabe, M., Ohba, T., Issa, S. A., Yoshida, Y., Satake, H., Ohizumi, T., et al. (2008). Evolution of CO2 in Lakes Monoun and Nyos, Cameroon, before and during Controlled Degassing. Geochem. J. 42, 93–118. doi:10.2343/geochemj.42.93
Kuwahara, T., Terada, A., Ohba, T., Yukutake, Y., Kanda, W., and Ogawa, Y. (2017). Geosci. Union and Ame. Geophys. Union Joint Meet 2017 Abstr: SVC48-02.A Hydrothermal System of Kusatsu-Shirane Volcano Inferred from Cl Concentrations and Stable Isotope Ratios of Yugama Crater lake Water, Japan
Le Guern, F., and Sigvaldason, G. E. (1989). The Lake Nyos Event and Natural CO2 Degassing, I. J. Volcanol. Geotherm. Res. 39, 95–275.
Le Guern, F., and Sigvaldason, G. E. (1990). The Lake Nyos Event and Natural CO2 Degassing, II. J. Volcanol. Geotherm. Res. 42, 307–404.
Matsuda, J., MatsumotoSumino, T., Sumino, H., Nagao, K., Yamamoto, J., Miura, Y., et al. (2002). The 3He/4He Ratio of the New Internal He Standard of Japan (HESJ). Geochem. J. 36, 191–195. doi:10.2343/geochemj.36.191
Mazot, A., and Taran, Y. (2009). CO2 Flux from the Volcanic lake of El Chichón (Mexico). Geofísica Int. 48 (1), 73–83. doi:10.22201/igeof.00167169p.2009.48.1.100
Melián, G., Somoza, L., Padrón, E., Pérez, N. M., Hernández, P. A., Sumino, H., et al. (2016). Surface CO2 Emission and Rising Bubble Plumes from Degassing of Crater Lakes in São Miguel Island, Azores. Geol. Soc. Lond. Spec. Publications 437, 233–252. doi:10.1144/SP437.14
Michard, G. (1990). Behaviour of Major Elements and Some Trace Elements (Li, Rb, Cs, Sr, Fe, Mn, W, F) in Deep Hot Waters from Granitic Areas. Chem. Geology. 89, 117–134. doi:10.1016/0009-2541(90)90062-c
Minami, E., Yamagata, N., Shima, M., and Saijô, Y. (1952). Crater Lake "Yugama" of Volcano Kusatsu-Shirane. I. Jpn. J. Limnol. 16, 1–5. (in Japanese). doi:10.3739/rikusui.16.1
Ohba, T., Hirabayashi, J.-i., and Nogami, K. (2008). Temporal Changes in the Chemistry of lake Water within Yugama Crater, Kusatsu-Shirane Volcano, Japan: Implications for the Evolution of the Magmatic Hydrothermal System. J. Volcanology Geothermal Res. 178, 131–144. doi:10.1016/j.jvolgeores.2008.06.015
Ohba, T., Hirabayashi, J.-i., and Nogami, K. (1994). Water, Heat and Chloride Budgets of the Crater lake, Yugama at Kusatsu-Shirane Volcano, Japan. Geochem. J. 28, 217–231. doi:10.2343/geochemj.28.217
Ohba, T., Hirabayashi, J., and Nogami, K. (2000). D/H and 18 O/16 O Ratios of Water in the Crater lake at Kusatsu-Shirane Volcano, Japan. J. Volcanology Geothermal Res. 97, 329–346. doi:10.1016/s0377-0273(99)00169-9
Ohba, T., Yaguchi, M., Nishino, K., Numanami, N., Tsunogai, U., Ito, M., et al. (2019). Time Variation in the Chemical and Isotopic Composition of Fumarolic Gasses at Kusatsu-Shirane Volcano, Japan. Front. Earth Sci. 7, 249. doi:10.3389/feart.2019.00249
Ossaka, J., Ossaka, T., Oi, T., Kikawada, K., Yamano, M., Hukuhara, H., et al. (1997). Volcanic Activity of Kusatsu-Shirane Volcano, Gunma, and Secular Change in Water Quality of Crater lake, Yugama. Chikyukagaku 31, 119–128. (in Japanese).
Ossaka, J., Ozawa, T., Nomara, T., Ossaka, T., Hirabayashi, J., Takaesu, A., et al. (1980). Variation of Chemical Compositions in Volcanic Gases and Water at Kusatsu-Shirane Volcano and its Activity in 1976. Bull. Volcanol. 43 (1), 207–216. doi:10.1007/bf02597622
Padrón, E., Hernández, P. A., Toulkeridis, T., Pérez, N. M., Marrero, R., Melián, G., et al. (2008). Diffuse CO2 Emission Rate from Pululahua and the lake-filled Cuicocha Calderas, Ecuador. J. Volcanology Geothermal Res. 176, 163–169. doi:10.1016/j.jvolgeores.2007.11.023
Padrón, E., Pérez, N. M., Hernández, P. A., Sumino, H., Melián, G. V., Barrancos, J., et al. (2013). Diffusive Helium Emissions as a Precursory Sign of Volcanic Unrest. Geology 41, 539–542. doi:10.1130/g34027.1
Parkinson, K. J. (1981). An Improved Method for Measuring Soil Respiration in the Field. J. Appl. Ecol. 18, 221–228. doi:10.2307/2402491
Pérez, N. M., Hernández, P. A., Padilla, G., Nolasco, D., Barrancos, J., Melían, G., et al. (2011). Global CO2 Emission from Volcanic Lakes. Geology 39 (3), 235–238. doi:10.1130/G3158610.1130/g31586.1
Rouwet, D. (2021). “Volcanic lake Dynamics and Related Hazards,” in Book Chapter in: Volcanic Hazards, Risks and Disasters. Editor P. Papale (Elsevier). doi:10.1016/b978-0-12-818082-2.00011-1
Sano, Y., Hirabayashi, J.-I., Oba, T., and Gamo, T. (1994). Carbon and Helium Isotopic Ratios at Kusatsu-Shirane Volcano, Japan. Appl. Geochem. 9 (4), 371–377. doi:10.1016/0883-2927(94)90059-0
Sigurdsson, H., Devine, J. D., Tchua, F. M., Presser, F. M., Pringle, M. K. W., and Evans, W. C. (1987). Origin of the Lethal Gas Burst from Lake Monoun, Cameroun. J. Volcanology Geothermal Res. 31, 1–16. doi:10.1016/0377-0273(87)90002-3
Sigvaldason, G. E. (1989). International Conference on Lake Nyos Disaster, Yaoundé, Cameroon 16-20 March, 1987: Conclusions and Recommendations. J. Volcanology Geothermal Res. 39, 97–107. doi:10.1016/0377-0273(89)90050-4
Simmons, S. F., Keywood, M., Scott, B. J., and Keam, R. F. (1993). Irreversible Change of the Rotomahana-Waimangu Hydrothermal System (New Zealand) as a Consequence of a Volcanic Eruption. Geol 21, 643–646. doi:10.1130/0091-7613(1993)021<0643:icotrw>2.3.co;2
Sinclair, A. J. (1974). Selection of Threshold Values in Geochemical Data Using Probability Graphs. J. Geochemical Exploration 3, 129–149. doi:10.1016/0375-6742(74)90030-2
Sugimura, A. (1960). Zonal Arrangement of Some Geophysical and Petrological Features in Japan and its Environs. J. Fac. Sci. Univ. Tokyo Sec. 12, 133–153.
Sugisaki, R., and Taki, K. (1987). Simplified Analyses of He, Ne, and Ar Dissolved in Natural Waters. Geochem. J. 21, 23–27. doi:10.2343/geochemj.21.23
Sumino, H., Nagao, K., and Notsu, K. (2001). Highly Sensitive and Precise Measurement of Helium Isotopes Using a Mass Spectrometer with Double Collector System. J. Mass. Spectrom. Soc. Jpn. 49, 61–68. doi:10.5702/massspec.49.61
Takano, B., Koshida, M., Fujiwara, Y., Sugimori, K., and Takayanagi, S. (1997). Influence of Sulfur-Oxidizing Bacteria on the Budget of Sulfate in Yugama Crater lake, Kusatsu-Shirane Volcano, Japan. Biogeochemistry 38, 227–253. doi:10.1023/a:1005805100834
Takano, B., Saitoh, H., and Takano, E. (1994). Geochemical Implications of Subaqueous Molten Sulfur at Yugama Crater lake, Kusatsu-Shirane Volcano, Japan. Geochem. J. 28, 199–216. doi:10.2343/geochemj.28.199
Terada, A., and Hashimoto, T. (2017). Variety and Sustainability of Volcanic Lakes: Response to Subaqueous thermal Activity Predicted by a Numerical Model. J. Geophys. Res. Solid Earth 122, 6108–6130. doi:10.1002/2017JB014387
Terada, A., Morita, Y., Hashimoto, T., Mori, T., Ohba, T., Yaguchi, M., et al. (20182018). Water Sampling Using a Drone at Yugama Crater lake, Kusatsu-Shirane Volcano, Japan. Earth Planets Space 70, 64. doi:10.1186/s40623-018-0835-3
Varekamp, J. C., and Kreulen, R. (2000). The Stable Isotope Geochemistry of Volcanic Lakes, with Examples from Indonesia. J. Volcanology Geothermal Res. 97, 309–327. doi:10.1016/s0377-0273(99)00175-4
Varekamp, J. C. (2015). “The Chemical Composition and Evolution of Volcanic Lakes,” in Volcanic Lakes. Adv. Volcanol. Editors D. Rouwet, B. Christenson, F. Tassi, and J. Vandemeulebrouck (Berlin, Heidelberg: Springer), 93–123. doi:10.1007/978-3-642-36833-2_4
Verhallen, P. T. H. M., Oomen, L. J. P., Elsen, A. J. J. M. v. d., Kruger, J., and Fortuin, J. M. H. (1984). The Diffusion Coefficients of Helium, Hydrogen, Oxygen and Nitrogen in Water Determined from the Permeability of a Stagnant Liquid Layer in the Quasi-S. Chem. Eng. Sci. 39, 1535–1541. doi:10.1016/0009-2509(84)80082-2
Keywords: Yugama crater lake, diffuse degassing, echosounding, kusatsu-shirane, hydrochemical
Citation: Hernández PA, Nogami K, Padrón E, Somoza L, Amonte C, Mori T, Melián GV, Sumino H, Kikawada Y and Pérez NM (2021) Hydrochemical and Hydroacoustic Investigation of the Yugama Acid Crater Lake, Kusatsu-Shirane, Japan. Front. Earth Sci. 9:741795. doi: 10.3389/feart.2021.741795
Received: 15 July 2021; Accepted: 15 November 2021;
Published: 17 December 2021.
Edited by:
Dmitri Rouwet, Istituto Nazionale di Geofisica e Vulcanologia, sezione di Bologna, ItalyCopyright © 2021 Hernández, Nogami, Padrón, Somoza, Amonte, Mori, Melián, Sumino, Kikawada and Pérez. This is an open-access article distributed under the terms of the Creative Commons Attribution License (CC BY). The use, distribution or reproduction in other forums is permitted, provided the original author(s) and the copyright owner(s) are credited and that the original publication in this journal is cited, in accordance with accepted academic practice. No use, distribution or reproduction is permitted which does not comply with these terms.
*Correspondence: Pedro A. Hernández, cGhkZXpAaXRlci5lcw==