
94% of researchers rate our articles as excellent or good
Learn more about the work of our research integrity team to safeguard the quality of each article we publish.
Find out more
ORIGINAL RESEARCH article
Front. Earth Sci. , 17 December 2021
Sec. Cryospheric Sciences
Volume 9 - 2021 | https://doi.org/10.3389/feart.2021.741556
This article is part of the Research Topic Yedoma Permafrost Landscapes as Past Archives, Present and Future Change Areas View all 27 articles
 Kanayim Teshebaeva1*
 Ko J. van Huissteden1
 Helmut Echtler2Alexander V. Puzanov3Dmitry N. Balykin3Anton I. Sinitsky4
 Nelley M. Kovalevskaya3
 Han A. J. Dolman1
We investigate permafrost surface features revealed from satellite radar data in the Siberian arctic at the Yamal peninsula. Surface dynamics analysis based on SRTM and TanDEM-X DEMs shows up to 2 m net loss of surface relief between 2000 and 2014 indicating a highly dynamic landscape. Surface features for the past 14 years reflect an increase in small stream channels and a number of new lakes that developed, likely caused by permafrost thaw. We used Sentinel-1 SAR imagery to measure permafrost surface changes. Owing to limited observation data we analyzed only 2 years. The InSAR time-series has detected surface displacements in three distinct spatial locations during 2017 and 2018. At these three locations, 60–120 mm/yr rates of seasonal surface permafrost changes are observed. Spatial location of seasonal ground displacements aligns well with lithology. One of them is located on marine sediments and is linked to anthropogenic impact on permafrost stability. Two other areas are located within alluvial sediments and are at the top of topographic elevated zones. We discuss the influence of the geologic environment and the potential effect of local upwelling of gas. These combined analyses of InSAR time-series with analysis of geomorphic features from DEMs present an important tool for continuous process monitoring of surface dynamics as part of a global warming risk assessment.
Rapid thaw of permafrost, by climate warming, has huge impacts on natural environments, human activities, and global climate in the Arctic. Ice-rich permafrost thaw is causing soil subsidence and has a devastating effect on infrastructure (Anisimov et al., 2014; Nauta et al., 2015; French, 2017; Hjort et al., 2018). Despite recent intensifying research in Arctic environments, these hold still strong surprises for us, shown by the recent discoveries of CH4 emitting outburst craters in the permafrost.
The feedbacks of permafrost degradation on climate, such as the Arctic carbon feedback, and in land surface changes still require better quantification (Schuur et al., 2015). This scientific challenge calls for innovative methods to measure permafrost change over large areas. Some of recent studies used Synthetic Aperture Radar Interferometry (InSAR) to quantify permafrost surface changes (Liu et al., 2010, Liu et al., 2015 X.; Chen et al., 2013; Short et al., 2014; Bartsch et al., 2019).
The focus of this study is an area of 2014 outburst crater on the Yamal peninsula in Western Siberia (Leibman et al., 2014a; Olenchenko et al., 2015; Kizyakov et al., 2017). The crater is located in close vicinity of the Bovanenkovo gas condensate field and is formed by a powerful release of natural gas in the permafrost structure (Leibman et al., 2014a).
Detailed assessment of permafrost thaw progression and impact of extreme years using the InSAR technique have been applied by Bartsch et al. (2019) in the central Yamal. This study evaluated InSAR observations with meteorological data, borehole temperature, active-layer thickness measurements, and land-cover classification.
The InSAR technique has the potential for monitoring near-surface permafrost processes and seasonal variations. However, permafrost is a subsurface phenomenon and is still difficult to monitor due to the complexity of the exchange system that includes differences in soil properties and surface cover (Zhang et al., 2004; Duguay et al., 2005).
The objective of our study is to locate areas of active surface displacement and infer surface processes related to permafrost thaw, using InSAR time-series at regional scale. We correlate InSAR observations with available geomorphological and geological data and on-site data collection. To better understand permafrost thaw and landscape evolution in the region we combine this with information on geological subsurface structure that may interact with surface processes. We hypothesize two possibilities on the origin of the surface subsidence and degradation in the region. The first hypothesis is based on classical heterogeneous ice distribution in subsiding zones: higher ice content causing high thaw and subsidence potential. Second, we hypothesize that the natural gas seepage from a deep origin contributes to subsurface heat flow and steep thermal gradients, causing higher temperatures or thaw of the permafrost layer from the subsurface.
The study area is located near the Bovanenkovo gas field in the central part of the Yamal peninsula (Figure 1). The Yamal peninsula is situated northeast of the Ural mountain and is the polar extension at the northwestern rim of the West Siberian basin. The West Siberian basin is a huge sedimentary basin formed by almost continuous subsidence during Mesozoic and Tertiary (Zonenshain et al., 1990; Puchkov, 1997). The pre-mesozoic basement integrates various tectonic terranes accreted during the Late Paleozoic (Late Devonian–Permian) closing of oceanic basins and collision of the Siberian and Kazakh terranes with the eastward subducted eastern margin of the Russian platform and Baltica, the North European Craton (Echtler et al., 1996).
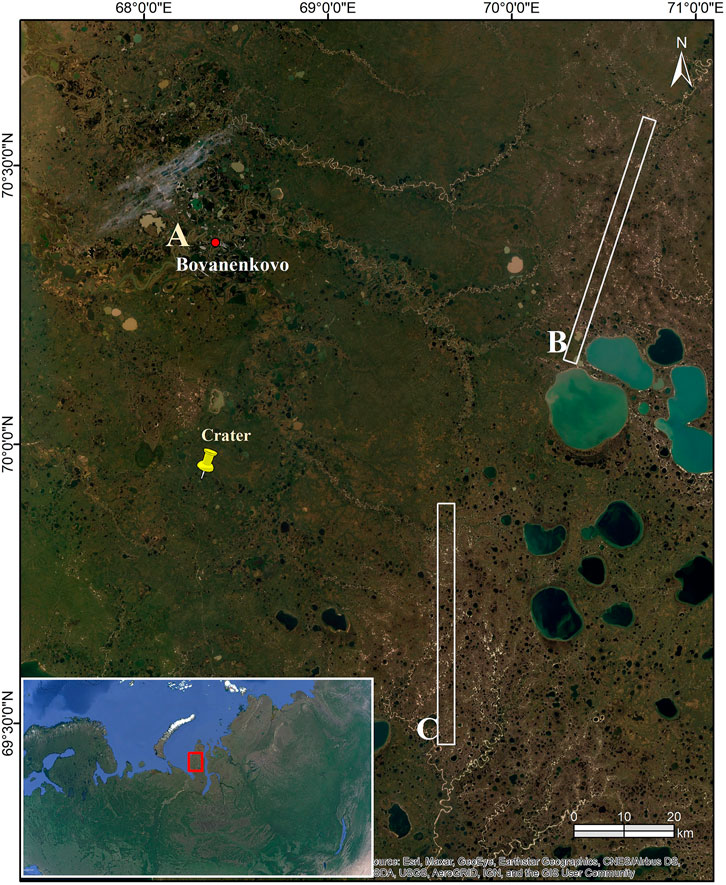
FIGURE 1. Study area located in the Yamal peninsula of the western Siberia. The map is based on optical Landsat data showing location of the Bovanenkovo field and 2014 crater.
The mesozoic evolution of the West Siberian Basin is dominated by significant subsidence and marine transgression after late and post-orogenic continental rifting. Marine basin evolution prevailed during Jurassic and Cretaceous times. During Aptian, Albian, and Cenomanian stages shallow-marine to paralic marine sedimentation dominate in the western part of the West Siberian basin (Ulmishek, 2003). These formations are the source of important hydrocarbon and gas fields.
During the Cenozoic period the major phases of alpidic orogeny e.g. the India-Eurasia collision along the south of the Eurasian continent, the northern West Siberian basin experienced uplift and erosion that continued until Middle Pliocene (Ulmishek, 2003; Volkova, 2014). Since Late Pliocene the geologic evolution and morphology was dominated by glacial dynamics with significant sea-level changes as well as ice extension. On the Yamal peninsula unconsolidated glacial marine and terrestrial sediments overlie older erosional surfaces (Chuvilin et al., 2000; Astakhov, 2004, 2011; Volkova, 2014). The Pleistocene deposits consist of mainly glacial deposits with marine, fluvio-glacial, and alluvial clastic sediments of up to 300 m thickness (Figure 2). Glacial and interglacial sedimentary processes e.g. erosion and deposition, the permafrost dynamics related to climate dynamics possibly moderate active tectonics (Forman et al., 2002) shape the Yamal peninsula since recent times and need to be considered in understanding the actual surface processes. The unconsolidated youngest sediments are subject to slide, creep, collapse, and talus formations and solifluction that are typical representatives of the cryogenic formations at surface.
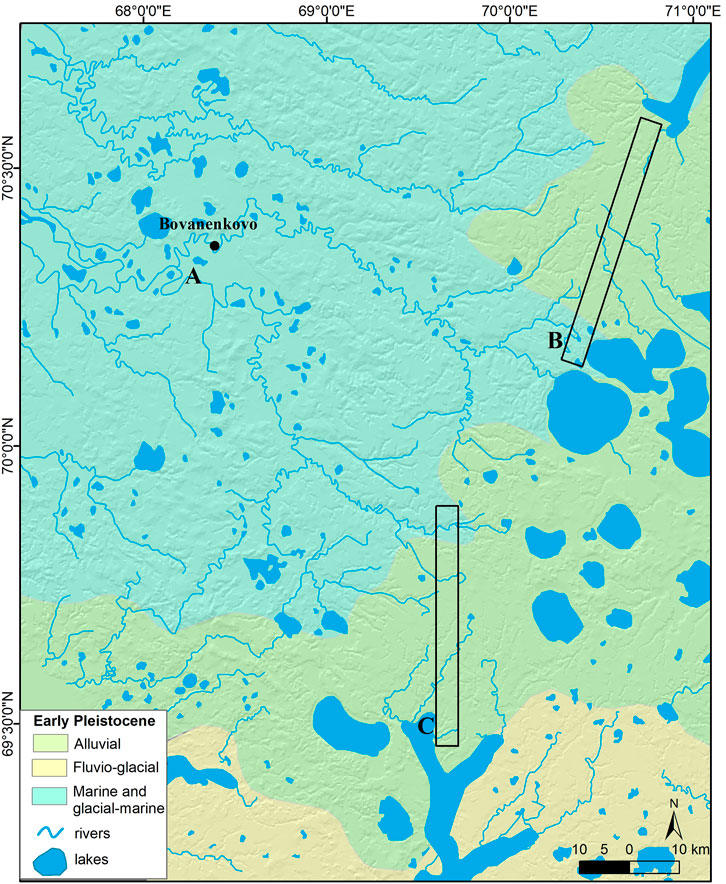
FIGURE 2. Geology map of the study area. The map is modified after Food and Agriculture Organization (FAO) of the United Nations project defined geology map of the western Siberia.
Our study area is characterized by continuous permafrost. The thickness of the permafrost layer is up to 300 m in river valleys and about 250 m in hilly terrains. The mean annual temperature is between −2 to −7°C at 10 m depth (Chuvilin et al., 2000). The stratigraphic record on western Yamal peninsula shows active ice-wedge growth accompanied by active eolian and alluvial sedimentation during the Weichsel Glacial Stage (Forman et al., 2002).
The permafrost layer is enriched in organic matter in the region. The upper part is represented by layers of peat and plant remains (detritus). The lower part is represented by thin lignite beds and inclusions of organic matter.
Substantial summer warming (2–4°C) on the Yamal peninsula since the early Holocene resulted in permafrost degradation and increase of the layer above permafrost (active layer), enabling the establishment of trees (Forman et al., 2002). This degradation of permafrost is recognized across Eurasia and associated with substantially warmer summer temperatures, and enhanced since industrial times (Anisimov and Nelson, 1996; MacDonald et al., 2000, 2007).
Northward extension of treeline has been documented on Yamal peninsula and across Eurasia, reflecting a poleward shift of the boreal forest (MacDonald et al., 2007). The birch trees were subsumed by the start of peat growth and reflect a rising water table with permafrost aggradation. Peat accumulation occurred throughout the Holocene and continues today in one-to 2 m-deep depressions in eolian sand. Sources for eolian sand are denuded hilltops associated with reindeer overgrazing, erosion, and fluvial and wind-driven discharge (Forman et al., 2002).
The SAR dataset used in this study was acquired by the Sentinel -1 A/B C-band (∼5.7 cm wavelength) satellite sensor, covering the seasonal time period from June to October for 2017 and 2018. We used 18 Sentinel-1A/B IW SLC SAR images acquired in descending orbits with an incidence angle of 37–39 and a pixel spacing of 2.3 × 14.1 m (range × azimuth).
A Digital Elevation Model (DEM) from TanDEM-X mission is used for InSAR processing, with 90 m spatial resolution. TanDEM-X (TerraSAR-X add-on for Digital Elevation Measurements) is an Earth observation radar mission that consists of a SAR interferometer built by two almost identical satellites flying in close formation. With a typical separation between the satellites of 120–500 m a global DEM has been generated (Wessel et al., 2018). Along with TanDEM-X DEM from 2014 we used SRTM (Shuttle Radar Topographic Mission) DEM from 2000 (Jarvis et al., 2008), at 90 m spatial resolution data for morphology analysis.
SAR interferometry (InSAR) has proven to be a valuable geodetic tool, which scans the Earth surface regularly revisiting the same area. The InSAR technique exploits multiple SAR images and applies appropriate data processing and analysis procedures to separate the contribution of the phase caused by the deformation from the other phase components. The technique focuses on the identification of pixels in the SAR image characterized by small noise, related to properties of reflectors with radar response dominated by a strong reflecting object, and that remains constant over time (Persistent Scatterer, PS) (Ferretti et al., 2001). The PS technique is most accurate for mitigating atmospheric delay with high spatial resolution in SAR interferograms (Onn and Zebker, 2006; Perissin et al., 2011a).
We apply the persistent scatterer interferometry (PSI) method implemented in SARPROZ (Perissin, 2015). The SARPROZ can handle individual swaths of TOPSAR data and estimate the Atmospheric Phase Screen (APS) to improve the quality of the phase signal (Perissin et al., 2011b). Only PS points with a coherence value larger than 0.75 were used in further analyses.
PS candidates were chosen by applying threshold on the Amplitude Stability Index >0.75, following the standard PS InSAR processing (Ferretti et al., 2001). The topographic phase has been removed using TanDEM-X 90 m DEM (Wessel et al., 2018). For the selected points, height and displacement were estimated and deformation time-series were reconstructed. The PS time-series were estimated by assuming a linear displacement in time gaps and minimizing the offset between datasets.
InSAR time-series results comprise a large number of point data; to detect areas of locally enhanced changes we perform hot-spot and cluster analysis. Two statistical approaches are used for hot-spot and cluster analysis, the Getis-Ord Gi statistic (Getis and Ord, 2010) and kernel-density estimation (Silverman, 2018). The spatial clusters of similar values and significant spatial clustering of data are identified.
We apply hot-spot analyses on the mean velocity values. For each point feature in a dataset the Getis-Ord Gi* statistics are calculated. The spatial pattern is analyzed for each feature within the context of its neighbors. The Getis-Ord Gi* statistics requires neighbors to have elevated values. A point feature with a high value needs to be surrounded by similar values to be considered as a statistically significant hot spot. The local sum of a point feature is compared proportionally to the sum of all point features. If the local sum is different, a statistically significant z-score is assigned to that point. The z-score values identify spatial clustering of point features with high or low values. The kernel-density estimator is performed on spatial clusters of point features with high and low values. The kernel-density estimator is used to convert a large number of point data into several hotspots. The result is a smooth kernel-density map.
The parametric characterization of the relief and topography are essential to interpret surface dynamics. The parameter called openness is an expression degree of dominance or enclosure of localized irregular surface. Openness represents an angular measure of relation between surface relief and horizontal distance calculated from multiple zenith and nadir angles. Openness has two viewer perspectives: positive and negative. The positive openness is high for convex forms and represents values above the surrounding surface. The negative openness is high for concave forms and represents values below the surrounding surface (Yokoyama et al., 2002). We perform topography openness analysis on TanDEM-X and SRTM DEMs.
The results derived from Sentinel-1 InSAR time-series are the mean LOS (Line-of-Sight) seasonal velocities for 2017 and 2018 (Figure 3). The displacement rates were 60–120 mm/year and found mainly in the vicinity of Bovanenkovo settlement (Figure 3). We identified spatially clustered areas of high values of surface dynamics (hot spots), and their spatial evolution during the monitoring shows net subsidence in the three distinguished zones. They are located at the west and east part of our test area and were highlighted as A, B, and C zones (Figure 4). All three hotspots are characterized by their circular and centered geometry at the map scale (Figure 4). This geometry raises questions on the processes behind these outstanding features.
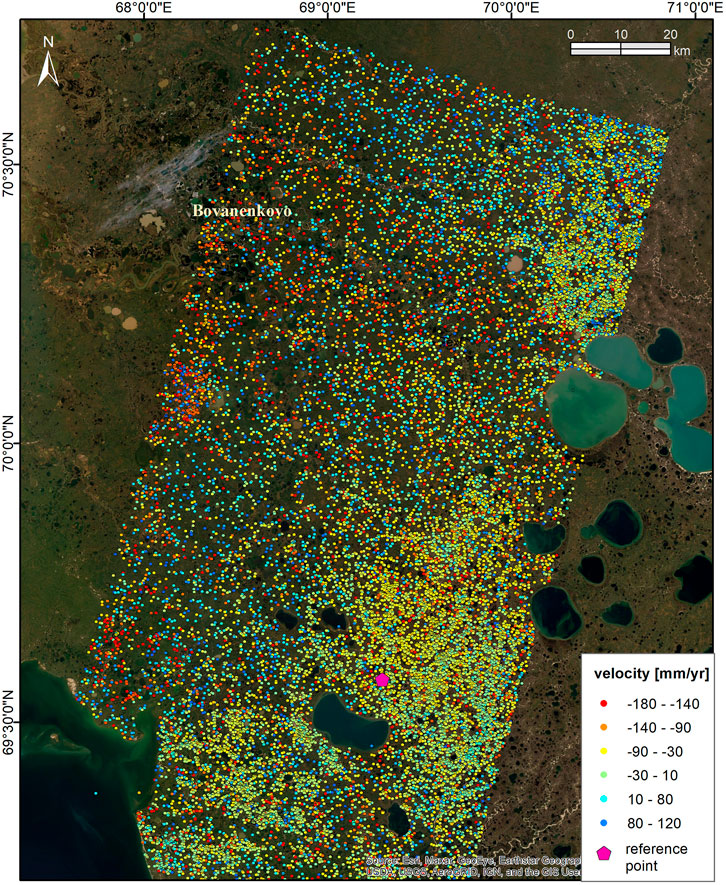
FIGURE 3. Results of time-series InSAR analysis, colors show spatial pattern of seasonal subsidence velocity for June-October 2017–2018.
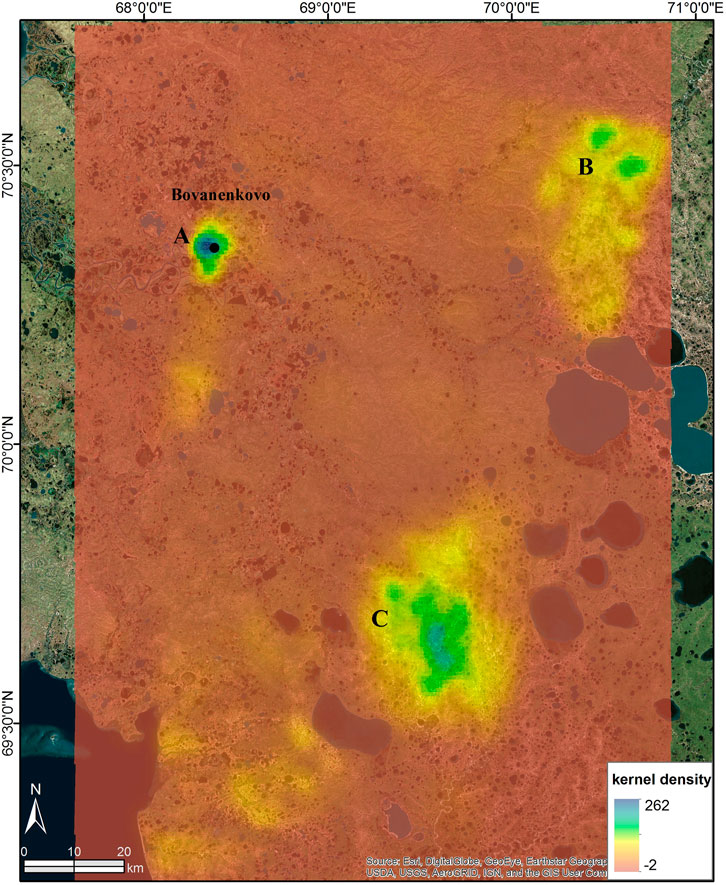
FIGURE 4. Hotspot cluster kernel-density map showing smoothed spatial location of hotspot clusters in zones (A,B) and (C). Analysis highlights areas of spatially correlative regions as high kernel-density values in blue. Hotspot analysis was performed on InSAR LOS velocities (cf. Figure 3).
Zone A is located within area of Bovanenkovo settlement and gas field. It is subsiding with a mean velocity of approximately 120 mm/year. Zone A exhibits spatial dimensions of approximately 12 km length and 8 km width of enhanced subsidence (Figures 4, 5). Zone B is located to the east with subsiding rates of approximately 60 mm/year (Figure 3). It has a spatial extension of approximately 41 km. Zone C is located south of the study area with a spatial dimension of 36 km (Figures 3, 4). Zone C is subsiding with velocities of up to 70 mm/year. Both structures with anomalous subsidence rates are centered at topographic high in a smooth low-relief landscape (Figure 5). The subsiding rate of zone A is twice as high as that of B and C zones (Figure 6).
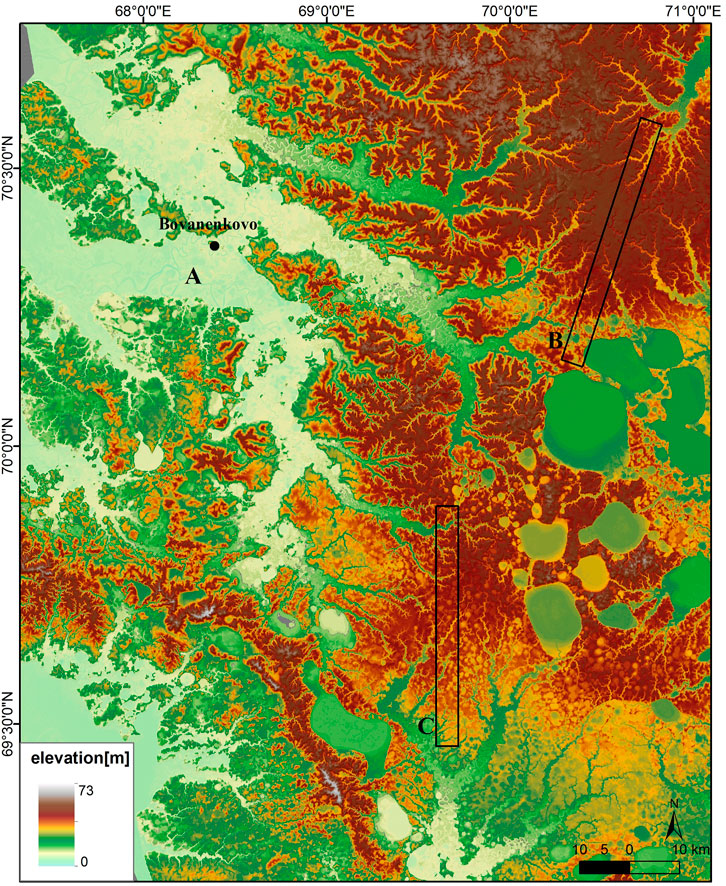
FIGURE 5. TanDEM-X DEM elevation data 90 m resolution. The map shows the location of the subsiding zones (A,B) and (C) at different altitudes.
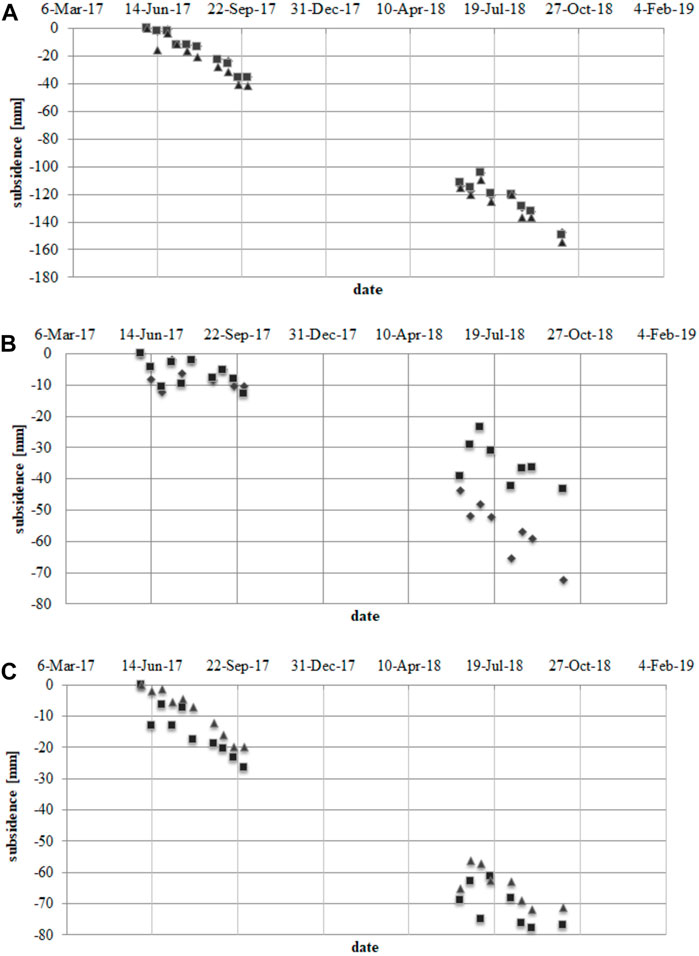
FIGURE 6. InSAR time-series showing gradual seasonal subsidence for (A,B) and (C) zones (Figures 3, 4, 6). This analysis reveals that zone (A) is subsiding with higher rates relative to (B) and (C) zones.
The time-series of the detected deformations between June-September 2017 and 2018 based on date-to-date LOS displacements is plotted in Figure 6. The deformation signal in all plots is a continuous LOS deformation with a gradual increase in signal from season to season. Plot A shows a seasonal displacement signal that gradually increases up to 160 mm, while plots B and C show differences up to 70 and 80 mm in the temporal evolution between the deformation signals. The signal indicates that the subsidence in these areas is associated with the seasonal thawing process and the evacuation of meltwater and associated sediment erosion.
The geomorphic setting of zone A is low lands at elevations around 3 m a.s.l. Structures B and C represent topographic highs at 25–50 m a.s.l. (Figures 5, 7, 8). We analyzed two swath profiles across hotspot B and C zones (Figures 7, 8) derived from SRTM and TanDEM-X DEMs. Based on these profiles, we examined the surface topography change along these profiles. Profiles B and C across the defined subsidence zones show mean 2 m surface topography elevation change for time period 2000–2014, indicating net elevation loss of approximately 2 m over 14 years (Figures 7, 8). This suggests that InSAR defined subsiding B and C zones are an area with active surface dynamics with erosion likely related to permafrost degradation (Khomutov and Leibman, 2014).
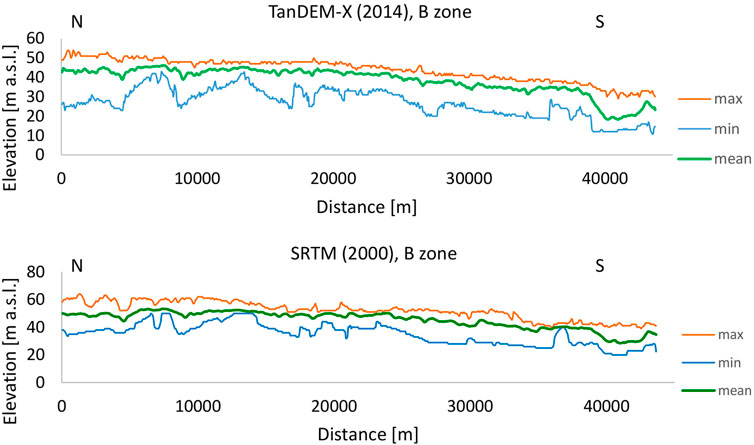
FIGURE 7. North-South swath profiles across hot spot zone B. Elevation min, max, and mean values are derived from TanDEM-X and SRTM DEM data. The mean elevation values show up to 2 m net mass loss over 14 years.
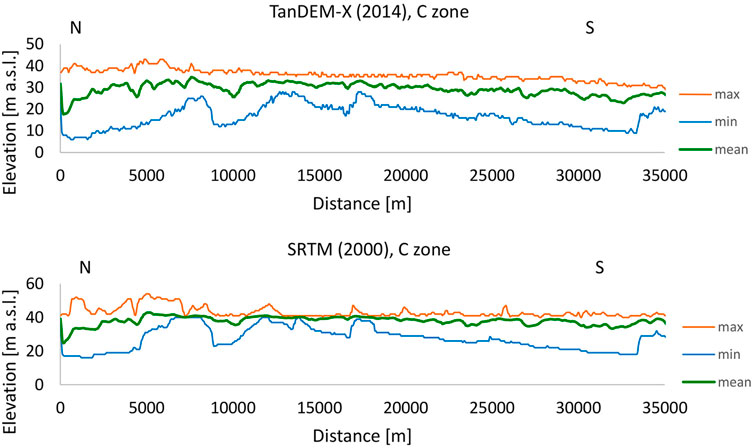
FIGURE 8. North-South swath profiles across the hot spot zone C. Elevation min, max, and mean values are derived from TanDEM-X and SRTM DEM data. The mean elevation values up to 2 m net mass loss over 14 years.
The surface topography openness analyses from SRTM and TanDEM-X DEMs reveal a highly dynamic landscape. The analyses show change in permafrost surface within 14 years associated with denudation and degradation (Figures 9, 10).
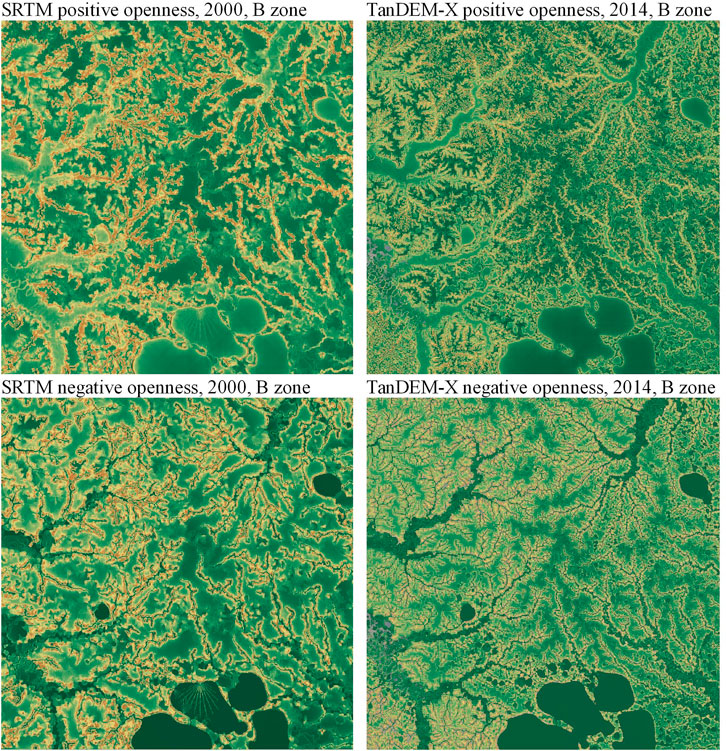
FIGURE 9. SRTM and TanDEM-X DEMs openness metric showing surface relief changes over 14 years for B zone. Positive openness highlights the drainage network changes. Negative openness highlights the shape of lakes and formation of new lakes.
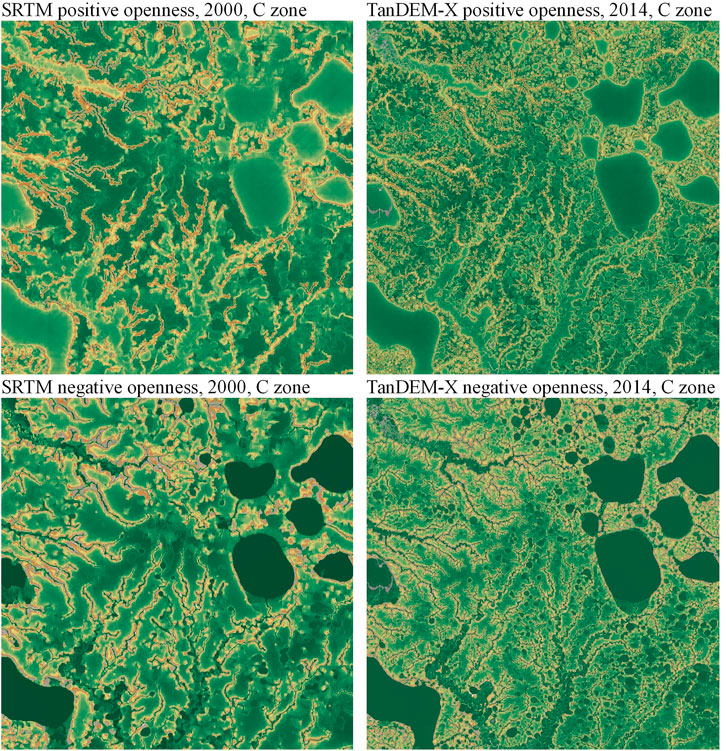
FIGURE 10. SRTM and TanDEM-X DEMs openness metric showing surface relief changes over 14 years for C zone. Positive openness highlights the drainage network changes. Negative openness highlights the shape of lakes and formation of new lakes.
The hotspot zone B shows a clear extension of the drainage network of the rivers and gullies (Figure 9). The C zone shows very striking lakes that are extending in surface and number; all larger lakes in NE are increasing in size and many small lakes show migration toward the west (Figure 10). Hotspot B shows a number of little lakes only in its center (Figure 9).
In zone C all the lakes are becoming connected forming a larger basin, with sedimentation of fluvial and lacustrine deposits, with an interesting evolution of larger sediment influx from river hydrographic systems. Within 14 years the river deltas and valleys are getting deeper and broader, as also revealed from profiles (Figures 7, 8).
Compared to zone B, in C zone old and newly formed lakes provide markers of ongoing surface processes. The rise of lake water level likely occurs as a consequence of enhanced thawing and degradation of permafrost along lake banks and/or runoff related to drainage basin water balance changes. The erosion of thin and instable soil (Figure 12), solifluction and development of gullies, ravines, and rivers is progressing upward in the topography to where our subsidence hotspots are located.
The PS-InSAR technique is a powerful tool to measure displacements of moving ground objects from time-series of SAR images to millimeter precision (Colesanti et al., 2003). It is not so straightforward to exactly identify individual objects acting as persistent scatterers in the SAR images over a remote permafrost region. With this technique, suited for remote permafrost areas with the absence of ground control, it can be assumed that the displacements of the objects reflecting the radar signal address the evolution of the surface.
To identify the interaction with the subsurface of remote permafrost displacement patterns can be challenging and different hypotheses should be tested. In the present study, we verified whether the observed slow subsidence in Yamal peninsula can be explained by specific geomorphic/geologic settings and/or result of anthropogenic impact.
The temporal evolution of the analyzed subsidence rates in zone A around the Bovanenkovo field shows significant higher rates compared to B and C zones (Figures 3, 6). The higher rates of permafrost thaw around zone A are highly likely related to infrastructure and settlements (Teshebaeva et al., 2020). Studies have demonstrated that expansion of human activity as settlements and gas extraction have major impact on permafrost thaw and subsidence (Raynolds et al., 2014; Liu L. et al., 2015; Hjort et al., 2018). B and C zones show rates between 40 and 60 mm/yr of summer surface changes related to permafrost thaw. These rates are in accordance with the rates found by Bartsch et al. (2019) in central Yamal.
In addition, zone A is underlain by fine-grained marine deposits subsiding faster, probably because the silty-clay sediments are likely to have a higher ice content (Figure 2). The ground ice in the area has been detected by geophysical surveys (Olenchenko et al., 2015). The soils are also characterized by a high content of fine-grained clastics and in consequence a predominance of larger amounts of segregation ice in the transition zone at the top of the permafrost. The glacial marine sediments in the region are thin-tabular bedded, gray, and dark gray sand and clay (Figure 11) (Chuvilin et al., 2000; Astakhov, 2004; Volkova, 2014). The ice content is the main parameter in the dynamic permafrost environment and can be a challenge to interpret subsiding zones. According to Astakhov (2011) the glacial and inter-glacial sediments are mostly ice-bound unconsolidated alluvial sediments integrating moraines, fluvio-glacial or loess-like deposits (Figures 2, 11, 14).
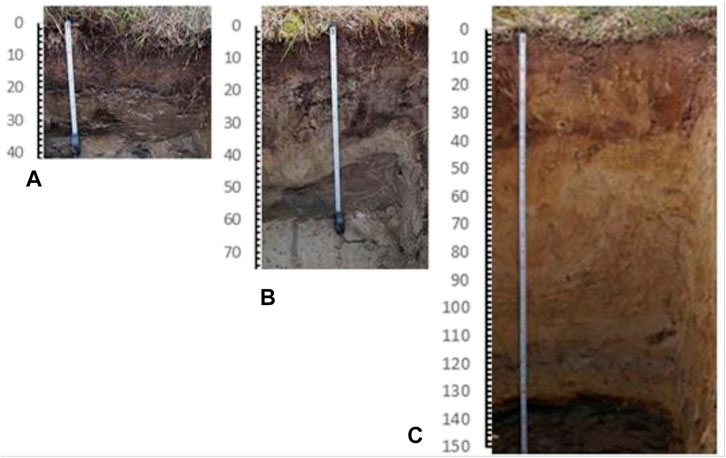
FIGURE 11. Field campaign August 2017, soil profiles showing the depth of active layer 40–150 cm of the test site. (A) Histic Crysol with permafrost occurring at 40 cm consists of horizons: of decomposed organic matter and peat; and mineral gray to bluish soil with light loam texture, sand. (B) Histic Crysol with permafrost occurring at 70 cm consists of horizons: soil consist of peat; the mineral heterogeneous in color, gray with dark spots and light loam texture; unconsolidated Earth material with gray sandy loam texture. (C) Eutric Cryosols with permafrost occurring at 150 cm depth. The soil consists of horizons: mineral dark brown loam texture with fine-grained sand; yellow brown to dark brown sand; light brown sand (Photos: Balykin Dima).
The subsidence rates in B and C zones are close to half of that of A zone. In B and C zones, predominantly glacial alluvial deposits with more homogenous and coarser grainsize and ice wedges with higher ice content (Figures 2, 11). The alluvial and glacial deposits dominating in our B and C zones are distinguished by their type of ice distribution. Composition and structure of the glacial and glacio-fluvial deposits vary significantly. Thus, unsorted moraine clastics are typical of glacial landscapes consisting of blocs, boulders, and gravel with sandy, silty, and clay-rich materials, with different types of cryogenic ice structures and a high to variable ice content (30%), whereas smaller grainsize size formations of fluvial, lacustrine, or eolian sediments vary less in ice content and permafrost geometries.
To consider the geomorphic/geologic setting of the study areas is essential in our understanding of the analyzed active surface processes. The cryogenic structures of deposits of the internal floodplain of zone A are closely connected with the polygon-ridge aspect of its surface and the topography and hydrographic system of channels, levees, and flood basins (Anisimov et al., 2014; Leibman et al., 2014b; Kizyakov et al., 2017).
The subsidence zones are correlated with lithology of the area (Figure 2). Zone A is located in the area of marine deposits, B and C zones in the transition of alluvial above marine deposits. Figure 11 shows soil profiles: the first two profiles are marine deposits and the third profile is alluvial deposits. The soils profiles show evidence of intense frost interaction (cryoturbation) and gleying processes in the region. The total carbon content in mineral horizons of soils varies from 0.1 to 1.6% and very low nitrogen content (Balykin et al., 2019). Soil profiles also revealed the active layer within study area that varies up to 40 cm in marine deposits and up to 150 cm in alluvial deposits from field work observations during early September 2017 (Figure 11).
The B and C subsiding hotspots are located at the apex of smooth cone-type topographic elevations and show a distinct morphologic pattern with regard to the hydrographic system. Zone B is characterized by water discharge in runoff oriented radial in all directions from top and the main subsidence center (Figure 9). The C shows a distinct N-S oriented water divide across the hotspot separating surface water runoff. The runoff system is oriented from East to West in the western segment and from North to South in the eastern segment (Figures 10, 14). We relate these features to the specific geologic settings. Area C contains the transition of terrestrial alluvial to underlying glacial marine deposits (Figure 13). The alluvial terrestrial deposits are likely related with N-S propagation and retreat of glaciers, whereas the marine sequences are controlled by inherited E-W oriented sedimentary settings.
The geomorphologic analysis of the surface hydrographic system of area C for the period between 2000 and 2014 shows a very distinctive and net progressive evolution with a clear differentiation to higher order drainage channels and a striking increase of eroded and evacuated material (Figure 12). This observation infers continuous discharge of water from thawing of the subsurface ice and associated erosion and redeposition of the unconsolidated coarse sediments in adjacent lakes and rivers within the limits of available data (Figure 12). Along with slide, creep, collapse, and talus formations there are thaw slumps and solifluction that are typical representatives of cryogenic formations (Figure 12) (Leibman et al., 2003; Leibman et al., 2014b). This underlines active continuous denudation by erosion and sediment evacuation associated with meltwater runoff.
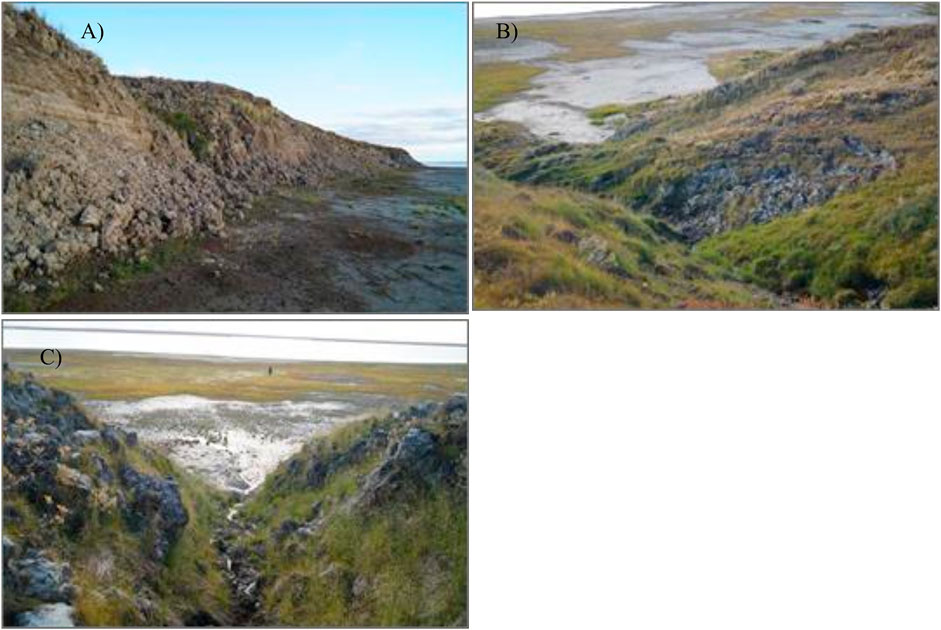
FIGURE 12. Field campaign August 2018. (A) Sedimentation layer showing lake level in the past compared to present lake level. (B) Erosion, instability of the slopes, landslides within unconsolidated sediment layers. (C) Gullies showing seasonal incision due to permafrost melt in the study area (Photos: Anton Sinitskiy).
We propose two hypotheses on the origin of the denudation and subsidence processes that we analyzed.
Hypothesis I is classically based on heterogeneous ice distribution with higher ice content causing the higher thaw potential in such subsidence zones.
The B and C zones are located within higher topographically elevated areas (Figure 5). The common approach is, to assume that such morphological features are associated with varying permafrost extent and ice content. In addition, the dominant lithology in B and C are alluvial and glacial deposits. These deposits are first distinguished by the type of their freezing and ice accumulation in permafrost regions. The deposits have characteristic and distinctive cryogenic structures with development of ice wedges, which are varying in size and geometries. The subsurface consists of terrestrial moraine, the dominant alluvial sedimentary cover, and geomorphological features are characterized by linear geometry (Figure 13). Our interpretation is that the higher ice content in moraine type formations is associated with higher thawing rates and in turn erosion tends to be associated with typical moraine relief. Field observations would be necessary to further investigate these aspects of surface processes.
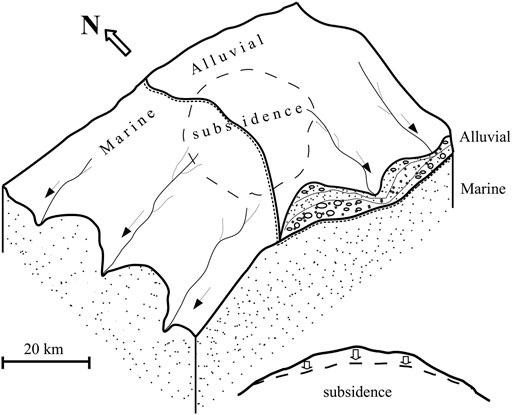
FIGURE 13. 3D scheme of C zone with different lithology depending on the hydrographic system. The subsiding area at the topographic height. NS runoff in alluvial may be triggered sedimentary structures in marine segment. EW runoff controlled by inherited currents of the nearshore unconsolidated deposits.
Thereon we bring forward another hypothesis II on the genesis of the presented hotspots of denudation. Here, we discuss permafrost thaw at subsiding B and C zones due to the ascent of natural gas of deep origin stacked below an impermeable permafrost layer (Figure 14) (Skorobogatov et al., 1998). The continuously accumulating gas adds heat to the permafrost from below, resulting in a steeper geothermal gradient. This could result in a stronger impact of climate warming on ice-rich permafrost with more thawing and denudation. In this idea our presented B and C subsidence zones would represent hypothetic gas-accumulating structures causing surface thawing and denudation.
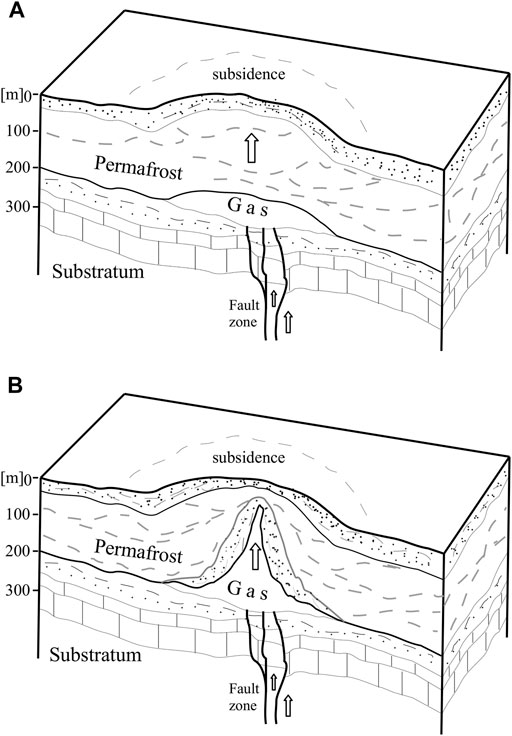
FIGURE 14. 3D scheme representing pre-stages of possible outburst events due to ancient deep origin natural gas. Scheme (A) shows gas accumulation below the impermeable permafrost layer. The overpressure gas causes uplift at surface and triggers localized observed area of subsidence. Scheme (B) presents pre-outburst evolved stage, where deep gas causes further thermal and mechanical degradation of permafrost layer.
Our hypothesis II is supported by detailed geoelectric measurements of the shallow environment of the 2014 discovered outburst crater by Olenchenko et al. (2015). His analysis of water and ice distribution in the immediate subsurface vicinity show significant anomalies of degrading permafrost layer.
In this idea the natural gas seepage from deep origin results in additional subground heat and steep thermal gradients contributing to heating and shallowing of permafrost layer, making the permafrost locally warmer and more vulnerable to the impact of climate change. The Yamal gas fields are also characterized by a significant overpressure of its deep origin gas fields supporting the buoyancy in this pre-outburst scenario (Figure 14) (Matusevich et al., 1997; Skorobogatov et al., 1998; Semenov et al., 2019). Possibly, gas outbursts are more likely in subsidence hotspots like B and C zones. This should be corroborated by more detailed research on a deeper subsurface geological structure.
The observed surface changes represent important information on rates and spatial location of hotspots A, B, and C. In addition to spatial distribution of the subsiding B and C zones, a key question for future work in this context is: how high temperatures generated by both climate warming and subsurface heat transport affect this region with potential next gas outbursts? What is the potential to accelerate of subsidence rates or active layer thickening with catastrophic dimensions?
Our analyses and results reveal a potential relationship between the spatial distribution of subsiding zones and subsurface processes. Future studies of high-resolution precise DEM and decadal InSAR time-series may help to elucidate such potential relationships.
In this study, we underlined the potential of satellite radar imagery to detect and quantify permafrost surface changes. Surface relief dynamic analysis shows about 2 m net loss of surface topography over 14 years (2000–2014) associated with active discharge of water and sediments. In addition, InSAR time-series analysis shows active subsidence for the time period from 2017 to 2018 in three distinct spatial locations. The observed three locations show from 60 up to 120 mm/yr rates of seasonal surface permafrost changes. The subsiding InSAR rates located within gas condensate field are double compared to other two locations. Further analyses of the subsidence show that their spatial occurrence is controlled by the lithology and human activity contributes to the continuous seasonal subsidence. The gas condensate field is located within marine sediments and is linked to anthropogenic impact on the permafrost thaw. Two other areas are located within alluvial sediments and are at top of topographic elevated zones.
We propose two hypotheses on possible relationship between the spatial location of subsiding zones and subsurface geologic environment. The classical hypothesis is based on heterogeneous ice distribution, with the higher ice content the higher thaw potential in subsidence zones. The second hypothesis is related to natural gas seepage from a deep origin that adds subsurface heat and steepens the thermal gradients contributing to heating and thinning of permafrost layer. We assume that such zones may be future gas outburst locations.
The study has shown the good potential of the recently released Tandem-X DEM and InSAR technique to improve an understanding of permafrost surface dynamics and long-term monitoring in the remote regions. The combination of InSAR with available geomorphological and geological data and on-site data may be used to develop conceptual and quantitative models to predict surface changes by permafrost thaw and CH4 emission hotspots on a larger scale.
The original contributions presented in the study are included in the article/supplementary material further inquiries can be directed to the corresponding author.
KT performed the analyses and interpretation, she wrote the paper with contributions from HE, KH, AP, DB, AS, and NK helped with field work and analyses of soil profiles.
This research was funded by Netherlands Organization for Scientific Research NWO grant number ALW-GO/16-13 and Russian State Projects (121031200178-8, 1021032424138-9).
The authors declare that the research was conducted in the absence of any commercial or financial relationships that could be construed as a potential conflict of interest.
All claims expressed in this article are solely those of the authors and do not necessarily represent those of their affiliated organizations, or those of the publisher, the editors and the reviewers. Any product that may be evaluated in this article, or claim that may be made by its manufacturer, is not guaranteed or endorsed by the publisher.
Anisimov, O. A., Grebenets, V. I., and Streletskiy, D. A. (2014). “Chapter 6.4: Infrastructure Objects Located on Permafrost,“ in Second Roshydromet Assessment Report on Climate Change and its Consequences in Russian Federation. Editors S. M. Semenov, and V. Kattcov (University of Oklahoma Press), 854–877.
Anisimov, O. A., and Nelson, F. E. (1996). Permafrost Distribution in the Northern Hemisphere under Scenarios of Climatic Change. Glob. Planet. Change 14, 59–72. doi:10.1016/0921-8181(96)00002-1
Astakhov, V. (2011). Ice Margins of Northern Russia Revisited. Develop. Quaternary Sci. Elsevier 15, 323–336. doi:10.1016/b978-0-444-53447-7.00025-8
Astakhov, V. (2004). Pleistocene Ice Limits in the Russian Northern Lowlands. Quat. Glaciat. Chronol. Part. 1, 309–319. doi:10.1016/s1571-0866(04)80081-2
Balykin, D. N., Kovalevskaya, N. M., Puzanov, A. V., Teshebaeva, K., and Huissteden, J. V. (2019). Results of a Reconnaissance Study of Soil and Surface Water of Bovanenkovo Gas-Condensate Field (Yamal Peninsula). Probl. Reg. Ecol. 4, 111–116. doi:10.24411/1728-323X-2019-11111
Bartsch, A., Leibman, M., Strozzi, T., Khomutov, A., Widhalm, B., Babkina, E., et al. (2019). Seasonal Progression of Ground Displacement Identified with Satellite Radar Interferometry and the Impact of Unusually Warm Conditions on Permafrost at the Yamal Peninsula in 2016. Remote Sensing 11, 1865. doi:10.3390/rs11161865
Chen, F., Lin, H., Zhou, W., Hong, T., and Wang, G. (2013). Surface Deformation Detected by ALOS PALSAR Small Baseline SAR Interferometry over Permafrost Environment of Beiluhe Section, Tibet Plateau, China. Remote Sensing Environ. 138, 10–18. doi:10.1016/j.rse.2013.07.006
Chuvilin, E. M., Yakushev, V. S., and Perlova, E. V. (2000). Gas and Possible Gas Hydrates in the Permafrost of Bovanenkovo Gas Field, Yamal Peninsula, West Siberia. Polarforschung 68, 215–219.
Colesanti, C., Ferretti, A., Locatelli, R., Novali, F., and Savio, G. (2003). “Permanent Scatterers: Precision Assessment and Multi-Platform Analysis,” in IGARSS 2003. 2003 IEEE International Geoscience and Remote Sensing Symposium. Proceedings (IEEE Cat. No. 03CH37477 IEEE), Toulouse, France, July 21–25, 2003, 1193–1195.
Duguay, C. R., Zhang, T., Leverington, D. W., and Romanovsky, V. E. (2005). Satellite Remote Sensing of Permafrost and Seasonally Frozen Ground. Geophys. Monogr. Geophys. UNION 163. Washington, D. C.: AGU American Geophysical Union, 91.
Echtler, H. P., Stiller, M., Steinhoff, F., Krawczyk, C., Suleimanov, A., Spiridonov, V., et al. (1996). Preserved Collisional Crustal Structure of the Southern Urals Revealed by Vibroseis Profiling. Science 274, 224–226. doi:10.1126/science.274.5285.224
Ferretti, A., Prati, C., and Rocca, F. (2001). Permanent Scatterers in SAR Interferometry. IEEE Trans. Geosci. Remote Sensing 39, 8–20. doi:10.1109/36.898661
Forman, S. L., Ingólfsson, Ó., Gataullin, V., Manley, W., and Lokrantz, H. (2002). Late Quaternary Stratigraphy, Glacial Limits, and Paleoenvironments of the Marresale Area, Western Yamal Peninsula, Russia. Quat. Res. 57, 355–370. doi:10.1006/qres.2002.2322
Getis, A., and Ord, J. K. (2010). The Analysis of Spatial Association by Use of Distance Statistics. Adv. Spat. Sci. 24 (3), 127–145. doi:10.1007/978-3-642-01976-0_10
Hjort, J., Karjalainen, O., Aalto, J., Westermann, S., Romanovsky, V. E., Nelson, F. E., et al. (2018). Degrading Permafrost Puts Arctic Infrastructure at Risk by Mid-century. Nat. Commun. 9, 5147. doi:10.1038/s41467-018-07557-4
Jarvis, A., Reuter, H. I., Nelson, A., and Guevara, E. (2008). Hole-Filled SRTM for the Globe Version 4. Available From the CGIAR-CSI SRTM 90m Database (http://srtm.csi.cgiar.org) 15, 25–54.
Khomutov, A., and Leibman, M. (2014). Assessment of Landslide Hazards in a Typical Tundra of Central Yamal, Russia. Landslides In Cold Regions in the Context of Climate Change. Cham: Springer, 271–290. doi:10.1007/978-3-319-00867-7_20
Kizyakov, A., Zimin, M., Sonyushkin, A., Dvornikov, Y., Khomutov, A., and Leibman, M. (2017). Comparison of Gas Emission Crater Geomorphodynamics on Yamal and Gydan Peninsulas (Russia), Based on Repeat Very-High-Resolution Stereopairs. Remote Sensing 9, 1023. doi:10.3390/rs9101023
Leibman, M., Khomutov, A., and Kizyakov, A. (2014b). “Cryogenic Landslides in the West-Siberian Plain of Russia: Classification, Mechanisms, and Landforms,” in In: Shan et al.: Landslides in Cold Regions in the Context of Climate Change (London: Springer), 143–162.
Leibman, M. O., Kizakov, A. I, Sulerzhitsky, L. D., and Zaretskaia, N. E. (2003). “Dynamics of Landslide Slopes and Their Development on Yamal Peninsula,” in Permafrost. Proceedings of the 8th International Conference on Permafrost, Swets and Zeitlinger, Lisse, 651–656.
Leibman, M. O., Kizyakov, A. I., Plekhanov, A. V., and Streletskaya, I. D. (2014a). New Permafrost Feature - Deep Crater in Central Yamal (West Siberia, Rusia) as a Response to Local Climate Fluctuations. Geogr. Environ. Sustain. 7, 68–79. doi:10.24057/2071-9388-2014-7-4-68-79
Liu, J., Kang, S., Gong, T., and Lu, A. (2010). Growth of a High-Elevation Large Inland lake, Associated with Climate Change and Permafrost Degradation in Tibet. Hydrol. Earth Syst. Sci. 14, 481–489. doi:10.5194/hess-14-481-2010
Liu, L., Schaefer, K. M., Chen, A. C., Gusmeroli, A., Zebker, H. A., and Zhang, T. (2015a). Remote Sensing Measurements of Thermokarst Subsidence Using InSAR. J. Geophys. Res. Earth Surf. 120, 1935–1948. doi:10.1002/2015jf003599
Liu, X., Guo, Y., Hu, H., Sun, C., Zhao, X., and Wei, C. (2015b). Dynamics and Controls of CO 2 and CH 4 Emissions in the Wetland of a Montane Permafrost Region, Northeast China. Atmos. Environ. 122, 454–462. doi:10.1016/j.atmosenv.2015.10.007
MacDonald, G. M., Kremenetski, K. V., and Beilman, D. W. (2007). Climate Change and the Northern Russian Treeline Zone. Phil. Trans. R. Soc. B 363, 2283–2299. doi:10.1098/rstb.2007.2200
MacDonald, G. M., Velichko, A. A., Kremenetski, C. V., Borisova, O. K., Goleva, A. A., Andreev, A. A., et al. (2000). Holocene Treeline History and Climate Change across Northern Eurasia. Quat. Res. 53, 302–311. doi:10.1006/qres.1999.2123
Matusevich, V. M., Myasnikova, G. P., Maximov, E. M., Volkov, A. M., Chistiakova, N. F., Kanalin, V. G., et al. (1997). Abnormal Formation Pressures in the West Siberian Mega-basin, Russia. Pet. Geosci. 3 (3), 269–283.
Nauta, A. L., Heijmans, M. M. P. D., Blok, D., Limpens, J., Elberling, B., Gallagher, A., et al. (2015). Permafrost Collapse after Shrub Removal Shifts Tundra Ecosystem to a Methane Source. Nat. Clim Change 5, 67–70. doi:10.1038/nclimate2446
Olenchenko, V. V., Sinitsky, A. I., Antonov, E. Y., Eltsov, I. N., Kushnarenko, O. N., Plotnikov, A. E., et al. (2015). Results of Geophysical Surveys of the Area of “Yamal Crater”. New Geological Structure. Kriosf. Zemli 19, 84–95. doi:10.1016/j.rgg.2015.05.014
Onn, F., and Zebker, H. A. (2006). Correction for Interferometric Synthetic Aperture Radar Atmospheric Phase Artifacts Using Time Series of Zenith Wet Delay Observations from a GPS Network. J. Geophys. Res. Solid Earth 111, 1–16. doi:10.1029/2005jb004012
Perissin, D., Rocca, F., Pierdicca, M., Pichelli, E., Cimini, D., Venuti, G., et al. (2011a). “Mitigation of Atmospheric Delay in InSAR: The ESA Metawave Project,” in IEEE International Geoscience and Remote Sensing Symposium, Vancouver, BC, July 24–29, 2011 (IEEE), 2558–2561. doi:10.1109/igarss.2011.6049734
Perissin, D. (2015). SARproZ Software. Official Product Web Page (https://www.sarproz.com/).
Perissin, D., Wang, Z., and Wang, T. (2011b). The SARPROZ InSAR Tool for Urban Subsidence/manmade Structure Stability Monitoring in China. Proc. Isrse, Sidney, Aust. 1015, 271–280.
Puchkov, V. N. (1997). Structure and Geodynamics of the Uralian Orogen. Geol. Soc. Lond. Spec. Publications 121, 201–236. doi:10.1144/gsl.sp.1997.121.01.09
Raynolds, M. K., Walker, D. A., Ambrosius, K. J., Brown, J., Everett, K. R., Kanevskiy, M., et al. (2014). Cumulative Geoecological Effects of 62 Years of Infrastructure and Climate Change in Ice-Rich Permafrost Landscapes, Prudhoe Bay Oilfield, Alaska. Glob. Change Biol. 20, 1211–1224. doi:10.1111/gcb.12500
Schuur, E. A. G., McGuire, A. D., Schädel, C., Grosse, G., Harden, J. W., Hayes, D. J., et al. (2015). Climate Change and the Permafrost Carbon Feedback. Nature 520, 171–179. doi:10.1038/nature14338
Semenov, P., Malyshev, S. A., Nekrasov, D., Leibman, M. O., Kizyakov, A. I., Vanshtein, B. G., et al. (2019). “Gas Geochemistry of the Ground Ice Samples From the Exposure in Central Yamal,” in Solving the Puzzles From Cryosphere, 31–33.
Short, N., LeBlanc, A.-M., Sladen, W., Oldenborger, G., Mathon-Dufour, V., and Brisco, B. (2014). RADARSAT-2 D-InSAR for Ground Displacement in Permafrost Terrain, Validation from Iqaluit Airport, Baffin Island, Canada. Remote Sensing Environ. 141, 40–51. doi:10.1016/j.rse.2013.10.016
Silverman, B. W. (2018). Density Estimation for Statistics and Data Analysis. Boca Raton: Routledge.
Teshebaeva, K., Van Huissteden, K. J., Puzanov, A. V., Balykin, D. N., Sinitsky, A. I., and Kovalevskaya, N. (2020). Permafrost Seasonal Surface Changes Revealed from Sentinel-1 InSAR Time-Series, Yamal peninsula. Proc. IAHS 382, 183–187. doi:10.5194/piahs-382-183-2020
Skorobogatov, V. A., Vladimir, S. Y., and Evgeny, M. C. (1998). “Sources of Natural Gas Within Permafrost North-West Siberia,” in Permafrost Proceedings Seventh International Conference, Collection Nordicana 57.
Ulmishek, G. F. (2003). Petroleum Geology and Resources of the West Siberian Basin, Russia. Virginia: US Department of the Interior, US Geological Survey Reston.
Volkova, V. S. (2014). Geologic Stages of the Paleogene and Neogene Evolution of the Arctic Shelf in the Ob' Region ( West Siberia ). Russ. Geol. Geophys. 55, 483–494. doi:10.1016/j.rgg.2014.03.006
Wessel, B., Huber, M., Wohlfart, C., Marschalk, U., Kosmann, D., and Roth, A. (2018). Accuracy Assessment of the Global TanDEM-X Digital Elevation Model with GPS Data. ISPRS J. Photogrammetry Remote Sensing 139, 171–182. doi:10.1016/j.isprsjprs.2018.02.017
Yokoyama, R., Shirasawa, M., and Pike, R. J. (2002). Visualizing Topography by Openness: a New Application of Image Processing to Digital Elevation Models. Photogramm. Eng. Remote Sensing 68,257–266.
Zhang, T., Barry, R. G., and Armstrong, R. L. (2004). Application of Satellite Remote Sensing Techniques to Frozen Ground Studies. Polar Geogr. 28, 163–196. doi:10.1080/789610186
Keywords: permafrost, active layer, InSAR time-series, subsidence, Dynamic Landscape
Citation: Teshebaeva K, van Huissteden KJ, Echtler H, Puzanov AV, Balykin DN, Sinitsky AI, Kovalevskaya NM and Dolman HAJ (2021) Permafrost Dynamics and Degradation in Polar Arctic From Satellite Radar Observations, Yamal Peninsula. Front. Earth Sci. 9:741556. doi: 10.3389/feart.2021.741556
Received: 14 July 2021; Accepted: 15 November 2021;
Published: 17 December 2021.
Edited by:
Qingbai Wu, Chinese Academy of Sciences (CAS), ChinaReviewed by:
Tonghua Wu, Chinese Academy of Sciences (CAS), ChinaCopyright © 2021 Teshebaeva, van Huissteden, Echtler, Puzanov, Balykin, Sinitsky, Kovalevskaya and Dolman. This is an open-access article distributed under the terms of the Creative Commons Attribution License (CC BY). The use, distribution or reproduction in other forums is permitted, provided the original author(s) and the copyright owner(s) are credited and that the original publication in this journal is cited, in accordance with accepted academic practice. No use, distribution or reproduction is permitted which does not comply with these terms.
*Correspondence: Kanayim Teshebaeva, a2FuYXlpbUBnbWFpbC5jb20=
Disclaimer: All claims expressed in this article are solely those of the authors and do not necessarily represent those of their affiliated organizations, or those of the publisher, the editors and the reviewers. Any product that may be evaluated in this article or claim that may be made by its manufacturer is not guaranteed or endorsed by the publisher.
Research integrity at Frontiers
Learn more about the work of our research integrity team to safeguard the quality of each article we publish.