
94% of researchers rate our articles as excellent or good
Learn more about the work of our research integrity team to safeguard the quality of each article we publish.
Find out more
ORIGINAL RESEARCH article
Front. Earth Sci. , 20 August 2021
Sec. Earth and Planetary Materials
Volume 9 - 2021 | https://doi.org/10.3389/feart.2021.740685
This article is part of the Research Topic Earth Deep Interior: High-pressure Experiments and Theoretical Calculations from the Atomic to the Global Scale View all 11 articles
In the present study, we extensively explored the phase stabilities and elastic behaviors of Cu2O with elevated pressures up to 29.3 GPa based on single-crystal X-ray diffraction measurements. The structural sequence of Cu2O is different than previously determined. Specifically, we have established that Cu2O under pressure, displays a cubic-tetragonal-monoclinic phase transition sequence, and a novel monoclinic high-pressure phase assigned to the P1a1 or P12/a1 space group was firstly observed. The monoclinic phase Cu2O exhibits anisotropic compression with axial compressibility βb > βc > βa in a ratio of 1.00:1.64:1.45. The obtained isothermal bulk modulus of cubic and monoclinic phase Cu2O are 125(2) and 41(6) GPa, respectively, and the KT0’ is fixed at 4. Our results provide new insights into the phase stability and elastic properties of copper oxides and chalcogenides at extreme conditions.
The behaviors of transition metals and their oxides under high-temperature and high-pressure conditions have been studied extensively over a few decades, and knowledge about such material has important applications in physics, materials science, and engineering (Austin and Mott, 1970; Errandonea, 2006). Copper and its oxides are among the most investigated transition-metal materials. Cuprous oxide is a high-temperature semiconductor and one promising candidate materials for photo-electrochemical applications (Maksimov, 2000; Laskowski et al., 2003; Khanna et al., 2007). However, variations in physical properties and structural change of cuprous oxide Cu2O at extreme conditions have not been fully investigated.
Cu2O crystalizes in a simple cubic Bravais lattice with space group Pn-3m under normal thermodynamic conditions, while it has numerous structure forms at extreme conditions (Machon et al., 2003; Cortona and Mebarki, 2011; Feng et al., 2017). Most of previous studies have focused on the structural variations under high P-T conditions based on first-principles calculations. Cortona and Mebarki (2011) described the transition from cubic Cu2O to the CdI2-type structure (hexagonal, R-3m) at 10 GPa, while Feng et al. (2017) suggested two phase transitions, one at 5 GPa (Pn-3m→R-3m) and the other at 12 GPa (R-3m→R-3m1). However, this is hard to reconcile with some experimental results on the pressure-induced structural transformations of Cu2O. A tetragonal phase was demonstrated by Machon et al. (2003) at pressures between 0.7 and 2.2 GPa using angle-dispersive powder X-ray diffraction (XRD), and another pseudocubic phase was detected at ∼8.5 GPa. What is more, Sinitsyn et al. (2004) found a new hexagonal phase with lattice parameters of a = 5.86 Å and c = 18.78 Å at 21 GPa which was significantly different from those reported earlier by Werner and Hochheimer (1982), who studied a hexagonal phase with CdCl2-type structure with a = 2.82 Å and c = 12.7 Å measured at 18 GPa. Therefore, phase relations of Cu2O at higher pressures are more sparse and show less mutual agreement. Further investigation is needed to study the exact high temperature and high pressures phases of Cu2O.
There are limited studies on the behavior of cuprous oxides and copper chalcogenides under high pressure and high temperature conditions. In this present work, we report the phase transformations and elastic properties of Cu2O up to ∼30 GPa at room temperature, by using synchrotron-based single-crystal XRD with diamond anvil cell (DAC). We confirmed the tetragonal phase Cu2O observed between 10.4 and 13.8 GPa, and a novel monoclinic phase at higher pressures is also reported. As is well-known, physical properties of materials can be modified by tailoring either chemical composition or microstructure. These results can improve our knowledge of how pressure affect their elastic and physical properties. In this report we also present the measured compressibilities and equations of states of these high pressure phases of Cu2O.
The cuprite measured in this study was originated from the Tonglushan Copper Miners in Daye, Hubei province. Single-crystal samples of natural, brick-red cuprite were selected as the starting material of our study. We screened several chips and polished them to ∼10 μm in thickness. At ambient conditions, the Cu2O was characterized in an empty diamond anvil cell (DAC) by single crystal X-ray diffraction, at the GSECARS beamline 13-BM-C of the Advanced Photon Source (APS), Argonne National Laboratory (Zhang et al., 2017). Diffraction collected at ambient conditions showed that the cuprite crystal had a Pn-3m space group with a = 4.2733(7) Å, and the Cu2O samples with a purity of 99.99% were used for the current study.
High-pressure compression measurements were performed, using short symmetric DACs fitted with Boehler-Almax diamond anvils with 300 μm flat culets and mounted into seats with 60° opening. Rhenium gaskets were preindented to ∼40 μm thickness, and holes were drilled to ∼170 μm diameter for the samples. On compression, the gasket thickness and sample chamber diameter both decrease to ∼20 μm at the highest pressures reached. The polished Cu2O sample was loaded together into the sample chamber along with Pt foil for pressure calibration (Fei et al., 2007). To achieve quasi-hydrostatic conditions and maintain similar pressure environments everywhere in the sample chamber, we loaded the cell with neon as the pressure-transmitting medium using the COMPRES/GSECARS gas-loading system (Rivers et al., 2008).
In situ high-pressure single-crystal X-ray diffraction experiments on Beamline 13-BM-C used a monochromatic X-ray beam with a wavelength of 0.4340 Å and focused to a 15 × 15 μm2 spot. The experimental details were also described previously (Qin et al., 2017; Zhang et al., 2017). To obtain adequate number of diffraction peaks of samples and increase the coverage of the reciprocal space, we collected data at four different detector positions. The diffraction images were analyzed using the ATREX/RSV software package (Dera et al., 2013). Integrated diffraction data were analyzing using the DIOPTAS software (Prescher and Prakapenka, 2015), the high-pressure synchrotron XRD patterns were indexed by Dicvol06 (Louër and Boultif, 2007). Lattice parameters were calculated by the program UnitCell and the Le Bail refinement by GSAS (Holland and Redfern, 1997; Toby, 2001).
In situ X-ray diffraction patterns of Cu2O were measured up to 29.3 GPa under hydrostatic pressure which presented in Figure 1A. At ambient conditions, all peaks can be indexed as the Pn-3m cubic structure (Hahn et al., 1983). When pressure increased to 16.1 GPa, an abrupt change in the integrated diffraction pattern was observed. As can be seen in the diffraction patterns in Figure 1B, reflections from the crystal show diffuse scattering and appear as short streaks at pressures above 16.1 GPa. Some diffraction peaks become fainter at higher angle, making it more difficult to determine the peak positions exactly (Figure 1B). We compared our integrated data of the high-pressure phase with previous studies but did not find any compatible structures (Werner and Hochheimer, 1982; Cortona and Mebarki, 2011; Feng et al., 2017).
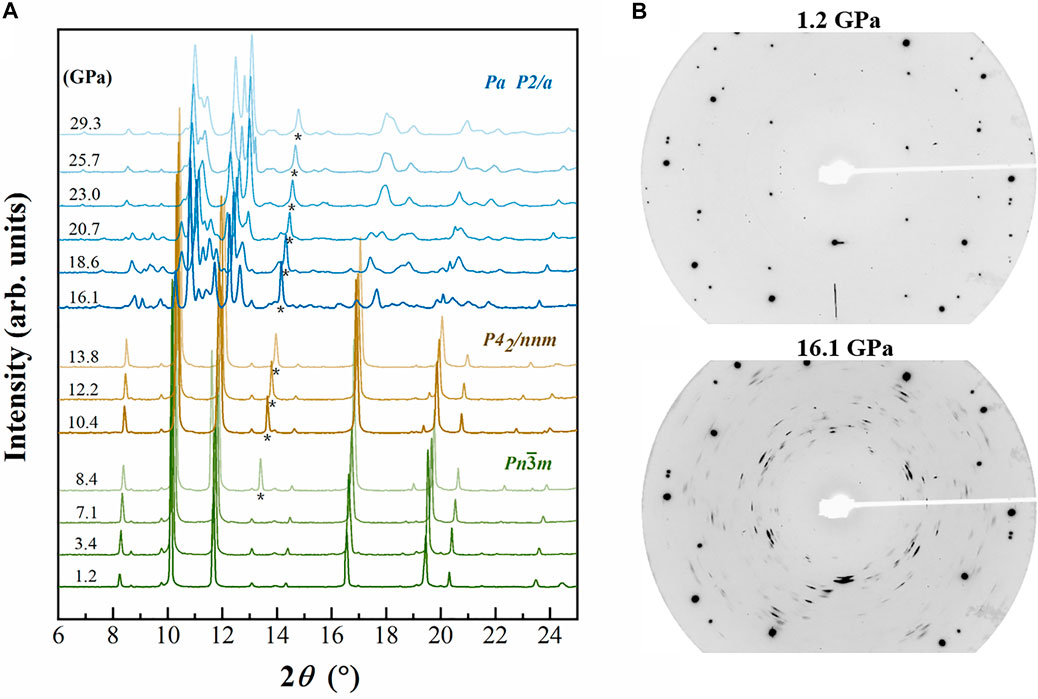
FIGURE 1. (A) Integrated XRD patterns of Cu2O at elevated pressures. Backgrounds were subtracted from the origin data. Asterisk (*) represents the scattering peaks of neon. (B) Diffraction patterns of Cu2O at 1.2 and 13.8 GPa, respectively. The very intense diffraction spots are from the diamond anvils. Diamond peaks and diffraction lines attributed to the neon are not marked.
A suspected phase transition from cubic to tetragonal between 0.7 and 2.2 GPa was reported previously (Machon et al., 2003), and our diffraction measurements confirmed this transition but at a different pressure (between 8.4 and 10.4 GPa, Figure 2A). We noticed that all the diffraction peaks deviated from a cubic lattice at pressures above 10.4 GPa, and can be well indexed as tetragonal lattice Cu2O with space group P42/nnm. The high-pressure tetragonal phase Cu2O at 10.4 GPa, was refined by Rietveld method in GSAS program shown in Figure 2B. The quality of the refinement is illustrated by the small R-factors and reduced Χ2; Rp = 0.18%, Rwp = 0.25%, and Χ2 = 0.93. As the tetragonal phase is the subgroup of the cubic phase (Pn-3m) and the two phases have very similar lattice parameters, i.e., for cubic phase, a = 4.267 Å and for tetragonal phase, a = 4.193, a/c = 0.988 (Hahn et al., 1983; Restori and Schwarzenbach, 1986; Machon et al., 2003). This tetragonal structure is also indicated by the asymmetry of the peaks centered at ∼8.5°, 14.6°, 17° and 20°, resulting from the overlap of the (110)(011), (211)(112), (220)(202) and (131)(113) pairs of the tetragonal structure, respectively (Figure 2A). The tetragonal structure can be regarded as the distorted cubic structure under the uniaxial stress in the DAC.
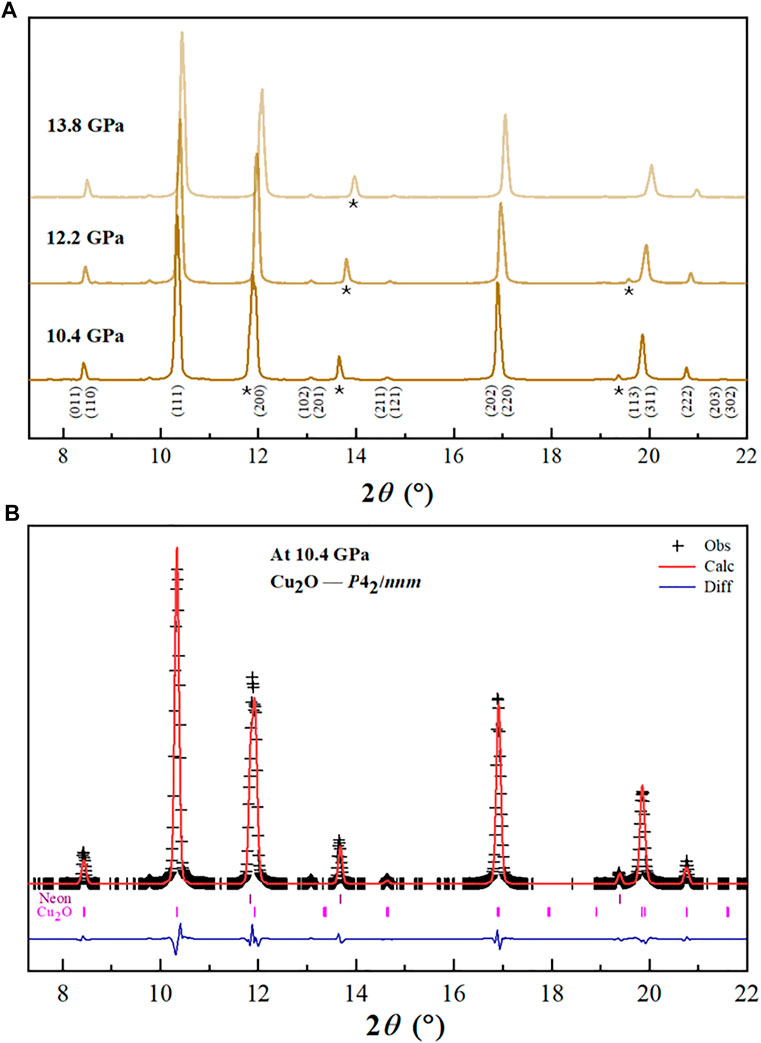
FIGURE 2. (A) Selected XRD patterns of Cu2O in the tetragonal phase. Asterisk (*) represents the scattering peaks of neon. (B) The Rietveld refinement of Cu2O (P42/nnm). Observed and the calculated profiles are shown using black crosses and red solid line, respectively. The residual between them is shown by the blue line at the bottom. Bragg peak positions are indicated by the small ticks.
During the compression of Cu2O, all the diffraction peaks move to larger 2θ values, as expected for pressure-induced bond shortening, and their intensities weaken gradually. When the pressure exceeds 16.1 GPa, some new peaks appeared (d spacings at ∼2.83. 2.74, 2.42, 2.30, 2.03, 1.97, 1.76 Å and so on) and the d values of these peaks are totally different from those previous patterns, suggesting that the Cu2O undergoes a reconstructive phase transition, and with further compression to the highest pressure, the structure can persist and no other transition was observed (Figure 1A). We have compared our patterns with some predicted hexagonal high-pressure phases of Cu2O based on previous ab initio calculation and measurement results, but none of the predicted structures matches our measured diffraction pattern (Werner and Hochheimer, 1982; Cortona and Mebarki, 2011; Liu et al., 2014; Feng et al., 2017). In this case, the high quality data allow us to determine the crystal structure of the new high-pressure phase of Cu2O. We chose several recognizable Debye rings, except for the neon rings, to index the crystal lattice using Dicvol06 software (Louër and Boultif, 2007). According to our results, the 16 chosen peaks of high-pressure phase Cu2O, obtained at 16.1 GPa, can be successfully indexed as a monoclinic structure with the lattice parameters: a = 5.665(3) Å, b = 2.741(2) Å, c = 4.255(2) Å, β = 93.54(8)° and V = 65.94(2) Å3 (Table 1).
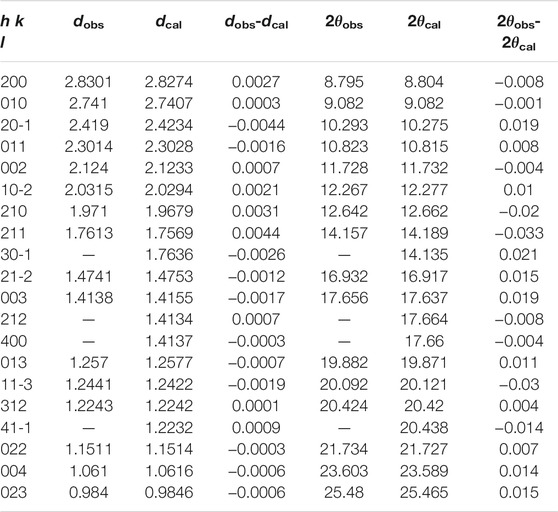
TABLE 1. Calculated and Observed d spacings of a new monoclinic polymorph Cu2O, as well as the normalized intensity Iobs for the h k l reflections.
Crystal lattice parameters, characteristic X-ray extinctions and diffracted intensities unambiguously documented that the crystal structure of the monoclinic phase Cu2O belongs to the primitive lattice with no exception. 0k0 manage the requirement of k = 2n + 1, and h00, 00l are also fulfilled the rules h = 2n and l = 2n. Consequently, space groups fulfilling these conditions are P1a1 (No. 7) and P12/a1 (No. 13) (Hahn et al., 1983). However, the quality of our diffraction pattern is not enough to differentiate the two space groups, as the space group Pa is a subgroup of P2/a, and both have very similar diffraction peak distributions.
The P-V data of both Cu2O phases were fitted using the third-order Birch-Murnaghan equation of state (BM3-EoS) with the data all equally weighted, since the errors in volume and pressure were similar for all measurements (Angle et al., 2014) (Figure 3). The refined lattice parameters of Cu2O at various pressures are listed in Table 2. As the tetragonal structure could be regarded as the distorted cubic phase and the volumes of two phases only have marginal difference, thus we used cubic structure model to calculate the equation of state between 10.4 and 13.8 GPa to get higher accuracy. The resulting fitted parameters of volume, bulk modulus and its pressure derivative of cubic Cu2O are as follows: V0 = 78.05(3) Å3, KT0 = 137(5) GPa and KT0’ = 1.8(7), respectively, which are 4.6% higher compared with the corresponding values from the experimental data from Werner and Hochheimer (1982), who reported 131 GPa when K′ is 5.7. In this present study, we also calculated the equation of state by fixing KT0’ at 4, resulting in KT0 = 125(2) GPa.
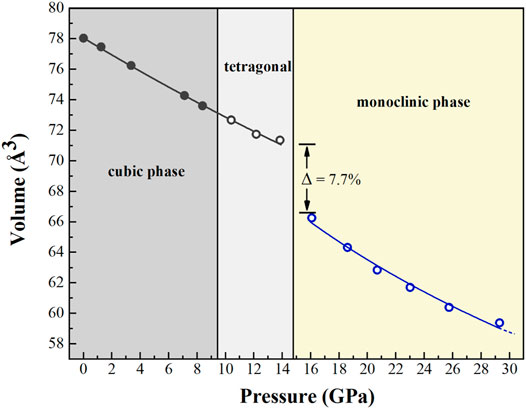
FIGURE 3. The volume of Cu2O as a function of pressure. A volume collapse of 7.7% at about 10.4–13.8 GPa, which is the location where the phase transition occurs between the tetragonal and monoclinic phases.
Here, we also firstly determined the elastic properties of the monoclinic phase Cu2O using the EoSFit7c software (Angle et al., 2014). The measured lattice parameters are also provided in Table 2. The derived BM2-EoS (KT0’ = 4 implied) parameters yield the following bulk modulus KT0 = 41(6) GPa, and it is three times softer than the low-pressure phase. Axial compression behaviors are also presented in Figure 4. It is noteworthy that the b-axis possesses a larger axial compressibility compared with a- and c-axes, and therefore being the most compressible direction within the structure. The interaxial angle β has an increasing trend with compression.
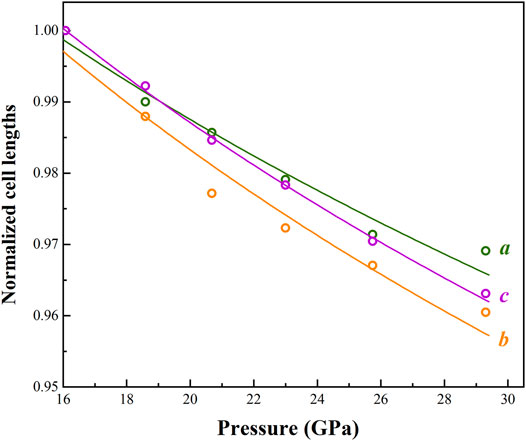
FIGURE 4. Pressure dependence of normalized cell lengths (a, b and c) of monoclinic phase Cu2O. EoS fits in the current study are shown by solid curves.
The high-pressure behavior of cuprous oxide Cu2O has attracted broad interests due to their various structures at different P-T conditions and its potential applications. Several previous studies have been published which focus on the phase transitions and decompositions of Cu2O and its thermodynamic properties as well (Machon et al., 2003; Sinitsyn et al., 2004; Cortona and Mebarki, 2011; Liu et al., 2014; Feng et al., 2017). However, these previous results were unclear about the high-pressure crystal structure of Cu2O (tetragonal or hexagonal phase) and it is obvious that a large discrepancy of transformation pressure between the cubic and high-pressure phases existed between literatures. In this study, we re-confirmed the phase transition sequence from cubic-to-tetragonal phase occurred between 8.4 and 10.4 GPa using single-crystal XRD, which is significantly more higher than previously estimated (Machon et al., 2003). A new high-pressure phase of Cu2O was also indexed using Dicvol06 software (Louër and Boultif, 2007). A volume collapse of ∼7.7% in the region of 13.8–16.1 GPa was observed during the structural transformation from cubic to monoclinic phase (Figure 3). There is no indication of structural decomposition in this case. In addition, it is obvious that a considerable anisotropy in axial compressibility with βb > βc > βa and we found the ratio of zero-pressure axial compressibility is 1.00:1.64:1.45 according to our data. Thus, it can be concluded that the largest anisotropy in compressibility is along the b axis, which behaves about twice as compressible than the a-axis in the structure (Figure 4). Further investigation should be done to investigate the exact high temperature phases of Cu2O.
In some recent studies, several members of copper chalcogenides, such as Cu2S and Cu2Se have been theoretically proposed and experimentally exhibited as the thermoelastic materials (Danilkin et al., 2011; Santamaria-Perez et al., 2014; Zhang et al., 2018; Zimmer et al., 2018; Xue et al., 2019). The high-pressure phase Cu2O, Cu2Se and Cu2S may adopt the same monoclinic structure at different pressure conditions, which indicates that these copper compounds may have a similar crystal chemistry configuration (Santamaria-Perez et al., 2014; Zhang et al., 2018). The structural complexity of Cu2S have been studied previously, in which two phase transitions occurred at 3.2 and 7.4 GPa from the P21/c phase to two different monoclinic structures (Santamaria-Perez et al., 2014). Pressure-induced structural transition sequence is also identified in Cu2Se. The initial low-pressure phase (C2/c) transformed to phase II and semimetallic phase III at 3.2 GPa, and then followed by a reconstructive transformation to bulk metallic phase IV (Pca21) at 7.4 GPa. These mentioned phases could be confidently associated with the electronic state transitions (Zhang et al., 2018; Chuliá-Jordan et al., 2020). As for the copper sulfide, three phase-transitions occurred at 3.2, 7.4 and 26 GPa, respectively, and there is a significant difference of the reported values of bulk modulus, ranging from 72 to 113 GPa (Santamaria-Perez et al., 2014). The determination of the phase stability of such stoichiometric copper oxides under compression will give more insight into possible systematic trends in group copper chalcogenides, and provide a direct comparison with such thermoelastic materials at extreme conditions where their phase behaviors could converge.
The high-pressure behaviors of cuprous oxide Cu2O have been studied by synchrotron-based single-crystal XRD at pressures up to ∼30 GPa at 300 K conditions. The initial low-pressure cubic phase transforms to distorted P42/nnm phase between 10.4 and 13.8 GPa, and the tetragonal structure persisted at pressure up to ∼16 GPa. A new high-pressure phase of Cu2O (monoclinic phase, P1a or P12/a1) was obtained at 16.1 GPa at room temperature and the high-pressure elastic properties was firstly measured in this study. It is expected that the three times more compressible high-pressure phase Cu2O may process some advantages properties than previously thought. The findings contribute to broadening our knowledge of the crystal chemistry of cuprite at high-pressure conditions, thus giving a better understand of thermoelastic materials in the copper chalcogenide system.
The original contributions presented in the study are included in the article/Supplementary Material, further inquiries can be directed to the corresponding author.
FQ and DZ carried out the experiments. FQ, DZ, and SQ performed the data analysis and interpretation. FQ wrote the manuscript. All authors contributed to the discussion of the results and revisions of the manuscript.
This research was supported by the Fundamental Research Funds for the Central Universities (grant no. 590421013) and the National Natural Science Foundation of China (grant no. 42072047). Work performed at GSECARS (Sector 13) of the Advanced photon Source (APS) is supported by the NSF EAR-1634415 and the Department of Energy (DOE) DE-FG02- 94ER1446. The APS at Argonne National Laboratory is supported by the DOE, Office of Science, under Contract No.DE-AC02-06CH11357. Experiments at Sector 13-BM-C of the APS used the PX^2 facility, supported by GSECARS and COMPRES under NSF Cooperative Agreement EAR-1661511.
The authors declare that the research was conducted in the absence of any commercial or financial relationships that could be construed as a potential conflict of interest.
All claims expressed in this article are solely those of the authors and do not necessarily represent those of their affiliated organizations, or those of the publisher, the editors and the reviewers. Any product that may be evaluated in this article, or claim that may be made by its manufacturer, is not guaranteed or endorsed by the publisher.
We also thank S.Tkachev for gas loading the diamond cells.
Angel, R. J., Alvaro, M., and Gonzalez-Platas, J. (2014). EosFit7c and a Fortran Module (Library) for Equation of State Calculations. Z. Kristallogr. 229, 405–419. doi:10.1515/zkri-2013-1711
Austin, I. G., and Mott, N. F. (1970). Metallic and Nonmetallic Behavior in Transition Metal Oxides. Science 168, 71–77. doi:10.1126/science.168.3927.71
Chuliá-Jordan, R., Santamaría-Pérez, D., Pereira, A. L. J., García-Domene, B., Vilaplana, R., Sans, J. A., et al. (2020). Structural and Vibrational Behavior of Cubic Cu1.80(3)Se Cuprous Selenide, Berzelianite, under Compression. J. Alloys Compd. 830, 154646. doi:10.1016/j.jallcom.2020.154646
Cortona, P., and Mebarki, M. (2011). Cu2O Behavior under Pressure: Anab Initiostudy. J. Phys. Condens. Matter 23, 045502. doi:10.1088/0953-8984/23/4/045502
Danilkin, S. A., Avdeev, M., Sakuma, T., Macquart, R., and Ling, C. D. (2011). Neutron Diffraction Study of Diffuse Scattering in Cu2−δSe Superionic Compounds. J. Alloys Compd. 509, 5460–5465. doi:10.1016/j.jallcom.2011.02.101
Dera, P., Zhuravlev, K., Prakapenka, V., Rivers, M. L., Finkelstein, G. J., Grubor-Urosevic, O., et al. (2013). High Pressure Single-crystal Micro X-ray Diffraction Analysis with GSE_ADA/RSV Software. High Press. Res. 33, 466–484. doi:10.1080/08957959.2013.806504
Errandonea, D. (2006). Phase Behavior of Metals at Very High P-T Conditions: A Review of Recent Experimental Studies. J. Phys. Chem. Sol. 67, 2017–2026. doi:10.1016/j.jpcs.2006.05.031
Fei, Y., Ricolleau, A., Frank, M., Mibe, K., Shen, G., and Prakapenka, V. (2007). Toward an Internally Consistent Pressure Scale. Proc. Natl. Acad. Sci. 104, 9182–9186. doi:10.1073/pnas.0609013104
Feng, W., Ren, W., Yu, J., Zhang, L., Shi, Y., and Tian, F. (2017). High-pressure Phase Transitions of Cu 2 O. Solid State. Sci. 74, 70–73. doi:10.1016/j.solidstatesciences.2017.09.011
Hahn, T., Shmueli, U., and Arthur, J. C. W. (1983). International Tables for Crystallography. Vol. 1. Dordrecht: Reidel.
Holland, T. J. B., and Redfern, S. A. T. (1997). UNITCELL: a Nonlinear Least-Squares Program for Cell-Parameter Refinement and Implementing Regression and Deletion Diagnostics. J. Appl. Cryst. 30, 84. doi:10.1107/S0021889896011673
Khanna, P. K., Gaikwad, S., Adhyapak, P. V., Singh, N., and Marimuthu, R. (2007). Synthesis and Characterization of Copper Nanoparticles. Mater. Lett. 61, 4711–4714. doi:10.1016/j.matlet.2007.03.014
Laskowski, R., Blaha, P., and Schwarz, K. (2003). Charge Distribution and Chemical Bonding inCu2O. Phys. Rev. B 67, 075102. doi:10.1103/PhysRevB.67.075102
Liu, K., Duan, Y.-F., Lv, D., Wu, H.-B., Qin, L.-X., Shi, L.-W., et al. (2014). Pressure-Induced Cubic-To-Hexagonal Phase Transition in Cu 2 O. Chin. Phys. Lett. 31, 117701. doi:10.1088/0256-307X/31/11/117701
Louër, D., and Boultif, A. (2007). Powder Pattern Indexing and the Dichotomy Algorithm. Z. Kristallogr. Suppl. 2007, 191–196. doi:10.1524/zksu.2007.2007.suppl_26.191
Machon, D., Sinitsyn, V. V., Dmitriev, V. P., Bdikin, I. K., Dubrovinsky, L. S., Kuleshov, I. V., et al. (2003). Structural Transitions in Cu2O at Pressures up to 11 GPa. J. Phys. Condens. Matter 15, 7227–7235. doi:10.1088/0953-8984/15/43/007
Maksimov, E. G. (2000). High-temperature Superconductivity: the Current State. Phys.-Usp. 43, 965–990. doi:10.1070/PU2000v043n10ABEH000770
Prescher, C., and Prakapenka, V. B. (2015). DIOPTAS: a Program for Reduction of Two-Dimensional X-ray Diffraction Data and Data Exploration. High Press. Res. 35, 223–230. doi:10.1080/08957959.2015.1059835
Qin, F., Wu, X., Zhang, D., Qin, S., and Jacobsen, S. D. (2017). Thermal Equation of State of Natural Ti‐Bearing Clinohumite. J. Geophys. Res. Solid Earth 122, 8943–8951. doi:10.1002/2017JB014827
Restori, R., and Schwarzenbach, D. (1986). Charge Density in Cuprite, Cu2O. Acta Crystallogr. Sect B 42, 201–208. doi:10.1107/S0108768186098336
Rivers, M., Prakapenka, V., Kubo, A., Pullins, C., Holl, C., and Jacobsen, S. (2008). The COMPRES/GSECARS Gas-Loading System for diamond Anvil Cells at the Advanced Photon Source. Ghpr 28, 273–292. doi:10.1080/08957950802333593
Santamaria-Perez, D., Garbarino, G., Chulia-Jordan, R., Dobrowolski, M. A., Mühle, C., and Jansen, M. (2014). Pressure-induced Phase Transformations in mineral Chalcocite, Cu2S, under Hydrostatic Conditions. J. Alloys Compd. 610, 645–650. doi:10.1016/j.jallcom.2014.04.176
Sinitsyn, V. V., Dmitriev, V. P., Bdikin, I. K., Machon, D., Dubrovinsky, L., Ponyatovsky, E. G., et al. (2004). Amorphization of Cuprite, Cu2O, Due to Chemical Decomposition under High Pressure. Jetp Lett. 80, 704–706. doi:10.1134/1.1862798
Toby, B. H. (2001). EXPGUI, a Graphical User Interface forGSAS. J. Appl. Cryst. 34, 210–213. doi:10.1107/S0021889801002242
Werner, A., and Hochheimer, H. D. (1982). High-pressure X-ray Study ofCu2O andAg2O. Phys. Rev. B 25, 5929–5934. doi:10.1103/PhysRevB.25.5929
Xue, L., Zhang, Z., Shen, W., Ma, H., Zhang, Y., Fang, C., et al. (2019). Thermoelectric Performance of Cu2Se Bulk Materials by High-Temperature and High-Pressure Synthesis. J. Materiomics 5, 103–110. doi:10.1016/j.jmat.2018.12.002
Zhang, D., Dera, P. K., Eng, P. J., Stubbs, J. E., Zhang, J. S., Prakapenka, V. B., et al. (2017). High Pressure Single crystal Diffraction at PX^2. JoVE 119, e54660. doi:10.3791/54660
Zhang, Y., Shao, X., Zheng, Y., Yan, L., Zhu, P., Li, Y., et al. (2018). Pressure-induced Structural Transitions and Electronic Topological Transition of Cu2Se. J. Alloys Compd. 732, 280–285. doi:10.1016/j.jallcom.2017.10.201
Keywords: Cu2O, phase transitions, synchrotron single-crystal X-ray diffraction, copper compounds, high pressure
Citation: Qin F, Zhang D and Qin S (2021) High Pressure Behaviors and a Novel High-Pressure Phase of Cuprous Oxide Cu2O. Front. Earth Sci. 9:740685. doi: 10.3389/feart.2021.740685
Received: 13 July 2021; Accepted: 11 August 2021;
Published: 20 August 2021.
Edited by:
Lidong Dai, Institute of Geochemistry (CAS), ChinaReviewed by:
Fang Xu, University College London, United KingdomCopyright © 2021 Qin, Zhang and Qin. This is an open-access article distributed under the terms of the Creative Commons Attribution License (CC BY). The use, distribution or reproduction in other forums is permitted, provided the original author(s) and the copyright owner(s) are credited and that the original publication in this journal is cited, in accordance with accepted academic practice. No use, distribution or reproduction is permitted which does not comply with these terms.
*Correspondence: Fei Qin, ZmVpLnFpbkBjdWdiLmVkdS5jbg==
Disclaimer: All claims expressed in this article are solely those of the authors and do not necessarily represent those of their affiliated organizations, or those of the publisher, the editors and the reviewers. Any product that may be evaluated in this article or claim that may be made by its manufacturer is not guaranteed or endorsed by the publisher.
Research integrity at Frontiers

Learn more about the work of our research integrity team to safeguard the quality of each article we publish.