 Fei Wang
 Qiaoyun Chen
 Jingchen Zhang
 Yingqi Ruan
 Ye Zhuang
 Jian Zhu
 Shicheng Zhang
- State Key Laboratory of Petroleum Resources and Prospecting, China University of Petroleum, Beijing, China
Fracturing fluid imbibition and retention are treated as a main mechanism for oil production from shale reservoirs. However, the oil–water exchange phenomenon during post-fracturing soaking periods has not been thoroughly studied. In this study, a water–oil flow model is built to investigate the water imbibition and oil drainage phenomenon in hydraulically fractured shale. With the developed numerical simulator, the main characteristics of post-fracturing soaking, that is, pressure diffusion, water imbibition, and especially, the oil–water exchange behavior are simulated. Three key time points, that is, oil–water exchange equilibrium, steady exchange efficiency, and oil breakthrough in fracture are found. The oil–water exchange efficiency and exchange volume are also calculated. Moreover, the proposed model is validated by field wellhead pressure dynamics, indicating a relevance of time between the oil–water exchange efficiency and the wellhead pressure falloff derivatives. Finally, the influences of shale permeability, wettability, fracture complexity, and oil viscosity on the oil–water exchange behavior are investigated. Results indicate that the matrix of oil-wet shale almost does not suck water and discharge oil, and only the oil in natural fractures exchanges with the water in hydraulic fractures. The water-wet shale with low permeability, high oil viscosity, and few natural fractures needs extra soaking time to achieve good oil–water exchange performance. The suitable soaking period for the water-wet base case in this study is from 17.25 to 169 days, among which 64 days is the optimal soaking time.
Introduction
Compared with conventional oil reservoirs, shale has relatively high clay content and covers a wide range from 16.8 to 70.1% (Yang et al., 2013). The development of shale oil reservoirs heavily relies on multistage hydraulic fracturing technology (Zhou et al., 2019). After the hydraulic fracturing, the initial production of fractured shale oil wells is good, but the stable production period is quite short (Zou et al., 2020). For pursuing a high oil production rate, a long-term well shut-in has gradually been adopted as an effective mode for field practice, instead of flowing back immediately after hydraulic fracturing because it is believed that fracturing fluid imbibition may strengthen and oil–water exchange may happen during the soaking period. Although extended well soaking may intensify fracturing fluid retention, which is proved by field practice and laboratory experiments. After all, sacrificing water recovery for more oil is acceptable.
The investigation of imbibition behavior is mainly based on laboratory experiments and a pore/core scale analysis. In general, fracturing fluid imbibition behavior can be related to many factors, including rock type (Xiong et al., 2013a; Xiong et al., 2013b; Ren et al., 2015), mineral composition (Akin and Kovscek, 1999; Ali Habibi et al., 2015; Ge et al., 2015), pore structure (Liu and Dai, 2008), formation wettability (ZhuJu et al., 2002; Wang et al., 2012), formation temperature (Li et al., 2011; Zhou et al., 2014), the bedding structure (Ren et al., 2015), connate water saturation (Gao and Hu, 2016), formation fluid (Wang, 2000; Wang and Zhang, 2000), and fracturing fluid type (Paktinat et al., 2005; Penny et al., 2005; Li, 2006; Roychaudhuri et al., 2013). Based on the results of experiments, formation wettability is the most important factor for fluid imbibition since it determines the direction of imbibition, and the extent of wettability determines the oil recovery. The contact area affects the imbibition speed, that is, the larger the contact area is, the faster the imbibition speed is (ZhuJu et al., 2002). Moreover, fluid properties are critical to the imbibition behavior. The content of polar substance in oil may alter the formation wettability and further change the imbibition behavior (Wang, 2000; Wang and Zhang, 2000). In practice, surfactants are added into the fracturing fluid. The existence of surfactant can reduce the interfacial tension (Li, 2006; Roychaudhuri et al., 2013), making the rock more hydrophilic to enhance the capacity of water suction, while microemulsion as a cleanup additive can make the rock wettability to water from strong to weak and then inhibit the capacity of water suction (Paktinat et al., 2005; Penny et al., 2005). Besides, the porosity and permeability of formation are very important to fluid imbibition. It shows that the capillary pressure increases with the decrease of porosity and permeability, which makes the driving force of imbibition to increase (Liu and Dai, 2008).
Besides the experiment-based pore/core scale analysis, the well/reservoir scale imbibition, and the well shut-in simulation mainly focuses on shale gas reservoirs. Wang et al. (2017a) studied the phenomenon of fluid imbibition under the driving forces of osmosis and capillarity and investigated the influence of imbibition on the microfractures induced by hydraulic fracturing in shale gas reservoirs. Their research result shows that clay minerals have the function of a semipermeable membrane and the capacity of water suction is stronger than organic matter and other minerals. Fakcharoenphal et al. (2013) shows that fracturing fluid imbibition in shale can generate microfractures, and it is related with the physical characteristics of reservoir itself and the composition of fracturing fluids. Roychaudhuri et al. (2013) shows that shale reservoir has the characteristics of mixed wetting, which has an important impact on the fracturing fluid imbibition. Odumabo et al. (2014) shows the relation between imbibition volume and soaking time. It shows that the change of permeability in the invasion area of the fracture surface and the distribution of water saturation near the fracture surface are two important factors affecting the post-fracturing shale gas production. Fakcharoenphol et al. (2014) studied the effect of salinity on the fluid imbibition. It shows that osmotic pressure is an important driving force for fluid imbibition. Wang and Leung (2015) established a triple-porosity two-phase flowback model to study the control mechanism of fracturing fluid retention. Their simulation results show that the initial production rate can be increased by extension of soaking time, but for a long-term production rate, soaking is not helpful. Zhang et al. (2017) established a triple-porosity numerical model for hydraulically fractured shale gas wells, which considers the effects of imbibition, stress sensitivity, and gravity differentiation. Their simulation results show that the spontaneous imbibition rate of fracturing fluids in a tight matrix is very low during the well-soaking process. Although shale reservoir has high capillary force, the fracturing fluid still mainly remains in the fracture and near the fracture area after 100 days of soaking. Their simulation results show that although the long-term soaking increases the initial gas production, the long-term cumulative gas production decreases with the extension of soaking time.
From the perspective of modeling and simulation, water imbibition and oil drainage has not been systematically coupled with different driving mechanisms, such as hydraulic pressure difference, wettability-dominated capillarity, and chemical osmosis. To investigate the oil–water exchange behavior in a well/reservoir scale, we build a fracture-matrix water–oil flow model to simulate the fracturing fluid imbibition and the oil drainage process during the post-fracturing soaking periods. We try to use the numerical simulation results to investigate the efficiency and equilibrium time of oil–water exchange under different shale permeability, wettability, fracture complexity, and oil viscosity conditions, which help to optimize the well-soaking time for hydraulically fractured shale oil wells.
Oil–Water Exchange Mechanism Model
Mechanism Description
The water–oil exchange phenomenon in hydraulically fractured shale reservoirs involves two-phase fluids, that is, oil and water, and multiple interconnected media, that is, main hydraulic fractures, induced natural fractures, and matrix pores. In the treatment of hydraulic fracturing, a large amount of water is injected into the wellbore, through the perforating hole into the reservoir to open fractures. When the well is shut-in after fracturing, the wellhead will not be injected anymore and the bottom-hole pressure will diffuse in the reservoir. At the same time, 100% water-saturated hydraulic fractures with high-pressure discharge water into the matrix through induced natural fractures and almost oil-statured shale matrix pores suck water, that is, the water imbibition under the potential difference, which includes hydraulic, capillary, and osmotic pressures (Wang et al., 2017b). Simultaneously, the oil in matrix pores is replaced to hydraulic fractures as compensation. Figure 1 shows a sketch of the oil–water exchange process.
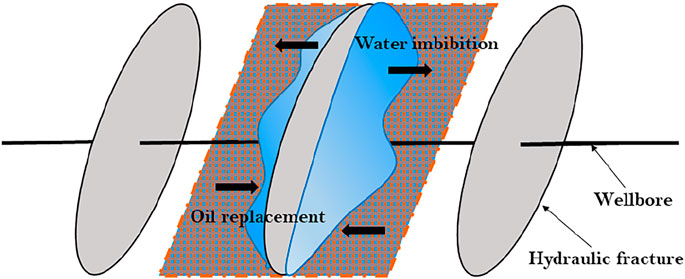
FIGURE 1. Sketch of oil–water exchange process.
Mechanism Model Development
A multi-pore medium comprising of main hydraulic fractures (F), induced natural fractures (f), and matrix pores (m) is proposed for characterizing hydraulically fractured shale reservoirs. The grid representation is exhibited in Figure 2. As shown in the figure, the whole medium is separated into two layers, with the lower one representing m and the upper one representing f. A shape factor (Kazemi et al., 1992) is used to quantify the complexity of f. The refined grids with high conductivity in the upper layer are used to characterize F, which is an identical transverse fracture with height, width, and length. F directly connects to the wellbore (W). In the soaking process, water suck in and oil discharge occurs between two adjacent porous media, as shown in Figure 2. qwFf and qwfm represent the water exchange between F and f and between f and m, respectively, while qofF and qomf represent the oil exchange between F and f and between f and m, respectively. The water–oil exchange in this triple-porosity system is a hydrodynamic equilibrium process. It takes time for oil breakthrough in hydraulic fractures (tFo,brh) and water sucking termination in the matrix (tmw,eqm).
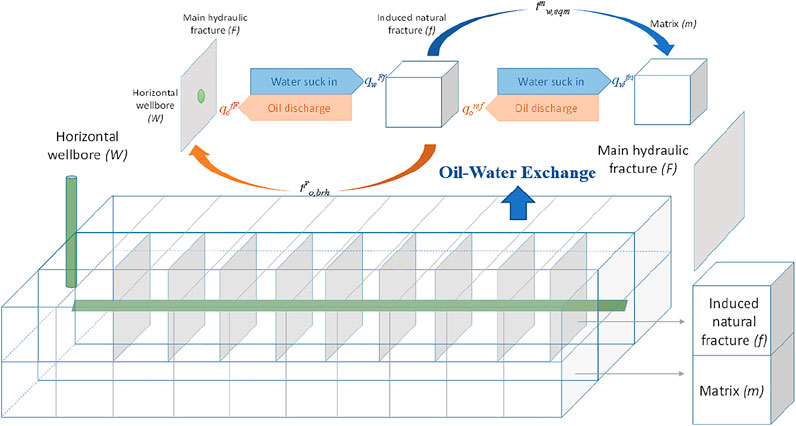
FIGURE 2. Grid representation and mass transfer of the oil–water exchange model.
Mathematical Solution
Assumptions made for this study are as follows. 1) Sodium chloride is the only solute and totally dissolves in either formation brine or fracturing fluid; 2) gravity is not considered; 3) mass transfer occurs inside F, f, m, and between the adjacent media; and 4) the system is isothermal. According to the aforementioned physical model and assumptions, a mathematical model is developed as follows.
Oil–Water Flow Model
Following equations describe fluid mass transfer in F, f, and m, respectively. The subscript j represents water (w) and oil (o). F
where
where
where
where
where
where
where
where
where
where
Model Coupling and Variables Solution
Closed boundary is designed for outer boundary, while initial condition is set according to the end of injection process. The mathematical model is solved with the use of the finite difference method with the detailed algorithm presented in Supplementary Appendix SB. After the model solution, four key variables are obtained, that is, qwFf, qwfm, qomf, and qofF, after which oil–water exchange efficiency and volume dynamics with soaking time can be calculated.
The oil–water exchange efficiency, which is the water imbibition flux divided by the oil drainage flux, can be calculated below.
Oil drainage efficiency of the fracture is as follows:
where qofF is the oil exchange between F and f and qwFf is the water exchange between F and f.
Oil drainage efficiency of the matrix is as follows:
where qomf is the oil exchange between f and m and qwfm is the water exchange between f and m.
The oil–water exchange volume, which is the cumulative flux rate in the soaking period, can be calculated below:
Water sucking volume into the matrix is as follows:
where ts is time.
Oil drainage volume into hydraulic fractures is as follows:
Oil drainage volume into natural fractures is as follows:
Three key time points are also determined. The oil–water exchange equilibrium time (tmw,eqm) is the time when
Oil–Water Exchange Simulation
Simulation Model Description
Numerical simulation of the oil–water exchange is conducted with the use of this model. The length of the horizontal well is 1200 m, the total fracture stages are 15, and the well lies in the reservoir center (1500 m × 560 m×40 m). In every stage, there are four identical transverse hydraulic fractures with a fracture half-length of 140 m and a fracture spacing of 20 m along the horizontal wellbore.
The relative permeability and capillary force (Brooks and Corey, 1964) are used to represent the formation wettability, so the curves of each domain are set on the basis of the typical water-wet formation in the Bakken shale oil basin (Fakcharoenphol et al., 2014). The porosity and permeability of the fracture system are assigned according to Aguilera chart of compressibility coefficients (Aguilera, 1999). Other parameters input are detailed in Table 1. The fracturing fluid pumping scheme is simulated as the injection of water with pressure-dependent fracture porosity curve increases. The results of saturation as well as fluid pressure are input as initial conditions for the following 1 year soaking simulation.
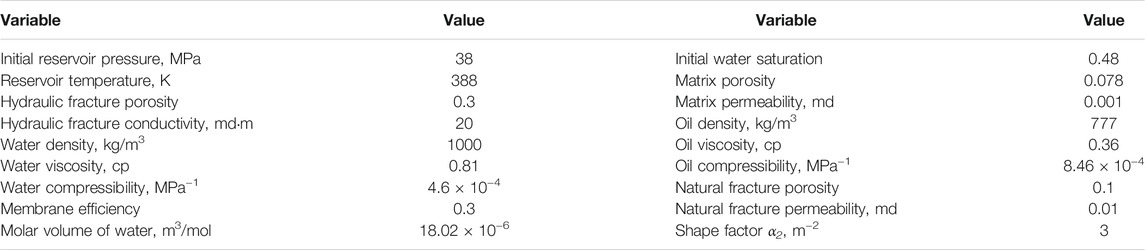
TABLE 1. The simulation parameters (Fritz and Marine, 1983; Cheng et al., 2009; Fakcharoenphol et al., 2014; Wang et al., 2020).
Simulation Results of Pressure and Saturation Fields
Figures 3, 4 display the evolution of pressure profiles during the soaking periods in the fracture and the matrix, respectively. Results shows that during the well soaking, the water phase pressure inside and near the hydraulic fracture declines, while the distant pressure in the natural fracture and the matrix increases. That is a typical bottom-hole pressure diffusion and reservoir energy storage phenomena in soaking periods.
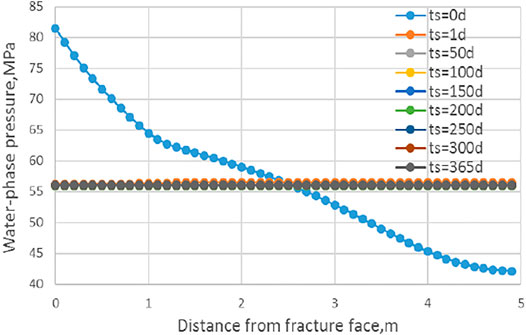
FIGURE 3. Fracture pressure profile during soaking periods.
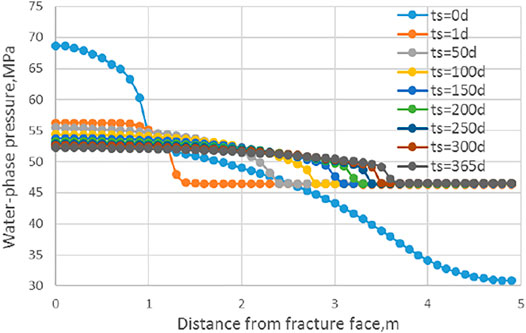
FIGURE 4. Matrix pressure profile during soaking periods.
Figures 5, 6 display the evolution of saturation profiles during the soaking periods in the fracture and the matrix, respectively. It shows that during the well-soaking process, the water saturation in the fracture decreases, while the distant water saturation in the matrix increases continually. That is a typical water imbibition phenomenon in soaking periods.
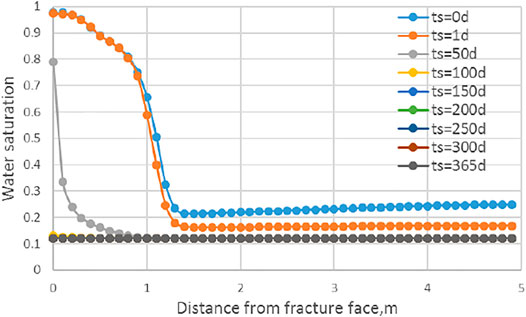
FIGURE 5. Fracture saturation profile during soaking periods.
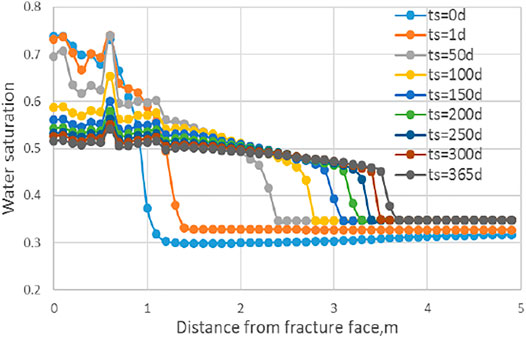
FIGURE 6. Matrix saturation profile during soaking periods.
Simulation Results of Oil–Water Fluxes
Figures 7, 8 display the water and oil fluxes among F, f, and m, respectively, during soaking periods. It indicates that F discharges water to f, while m sucks water from f and discharges oil into the fracture system. The end time of F discharging water is about the 110th day and the imbibition equilibrium time of m is about 169 days. The oil breakthrough time is about 1.29 days.
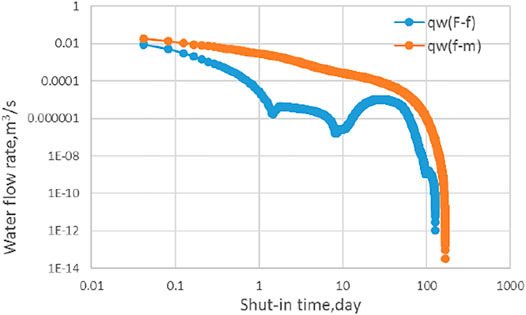
FIGURE 7. Water fluxes with soaking time.
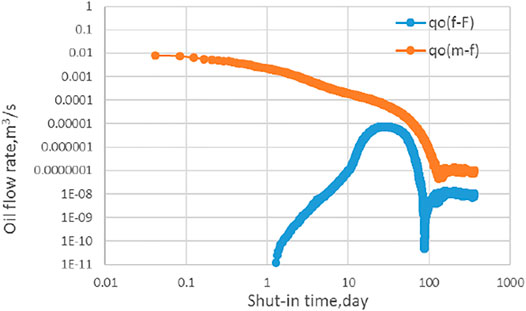
FIGURE 8. Oil fluxes with soaking time.
As shown in Figure 9, the simulated oil drainage efficiency of the fracture system shows a hump trend in the first several weeks, while the exchange efficiency of the matrix system shows a slightly downward trend. The maximum values of exchange efficiency occur at the end time of F discharging water and m sucking water, respectively. The steady exchange efficiency of F occurs at the soaking time of 17.25 days and lasts to 64 days, during which the value of exchange efficiency is 0.805. Figure 10 shows the evolution of water–oil exchange volumes with soaking time. It indicates that the three volumes of water sucking into m, oil drainage into F, and f all increase with soaking time, but the increment tends to slow down from the 64th day on. At the end of 1 year soaking, there are 1486 m3 of water sucking into the matrix and 1056 m3 of oil being replaced into the fracture system (21 m3 in F and 1035 m3 in f).
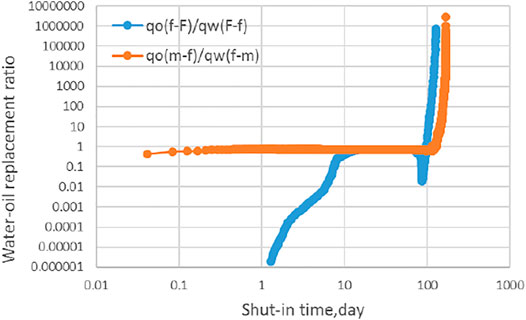
FIGURE 9. Water–oil exchange efficiency with soaking time.
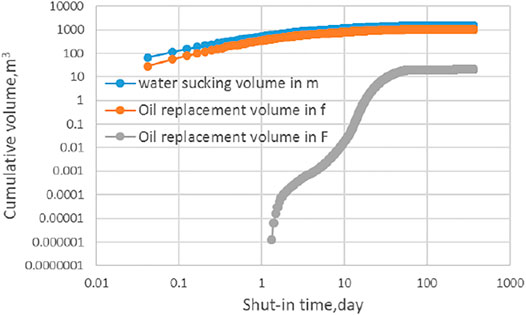
FIGURE 10. Water–oil exchange volume with soaking time.
Simulation Results of Bottom-Hole Flowing Pressure Dynamics
Figure 11A displays the simulated bottom-hole flowing pressure dynamics of the base case during 1 year soaking. To describe the water–oil flow dynamics, pressure falloff analysis theory is applied. Figure 11B displays the calculated pressure falloff and Bourdet derivatives. The Bourdet derivatives show a W-shaped curve. The first derivative rising stage in W-shaped derivative curve starts from 1.29 days, corresponding to the simulated oil breakthrough time tFo,brh. In the later stage, the fluctuations of the derivative curve, like the inflection points at 5.6 and 8.7 days, are consistent with the trend change points on the oil drainage efficiency curve of the hydraulic fracture, that is, the blue curve shown in Figure 9. The steady exchange efficiency of F, which occurs from 17.25 to 64 days, is reflected by a constant slope of the second derivative rising stage in the W-shaped derivative curve. After soaking for 64 days, the pressure drop is very small, which exhibits the derivative curve falling. Until soaking 110 days, there is no pressure drop, and the derivative curve drops to zero.
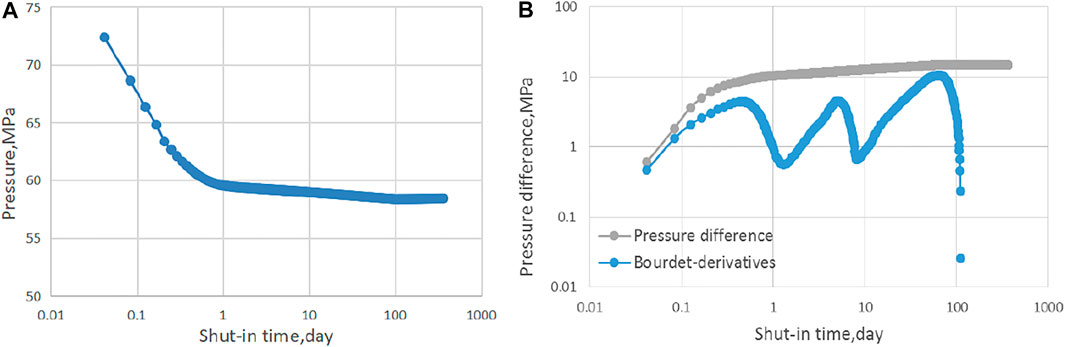
FIGURE 11. The simulated pressure falloff dynamics: (A) bottom-hole flowing pressure and (B) pressure falloff and derivatives.
Model Validation
The fluid mass transfer between different media and the pressure of these media are difficult to monitor, because monitoring techniques in the soaking period are limited. Therefore, the wellhead or bottom-hole pressure falloff is the only index that can be used to validate the model.
Shale formation C is characterized by the following reservoir properties: initial pressure = 38 MPa; effective thickness = 10∼40 m; permeability = 0.001∼0.01 md; porosity = 0.07∼0.11; and induced natural fracture density = 0.16∼0.25 m−2. The induced natural fracture density is obtained from the field report. It is converted to the α2 in the model (α2 = 2.5∼5 m−2) based on previous studies (Kazemi et al., 1992; Yan and Mi, 2017). This formation is stimulated by hydraulic fracturing treatment for commercial oil production. The volume of fracturing fluid injected to each well ranges from 7,920 to 6,3589 m3; the volume of proppant added to each well ranges from 440 to 4,550 m3; the fracture stages for each well range from 5 to 36. The wells in this formation are shut-in from 19 to 61 days after stimulation. During the well soaking period, the wellhead pressure is monitored continuously. The wellhead pressure records of 10 wells during post-fracturing soaking periods are shown in Figure 12A. The Bourdet derivatives of recorded wellhead pressure falloff, shown in Figure 12B, exhibit the typical W-shaped curves, which are consistent with our simulated results in Figure 11B. Based on the simulated relevance of time between the oil–water exchange and the pressure falloff derivatives above, it can be inferred that oil breakthrough already happens for most of wells since the first derivative rising stage in their W-shaped derivative curves exists from the initial 3 days recorded pressure data. However, the derivative falling after the second rising stage in their W-shaped derivative curves is not prevalent, indicating that water–oil exchange efficiency of well is still in a rising stage and it is still early to open the well for production.
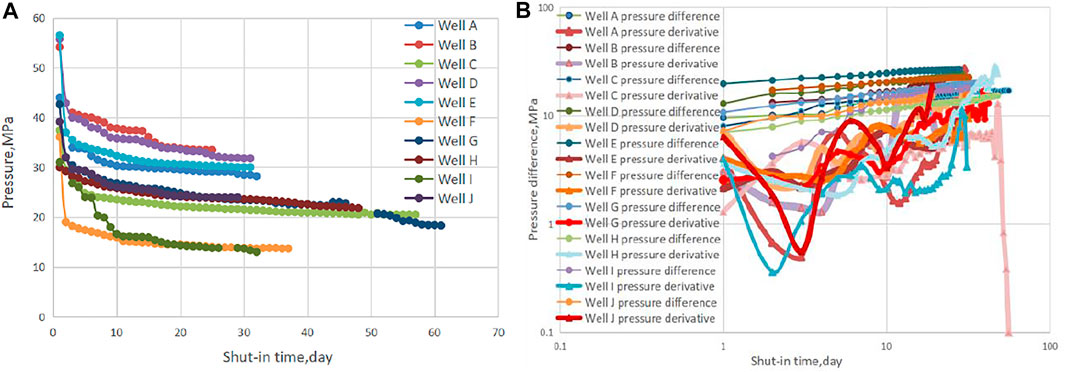
FIGURE 12. The field recorded pressure falloff dynamics of 10 wells in shale formation C: (A) wellhead pressure and (B) pressure falloff and derivatives.
Sensitivity Analysis
The influences of shale permeability (km), wettability, fracture complexity (α2), and oil viscosity (µo) on the oil–water exchange behavior are investigated. The evaluation indicators include oil breakthrough time (tFo,brh), steady exchange efficiency time (tFow,std), exchange equilibrium time (tmw,eqm), and water–oil exchange efficiency volumes (QFo, Qfo, and Qmw). The oil–water relative permeability and capillary pressure curves for the sensitivity analysis of oil-wet shale formation are assigned below (Wang, 2000; Li, 2006).
Figure 13 shows the times of imbibition equilibrium, oil breakthrough, and steady exchange efficiency with different shale prosperities during well soaking. It indicates that µo increasing from 0.36 to 1.62 causes tFo,brh, tFow,std, and tmw,eqm to increase, while both α2 increasing from 0.03 to 10 and km increasing from 0.001 to 0.01 cause tFo,brh, tFow,std, and tmw,eqm to decrease. By contrast to the water-wet base case, the oil-wet case shows a shorter imbibition equilibrium time (tmw,eqm = 0.25 days) and a longer oil breakthrough time (tFo,brh = 1.75 days). The steady exchange efficiency for the oil-wet case is about 0.01, which is far below that of the water-wet base case.
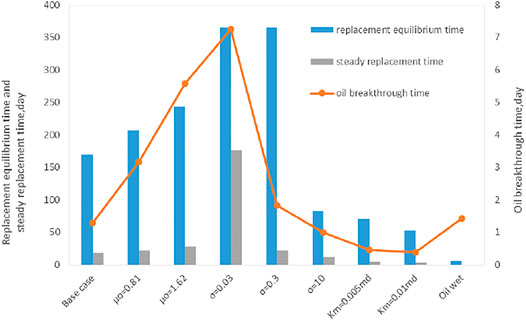
FIGURE 13. Times of imbibition-replacement equilibrium, oil breakthrough, and steady exchange efficiency with different shale prosperities.
Figure 14 shows the 1-year oil–water exchange volumes with different shale prosperities. The simulation results indicate that µo increasing from 0.36 to 1.62 causes the Qwm and Qof to decrease, but it causes QoF to increase slightly from 21 m3 to 35 m3 and km increasing from 0.001 to 0.01 causes both the Qwm and QoF to decrease, but it causes Qof to increase from 1035 m3 to 1093 m3. The α2 increasing from 0.03 to 10 causes the Qwm, Qof and QoF to increase first and then decrease, which indicates a complicated imbibition-replacement behavior in the fracture-matrix system. By contrast to the water-wet base case, the oil-wet case shows that the matrix sucks water 36.72 m3 within the first 0.25 days and then discharges water for 1 year, which leads to a negative water-sucking volume (Qwm = −851 m3) and a negative oil discharge volume (Qof = −697 m3). The oil drainage volume in the hydraulic fracture is very small: QoF = 0.003 m3.
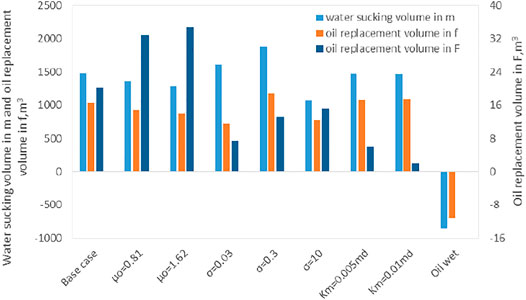
FIGURE 14. The one year oil–water exchange volumes with different shale prosperities.
Based on our simulation results above, the oil–water exchange behavior during soaking periods can be summarized and used to direct the engineering practice for determination of optimal well-soaking time. For the water-wet base case, the water imbibition and oil drainage occur in the matrix at the beginning of the soaking periods, which exhibits that the water in F enters m through f, but the oil breakthrough in F will be delayed to 1.29 days. The water sucking equilibrium of the matrix occurs on the 169th day, which means that the oil–water displacement driven by hydraulic pressure difference ends, after which the water flow into the matrix is driven by spontaneous imbibition. The imbibition equilibrium time of the matrix, that is, 169 days, can be the upper limit soaking time. Before that, the water–oil exchange efficiency shows a hump trend. The imbibition efficiency tends to be stable from 17.25 to 64 days, and the stable value is 0.805. The volume of water–oil exchange from 64 to 169 days is very small, which is mainly the amount that the oil already discharged from f and enters F. So the suitable soaking period for the water-wet base case is from 17.25 to 169 days, among them 64 days are the optimal soaking time.
From the sensitivity simulation, it can be inferred that the water-wet shale reservoir with low permeability, high oil viscosity, and few natural fractures needs extra soaking time to achieve good oil–water exchange performance. However, for the oil-wet shale reservoir, the matrix almost does not suck water and discharge oil, but only the oil in natural fractures exchanges with the water in hydraulic fractures. So the water–oil exchange efficiency is very low, and extending the soaking time cannot achieve good oil–water exchange performance.
Conclusion
In this study, a water–oil flow mechanism model is built to investigate the water–oil exchange behaviors in hydraulically fractured shale during soaking periods. Some understandings of the key points are summarized below.
1) The simulation results prove the occurrence conditions for water–oil exchange, that is, water-wet rock can make the oil in the matrix replaced by the water in fractures, while for oil-wet rock, the oil in the matrix cannot be replaced out by well soaking and the oil in natural fractures will be further squeezed into matrix pores with the extension of soaking time, resulting in production difficulty.
2) The simulation results reflect the water–oil exchange behavior in water-wet shale, that is, the water imbibition and oil drainage occur in the matrix at the beginning of the soaking periods, but the oil breakthrough will be delayed to 1.29 days. The water-sucking equilibrium in the matrix occurs on the 169th day, which means that the oil–water exchange driven by hydraulic pressure difference ends, after which the water flow into the matrix is driven by spontaneous imbibition.
3) The simulation results indicate that low matrix permeability and high oil viscosity are detrimental to oil–water exchange, which exhibits low exchange efficiency, late oil breakthrough, and longer equilibrium time. On the contrary, the existence of natural fractures is advantageous to oil–water exchange, which is characterized by short imbibition equilibrium time, fast oil breakthrough, and high oil exchange efficiency.
4) Simulation results guide the determination of optimal soaking time. The steady exchange efficiency time (tFow,std) and imbibition equilibrium time (tmw,eqm) can be the lower and upper limit soaking time, respectively. Among this period, the optimal soaking time can be further determined according to the expected oil discharge rate of the matrix and oil drainage rate of hydraulic fractures.
5) The model simulation results also indicate a relevance of time between the oil–water exchange efficiency of hydraulic fractures and the pressure falloff derivatives. This indication can be used for determining oil–water exchange efficiency of actual wells.
Data Availability Statement
The original contributions presented in the study are included in the article/Supplementary Material; further inquiries can be directed to the corresponding author.
Author Contributions
Methodology, FW; software, QC; formal analysis, JZ and YR.; data curation, YZ, JZ, and YR; writing—original draft preparation, FW, QC, and YR; writing—review and editing, FW, QC, and YR; and supervision, SZ.
Funding
The authors would like to acknowledge the National Natural Science Foundation of China (No. 51974332 and No. U1762210) and Xinjiang TianshanYouth Program (No. 2018Q030) for their financial support.
Conflict of Interest
The authors declare that the research was conducted in the absence of any commercial or financial relationships that could be construed as a potential conflict of interest.
Publisher’s Note
All claims expressed in this article are solely those of the authors and do not necessarily represent those of their affiliated organizations, or those of the publisher, the editors, and the reviewers. Any product that may be evaluated in this article, or claim that may be made by its manufacturer, is not guaranteed or endorsed by the publisher.
Supplementary Material
The Supplementary Material for this article can be found online at: https://www.frontiersin.org/articles/10.3389/feart.2021.735972/full#supplementary-material.
References
Aguilera, R. (1999). Recovery factors and reserves in naturally fractured reservoirs. J. Can. Pet. Technol. 38, 4. doi:10.2118/99-07-da
Akin, S., and Kovscek, A. R. (1999). Imbibition studies of low-permeability porous media. Calgary: Society of Petroleum Engineers. SPE-54590-MS.
Ali Habibi, A., Xu, M., Dehghanpour, H., and Bryan, D. (2015). Unconventional Resources Conference in the Montney Tight Oil Play. Calgary: Society of Petroleum Engineers. doi:10.2118/175924-MS
Brooks, R., and Corey, A. (1964). Hydraulic Properties of Porous Media, Hydrol. Pap. No. 3. Hydrol. Pap. 3, 892–898.
Cheng, Y., Lee, W. J., and MacVay, D. A. (2009). A New Approach for Reliable Estimation of Hydraulic Fracture Properties Using Elliptical Flow Data in Tight Gas Wells. SPE Reservoir Eval. Eng. 12 (2), 254–262. doi:10.2118/105767-pa
Fakcharoenphol, P., Kurtoglu, B., Kazemi, H., Charoenwongsa, S., and Wu, Y.-S. (2014). The Effect of Osmotic Pressure on Improve Oil Recovery from Fractured Shale Formations. Calgary: Society of Petroleum Engineers. doi:10.2118/168998-MS
Fakcharoenphol, P., Torcuk, M., Bertoncello, A., Kazemi, H., Wu, Y.-S., Wallace, J., et al. (2013). Managing Shut-In Time to Enhance Gas Flow Rate in Hydraulic Fractured Shale Reservoirs: A Simulation Study. Calgary: Society of Petroleum Engineers. doi:10.2118/166098-MS
Fritz, S. J., and Marine, I. W. (1983). Experimental support for a predictive osmotic model of clay membranes. Geochimica et Cosmochimica Acta 47 (8), 1515–1522. doi:10.1016/0016-7037(83)90310-1
Gao, Z., and Hu, Q. (2016). Initial Water Saturation and Imbibition Fluid Affect Spontaneous Imbibition into Barnett Shale samples. J. Nat. Gas Sci. Eng. 34, 541∼551. doi:10.1016/j.jngse.2016.07.038
Ge, H. I., Liu, Y., and Shen, Y. H. (2015). Experimental Investigation of Shale Imbibition Capacity and the Factors Influencing Loss of Hydraulic Fracturing Fluids. Pet. Sci. 12, 636–650. doi:10.1007/s12182-015-0049-2
Kazemi, H., Gilman, J. R., and Elsharkawy, A. M. (1992). Analytical and numerical solution of oil recovery from fractured reservoirs with empirical transfer functions (includes associated papers 25528 and 25818). SPE Reservoir Eng. 7 (2), 219–227. doi:10.2118/19849-pa
Li, A., Fan, T., and Zhao, L. (2011). Experimental Research on Spontaneous Imbibition of Low Permeability Core in Fractured Reservoir. Pet. Geology. Recovery Efficiency 18 (5), 67–69.
Li, J. S. (2006). The Effect of Surfactant System on Imbibition Behavior. 2006. PhD thesis, Chinese Academy of Sciences, 2006.
Liu, X., and Dai, Q. (2008). Experimental Study of Imbibition Law in Low Permeability Sandstone Oilfield. Drilling Prod. Tech. 31 (6), 110–112.
Odumabo, S. M., Karpyn, Z. T., and Ayala H., L. F. (2014). Investigation of gas flow hindrance due to fracturing fluid leakoff in low permeability sandstones. J. Nat. Gas Sci. Eng. 171-12, 1–12. doi:10.1016/j.jngse.2013.12.002
Paktinat, J., Pinkhouse, J., and Williams, C. (2005). Penny Microemulsion Reduces Adsorption and Emulsion Tendencies in Bradford and Speechley Sandstone Formations. SPE, 93270. doi:10.2118/93270-MS
Penny, G., Pursley, J. T., and Holcomb, D. (2005). The Application of Microemulsion Additives in Drilling and Stimulation Results in Enhanced Gas Production. SPE, 94274. doi:10.2118/94274-MS
Ren, K., Ge, H., and Yang, L. (2015). Experimental Spontaneous Imbibition in Shale and its Application of Flowback Analysis. Reservoir Sci. Tech. Eng. 30 (15), 106–109.
Roychaudhuri, B., Tsotsis, T. T., and Jessen, K. (2013). An Experimental Investigation of Spontaneous Imbibition in Gas Shales. J. Pet. Sci. Eng. 111, 87–97. doi:10.1016/j.petrol.2013.10.002
Wang, F., Chen, Q., and Ruan, Y. (2020). Hydrodynamic Equilibrium Simulation and Shut-in Time Optimization for Hydraulically Fractured Shale Gas Wells. Energies 13, 961. doi:10.3390/en13040961
Wang, F., Pan, Z., and Zhang, S. (2017). Impact of chemical osmosis on water leakoff and flowback behavior from hydraulically fractured gas shale. J. Pet. Sci. Eng. 151, 264–274. doi:10.1016/j.petrol.2017.01.018
Wang, F., Pan, Z., and Zhang, S. (2017). Modeling Water Leak-off Behavior in Hydraulically Fractured Gas Shale under Multi-mechanism Dominated Conditions. Transp Porous Med. 118, 177–200. doi:10.1007/s11242-017-0853-9
Wang, M., and Leung, J. Y. (2015). Numerical investigation of fluid-loss mechanisms during hydraulic fracturing flow-back operations in tight reservoirsfluid-loss mechanisms during hydraulic fracturing flow-back operations in tight reservoirs. J. Pet. Sci. Eng. 133, 85–102. doi:10.1016/j.petrol.2015.05.013
Wang, Q., Guo, B., and Gao, D. (2012). Is Formation Damage an Issue in Shale Gas Development? Soc. Pet. Eng. doi:10.2118/149623-MS
Wang, W. (2000). The Effect of Oil Composition and Pore Structure on Absorption. Pet. Geology. Oilfield Dev. Daqing. 1 (6), 7∼9. doi:10.2118/149623-MS
Wang, W., and Zhang, G. (2000). The Effect of Irreducible Water Saturation and Rock Properties on Imbibition. Acta Petrolei Sinica 21 (3), 69.
Xiong, W., Cheng, X., and Liu, H. (2013). Experimental Research of Spontaneous Imbibition in Low-permeabilityGlutenite. Reservoir. Sci. Tech. Eng. (26), 7793–7797.
Xiong, W., Cheng, X. Q., and Liu, H. X. (2013). Experimental study on spontaneous imbibition of low permeability glutenite reservoirs in Xinjiang. Sci. Tech. Eng. (26), 7793–7797.
Yan, B., and Mi, L. (2017). Mechanistic Simulation Workflow in Shale Gas Reservoirs. Presented at the SPE Reservoir Simulation Conference Held in Montgomery. TX, USA. SPE-182623-MS, 20–22. doi:10.2118/182623-MS
Yang, F., Ning, Z. F., and Hu, P. C. (2013). Characterization of microscopic pore structures in shale reservoirs. Acta Pet. Sin. 34 (2), 301–310.
Zhang, T., Li, X., Li, J., Feng, D., Li, P., Zhang, Z., et al. (2017). Numerical investigation of the well shut-in and fracture uncertainty on fluid-loss and production performance in gas-shale reservoirsfluid-loss and production performance in gas-shale reservoirs. J. Nat. Gas Sci. Eng. 46, 421–435. doi:10.1016/j.jngse.2017.08.024
Zhou, Q., Jin, Z., Yang, G., Dong, N., and Shang, Z. (2019). Shale oil exploration and production in the U.S.: Status and outlook. Oil Gas Geology. 40 (3), 469–477.
Zhou, Z., Hoffman, B., and Bearinger, D. (2014). Experimental and Numerical Study on Spontaneous Imbibition of Fracturing Fluids in Shale Gas Formation. SPE, 171600. doi:10.2118/171600-ms
ZhuJu, W. Y., Zhao, M., Chen, Q., and Yang, Z. (2002). Spontaneous Imbibition Mechanism of Low through Porous Media and Waterflooding in Low-Permeability Fractured Sandstone Reservoir. Acta Petrolei Sinica 2002 (06), 56–59+3.
Keywords: shale oil, post-fracturing soaking, oil–water exchange, soaking time, modeling and simulation
Citation: Wang F, Chen Q, Zhang J, Ruan Y, Zhuang Y, Zhu J and Zhang S (2021) Numerical Investigation of Oil–Water Exchange Behaviors in Shale During Post-Fracturing Soaking Periods. Front. Earth Sci. 9:735972. doi: 10.3389/feart.2021.735972
Received: 04 July 2021; Accepted: 13 August 2021;
Published: 14 October 2021.
Edited by:
Zhehui Jin, University of Alberta, CanadaReviewed by:
Sen Wang, China University of Petroleum (Huadong), ChinaYuliang Su, China University of Petroleum (Huadong), China
Copyright © 2021 Wang, Chen, Zhang, Ruan, Zhuang, Zhu and Zhang. This is an open-access article distributed under the terms of the Creative Commons Attribution License (CC BY). The use, distribution or reproduction in other forums is permitted, provided the original author(s) and the copyright owner(s) are credited and that the original publication in this journal is cited, in accordance with accepted academic practice. No use, distribution or reproduction is permitted which does not comply with these terms.
*Correspondence: Fei Wang, d2FuZ2ZlaUBjdXAuZWR1LmNu