 Teng Ma
 Ling Han3,4*
- 1School of Earth Science and Resources, Chang’an University, Xi’an, China
- 2Water Conservancy and Civil Engineering College, Inner Mongolia Agricultural University, Hohhot, China
- 3Shaanxi Key Laboratory of Land Consolidation, Xi’an, China
- 4College of Geological Engineering and Geomatics, Chang’an University, Xi’an, China
Soil moisture is an important parameter for global soil moisture transport, environmental evaluation, and precision agricultural research. The accurate retrieval of soil moisture in farmland areas using Synthetic Aperture Radar (SAR) depends on the accurate description of surface and SAR parameters. In these parameters, surface roughness and incidence angle are the key factors that affect the accuracy of the soil moisture retrieval model. This article proposes a modified Dubois model to retrieve soil moisture suitable for the bare surface of farmland area. The model eliminates the incidence angle parameters and uses polarization parameters to depict the surface roughness parameters in the Dubois model. To eliminate the incidence angle, the backscattering coefficients gamma0, which eliminates the effect of the incidence angles, are used to replace the sigma0. Under rain and no rain condition, the trend of backscattering coefficients (VH and VV) and cross-polarization ratio (VH-VV) of different soil texture with the soil moisture are compared. Then, the polarization parameter based on VH backscattering coefficients is used to describe surface roughness. The model is evaluated with time-series soil moisture observation data in situ of the study area. The results indicate that the modified model can retrieve soil moisture with high accuracy, and the total RMSE can reach 0.064 cm3cm−3 while the Dubois model is 0.124 cm3cm−3. Under rain and no rain condition, the retrieval accuracy of the modified model is 0.066 cm3cm−3 and 0.063 cm3cm−3. The retrieval accuracy is 0.060 cm3cm−3 and 0.067 cm3cm−3 under high and low incidence angles conditions, respectively. These results indicate that the modified Dubois model can retrieve soil moisture with high accuracy under different conditions.
Introduction
Soil moisture is a key parameter in the Earth’s water cycle (Tao et al., 2003; Ralph et al., 2013; Anagnostopoulos et al., 2017; Zhu et al., 2021). In the field of atmospheric sciences, it directly impacts the energy exchange between the hydrosphere and atmosphere. It is also a key intermediate variable that can be used to determine irrigation quota, retrieve crop growth and predict the yield of agriculturally productive fields (Zhu and Lin 2011; Rossato et al., 2017). How to accurately retrieve the soil moisture content over a large area is a meaningful scientific problem. The synthetic aperture radar (SAR) is an effective method to detect soil moisture because the microwave can avoid the disturbances from clouds, fog and rain, and it is sensitive to the dielectric constant of objects (Li et al., 2021; Petropoulos et al., 2014; Bai et al., 2015).
The SAR-observed backscattering coefficients of soil, sigma0 (
The dielectric constant is another important factor that affects the backscattering coefficients, which is closely related to soil conditions such as soil texture (Leschanskiy et al., 1971; Hoekstra and Delaney, 1974; Beale et al., 2019), temperature (Dobson et al., 1985; Xu, 1985; Jin et al., 2020; Wang et al., 2020) and moisture (Stogryn, 1971; Zhang et al., 2020). Previous studies have explored many dielectric constant models, which treat soil as a mixture of soil particles, water and air. Different contents of sand, silt and clay particles will lead to differences in the dielectric constant of soil. Relative to the dielectric constant and temperature of solid soil, the influence of soil moisture on the dielectric constant of soil is more critical (Alharthi and Lange, 1987; Patel et al., 2021).
There are many models that describe the relationship between the backscattering coefficients and surface parameters. These models can be divided into three categories: theoretical models (Ulaby et al., 1990; Fung et al., 1992; Wu et al., 2001; Su and Cao, 2021), semi-empirical models (Oh et al., 2002; Oh, 2004; Yang et al., 2021; Chen et al., 2003) and empirical models (Shi et al., 1997; Baghdadi et al., 2006; Montaldo et al., 2021). Among above models, semi-empirical models are more widely used than other models. The main advantages of semi-empirical models are that they can avoid the problem of requiring too many parameters in the theoretical models and the low applicability of the empirical models. The Dubois model and the Oh model are the typical empirical models that are most widely used in practical applications. The main error sources of semi-empirical models include the errors of roughness parameters and dielectric constant model.
In previous studies about soil moisture retrieval, many alternative parameters for the Rms height have been proposed, but the parameters are easily affected by many factors, such as the precipitation, incidence direction of microwave and soil texture (Davidson et al., 2000; Benninga et al., 2019; Liao et al., 2021), so soil roughness is still an important parameter that affects the accuracy of the measured soil moisture content. Cultivating in the farmland significantly affects the surface roughness. Clarifying the backscattering characteristics and roughness description parameters in cultivated and uncultivated farmland can effectively improve the retrieval accuracy of soil moisture. Rain will also affect soil moisture. However, the response of soil moisture and backscattering coefficients to rain is related to the time and the volume of rain. Therefore, how to retrieve soil moisture under rain conditions needs further discussion. In addition, differences in soil texture are often overlooked or considered to be spatially consistent because they do not change notably with time and space. Due to differences in soil parent material, climate, and biological effects, soil texture may change considerably over small scales. Changes in the soil particle sizes will not only affect the saturated water content of soil but will also affect the soil dielectric constant.
The objectives of this research are 1) to modify the Dubois model that can retrieve soil moisture effectively without measuring surface roughness. 2) to determine the retrieval accuracy of soil moisture using modified Dubois model under different incidence angle and rain conditions. We investigate the backscattering coefficients of typical bare surface of farmland areas that have been cultivated and uncultivated. Based on this, the Dubois model is modified for soil moisture retrieval. The retrieval accuracy of the Dubois model and modified Dubois model are evaluated, and the impact of incidence angle and rain conditions on backscattering coefficients are also compared.
Datasets and Pre-processing
Study Area
The study area is located in the Duero Basin, northwest in Spain (Figure 1A). The geographical location of the study area is 41°06′N-41°32′N, 5°01′W-5°45′W (Figure 1B) and corresponding area is about 1,300 km2. The climate of the area belongs to the mediterranean climate, and the annual average temperature is 12°C. The main land-use types are farmland, forest, city and water areas. The main types of crop include wheat, cereal, maize, grape and cotton. The REMEDHUS soil moisture network is established in the study area, which has 24 soil moisture observation stations (Hydra Probes, Stevens Water Monitoring System) and belongs to the International Soil Moisture Network (Dorigo et al., 2011; Dorigo et al., 2013; Campus, 2019). Probes measure 0–5 cm soil moisture and temperature every hour.
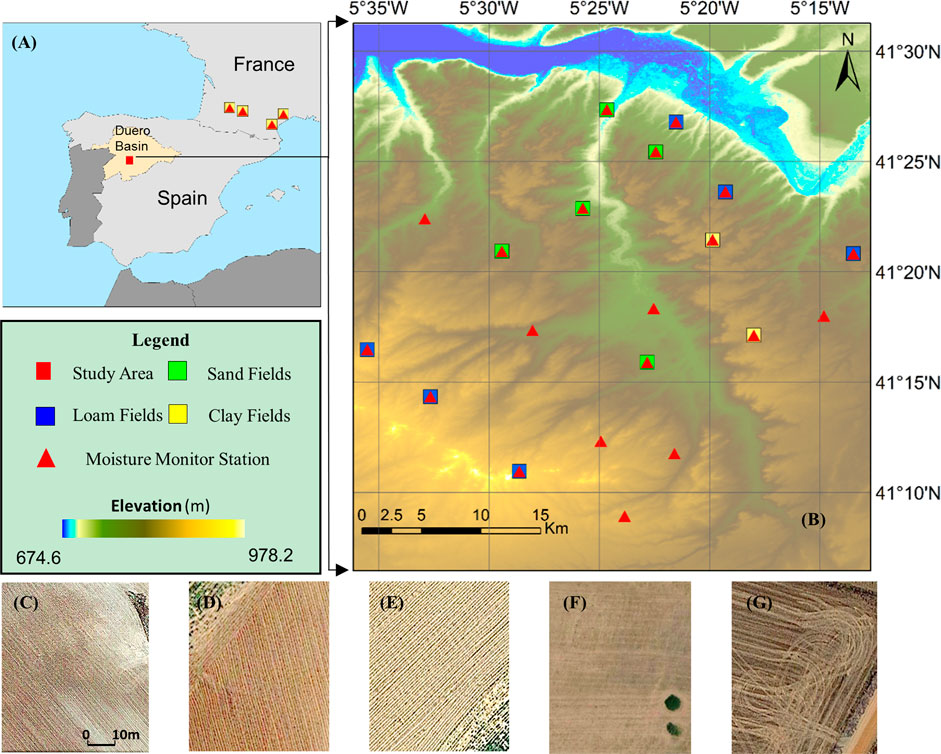
FIGURE 1. (A) Location of the Duero Basin (B) Selected fields in the study area (C) Cultivated clay field (D) Cultivated loam field (E) Cultivated sand field (F) Uncultivated field (G) Plot with straw.
The geological substrate of the study area include sandstones, conglomerates, detritic limestones, and fluvial deposits of conglomerates, gravels and sands. 13 in 24 soil moisture monitoring stations were selected (Figure 1B), and other 11 fields were excluded because their observations are vegetation-related or lack of soil moisture content during the measurement period. These 13 fields consist of two clay texture fields, six loam texture fields and five sand texture fields. A supplementary dataset which include four monitoring stations in southern France were also selected. Figures 1C–E show the bare farmland surface of clay, loam and sand texture which have been cultivated. The spacing between ridge in the fields is approximately 0.5 m. Figure 1F shows the uncultivated field, the surface roughness of these part of fields is relatively small. Some fields contain straw, which will have a certain effect on the backscattering coefficients (Figure 1G), the data in these fields needs to be excluded.
Imagery and Ground Data
104 Sentinel-1 and 23 Sentinel-2 images, over the study area, between 2017 and 2018 were obtained from the Copernicus Open Access Hub (Copernicus, 2018). The acquisition modes of Sentinel-1 data are the interferometric (IW) mode and the level 1 ground range detected (GRD) product type, the spatial resolution of images are 20 × 22 m (4.4 equivalent number of looks). The details of Sentinel-1 data are shown in Table 1. The observed Sentinel-2 data are level 1C or level 2A products. By performing atmospheric correction on S2 level 1C data, the level 2A data were obtained. The local incidence angle is calculated using SRTM 1 s DEM data, which has a spatial resolution of 30 m.
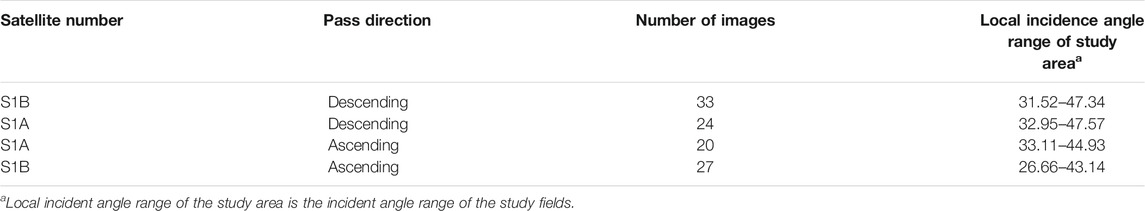
TABLE 1. List of satellite acquired.
The soil moisture content data were obtained from the ISMN. To reduce the impact of measurement errors, the hourly observation data in every day were averaged to obtain the daily soil moisture content. Global Satellite Mapping of Precipitation (GsMap) was obtained from Google Earth Engine, which provides a global hourly rain rate with a 0.1 × 0.1° resolution (Gorelick et al., 2017).
Sentinel-1 images were preprocessed by the following steps: 1) introducing the orbit file to eliminate orbit error; 2) obtaining the backscattering coefficients based on the calibration for Sentinel-1 images; 3) A 5 × 5 Lee Sigma speckle filter was used to eliminate the speckle noise in the backscattering-coefficients image; 4) terrain-flattening, to eliminate radiation errors caused by spheroids and terrain fluctuations; and 5) Applying terrain correction to eliminate the geometrical error caused by spheroids and terrain fluctuations. To eliminate the variation in the backscattering coefficients caused by the different terrains and local incidence angles, a Gamma0 (
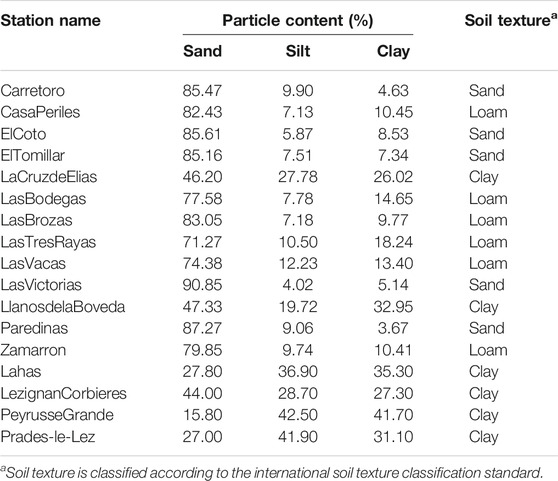
TABLE 2. Soil texture of study plots.
Methods
Procedure of developing the modified Dubois model is illustrate in Figure 2. Firstly, pre-processed Sentinel-1 and Sentinel-2 images. After the pro-processing step, the bare soil surface of study area was obtained. Secondly, the images were combined with the ground surface data, and a revised Dubois model was established based on the analysis. Finally, the modified model was verified using measurement in-situ.
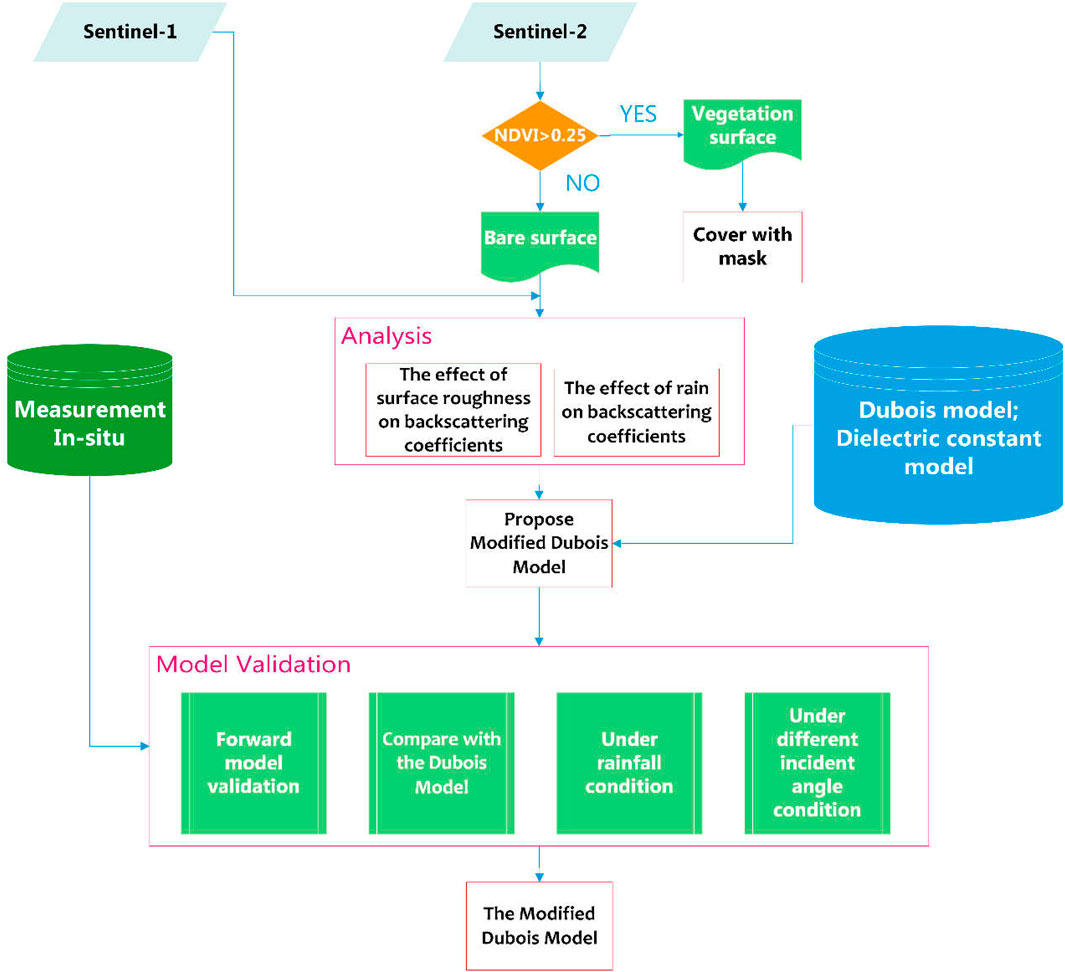
FIGURE 2. Flowchart for retrieving soil moisture.
Dielectric Constant
The soil dielectric constant is closely related to soil particle size, soil porosity and soil moisture. Retrieving soil moisture using microwave remote sensing depends on the characteristics of microwave, which is sensitive to the dielectric constant, so an accurate retrieval method should involve an accurate dielectric constant model. The following formula can be used to establish the relationship between soil moisture content and soil dielectric constant (Stogryn, 1971; Dobson et al., 1985):
where
where S is the sand content, and C is the clay content. When only the real part is considered,
where
where T is the temperature in °C and N is the normality of the solution. According to data from the Harmonized World Soil Database (HWSD, FAO/IIASA/ISRIC/ISSCAS/JRC, 2012), the conductivity of the soil in the study area is between 0.1–0.7 ds/m, so the soil in the study area can be regarded as non-saline soil. So S equals 0 and
Dubois Model
In this study, the Dubois model is modified to retrieve the soil moisture content. The Dubois model is developed based on multiple ground-measured frequencies, multiple polarizations, and multiple-incidence angle scatterometer data. The model can be expressed as follows:
where
where
Surface Roughness
The Rms height was used as a unique parameter to describe surface roughness. The Rms height can be expressed as a linear function of the backscattering coefficients or cross-polarization ratio, which is equal to
where
where
Data Filtering
To avoid the effect of crops on soil moisture retrieval, it is necessary to filter the data during the research period. NDVI was used as a major indicator that judges whether the ground surface is bare. NDVI was calculated using Sentinel-2 data by the following formula:
where NIR is the near-infrared band reflectance; RED is the red band reflectance; and
To discuss the retrieval accuracy under different climatic conditions, the data were divided into datasets with or without rain. The condition of rain refers to precipitation in 48 h and lasted at least 2 h before the observation of Sentinel-1.
Results
Impacts of Rain on the Surface Soil Moisture and Backscattering Coefficients
Rain affects the soil moisture as well as the backscattering coefficients. However, the trend of change in backscattering coefficients with soil moisture is closely related to soil texture. Three typical fields (i.e., clay, loam, and sand) in cultivated and uncultivated areas are chosen to analyze. To confirm that there was no surface changes during the analysis period, Google Earth, ESRI ArcGIS living atlas and the visible light bands of Sentinel-2 data were used.
Figure 3 presents the change of the soil moisture content before and after rain. The results show that sand has a relatively lower moisture content than loam and clay regardless of rain conditions because of its large porosity and weak moisture content capacity. Owing to a lowest porosity and a strongest moisture retention capacity, Clay has highest moisture content. The soil moisture content of loam is between that of clay and sand. The soil moisture content of these three types of texture soil increased with the rain. The soil moisture content of sand changes little after rain, which is caused by the low saturated moisture content of sand.
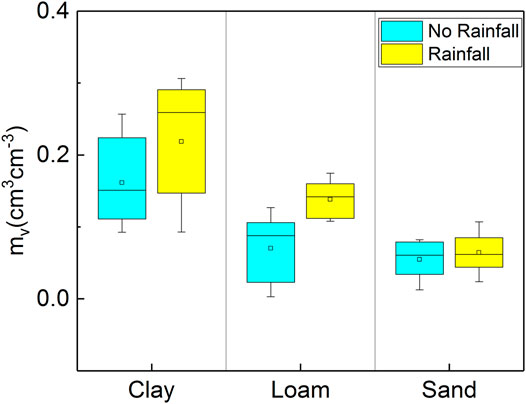
FIGURE 3. Changes in the soil moisture content before and after rainfall.
The backscattering coefficients of clay, loam and sand all exhibit an obvious upward trend with the appearance of rain (Figure 4). Under the condition of no rain, the backscattering coefficients of sand is slightly lower than that of clay and loam. The range of
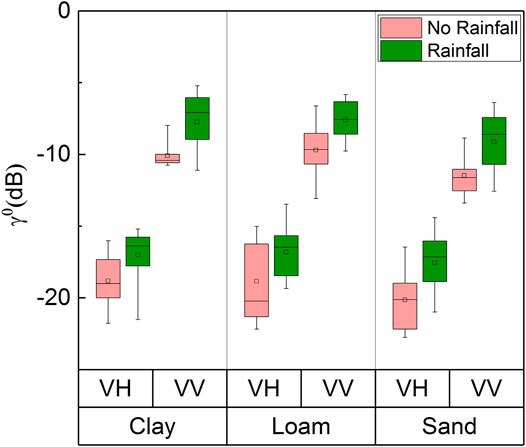
FIGURE 4. Changes in the backscattering coefficient before and after rainfall.
Figure 5 present the variation of soil moisture, backscattering coefficients and cross-polarization with rain. By excluding changes of the surface in the fields, each of them can be considered as no change in the surface roughness during the illustrated period. The results show that the impact of different rain degrees on soil moisture and backscattering coefficients are significantly different. The slight rain significantly increased the backscattering coefficients, but there is no significant change in soil moisture. It can be seen that rain is an important factor affecting the backscattering coefficients and soil moisture retrieval.
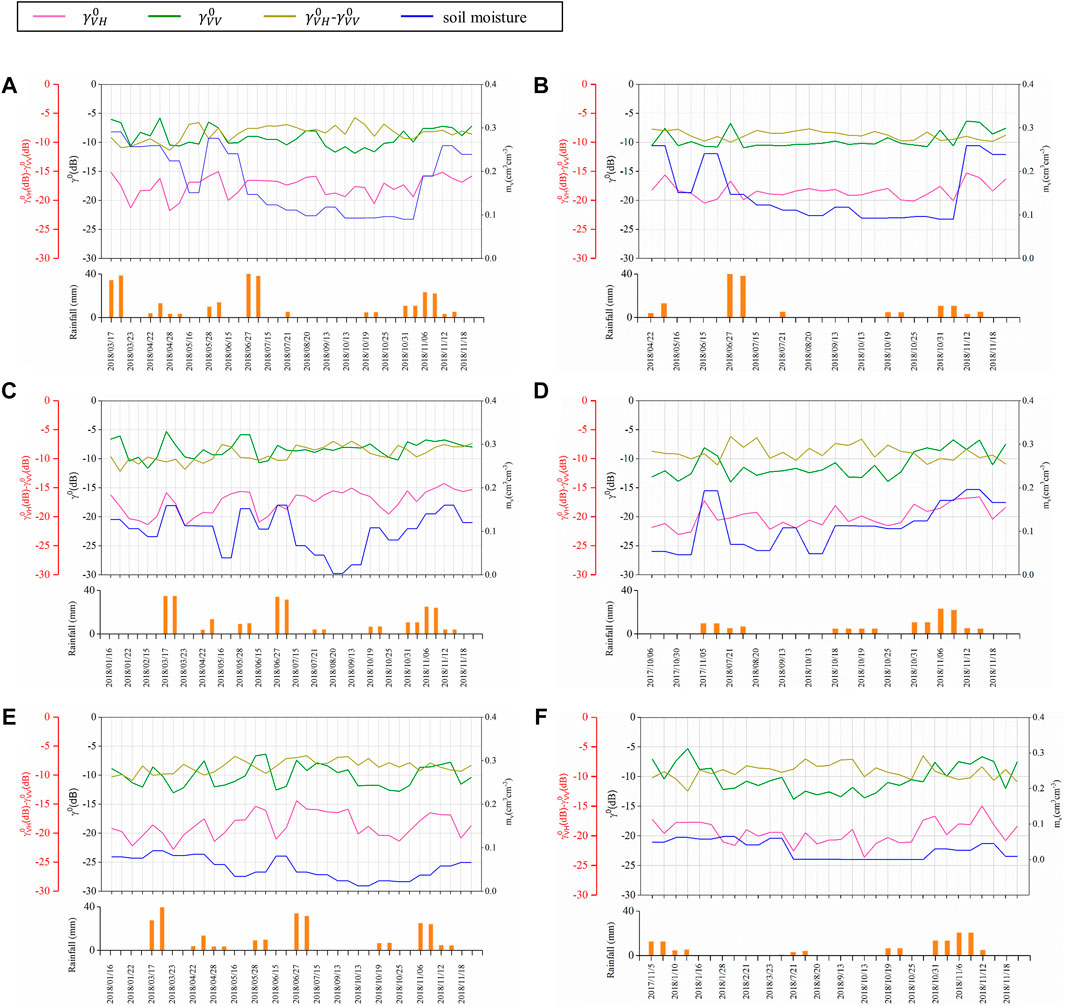
FIGURE 5. Variation in the backscattering coefficient and polarization ratio of different soil texture plots with or without ridge structure under no rain and rain conditions. (A) Cultivated clay plot. (B) Uncultivated clay plot. (C) Cultivated loam plot. (D) Uncultivated loam plot. (E) Cultivated sand plot. (F) Uncultivated sand plot.
Impact of Surface Roughness and Other Factors on Backscattering Coefficients
According to ground surface conditions of the fields, they can be divided into cultivated and uncultivated fields which represent rough surface (Figures 5A,C,E) and flat surface (Figures 5B,D,F). The backscattering coefficients of cultivated fields are larger than uncultivated fields, which is mainly due to greater roughness of the cultivated fields. When the soil moisture changes less, there is a degree of fluctuation in the backscattering coefficients, as shown in Figures 5A,F. Besides rain, these fluctuations are related to changes of incidence direction and penetration depth of microwave signal. The fluctuation of cultivated fields is greater than that of uncultivated fields because the status of the cultivated fields are more complex. The changes of
The backscattering coefficients of fields present a rising trend in the summer and autumn, and are more obvious in cultivated fields, but the soil moisture show downward trend. The moisture content of the surface soil in farmland areas is not only related to rain and irrigation, but also related to temperature and evaporation. The monthly temperature changes in the study area are shown in Figure 6. The results show that temperatures in the study area increased from January to August and gradually declined after September, evaporation is significantly greater in summer than in winter. In addition, the study area is located in the Mediterranean region, the winter precipitation is significantly greater than the summer precipitation, leading to significant reduction of the soil moisture in the summer and autumn. From May to October, when soil moisture decreases, the
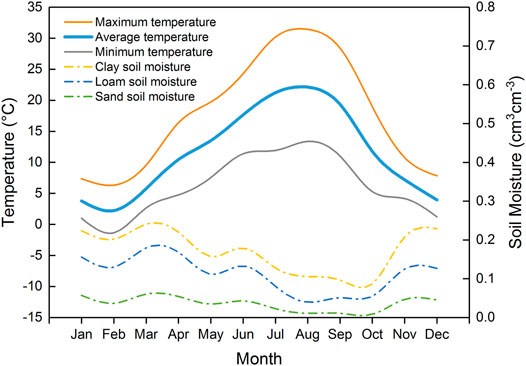
FIGURE 6. Trends in temperature and soil moisture of study area in the 2018.
For the soil with different textures, the backscattering coefficients of sand is more volatile than that of clay and loam, but the moisture of soil fluctuate least, reflecting the different backscattering characteristics of different soil textures. Backscattering coefficients of sand is more susceptible to the condition of soil surfaces, and its penetration depth is more likely to produce random scattering. However, regardless of soil texture,
Through the above analysis, it can be seen that in addition to the rain, the
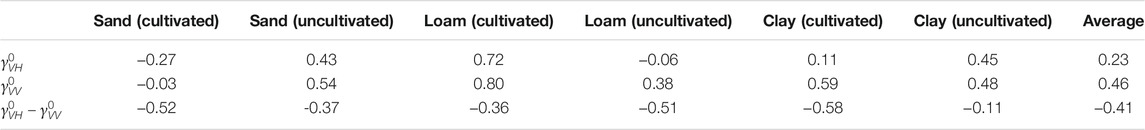
TABLE 3. Correlation between backscattering coefficient, cross-polarization ratio and soil moisture.
The Modified Dubois Model
The main parameters of the Dubois model include the incidence angle, surface roughness and soil moisture. According to
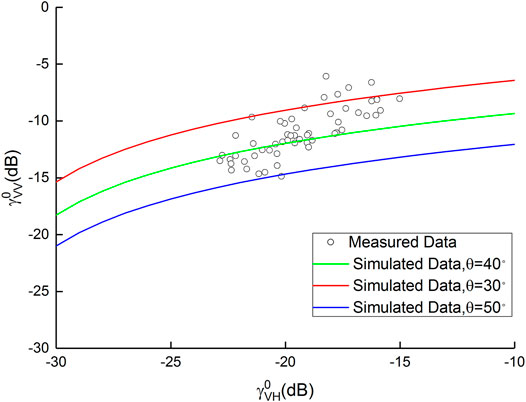
FIGURE 7. Measured backscattering coefficients vs. modeled backscattering coefficients from the Dubois model.
The roughness term coefficients and constant term in the model can be parameterized, and consider Eq. 15. The modification model can be shown as follows in dB form.
The relationship between the modified model and the measured value is shown in Figure 8.
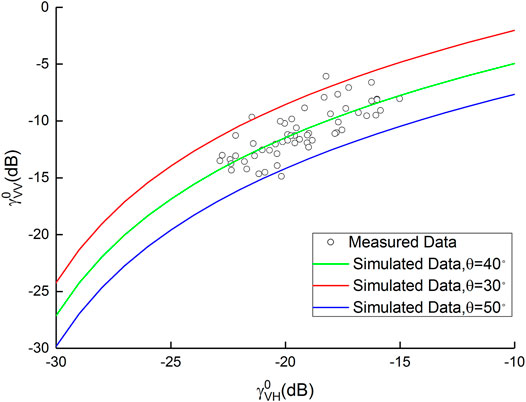
FIGURE 8. Measured backscattering coefficients vs. modeled backscattering coefficients from the modified Dubois model.
Modified Dubois Model Validation
Forward Model Validation
To validate the modified Dubois model, a comparison was performed between retrieval backscattering coefficients and measured backscattering coefficients of the validation dataset (Figures 9A,B). Under no rain conditions, the correlation coefficients is equal to 0.52, and the RMSE is 1.56 dB. Under rain conditions, the RMSE is equal to 1.80 dB, and the correlation coefficients is 0.60. Indeed, the accuracy of the model under rain conditions is close to the conditions in which there is no rain. The results show that the modified Dubois model has a better forward simulation accuracy.
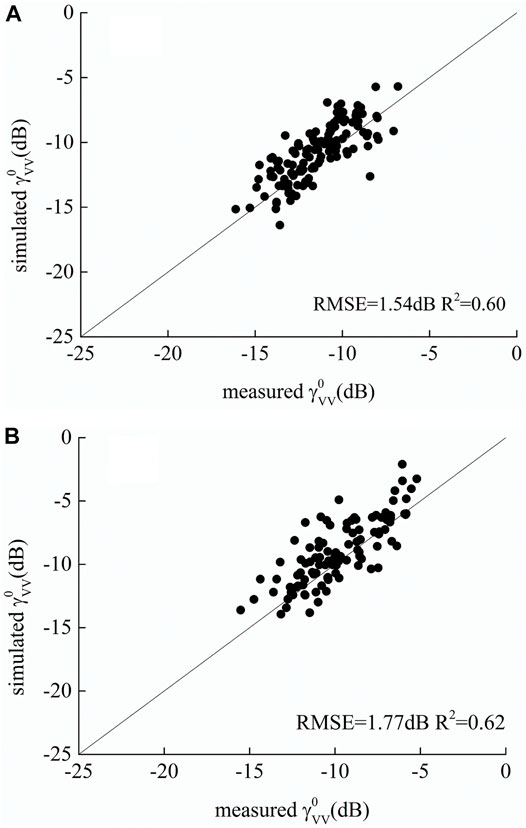
FIGURE 9. Measured backscattering coefficient vs. modeled backscattering coefficient from the modified Dubois model. (A) No rain. (B) Rain.
The maximum difference between retrieved values using the modified model and measured values is approximately 4 dB under no rain conditions, and approximately 5 dB under rain conditions. Excluding the model error, the remaining errors derive from three parts. First part is the measurement error, which includes measurement errors of VV and VH backscattering coefficients. Its magnitude is approximately 1 dB. Second part is radiation error. Although Sentinel-1 images have been corrected by the terrain flattening procedure, there are still residual radiation errors caused by the local incidence angle. This error is affected by multiple factors, such as slope and aspect, and can reach approximately 2 dB in cultivated fields. Third part is the standard deviation in the determination of soil moisture content, which is approximately 0.03 cm3cm−3. This error of the backscattering coefficients is related to the soil texture, its value of loam approximately equals to 2 dB.
Retrieval Accuracy of Modified Dubois Model
The scatterplot between the measured and retrieved soil moisture are shown in Figure 10. The results show that the retrieval RMSE of the soil moisture is 0.063 cm3cm−3 under no rain conditions (Figure 10A). It has a similar RMSE under rain conditions, which is equal to 0.066 cm3cm−3 (Figure 10B). The overall retrieval accuracy is 0.064 cm3cm−3 (Figure 10C). The retrieval RMSE of soil moisture using Dubois model is 0.124 cm3cm−3 (Figure 10D). The results show that the modified Dubois model have significant improved the retrieval accuracy.
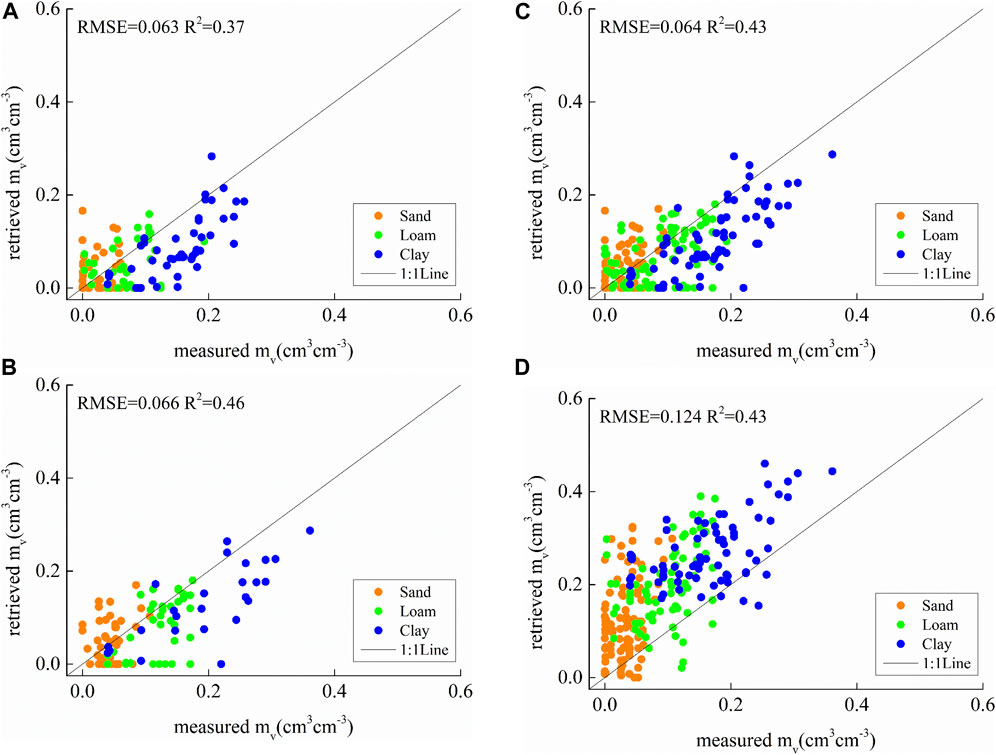
FIGURE 10. Measured soil moisture content vs. inversion soil moisture content (A) Using modified Dubois model under no rain condition. (B) Using modified Dubois model under rain condition. (C) Overall using modified Dubois model. (D) Using Dubois model.
Under no rain conditions, the forecasted value of sand is not very discrete, but its compliance with the 1:1 line is poor. After the occurrence of rain, the compliance with the 1:1 line improved, and the accuracy of the model increased. At some times, the retrieval value of soil moisture was equal to 0, which deviated greatly from the measured value because there is small amount vegetation on the ground during these periods, but its NDVI is less than the 0.25 threshold we set. The presence of a small amount of vegetation increase the VH polarization backscattering coefficients, which leads to a decrease in the retrieval value of soil moisture. The results of the clay fields are consistent with the 1:1 line under rain and no rain conditions, reflecting the limited effect of rain on its retrieval accuracy.
Retrieval Accuracy Under Different Incidence Angle
Although Sentinel-1 images have been corrected by calibration and terrain flattening, the difference in incidence angle may still cause a slight change of the backscattering coefficients. The retrieval RMSE of soil moisture under different incidence angle is shown in Table 4. It can be considered as low incidence angle when the incidence angle is less than 41°, otherwise it is regarded as high incidence angle. Under the condition of a low incidence angle, the overall retrieval RMSE of the soil moisture is 0.066 cm3cm−3, while it is equal to 0.060 cm3cm−3 under high incidence angle. Therefore, it can demonstrate that the model has approximate accuracy under different incidence angles.
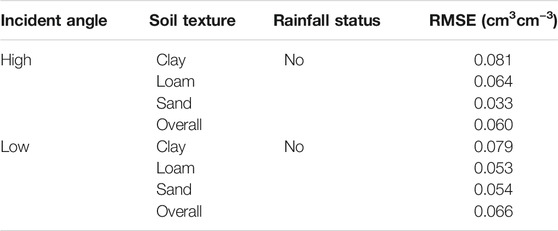
TABLE 4. Retrieval RMSE of soil moisture content with different textures.
Soil Moisture Map of the Study Area
The soil moisture map of the study area on September 19, 2018 is shown in Figure 11. The spatial resolution of the map is 22 m. When NDVI is greater than 0.25, it can be considered as vegetation area, which are the green parts in the map. The bare soil area uses seven grades color to describe the moisture content. The soil moisture content of the entire study area is higher in the east than in the west. This is because the soil texture of the east region is mainly the loam and clay, and the west is the sand area. Compared with sand, clay and loam have higher soil moisture content. In addition, Due to proximity to the Duero River and its tributaries, some areas in the west also have high soil moisture content.
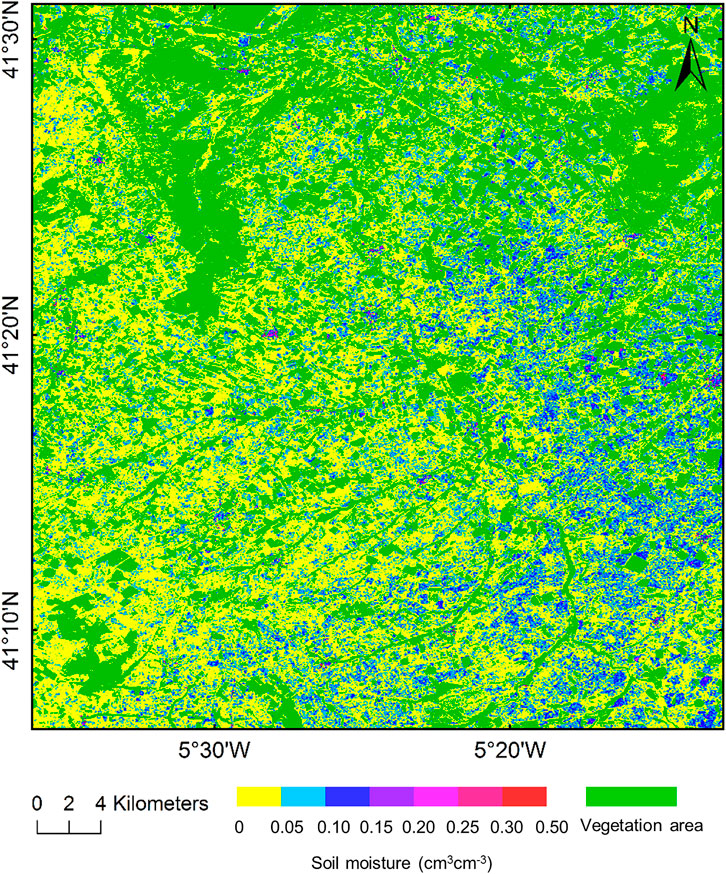
FIGURE 11. Map of retrieval soil moisture in study area.
Conclusion
To effectively improve the retrieval accuracy of soil moisture in bare farmland areas, this article investigated soil backscattering scattering characteristics of Sentinel-1 data, and a modified Dubois model was developed. The fields with moisture monitoring stations belonging to the REMEDHUS network were selected, which are located in the Duero Basin of Spain. The main soil texture of these fields are sand, loam and clay under the cultivated and uncultivated conditions. The Sentinel-1 data and soil moisture monitoring station data from 2017 to 2018 were obtained, and the NDVI dataset was calculated with the Sentinel-2 data to exclude vegetation coverage data. Based on the analysis of the time-series backscattering coefficients of soil with different texture, the following results are obtained:
1) In addition to be affected by soil moisture and incidence angle, backscattering coefficients is also disturbed by a variety of factors, such as rain, incidence direction and penetration depth. These factors have an effect on both VV and VH polarization backscattering coefficients, and soil moisture is more significant on VV polarization backscattering coefficients. In particular, a small amount of rain have a great effect on the backscattering coefficients, but have a small effect on 0–5 cm soil moisture.
2) Cultivation have a great influence on the backscattering coefficients. The backscattering coefficients of sand have more randomness fluctuation, which reflects its susceptibility of surface interference. The backscattering coefficients of cultivated farmland areas shows a tendency of deviating from the soil moisture during the summer drought period, which is related to changes of the volume scattering component.
Based on the analysis of backscattering coefficients of typical soil texture, the modified Dubois model was developed. In the model, Rms height and other systemic fluctuations are represented by VH backscattering coefficients linear model. The retrieval accuracy of the modified Dubois model was evaluated:
1) No matter whether there is rain, the model has a similar retrieval accuracy. Under no rain conditions, the RMSE of the retrieved soil moisture content using the modified Dubois model is 0.063 cm3cm−3, and the RMSE is 0.066 cm3cm−3 under rain conditions. Without considering the soil texture and climatic conditions, the overall retrieval RMSE of the model is 0.064 cm3cm−3, and R2 is equal to 0.43. Compared to the original Dubois model, the accuracy of the modified model is significantly improved.
2) The incidence angle has a small effect on the modified Dubois model, with an overall retrieval error of 0.060 cm3cm−3 under high incidence angle and 0.066 cm3cm−3 under low incidence angle under no rain conditions.
This study reveals the influence of surface roughness and climatic condition on the backscattering coefficients. The modified Dubois model can obtain high accuracy soil moisture retrieval value under a variety of soil texture conditions. Further investigations are necessary to analyze the trend of the backscattering coefficients of bare farmland areas under freezing and thawing conditions. In addition, the influence of different texture soil and farming states on the backscattering coefficients under the condition of vegetation coverage need to be discussed and a soil moisture retrieval model under frozen and vegetation-covered farmland needs to be established.
Data Availability Statement
Publicly available datasets were analyzed in this study. This data can be found here: https://scihub.copernicus.eu/dhus/#/home, https://ismn.geo.tuwien.ac.at/en/ and https://earthengine.google.com/.
Author Contributions
TM and LH carried out methodology and analyzed the data. QL designed the research. TM implemented the research and wrote the manuscript. All authors edited the manuscript.
Funding
This research was funded by Fundamental Research Funds for the Central Universities, CHD, Grant number (300102270501), Science and technology Research project for university of Inner Mongolia Autonomous Region (NJZY21498), National Natural Science Foundation of China (52069020), Mongolia Agricultural University “Double First Class” Discipline Innovation Team Building Talent Cultivation Project, Grand number (NDSC2018-10).
Conflict of Interest
The authors declare that the research was conducted in the absence of any commercial or financial relationships that could be construed as a potential conflict of interest.
Publisher’s Note
All claims expressed in this article are solely those of the authors and do not necessarily represent those of their affiliated organizations, or those of the publisher, the editors and the reviewers. Any product that may be evaluated in this article, or claim that may be made by its manufacturer, is not guaranteed or endorsed by the publisher.
Acknowledgments
The authors would like to express their gratitude to the reviewers for their valuable comments and suggestions for improving this manuscript.
References
Alharthi, A., and Lange, J. (1987). Soil Water Saturation: Dielectric Determination. Water Resour. Res. 23, 591–595. doi:10.1029/wr023i004p00591
Anagnostopoulos, V., Petropoulos, G. P., Ireland, G., and Carlson, T. N. (2017). A Modernized Version of a 1D Soil Vegetation Atmosphere Transfer Model for Improving its Future Use in Land Surface Interactions Studies. Environ. Model. Softw. 90, 147–156. doi:10.1016/j.envsoft.2017.01.004
Aubert, M., Baghdadi, N., Zribi, M., Douaoui, A., Loumagne, C., Baup, F., et al. (2011). Analysis of TerraSAR-X Data Sensitivity to Bare Soil Moisture, Roughness, Composition and Soil Crust. Remote Sensing Environ. 115, 1801–1810. doi:10.1016/j.rse.2011.02.021
Baghdadi, N., Holah, N., and Zribi, M. (2006). Soil Moisture Estimation Using Multi‐incidence and Multi‐polarization ASAR Data. Int. J. Remote Sensing 27, 1907–1920. doi:10.1080/01431160500239032
Bai, X., He, B., and Li, X. (2015). Optimum Surface Roughness to Parameterize Advanced Integral Equation Model for Soil Moisture Retrieval in Prairie Area Using Radarsat-2 Data. IEEE Trans. Geosci. Remote Sensing 54, 2437–2449. doi:10.1109/tgrs.2015.2501372
Beale, J., Snapir, B., Waine, T., Evans, J., and Corstanje, R. (2019). The Significance of Soil Properties to the Estimation of Soil Moisture from C-Band Synthetic Aperture Radar. Hydrol. Earth Syst. Sci. Discuss., 1–32. doi:10.5194/hess-2019-294
Benninga, H.-J., van der Velde, R., and Su, Z. (2019). Impacts of Radiometric Uncertainty and Weather-Related Surface Conditions on Soil Moisture Retrievals with Sentinel-1. Remote Sensing 11, 2025. doi:10.3390/rs11172025
Campus (2019). Grupo de Investigación en Recursos Hídricos de la Universidad de Salamanca (HIDRUS). Available at: http://campus.usal.es/∼hidrus/ (accessed on November 4, 2019).
Chen, K. S., Tzong-Dar Wu, T. D., Leung Tsang, L., Qin Li, Q., Jiancheng Shi, J. C., and Fung, A. K. (2003). Emission of Rough Surfaces Calculated by the Integral Equation Method with Comparison to Three-Dimensional Moment Method Simulations. IEEE Trans. Geosci. Remote Sensing 41, 90–101. doi:10.1109/tgrs.2002.807587
Copernicus (2018). Copernicus Open Access Hub. Available at: https://scihub.copernicus.eu/ (accessed on October 29, 2018).
Davidson, M. W. J., Thuy Le Toan, T., Mattia, F., Satalino, G., Manninen, T., and Borgeaud, M. (2000). On the Characterization of Agricultural Soil Roughness for Radar Remote Sensing Studies. IEEE Trans. Geosci. Remote Sensing 38, 630–640. doi:10.1109/36.841993
Dobson, M., and Ulaby, F. (1986). Active Microwave Soil Moisture Research. IEEE Trans. Geosci. Remote Sensing GE-24, 23–36. doi:10.1109/tgrs.1986.289585
Dobson, M., Ulaby, F., Hallikainen, M., and El-rayes, M. (1985). Microwave Dielectric Behavior of Wet Soil-Part II: Dielectric Mixing Models. IEEE Trans. Geosci. Remote Sensing GE-23, 35–46. doi:10.1109/tgrs.1985.289498
Dorigo, W. A., Wagner, W., Hohensinn, R., Hahn, S., Paulik, C., Xaver, A., et al. (2011). The International Soil Moisture Network: a Data Hosting Facility for Global In Situ Soil Moisture Measurements. Hydrol. Earth Syst. Sci. 15, 1675–1698. doi:10.5194/hess-15-1675-2011
Dorigo, W. A., Xaver, A., Vreugdenhil, M., Gruber, A., Hegyiová, A., Sanchis-Dufau, A. D., et al. (2013). Global Automated Quality Control of In Situ Soil Moisture Data from the International Soil Moisture Network. Vadose Zone J. 12, 1–21. doi:10.2136/vzj2012.0097
Dubois, P. C., van Zyl, J., and Engman, T. (1995). Measuring Soil Moisture with Imaging Radars. IEEE Trans. Geosci. Remote Sensing 33, 915–926. doi:10.1109/tgrs.1995.47719410.1109/36.406677
FAO/IIASA/ISRIC/ISSCAS/JRC (2012). Harmonized World Soil Database (Version 1.2). Rome, Laxenburg, Austria: FAOItaly and IIASA.
Fung, A. K., Li, Z., and Chen, K. S. (1992). Backscattering from a Randomly Rough Dielectric Surface. IEEE Trans. Geosci. Remote Sensing 30, 356–369. doi:10.1109/36.134085
Gorelick, N., Hancher, M., Dixon, M., Ilyushchenko, S., Thau, D., and Moore, R. (2017). Google Earth Engine: Planetary-Scale Geospatial Analysis for Everyone. Remote Sensing Environ. 202, 18–27. doi:10.1016/j.rse.2017.06.031
Greifeneder, F., Notarnicola, C., Hahn, S., Vreugdenhil, M., Reimer, C., Santi, E., et al. (2018). The Added Value of the VH/VV Polarization-Ratio for Global Soil Moisture Estimations from Scatterometer Data. IEEE J. Sel. Top. Appl. Earth Observations Remote Sensing 11, 3668–3679. doi:10.1109/JSTARS.2018.2865185
Hoekstra, P., and Delaney, A. (1974). Dielectric Properties of Soils at UHF and Microwave Frequencies. J. Geophys. Res. 79, 1699–1708. doi:10.1029/jb079i011p01699
Jin, X., Yang, W., Gao, X., and Li, Z. (2020). Analysis and Modeling of the Complex Dielectric Constant of Bound Water with Application in Soil Microwave Remote Sensing. Remote Sensing 12, 3544. doi:10.3390/rs12213544
Karthikeyan, L., Pan, M., Wanders, N., Kumar, D. N., and Wood, E. F. (2017a). Four Decades of Microwave Satellite Soil Moisture Observations: Part 1. A Review of Retrieval Algorithms. Adv. Water Resour. 109, 106–120. doi:10.1016/j.advwatres.2017.09.006
Karthikeyan, L., Pan, M., Wanders, N., Kumar, D. N., and Wood, E. F. (2017b). Four Decades of Microwave Satellite Soil Moisture Observations: Part 2. Product Validation and Inter-satellite Comparisons. Adv. Water Resour. 109, 236–252. doi:10.1016/j.advwatres.2017.09.010
Leshchanskii, Y. I., Lebedeva, G. N., and Shumilin, V. D. (1971). The Electrical Parameters of sandy and Loamy Soils in the Range of Centimeter, Decimeter, and Meter Wavelengths. Radiophys Quan. Electron 14, 445–451. doi:10.1007/bf01030730
Li, Z.-L., Leng, P., Zhou, C., Chen, K.-S., Zhou, F.-C., and Shang, G.-F. (2021). Soil Moisture Retrieval from Remote Sensing Measurements: Current Knowledge and Directions for the Future. Earth-Science Rev. 218, 103673. doi:10.1016/j.earscirev.2021.103673
Liao, T.-H., Kim, S.-B., Handwerger, A., Fielding, E., Cosh, M., and Schulz, W. (2021). High-Resolution Soil-Moisture Maps over Landslide Regions in Northern California Grassland Derived from SAR Backscattering Coefficients. IEEE J. Sel. Top. Appl. Earth Observations Remote Sensing 14, 4547–4560. doi:10.1109/JSTARS.2021.3069010
McNairn, H., Jackson, T. J., Wiseman, G., Belair, S., Berg, A., Bullock, P., et al. (2014). The Soil Moisture Active Passive Validation experiment 2012 (SMAPVEX12): Prelaunch Calibration and Validation of the SMAP Soil Moisture Algorithms. IEEE Trans. Geosci. Remote Sensing 53, 2784–2801. doi:10.1109/tgrs.2014.2364913
Montaldo, N., Fois, L., and Corona, R. (2021). Soil Moisture Estimates in a Grass Field Using Sentinel-1 Radar Data and an Assimilation Approach. Remote Sensing 13, 3293. doi:10.3390/rs13163293
Oh, Y., Sarabandi, K., and Ulaby, F. T. (2002). Semi-Empirical Model of the Ensemble-Averaged Differential Mueller Matrix for Microwave Backscattering from Bare Soil Surfaces. IEEE Trans. Geosci. Remote Sensing 40, 1348–1355. doi:10.1109/tgrs.2002.800232
Oh, Y. (2004). Quantitative Retrieval of Soil Moisture Content and Surface Roughness from Multipolarized Radar Observations of Bare Soil Surfaces. IEEE Trans. Geosci. Remote Sensing 42, 596–601. doi:10.1109/tgrs.2003.821065
Patel, V. N., Chaudhary, P. D., Rana, V. A., and Gadani, D. H. (2021). Estimation of Dielectric Properties of clay Loam and Silty Soil with Different Salinity Levels over Low Frequency Range. Curr. Sci. 120, 414–422. doi:10.18520/cs/v120/i2/414-422
Petropoulos, G. P., Ireland, G., Srivastava, P. K., and Ioannou-Katidis, P. (2014). An Appraisal of the Accuracy of Operational Soil Moisture Estimates from SMOS MIRAS Using Validated In Situ Observations Acquired in a Mediterranean Environment. Int. J. Remote Sensing 35, 5239–5250. doi:10.1080/2150704x.2014.933277
Ralph, F. M., Coleman, T., Neiman, P. J., Zamora, R. J., and Dettinger, M. D. (2013). Observed Impacts of Duration and Seasonality of Atmospheric-River Landfalls on Soil Moisture and Runoff in Coastal Northern California. J. Hydrometeorol. 14, 443–459. doi:10.1175/jhm-d-12-076.1
Rossato, L., Alvalá, R. C. d. S., Marengo, J. A., Zeri, M., Cunha, A. P. M. d. A., Pires, L. B. M., et al. (2017). Impact of Soil Moisture on Crop Yields over Brazilian Semiarid. Front. Environ. Sci. 5, 73. doi:10.3389/fenvs.2017.00073
Rowlandson, T. L., Berg, A. A., Bullock, P. R., Ojo, E. R., McNairn, H., Wiseman, G., et al. (2013). Evaluation of Several Calibration Procedures for a Portable Soil Moisture Sensor. J. Hydrol. 498, 335–344. doi:10.1016/j.jhydrol.2013.05.021
Jiancheng Shi, J., Wang, J., Hsu, A. Y., O'Neill, P. E., and Engman, E. T. (1997). Estimation of Bare Surface Soil Moisture and Surface Roughness Parameter Using L-Band SAR Image Data. IEEE Trans. Geosci. Remote Sensing 35, 1254–1266. doi:10.1109/36.628792
Shi, H., Lopez-Sanchez, J. M., Yang, J., Li, P., Zhao, L., and Zhao, J. (2020). Contribution of Polarimetry and Multi-Incidence to Soil Moisture Estimation over Agricultural Fields Based on Time Series of L-Band SAR Data. IEEE J. Sel. Top. Appl. Earth Observations Remote Sensing 14, 300–313. doi:10.1109/JSTARS.2020.3036732
Small, D. (2011). Flattening Gamma: Radiometric Terrain Correction for SAR Imagery. IEEE Trans. Geosci. Remote Sensing 49, 3081–3093. doi:10.1109/tgrs.2011.2120616
Srivastava, H. S., Patel, P., Manchanda, M. L., and Adiga, S. (2003). Use of Multiincidence Angle RADARSAT-1 SAR Data to Incorporate the Effect of Surface Roughness in Soil Moisture Estimation. IEEE Trans. Geosci. Remote Sensing 41, 1638–1640. doi:10.1109/tgrs.2003.813356
Srivastava, H. S., Patel, P., Navalgund, R. R., and Sharma, Y. (2008). Retrieval of Surface Roughness Using Multi-Polarized Envisat-1 ASAR Data. Geocarto Int. 23, 67–77. doi:10.1080/10106040701538157
Stogryn, A. (1971). Equations for Calculating the Dielectric Constant of Saline Water (Correspondence). IEEE Trans. Microwave Theor. Techn. 19, 733–736. doi:10.1109/tmtt.1971.1127617
Su, C., and Cao, Y. (2021). Research on Inversion of Soil Moisture in Karst Area Based on Full-Polarization SAR Data. IEEE Access 9, 117512–117519. doi:10.1109/ACCESS.2021.3106768
Tao, F., Yokozawa, M., Hayashi, Y., and Lin, E. (2003). Future Climate Change, the Agricultural Water Cycle, and Agricultural Production in China. Agric. Ecosyst. Environ. 95, 203–215. doi:10.1016/s0167-8809(02)00093-2
Ulaby, F., Batlivala, P., and Dobson, M. (1978). Microwave Backscatter Dependence on Surface Roughness, Soil Moisture, and Soil Texture: Part I-Bare Soil. IEEE Trans. Geosci. Electron. 16, 286–295. doi:10.1109/tge.1978.294586
Ulaby, F. T., Moore, R. K., and Fung, A. (1986). Microwave Remote Sensing: Active and Passive 2‐Radar Remote Sensing and Surface Scattering and Emission Theory. Massachusetts: Artech House press.
Ulaby, F. T., Sarabandi, K., Mcdonald, K., Whitt, M., and Dobson, M. C. (1990). Michigan Microwave Canopy Scattering Model. Int. J. Remote Sensing 11, 1223–1253. doi:10.1109/igarss.1988.57050610.1080/01431169008955090
Wang, S., Sun, Q., Wang, N., and Yang, L. (2020). Variation in the Dielectric Constant of limestone with Temperature. Bull. Eng. Geol. Environ. 79, 1349–1355. doi:10.1007/s10064-019-01647-3
Wu, T. D., Chen, K. S., Jiancheng Shi, J., and Fung, A. K. (2001). A Transition Model for the Reflection Coefficient in Surface Scattering. IEEE Trans. Geosci. Remote Sensing 39, 2040–2050. doi:10.1109/igarss.1998.70221810.1109/36.951094
Xu, X. Z. (1985). Soil-Water Potential and Unfrozen Water Content and Temperature. J. Glaciol. Geocryol. 7, 1–14.
Yang, M., Wang, H., Tong, C., Zhu, L., Deng, X., Deng, J., et al. (2021). Soil Moisture Retrievals Using Multi-Temporal Sentinel-1 Data over Nagqu Region of Tibetan Plateau. Remote Sensing 13, 1913. doi:10.3390/rs13101913
Zhang, L., Meng, Q., Hu, D., Zhang, Y., Yao, S., and Chen, X. (2020). Comparison of Different Soil Dielectric Models for Microwave Soil Moisture Retrievals. Int. J. Remote Sensing 41, 3054–3069. doi:10.1080/01431161.2019.1698077
Zhu, Q., and Lin, H. (2011). Influences of Soil, Terrain, and Crop Growth on Soil Moisture Variation from Transect to Farm Scales. Geoderma 163, 45–54. doi:10.1016/j.geoderma.2011.03.015
Keywords: sentinel-1, backscattering coefficients, retrieval model, bare surface, rain
Citation: Ma T, Han L and Liu Q (2021) Retrieving the Soil Moisture in Bare Farmland Areas Using a Modified Dubois Model. Front. Earth Sci. 9:735958. doi: 10.3389/feart.2021.735958
Received: 04 July 2021; Accepted: 19 November 2021;
Published: 08 December 2021.
Edited by:
Asim Biswas, University of Guelph, CanadaCopyright © 2021 Ma, Han and Liu. This is an open-access article distributed under the terms of the Creative Commons Attribution License (CC BY). The use, distribution or reproduction in other forums is permitted, provided the original author(s) and the copyright owner(s) are credited and that the original publication in this journal is cited, in accordance with accepted academic practice. No use, distribution or reproduction is permitted which does not comply with these terms.
*Correspondence: Ling Han, aGFubGluZ0BjaGQuZWR1LmNu