 Bin Chen1
 Xuyang Guo
- 1China Petroleum Logging Company Limited Xinjiang Branch, Karamay, China
- 2Department of Petroleum Engineering, China University of Petroleum, Karamay, China
- 3College of Petroleum Engineering, China University of Petroleum, Beijing, China
- 4College of Chemistry, Nankai University, Tianjin, China
Due to the use of horizontal wells and hydraulic fracturing, commercial tight oil production from some tight sandy conglomerate reservoirs has been achieved. Since the widely distributed gravels in the sandy matrix in conglomerate reservoir rocks are harder than the matrix, the rock mechanical response in conglomerates under compression is highly heterogeneous. This increases the complexity of understanding the hydraulic fracturing behaviors in conglomerate reservoirs. Previous tri-axial compression tests provided the stress-strain relationships of conglomerate samples as a whole, and the stress and strain in the gravels and in the sandy matrix were not investigated due to the limitation of the compression test lab. This study presents tri-axial test results for a conglomerate sample cored from a reservoir that has been economically developed. Lab results are then used to calibrate the numerical model for the simulation of the tri-axial compression process. Numerical results indicate that the elastic modulus and size of gravels have significant impacts on the axial stresses and axial strains in the conglomerate. Stress concentrations are observed in gravels due to the heterogeneous mechanical properties in the conglomerate. The reorientation of the maximum horizontal principal stress is quantified to study the mechanisms of the interaction types between hydraulic fractures and gravels embedded in the tight sandy matrix.
Introduction
Unconventional oil and gas resources in low permeability reservoirs have attracted tremendous attention in the upstream in the petroleum industry (Xie et al., 2020; Zhao et al., 2020). Due to the low permeability in such reservoirs, it usually requires horizontal wells with hydraulic fracturing technologies to obtain commercial production (Zhang et al., 2017; Tang et al., 2018; Cheng et al., 2019; Dong et al., 2021). Recently, the high potential of hydrocarbon production in tight sandy conglomerate reservoirs has been proved by large-scale field production involving horizontal wells with hydraulic fracturing in several locations such as the Junggar Basin and Songliao Basin in China (Feng et al., 2013; Xiang and Zhang 2015). However, due to the presence of gravels in the tight sandy matrix, the rock mechanical characteristics are rather heterogeneous. Since the hydraulic fracturing quality is closely related to the complex mechanical behaviors in conglomerates, it is important to understand how the conglomerates deform under the compression induced by reservoir stimulation processes.
Experimental tests are widely used in rock mechanical analyses. In such tests, the exertion of confining pressure and axial stress can establish the in-situ stress conditions in the subsurface. They help to obtain essential rock mechanical parameters and constitutive relationships using rock samples, which are especially critical for the optimization of hydraulic fracturing parameters. Kluge et al. (2020) proposed a novel shear test strategy to correlate the permeability evolution and micro-faults. Their test was established based on an MTS 815 tri-axial compression cell and concluded that the induced fractures increase the permeability by two–three orders of magnitude. Based on a modified tri-axial compression test with changing confining pressure and axial stress, it is found out that stress paths of loading and unloading directly govern the brittleness, elastoplasticity, and tensile and shear failure mechanisms in tight rocks (Guo et al., 2019). The anisotropy of deformation in tri-axial tests is discussed by Togashi et al. (2017), where a novel method with only a single test on one sample is proposed. Thus, it is more economical and convenient to quantify the deformation anisotropy. The advantage of this method is that there is no need to carry out multiple tests on various samples. Similarly, Aghababaei et al. (2019) also proposed a multi-stage strategy to obtain key strengths and failure behaviors using reduced numbers of samples to decrease the time and cost involved in tri-axial compression tests. However, they pointed out that the newly developed experimental method yields lower strength measurements than the single stage method. In order to understand the fracture patterns, Baumgarten and Konietzky (2013) conducted conventional single stage compression tests, multi-stage tests and continuous failure state tests. Both uni-axial and tri-axial tests were employed. They indicated that the combination of lab tests and numerical simulations helped to improve the understanding of post-failure behaviors.
The presence of gravels in a relatively homogeneous matrix leads to complexity in evaluating the rock mechanical behaviors, which have attracted attention from many researchers. Kumara et al. (2013) carried out a study on the stress and strain relationships in sand-gravel mixtures. This study provides insight into the deformation characteristics in sandy conglomerate reservoirs. They found out that the shape of gravels and the percentage of sand in the mixture both affect the stress-strain curves, and 30% of sand leads to the highest stress-strain curve indicating the highest strength. Akram et al. (2019) employed uni-axial, tri-axial, and Brazilian tests to investigate the effects of specimen size, clast size, cement matrix, and clast properties on the strength and deformation patterns in conglomerate rocks. They concluded that with the increase of particle size, peak strength and Young’s modulus decrease. Zhou et al. (2020) further experimentally investigated the effects of sphericity, where sphericity is negatively related to gravel content and the plasticity of the rock is positively correlated with heterogeneity. They emphasized the effect of gravel on the emergence of micro-cracks on the edges of gravels. In a rock mechanical test, Shi et al. (2013) reported elastic parameters based on acoustic measurements in 80 samples from the Triassic and Permian Formations in the conglomerate reservoirs in the Mahu Sag, Junggar Basin in Xinjiang, China. The dynamic modulus range is between 28.4 and 32.21 GPa while the dynamic Poisson’s ratios are between 0.2055 and 0.2858. The correlation between P and S waves is good while the correlation between dynamic and static parameters is poor.
A major importance of tri-axial tests is that they provide strengths, elastic parameters, and failure patterns for rock samples. It is widely accepted that the quality of hydraulic fracturing in tight and heterogeneous is jointly governed by stress shadows, in-situ stress, brittleness, fracability, clay and organic matter, and fracturing parameters (Guo et al., 2018a; Guo et al., 2018b; Dahi Taleghani et al., 2018; Li et al., 2018; Lecampion et al., 2018; Guo et al., 2019; Mao et al., 2020; Hou et al., 2019; Wang et al., 2019; Chen et al., 2021). To better characterize the hydraulic fracture network, tri-axial tests can provide essential measurements for rock mechanical properties (Guo et al., 2020; Duan et al., 2021). In addition, gravels in conglomerates introduce heterogeneities and increase the complexity of hydraulic fracture propagation. Some efforts were made to investigate these phenomena. Heterogeneities related to topology and geometry were discussed and it was observed that structured fracture networks have less dispersion than disordered networks, and the corresponding production performance can also be affected (Hyman and Jimenez-Martinez 2018; Zhi et al., 2021). The layered formation is deemed as a typical mechanical heterogeneity that leads to complex fracture propagation behaviors (Yue et al., 2019; Tan et al., 2020; Tan et al., 2021). For mechanical heterogeneities characterized by stratified formations, fracture tip locations, modulus values, and each layer’s height percentage are the key parameters affecting hydraulic fracture paths and geometries.
Based on the literature review, it is noted that tri-axial tests have been widely studied, while the mechanical responses within the highly heterogeneous sandy conglomerates require further investigation. In this study, a novel workflow including tri-axial testing and the finite element analysis of mechanical responses within the testing sample is proposed. Then, this study provides lab-calibrated distributions of stresses and strains in the sandy matrix, in the gravels, and in the interface between gravels and matrix. The effects of gravel size, gravel spacing, and gravel stiffness on stress concentration are also quantified. The heterogeneity of mechanical responses discussed in this article provides a reference for the hydraulic fracturing interaction with gravels and insights for hydraulic fracture parameter design and optimization.
Tri-axial Compression Test
In the experimental study, a tight sandy conglomerate rock sample taken from the Lower Triassic Baikouquan Formation in Mahu Sag, Junggar Basin in northwestern China is used for the tri-axial compression test. 1 × 10⁸ tons of reserves were already reported in the low-porosity and low-permeability reservoirs. Continuous and commercialized tight oil production has been achieved in this area after the use of horizontal wells and hydraulic fracturing. To further improve the recovery in this area, optimization of drilling and hydraulic fracturing parameters is required where rock mechanical tests can provide necessary data for the optimization. Due to the fan-deltaic sedimentary environment in the sag, large-scale accumulation is favorable. Tight sandy matrix and gravels are the main components of the reservoir rock, and the clastic gravels are generally quartz and feldspar. Therefore, the stiffness of the gravels is higher than the tight matrix. Gravels in this area have a maximum diameter of 24.8 mm and have good sphericity. Correlations between P wave velocity and S wave velocity are good, and one established correlation is
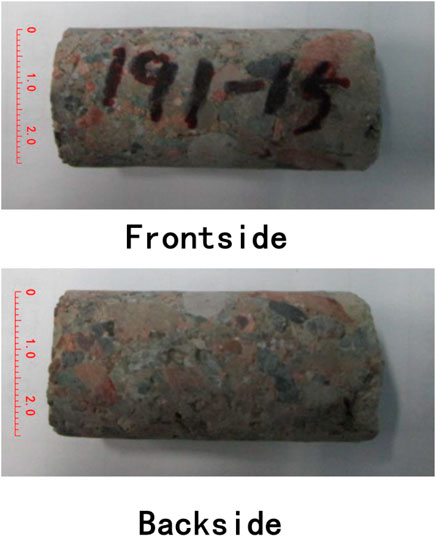
FIGURE 1. Conglomerate rock sample used for the compression test.
The tri-axial compression test is conducted in the Rapid Triaxial Testing System GCTS RTR-1500 (Figure 2). This platform can provide a maximum pressure of 140 MPa, a maximum compressive force of 1,500 kN, a maximum tensile force of 820 kN, and a maximum temperature of 150 °C. A confining pressure of 40 MPa is used in the test with continuous increases in the axial loading. Figure 3 presents the experimental results of the relationship between deviatoric stress, radial strain, and axial strain. Before reaching the peak strength, a linear correlation is observed. The size of the core is a standard sample with a diameter of 25 mm and a length of 50 mm. The weight is 53.5 g. They are the essential parameters to be used in the following finite element analysis.
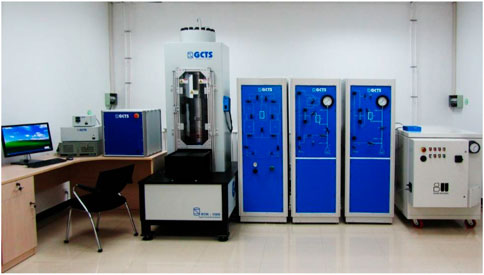
FIGURE 2. Rapid triaxial testing system (China University of Petroleum 2021).
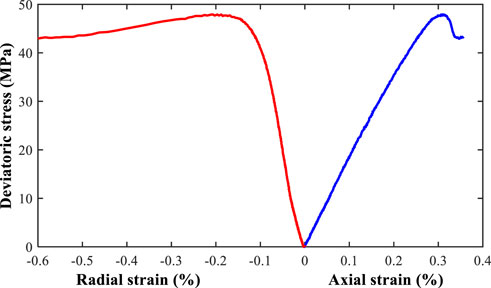
FIGURE 3. Results of the tri-axial compression test.
Numerical Study
The tri-axial compression test is capable of providing key elastic parameters. However, the parameters are obtained based on the compression of the entire conglomerate while the distribution of stress and strain in the rock cannot be directly examined by the compression test. Since the heterogeneity in the conglomerate sample is strong, it is not reasonable to assume homogeneous and uniform mechanical responses to compression in the sample. Therefore, a numerical model based on finite element methods and momentum balance in the stress tensor is introduced to quantify the mechanical behaviors in the sample.
Mathematical Model
Cauchy stress tensors are used to describe the stress components in the 3D domain. The momentum balance between stress components and traction boundaries is expressed as:
where
Since the compression test results exhibit strong linear elasticity, linear elastic materials are used for the sandy matrix and the gravels. Based on Hooke’s law:
where
The total strain can also be expressed as:
The elasticity tensor is related to Young’s modulus and Poisson’s ratio as:
Although heterogeneity in the rock mechanical properties is considered in this study, isotropy is used in the assumption. Therefore, a highly symmetric elasticity matrix is obtained:
where
In order to simulate the tri-axial compression process in the laboratory, a three-dimensional geometry is established as in Figure 4. Three types of boundary conditions are used in the geometry. The first type is the axial stress exerted at the top of the cylindrical domain. It is used to represent the time-dependent axial load in the GCTS testing system. The second type is the confining stress or confining pressure exerted radially. This is used to represent the confinement in the testing system. The third type is the fixed bottom boundary.
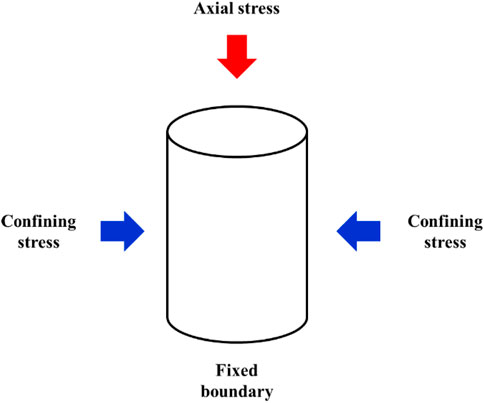
FIGURE 4. Three-dimensional geometry of the model.
For the first and second types of stress boundaries, their effects are written as:
where
For the third type of fixed boundary, the effect is written as:
Note that the boundary tractions are time-dependent as functions of time. They represent the loading process in the testing system during the compression test.
To build up the numerical model, three-dimensional tetrahedral cells are used in the mesh. Local grid refinements are employed in and near gravels to improve the convergence and stability of numerical solutions. Totally 39,081 elements are used in the mesh and the degrees of freedom is 141,762. A direct solver is used and the simulation time for the base case is 474 s. To solve for displacements in the mechanical problem, quadratic serendipity shape functions are used in space discretization.
Base Case
In the base case, the mathematical model is calibrated with lab data. In the model, the time-dependent axial stress and confining stress boundaries are from the tri-axial compression test records as in Figure 5. Note that it only reports loading after the confining stress is fully increased to the target of 40 MPa and the process for the increase in loading for the confining stress is not plotted. This is used in Eqs 7, 8 in the model.
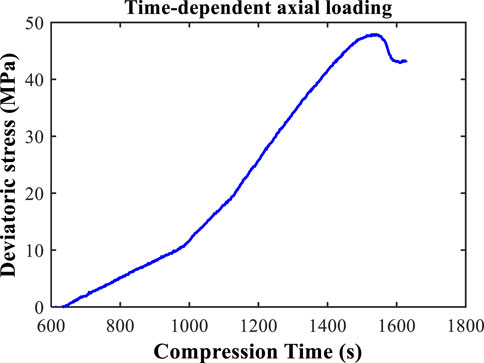
FIGURE 5. Axial loading in the compression test.
An assumption is made in the simulation to reasonably simplify the process to quantify the heterogeneity. Based on the observation of the tight conglomerate core and statistical review carried out by Liu et al. (2018) in the same formation, uniformly distributed spheres as in Figure 6 are used to represent the gravels in the sandy matrix. Therefore, quantitative analyses can be better focused on the size, spacing, and elastic parameters of the gravels.
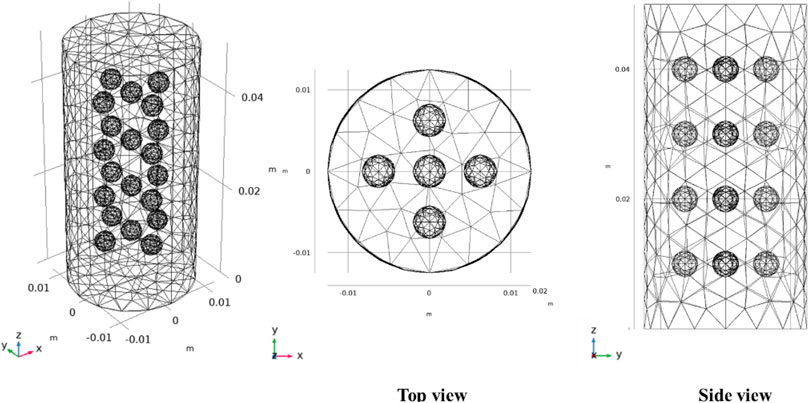
FIGURE 6. Schematic of the simplified geometry for conglomerate compression simulation.
In general, four layers of gravels are uniformly distributed vertically. In each layer, five gravels are uniformed placed. In the base case, the diameter of each spherical gravel is 2 mm. In each layer, the spacing between two neighboring gravels is 4.25 mm. The vertical spacing between two neighboring layers is 8 mm.
Before detailed numerical analyses, a calibration of the parameters used in the model is carried out. After the calibration of rock mechanical parameters of the gravels and matrix, axial and radial strains from the model are used for matching purposes. In Figure 7, the matching between the lab results and the modeling results for axial strain, radial strain, and deviatoric stress is achieved. Note that only the results in the linear deformation regimes are used as this study does not consider failure mechanisms. Only results before the peak strength are used. Based on the match, the linear elastic assumption used in the modeling study can be verified.
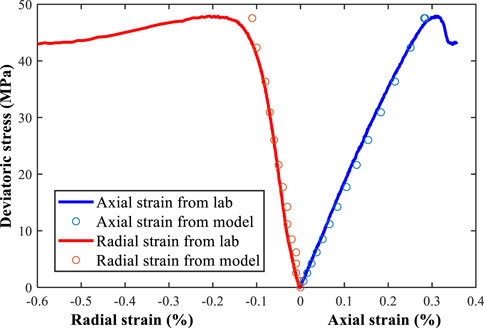
FIGURE 7. Matching between lab and modeling results for linear elasticity. Note that only linear regimes are studied.
The mechanical parameters used in the numerical model are calibrated in the matching process. In the calibration, the Young’s modulus of the sandy matrix is 17 GPa; the Poisson’s ratio of the sandy matrix is 0.41; the Young’s modulus of the gravel is 47 GPa; the Poisson’s ratio of the gravel is 0.31.
Distributions of the axial strain, the axial stress, and the orientation of the maximum principal stress in the horizontal direction in the base case are plotted. They are plotted at the end of the elastic deformation when the axial strain is at its maximum. In Figure 8, the two-dimensional distributions of axial strains in planes Z = 10, 20, 30, and 40 mm are presented. The deformation in gravels is generally smaller than that in the matrix, as gravels have higher stiffnesses. Distinct strains are observed as the effects of the boundaries between gravels and the matrix are dominant. In the sandy matrix, areas between neighboring gravels also experience relatively higher axial strains compared to areas near the boundary of the rock sample. This is the stress concentration caused by non-uniform deformation in gravels and in the matrix during the tri-axial compression process. Therefore, it is found out that the stress concentration is only observed in between gravels. The strain magnitudes are higher at areas closer to the fixed bottom boundary of the rock sample. This is because the fixed bottom leads to higher changes in deformation at nearby areas, while the top and the confining boundaries are traction boundaries that allow for movements.
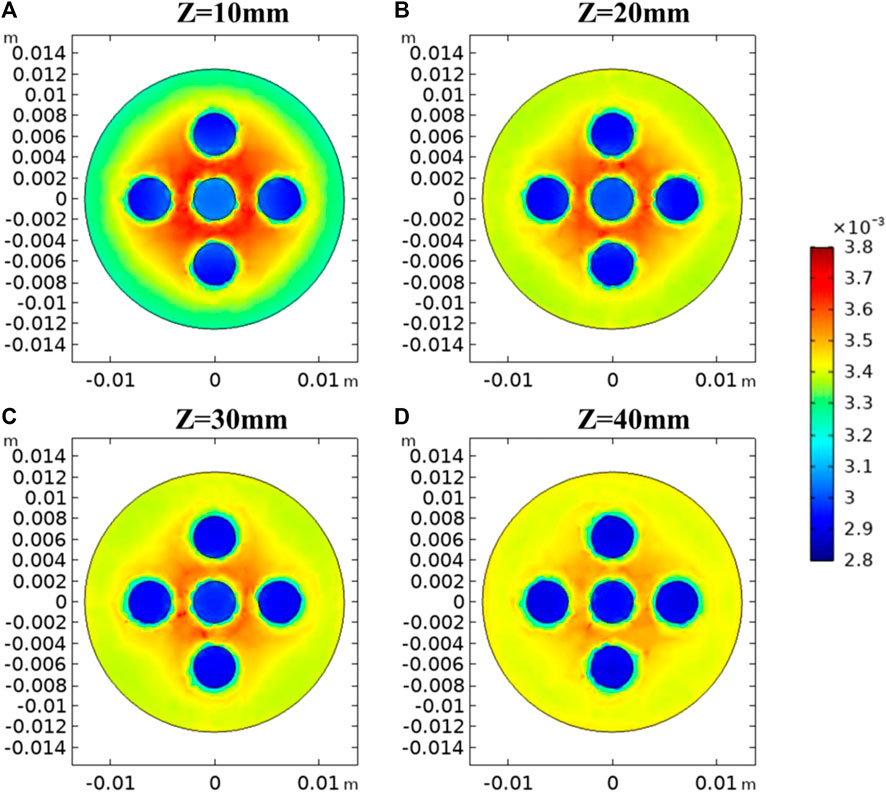
FIGURE 8. Distribution of axial strains in X-Y planes of (A) Z = 10 mm, (B) 20 mm, (C) 30 mm, and (D) 40 mm in the base case.
In Figure 9, one-dimensional distributions of axial strains along X = 0, 3.125, and 6.25 mm at four X-Y planes in Figure 8 are plotted. These lines are selected as they penetrate the three gravels, zero gravels, and one gravels as it moves away from the center of the sample. Vertical lines in the one-dimensional plots represent the boundaries between gravels and the sandy matrix. Note that in Figure 9, only half of the lines are presented due to symmetry. At X = 0mm, it is clear that the axial strain magnitudes are lower in the gravels than in the matrix. The strains in the gravels and between gravels are positively correlated with the distance to the bottom boundary, while the differences in strains near the boundary of the sample are not distinct except for Z = 10 mm. At X = 3.125mm, the strain distributions between gravels are discussed. Areas closer to the center of the sample have higher axial strains. This indicates that the stress concentration is more noticeable in areas more surrounded by gravels. At X = 6.25mm, the effect of gravels on decreased axial strains is again exhibited. The changes in the strain are relatively sharp at the gravel-matrix boundary due to the changes in elastic parameters. The axial strains outside the gravels are around 0.35%.
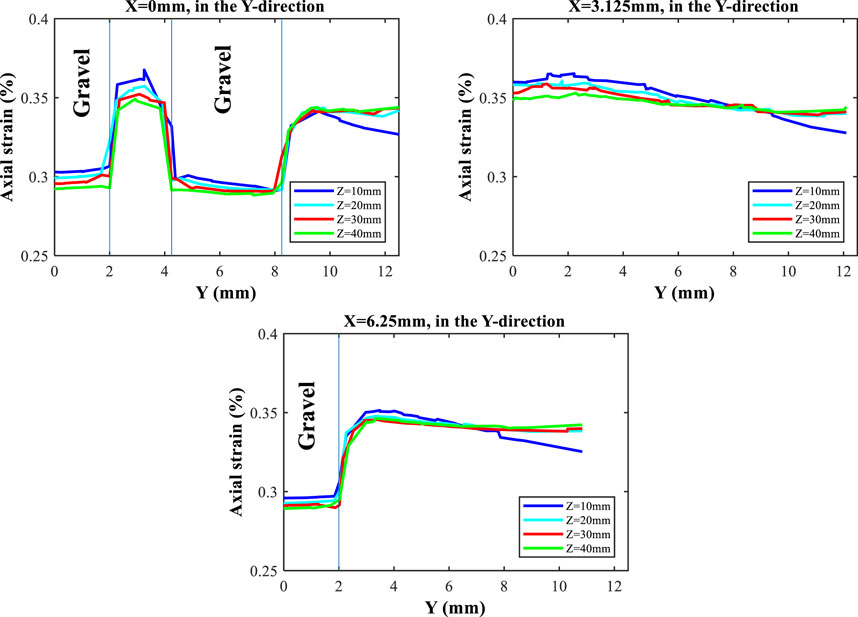
FIGURE 9. Distribution of axial strains at X = 0, 3.125, and 6.25 mm in the Y-direction in planes of Z = 10, 20, 30, and 40 mm in the base case. Vertical lines denote the gravel-matrix interfaces.
Figure 10 plots the axial stress distributions at X-Y planes with different Z values. Strong heterogeneities in axial stresses are also observed. In general, stress concentrations are located within the gravels as they are typically harder than the sandy matrix and have greater elastic moduli. The elevated axial stresses in gravels at Z = 10 mm are the greatest as they are closer to the fixed bottom boundary which allows for limited space for deformation. Another observation is that the interfaces between gravels and the matrix endure decreases in axial stresses, which is caused by the sharp differences in elastic moduli between two different materials.
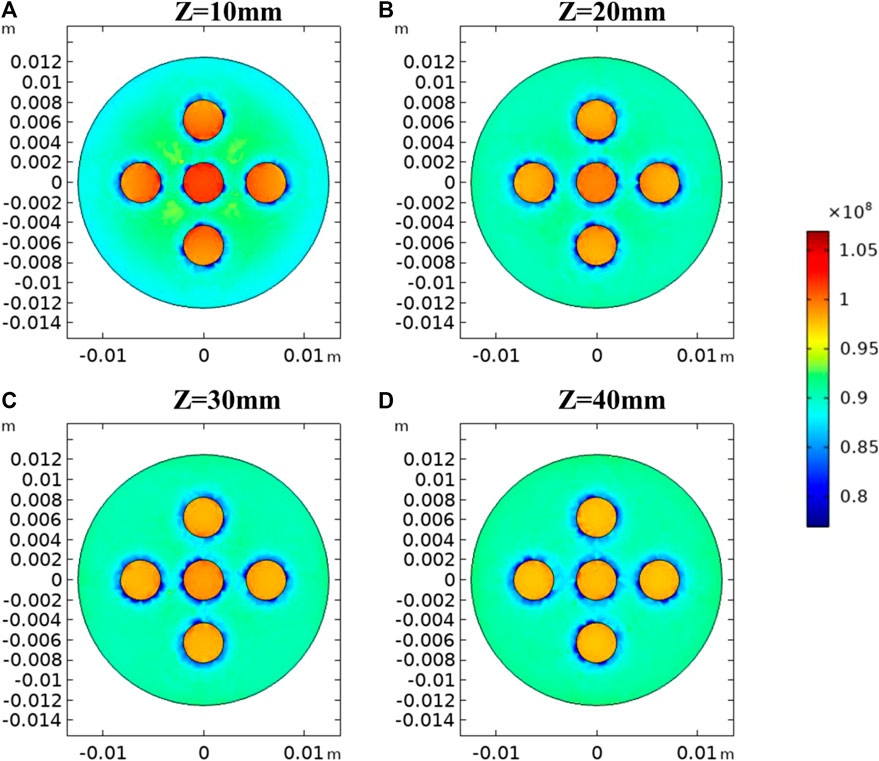
FIGURE 10. Distribution of axial stresses in X-Y planes of (A) Z = 10 mm, (B) 20 mm, (C) 30 mm, and (D) 40 mm in the base case.
To better present the heterogeneity in axial stresses, Figure 11 describes the one-dimensional axial stress distributions at X = 0, 3.125, and 6.25 mm at four different X-Y planes. Due to symmetry, only half of the domain is plotted. It is noticed that the axial stress at and near the center of the gravel in the plane tends to be greater than that in the outer gravel. Significant decreases in axial stresses are observed at the boundaries between gravels and the matrix. The magnitudes of the decreases can be as great as 15 MPa. For the one-dimensional distribution at X = 3.125 mm with no presence of gravels, oscillations in stresses are observed due to the presence of gravels at nearby areas, while the general trends are flat compared to X = 0 and 6.25 mm.
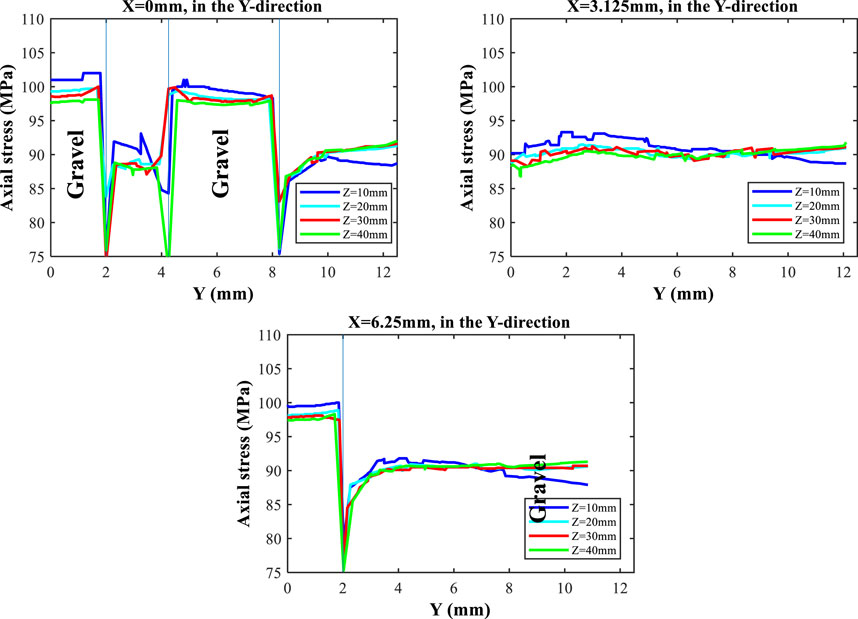
FIGURE 11. Distribution of axial stresses at X = 0, 3.125, and 6.25 mm in the Y-direction in planes of Z = 10, 20, 30, and 40 mm in the base case. Vertical lines denote the gravel-matrix interfaces.
In addition to axial strains and axial stresses in the matrix and gravels, the orientation of the maximum horizontal stresses is quantitatively analyzed. This is of special significance as previous studies have indicated that the interaction between heterogeneous gravels and hydraulic fractures is complicated, and hydraulic fractures in tight sandy conglomerate reservoirs can penetrate the gravels, bypass the gravels, be attracted by the gravels, or be terminated by the gravels (Zhu et al., 2005). Figure 12 shows conceptual interaction types between hydraulic fractures and gravels. The underlying mechanisms are complicated due to the heterogeneity in rock mechanical parameters.
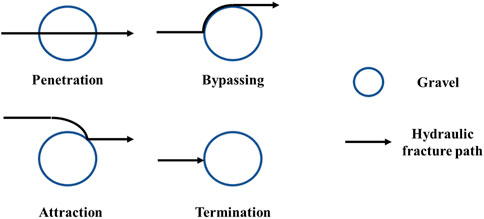
FIGURE 12. Types of interactions between gravels and hydraulic fractures in tight sandy conglomerates.
To understand the mechanisms behind the interaction types presented above, in Figure 13, the effect of compression on stress reorientation in the rock sample is studied based on numerical modeling. The compression effect here resembles the tensile failure caused by the net pressure in hydraulic fracture. To calculate the reorientation of the principal stress in the horizontal plane presented in Figure 13, Eq. 10 is used as below:
where
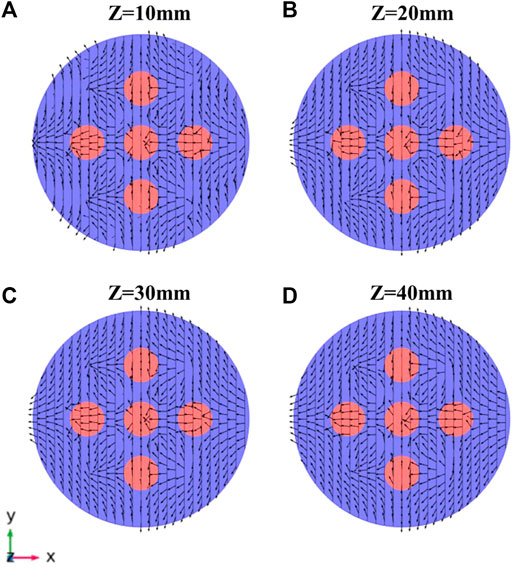
FIGURE 13. Orientation of maximum horizontal principal stress
Since the rock sample is under a conventional tri-axial compression state
Based on the non-uniform reorientation of
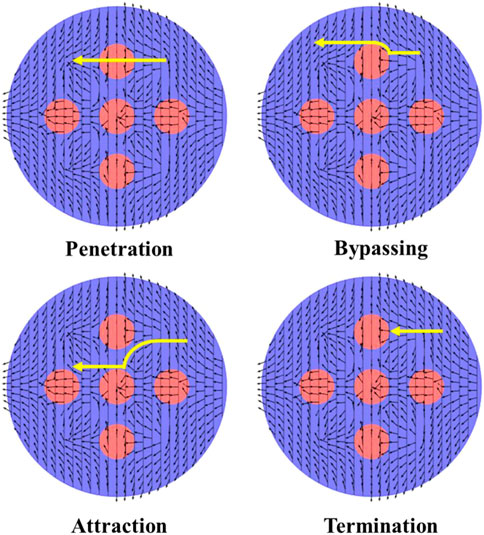
FIGURE 14. Effects of principal stress reorientation on gravel-hydraulic fracture interaction types. Arrows denote directions of
Firstly, for the penetration type, when the hydraulic fracture propagates in the direction of
Effects of Size and Elastic Modulus of Gravels on Heterogeneous Mechanical Responses
In the base case, a gravel elastic modulus of 27 GPa and a gravel radius of 2 mm are employed. To investigate the effects of gravel elastic modulus and gravel size on the deformation of the conglomerate sample, two sets of sensitivity analyses are carried out to show how the changes in elastic modulus and size of the spherical gravels affect the stress distributions in the conglomerate. In the analysis of elastic modulus of gravels, elastic modulus values of 35 and 19 GPa are used. In the analysis of gravel size, radii of 1 and 3 mm are used.
In Figure 15, axial stress distributions in the Y-direction for X = 0 mm at Z = 40 mm are plotted. The effect of gravel elastic modulus and gravel size is exhibited. Based on the results with various gravel elastic moduli on the left, it is noted that the interfaces between gravels and the sandy matrix still denote the sharps changes in axial stresses. In general, a higher gravel elastic modulus leads to higher axial stress magnitudes in the gravels. However, when the elastic modulus is decreased to 19 GPa which is very close to the elastic modulus of the sandy matrix, axial stresses in gravels are no longer elevated. In contrast, increases in axial stresses in the sandy matrix between neighboring are observed. Therefore, when the elastic modulus of gravels is decreased from 35 to 19 GPa, the stress concentrations move from the gravels to the matrix between gravels. When the difference in elastic moduli between gravels and the matrix is relatively large (e.g., 35 GPa for gravels and 17 GPa for the matrix), it is harder for gravels to deform under tri-axial compression. When the difference is small (e.g., 19 GPa for gravels and 17 GPa for the matrix), it is easier for gravels to deform under tri-axial compression. However, in general, the average axial stresses in all elastic modulus simulation cases are very close. This indicates that although gravels and the matrix have their own moduli, the overall mechanical responses in the conglomerate to tri-axial compression do not change much. This is because the tri-axial compression parameters of axial loading and confining pressure are the same in all sensitivity cases.
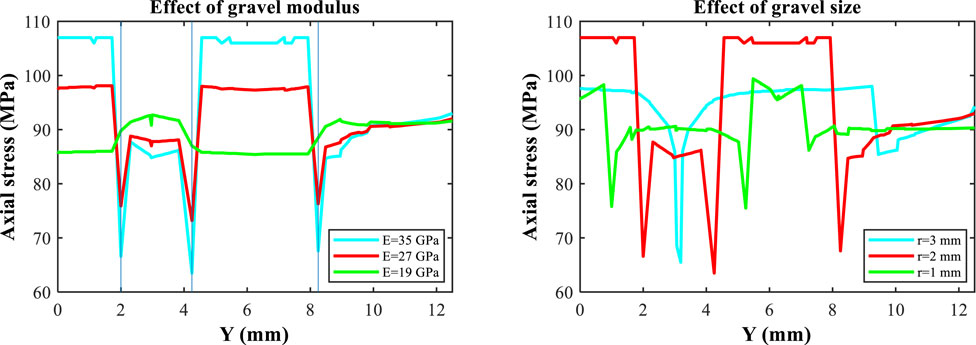
FIGURE 15. Axial stress in the Y-direction at X = 0 mm for Z = 40 mm with various elastic moduli and radii of gravels.
When gravel radii of 1 mm, 2 mm, and 3 mm are simulated, it is noted that the peak axial stresses for a radius of 1 mm and a radius of 3 mm are at very similar levels of around 98 MPa in gravels. When the radius changes, the corresponding axial stress distribution drastically changes. In general, axial stresses in gravels are higher and axial stresses in the matrix are lower. The profile shapes are directly governed by sizes of spherical gravels. Regardless of the gravel size, sharp decreases in stresses are observed at the interfaces between gravels and matrices. However, there are no clear correlations between gravel radius and the axial stresses in either gravels or the matrix.
Since the stress reorientation around gravels is a key parameter to determine the interaction between hydraulic fracturing and gravels, Figure 16 plots the comparison of
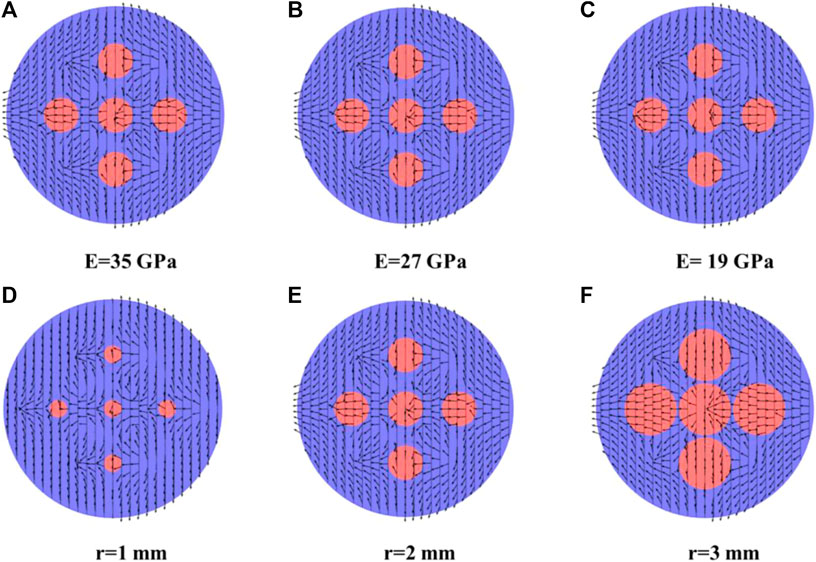
FIGURE 16.
Conclusion
In this study, the heterogeneous rock mechanical responses in a tight sandy conglomerate sample cored from a Lower Triassic Formation under tri-axial compression are experimentally and numerically investigated. The stress-strain relationships are first obtained from the lab. The lab data are then used to calibrate the finite element model for the simulation of the tri-axial compression process. Then, detailed numerical results for axial strain, axial stress, and
In Conclusion
1) Before reaching peak strengths, the deformation of the tight sandy conglomerate sample exhibits linear elasticity. Consequently, the constitutive relationship in the numerical model is also determined as linear elastic.
2) Since the tri-axial compression test in the lab can only demonstrate the overall response of the conglomerate sample and cannot quantify the spatial distribution of stress and strain in the sample, it is meaningful to develop a three-dimensional finite element model with a reasonable and lab-calibrated parameterization for the quantification of the stress and strain evolutions in the heterogeneous sample.
3) In general, axial strains in the gravels are lower than those in the matrix, while axial stresses in the gravels are higher than those in the matrix. This phenomenon of stress concentration is explained by higher elastic moduli in the gravels, which makes it more difficult to deform.
4) The elastic modulus and size of gravels both affect the distribution of stresses and strains. Increased elastic moduli in gravels lead to more heterogeneous distributions of stresses and strains among the conglomerate, while their effects on
5) The nonuniformly reoriented
Data Availability Statement
The raw data supporting the conclusion of this article will be made available by the authors, without undue reservation.
Author Contributions
BC, JJ, JL, HC, and XW contributed to the conception, design, and data interpretation for this study. XG and JL conducted the experimental and numerical study. XG wrote the draft of the manuscript. JJ, WY, and JL modified the manuscript.
Conflict of Interest
Authors BC, JJ, JL, HC, and XW were employed by the company China Petroleum Logging Company Limited.
The remaining authors declare that the research was conducted in the absence of any commercial or financial relationships that could be construed as a potential conflict of interest.
Publisher’s Note
All claims expressed in this article are solely those of the authors and do not necessarily represent those of their affiliated organizations, or those of the publisher, the editors, and the reviewers. Any product that may be evaluated in this article, or claim that may be made by its manufacturer, is not guaranteed or endorsed by the publisher.
Acknowledgments
The authors acknowledge support from the Research Foundation of China University of Petroleum-Beijing at Karamay (No. XQZX20200009), the National Natural Science Foundation of China (No. 51904314, No. 51991362) and the Fundamental Research Funds for the Central Universities and the Science Foundation of China University of Petroleum, Beijing (No. 2462018YJRC031).
References
Aghababaei, M., Behnia, M., and Moradian, O. (2019). Experimental Investigation on Strength and Failure Behavior of Carbonate Rocks under Multistage Triaxial Compression. Int. J. Rock Mech. Mining Sci. 123 (123), 104099. doi:10.1016/j.ijrmms.2019.104099
Akram, M. S., Sharrock, G. B., and Mitra, R. (2019). Investigating Mechanics of Conglomeratic Rocks: Influence of Clast Size Distribution, Scale and Properties of Clast and Interparticle Cement. Bull. Eng. Geol. Environ. 78, 2769–2788. doi:10.1007/s10064-018-1274-x
Baumgarten, L., and Konietzky, H. (2013). Investigations on the Fracture Behaviour of Rocks in a Triaxial Compression Test. Paper presented at the ISRM International Symposium - EUROCK 2013. Wroclaw, Poland, October 2013. doi:10.1201/b15683-148
Chen, A., Guo, X., Yu, H., Huang, L., Shi, S., and Cheng, N. (2021). A Parametric Study of Hydraulic Fracturing Interference between Fracture Clusters and Stages Based on Numerical Modeling. Energy Exploration & Exploitation 39 (1), 65–85. doi:10.1177/0144598720953257
Cheng, W., Jiang, G.-S., Xie, J.-Y., Wei, Z.-J., Zhou, Z.-D., and Li, X.-D. (2019). A Simulation Study Comparing the Texas Two-step and the Multistage Consecutive Fracturing Method. Pet. Sci. 16, 1121–1133. doi:10.1007/s12182-019-0323-9
China University of Petroleum (2021). Photo of the GCTS RTR-1500 Rapid Triaxial Testing System. Available at: http://www.cup.edu.cn/prplab.
Dahi Taleghani, A., Gonzalez-Chavez, M., Yu, H., and Asala, H. (2018). Numerical Simulation of Hydraulic Fracture Propagation in Naturally Fractured Formations Using the Cohesive Zone Model. J. Pet. Sci. Eng. 165, 42–57. doi:10.1016/j.petrol.2018.01.063
Dong, J.-N., Yuan, G.-J., Wang, X.-Y., Chen, M., Jin, Y., Zeng, C., et al. (2021). Experimental Study of Multi-Timescale Crack Blunting in Hydraulic Fracture. Pet. Sci. 18, 234–244. doi:10.1007/s12182-020-00479-1
Duan, W., Sun, B., Pan, D., Wang, T., Guo, T., and Wang, Z. (2021). Experimental Study on Fracture Propagation of Hydraulic Fracturing for Tight sandstone Outcrop. Energy Exploration & Exploitation 39 (1), 156–179. doi:10.1177/0144598720972513
Feng, Z., Yin, C., Lu, J., and Zhu, Y. (2013). Formation and Accumulation of Tight sandy Conglomerate Gas: A Case from the Lower Cretaceous Yingcheng Formation of Xujiaweizi Fault Depression, Songliao Basin. Pet. Exploration Develop. 40 (6), 696–703. doi:10.1016/s1876-3804(13)60094-4
Guo, X., Wu, K., An, C., Tang, J., and Killough, J. (2019). Numerical Investigation of Effects of Subsequent Parent-Well Injection on Interwell Fracturing Interference Using Reservoir-Geomechanics-Fracturing Modeling. SPE J. 29 (4), 1884–1902. doi:10.2118/195580-pa
Guo, X., Wu, K., Killough, J., and Tang, J. (2018a). Understanding the Mechanism of Interwell Fracturing Interference Based on Reservoir-Geomechanics-Fracturing Modeling in Eagle Ford Shale. SPE Reservoir Eval. Eng. 22 (03), 842–860. SPE-194493-PA. doi:10.15530/urtec-2018-2874464
Guo, X., Wu, K., and Killough, J. (2018b). Investigation of Production-Induced Stress Changes for Infill-Well Stimulation in Eagle Ford Shale. SPE J. 23 (04), 1372–1388. doi:10.2118/189974-pa
Guo, Y., Hou, L., Yao, Y., Zuo, L., Wu, Z., and Wang, L. (2020). Experimental Study on Influencing Factors of Fracture Propagation in Fractured Carbonate Rocks. J. Struct. Geology. 131, 103955. doi:10.1016/j.jsg.2019.103955
Hou, B., Chang, Z., Fu, W., Muhadasi, Y., and Chen, M. (2019). Fracture Initiation and Propagation in a Deep Shale Gas Reservoir Subject to an Alternating-Fluid-Injection Hydraulic-Fracturing Treatment. SPE J. 24 (4), 1839–1855. doi:10.2118/195571-pa
Hyman, J. D., and Jiménez‐Martínez, J. (2018). Dispersion and Mixing in Three‐Dimensional Discrete Fracture Networks: Nonlinear Interplay between Structural and Hydraulic Heterogeneity. Water Resour. Res. 54, 3243–3258. doi:10.1029/2018wr022585
Kluge, C., Blöcher, G., Barnhoorn, A., and Bruhn, D. (2020). Hydraulic-mechanical Properties of Microfaults in Granitic Rock Using the Punch-Through Shear Test. Int. J. Rock Mech. Mining Sci. 134 (134), 104393. doi:10.1016/j.ijrmms.2020.104393
Kumara, J., Hayano, K., Shigekuni, Y., and Sasaki, K. (2013). Physical and Mechanical Properties of Sand-Gravel Mixtures Evaluated from DEM Simulation and Laboratory Triaxial Test. Int. J. GEOMATE 4 (2), 546–551.
Lecampion, B., Bunger, A., and Zhang, X. (2018). Numerical Methods for Hydraulic Fracture Propagation: A Review of Recent Trends. J. Nat. Gas Sci. Eng. 49, 66–83. doi:10.1016/j.jngse.2017.10.012
Li, J., Yu, W., Guerra, D., and Wu, K. (2018). Modeling wettability alteration effect on well performance in Permian basin with complex fracture networks. Fuel 224, 740–751. doi:10.1016/j.fuel.2018.03.059
Liu, X., Xiong, J., Liang, L., and You, X. (2018). Rock Mechanical Characteristics and Fracture Propagation Mechanism of Sandy Conglomerate Reservoirs in Baikouquan Formation of Mahu Sag. Xinjiang Pet. Geology. 39 (1), 83–91. doi:10.7657/XJPG20180108
Mao, S., Siddhamshetty, P., Zhang, Z., Yu, W., Chun, T., Kwon, J. S. I., et al. (2020). Impact of proppant pumping schedule on well production for slickwater fracturing. SPE J. 26 (01), 342–358. doi:10.2118/204235-PA
Qin, H., and Yang, X. (2019). Log Interpretation Methods for Measuring the Brittleness of Tight Reservoir. Well Log. Technol. 43 (5), 509–513. doi:10.16489/j.issn.1004-1338.2019.05.013
Qian, Y., Wang, W., Lin, L., Zhang, H., Hou, Z., and Cheng, J. (2021). Calculation and Application of Transversely Isotropic formation Rock Mechanical Parameters. Well Log. Technol. 45(1), 62–67. doi:10.16489/j.issn.1004-1338.2021.01.011
Safari, R., Lewis, R., Ma, X., Mutlu, U., and Ghassemi, A. (2017). Infill-Well Fracturing Optimization in Tightly Spaced Horizontal wells. SPE J. 22 (2), 582–514. doi:10.2118/178513-pa
Shi, S., Zhao, C., Liu, H., Ding, K., Li, J., Chen, J., et al. (2018). Experimental Study on Rock Mechanics Parameters-A Case of the Sand Conglomerate Reservoir in M2 Well Area. 3rd International Conference on Advances in Energy and Environment Research (ICAEER 2018), Aug 10–12, Guilin, China.
Tan, P., Jin, Y., and Pang, H. (2021). Hydraulic Fracture Vertical Propagation Behavior in Transversely Isotropic Layered Shale Formation with Transition Zone Using XFEM-Based CZM Method. Eng. Fracture Mech. 248, 107707. doi:10.1016/j.engfracmech.2021.107707
Tan, P., Pang, H., Zhang, R., Jin, Y., Zhou, Y., Kao, J., et al. (2020). Experimental Investigation into Hydraulic Fracture Geometry and Proppant Migration Characteristics for southeastern Sichuan Deep Shale Reservoirs. J. Pet. Sci. Eng. 184, 106517. doi:10.1016/j.petrol.2019.106517
Tang, J., Wu, K., Li, Y., Hu, X., Liu, Q., and Ehlig-Economides, C. (2018). Numerical Investigation of the Interactions between Hydraulic Fracture and Bedding Planes with Non-orthogonal Approach Angle. Eng. Fracture Mech. 200, 1–16. doi:10.1016/j.engfracmech.2018.07.010
Togashi, Y., Kikumoto, M., and Tani, K. (2017). An Experimental Method to Determine the Elastic Properties of Transversely Isotropic Rocks by a Single Triaxial Test. Rock Mech. Rock Eng. 50, 1–15. doi:10.1007/s00603-016-1095-9
Wang, J., Ge, H., Wang, X., Shen, Y., Liu, T., Zhang, Y., et al. (2019). Effect of clay and Organic Matter Content on the Shear Slip Properties of Shale. J. Geophys. Res. Solid Earth (124), 9505–9525. doi:10.1029/2018jb016830
Xiang, C., and Zhang, X. (2015). Conglomerate Reservoirs Characteristics and Main Controlling Factors of Kexia Formation in Liuzhong Area of Kelamayi Oilfield. Electron. J. Geotechnical Eng. 20 (12), 5061–5073.
Xie, J., Tang, J., Yong, R., Fan, Y., Zuo, L., Chen, X., et al. (2020). A 3-D Hydraulic Fracture Propagation Model Applied for Shale Gas Reservoirs with Multiple Bedding Planes. Eng. Fracture Mech. 228, 106872. doi:10.1016/j.engfracmech.2020.106872
Yue, K., Olson, J. E., and Schultz, R. A. (2019). The Effect of Layered Modulus on Hydraulic-Fracture Modeling and Fracture-Height Containment. SPE Drilling & Completion 34 (04), 356–371. doi:10.2118/195683-pa
Zhang, F., Dontsov, E., and Mack, M. (2017). Fully Coupled Simulation of a Hydraulic Fracture Interacting with Natural Fractures with a Hybrid Discrete-Continuum Method. Int. J. Numer. Anal. Meth. Geomech. 41 (13), 1430–1452. doi:10.1002/nag.2682
Zhao, X., Zhou, L., Pu, X., Jin, F., Shi, Z., Han, W., et al. (2020). Formation Conditions and Enrichment Model of Retained Petroleum in Lacustrine Shale: A Case Study of the Paleogene in Huanghua Depression, Bohai Bay Basin, China. Pet. Exploration Develop. 47 (5), 916–930. doi:10.1016/S1876-3804(20)60106-9
Zhi, D., Guo, X., Wang, W., Jin, Y., Liu, C., Chen, G., et al. (2021). Fracturing and Production Analysis of the Efficacy of Hydraulic Fracture Stage Reduction in the Improvement of Cost‐effectiveness in Shale Oil Development: A Case Study of Jimsar Shale Oil, China. Energy Sci Eng 9, 1337–1348. doi:10.1002/ese3.940
Keywords: tight oil reservoirs, numerical simulation, tri-axial compression, stress and strain, hydraulic fracture
Citation: Chen B, Ji J, Lin J, Chen H, Wang X, Guo X, Yang W and Lin J (2021) Experimental and Numerical Investigation of Characteristics of Highly Heterogeneous Rock Mechanical Responses in Tight Sandy Conglomerate Reservoir Rock Under Tri-axial Compression. Front. Earth Sci. 9:735208. doi: 10.3389/feart.2021.735208
Received: 02 July 2021; Accepted: 10 September 2021;
Published: 27 September 2021.
Edited by:
Yuwei Li, Liaoning University, ChinaReviewed by:
Peng Tan, CNPC Engineering Technology R and D Company Limited, ChinaLei Gong, Northeast Petroleum University, China
Copyright © 2021 Chen, Ji, Lin, Chen, Wang, Guo, Yang and Lin. This is an open-access article distributed under the terms of the Creative Commons Attribution License (CC BY). The use, distribution or reproduction in other forums is permitted, provided the original author(s) and the copyright owner(s) are credited and that the original publication in this journal is cited, in accordance with accepted academic practice. No use, distribution or reproduction is permitted which does not comply with these terms.
*Correspondence: Xuyang Guo, eGd1b0BjdXAuZWR1LmNu