 Wei Feng
 Zechao Bai2
 Lin Zhu
94% of researchers rate our articles as excellent or good
Learn more about the work of our research integrity team to safeguard the quality of each article we publish.
Find out more
ORIGINAL RESEARCH article
Front. Earth Sci., 15 September 2021
Sec. Solid Earth Geophysics
Volume 9 - 2021 | https://doi.org/10.3389/feart.2021.734086
This article is part of the Research TopicInSAR for Volcanoes and TectonicsView all 6 articles
A MS 6.6 earthquake struck Jinghe County in Bortala Mongol Autonomous Prefecture of Xinjiang Uygur Autonomous Region on August 9, 2017. The earthquake occurred near the eastern part of the Kusongmuxieke Piedmont Fault (KPF) in the southwest of Junggar Basin. Using two pairs of coseismic SAR image data from the ascending and descending tracks from Sentinel-1 (European Space Agency), we processed the interferograms to obtain the coseismic deformation field. We calculate the fault slip distribution of the earthquake based on the elastic half-space rectangular dislocation model with the available location, geometry from seismic data and the coseismic deformation data. The results show that the earthquake deformation field has the typical characteristics of thrust faulting. The uplift deformation field is about 28 km long and 20 km wide. The maximum displacements of InSAR line-of-sight to the ascending and descending tracks are 49 and 68 mm, respectively. The main slip is concentrated at the depth of 10–20 km. The inverted seismic moment is equivalent to a moment magnitude MW 6.3. This result is very similar to the slip distribution from the seismological inversion. The maximum deformation area and the distribution of aftershocks are both on the west side of the mainshock. They mutually confirm the characteristics of a unilateral rupture. According to stress triggering theory, the aftershocks within 1 month after the mainshock in the layer 10–14 km deep may have been triggered by the mainshock, and the transferred stress increases the seismic risk of the eastern section of the KPF fault. After more than 1 year, a MS 5.4 earthquake occurred to the southwest of the MS 6.6 Jinghe earthquake. Beacause the stress drop change (<0.01 MPa) is too small for the MS 5.4 earthquake to have been directly triggered. Based on the analysis of multisource data and the detailed geological investigation, the thrust Jinghenan fault which north of Kusongmuxieke Piedmont fault is inferred to be the seismogenic fault of the MS 6.6 Jinghe earthquake.
Since the Cenozoic Era, the collision of the Indo-Asian Plate has caused crustal shortening, thickening, and lateral extrusions of the Tibetan Plateau over an area thousands of kilometers wide. Moreover, the SN-trending compression stress has affected Tianshan Mountain (Molnar and Tapponnier, 1975; Avouac et al., 1993). The eastward extrusion of the crustal blocks in eastern Tibet is accommodated by the Longmenshan thrust fault zone and decoupled lower crust channel flow. The remote effect has led to the reactivation of the Paleozoic Tianshan orogenic belt, forming a ∼2,000 km-long intraplate active orogenic belt (Tapponnier and Molnar, 1979; Windley et al., 1990; Allen et al., 1993). The SN-trending compression caused by the remote effects of the collision has shaped the main structure patterns of north and south Tianshan. Along the Tianshan piedmonts, a series of active thin-skin fold-and-thrust belts have formed, which dominate the main region where earthquakes occur, such as the 1902 M 8.3 Artushi earthquake, the 1906 M 8 Manas earthquake, and the 2017 MS 6.2 Hutubi earthquake (Deng et al., 2000; Kulikova and Krüger, 2017; Lu et al., 2018). In addition, some other active strike-slip faults and intermontane basins have developed within the Tianshan area, which also affect the current active deformation, such as the NW-trending dextral Talas-Fergana Fault and Bolokenu-Aqikekuduke Fault, the NEE-trending sinistral Nalati Fault and Kemei Fault, and the Bayinbuluke Basin and the YanQi depression Basin (Selander et al., 2012; Campbell et al., 2013; Charreau et al., 2017). These structures jointly regulate and absorb the tectonic deformation in the Tianshan area, and historical strong earthquakes have occurred on partial fault segments.
On August 9, 2017 (UTC 23:27:52), a MS 6.6 earthquake struck Jinghe County in Bortala Mongol Autonomous Prefecture of Xinjiang Uygur Autonomous Region (44.27°N, 82.83°E). The earthquake occurred near the eastern part of the Kusongmuxieke Piedmont Fault (KPF) and west of the Bolokenu-Aqikekuduke Fault (Figure 1). Since 2010, several moderate to strong thrusting earthquakes have occurred in this area, including the MS 5.0 earthquake on October 16, 2011, the MS 6.6 Jinghe earthquake on August 9, 2017, and the MS 5.4 earthquake on October 16, 2018. Focal mechanism solutions obtained by several research institutions show that the MS 6.6 Jinghe earthquake is a thrust earthquake (He et al., 2020), which is consistent with the regional compression regime (Figure 2).
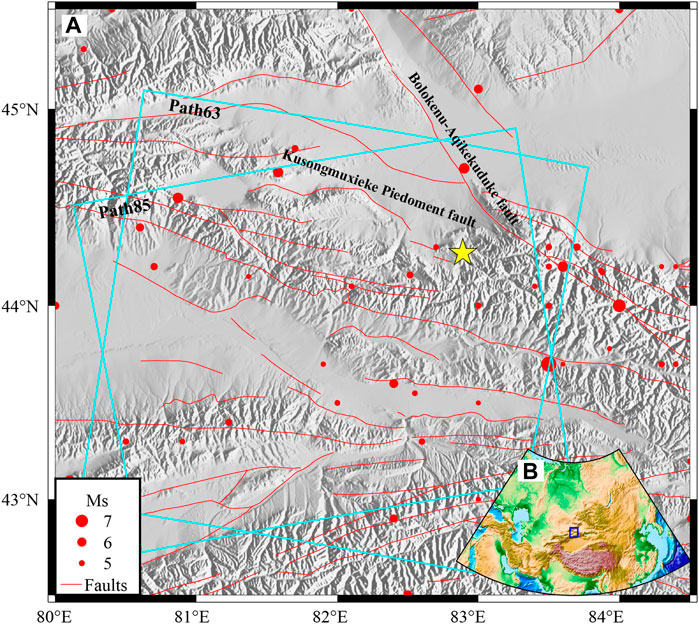
FIGURE 1. (A) Fault map of the study area. Jinghe seismicity on August 9, 2017 (red circles) superimposed on a topographic relief map (Xu et al., 2016). The yellow star is the location of the 2017 Jinghe event. The red lines denote the active faults. The blue frames are the coverage of the Sentinel-1 data. The red dots show historic events. The blue box in (B) inset indicates the area shown in (A).
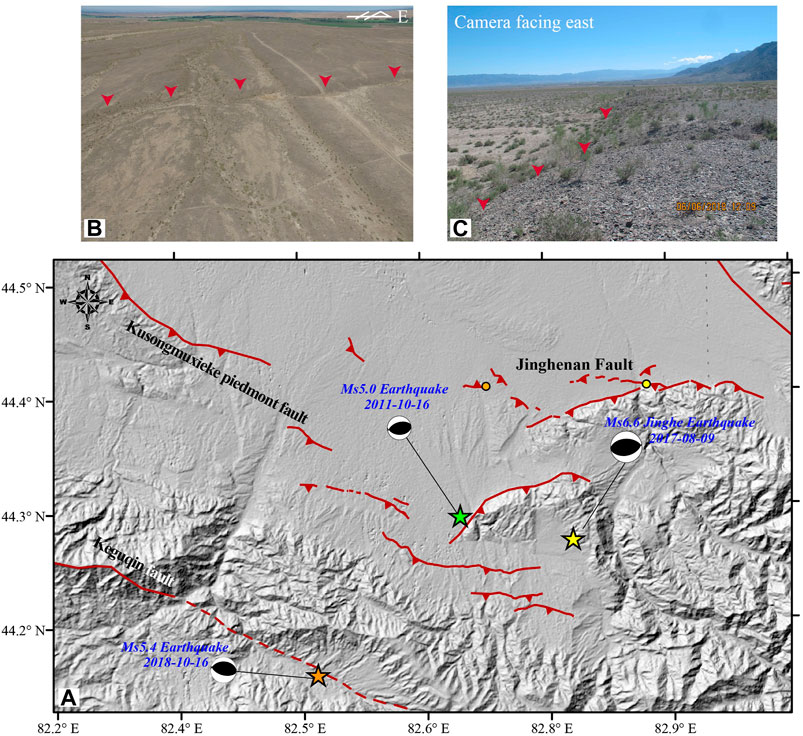
FIGURE 2. (A) Map produced after a geological investigation of the Jinghenan fault superimposed on topographic relief. The solid lines with triangles denote active thrust faults. The dashed line is the speculative extension. The focal mechanism solutions represent the three recent earthquakes (M ≥ 5.0). The yellow star marks the location of the earthquake on August 9, 2017. The orange star marks the location of the earthquake on October 16, 2018. The green star marks the location of the earthquake on October 16, 2011. (B) Photograph of the Jinghenan fault reverse scarp taken by an unmanned aerial vehicle at the position of the orange dot in (A). Red arrows indicate the scarp. (C) Photograph of the Jinghenan fault scarp taken with a handheld camera at the position of the yellow dot in (A). Red arrows indicate the scarp.
Thrust earthquakes are often accompanied by strong vertical coseismic deformation. Examples include the MS 7.0 Lushan earthquake in 2013, the MS 6.5 Pishan earthquake in 2015, the MS 6.4 Menyuan earthquake in 2016, and the MS 5.7 Kuche earthquake in 2017, which are thrust earthquakes that occurred in the extrusion zone (Li T. et al., 2016; Liu et al., 2016; Guo et al., 2017). Intserferometric Synthetic Aperture Radar (InSAR) can provide large-scale and high-precision coseismic deformation data, which can be used to estimate the fault slip distribution of an earthquake (Li Y. et al., 2016; Wen et al., 2016; Feng et al., 2017; Wang et al., 2017; Luo et al., 2021). This has become an important technique in seismic research. Many coseismic deformation studies have been carried out using a lot of satellites data obtained by InSAR, and good results have been achieved. The MS 6.6 Jinghe earthquake occurred in a sparsely vegetated area, favourable for SAR observation. As it is a blind thrust earthquake in the piedmont area, we utilized SAR data from Sentinel-1A and 1B to construct the coseismic deformation field. Constrained by multiple focal mechanism solutions, we inverted the fault slip distribution and speculated on the seismogenic fault. We analyzed the triggering relation between the Coulomb stress change and aftershocks, particularly the MS 5.4 earthquake on October 16, 2018. These methods and results can be applied to study similar blind thrust earthquakes, which is important for understanding the potential seismic hazards.
The epicenter of the MS 6.6 Jinghe earthquake is at the convergence of Junggar Basin and north Tianshan, near the eastern part of the KPF. The existing geological data of the stratigraphic and tectonic information revealed that the KPF is an important border fault of the north fringe of the rejuvenated orogenic belt in the west segment of north Tianshan. The eastern segment of the KPF is 50 km long, dip 40°–60°, consisted by four south-inclined fault slopes, which trend 100°–110°, and indicate thrust faults. The average upthrow along this segment is ∼3–4 m, and the maximum vertical separation is about 8 m, with a vertical slip rate of 0.23–0.33 mm/a during the Late Pleistocene and 0.05–0.08 mm/a during the Holocene (Chen et al., 2007). The fault is still active and is the seismogenic structure of the MS 5.0 earthquake in 2011. A detailed geological investigation of the MS 6.6 Jinghe earthquake found several parallel nearly EW thrust fault-folds in the piedmont of the epicenter region. There are abundant faulted landforms and some thrust faults to the north of the KPF. An unmanned aerial vehicle is used to measure the terrain with high precision. Obvious linear scarps can be seen in the resulting digital elevation model. Differential GPS measurements show that the scarp height of the Jinghenan fault is mainly 4.8–9.9 m, and that there are several fragmentary secondary faults with scarp heights of 0.5–1.0 m (Figure 2). Although we did not find the surface rupture of the Jinghe earthquake, the linear scarps and the discontinuous trace of the fault show that the Jinghenan fault is still active.
The line-of-sight (LOS) coseismic deformation due to the 2017 Jinghe earthquake was mapped using both the descending and ascending tracks of the Sentinel-1 TOPS (Terrain Observation with Progressive Scans) mode (paths 63 and 85). The descending coseismic interferogram was generated from August 7, 2017 to August 13, 2017, and the ascending one was generated from August 8, 2017 to August 14, 2017. These datasets have the shortest temporal and perpendicular baselines available. The parameters of the interferometric pairs are shown in Table 1.
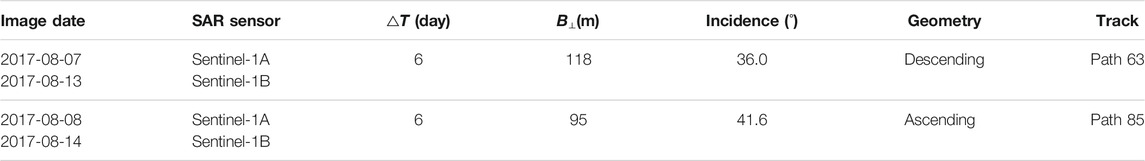
TABLE 1. InSAR data for the Jinghe earthquake.
In this study, the orbit error of SAR images was corrected using the precision orbit data provided by the European Space Agency. The interferograms were processed by InSAR using SARscape. We generated a Multi-look image using numbers of looks 2 for direction in azimuth and 10 in range, leading to a pixel spacing of about 28 × 23 m2 (azimuth × range). The phase of the interferogram
where
A digital elevation model derived from the Shuttle Radar Topography Mission with three arcsec resolution (Farr et al., 2007) was used to remove the topographic effects from the interferograms. To reduce the influence of noise, we used the method of Goldstein (Goldstein and Werner, 1998) to filter the differential interferograms. A vertical layered portion of the atmospheric phase was removed based on the exponential model (Remy et al., 2003). Then the differential interferogram was unwrapped using the minimum cost flow algorithm (Costantini, 1998) with a mask to get
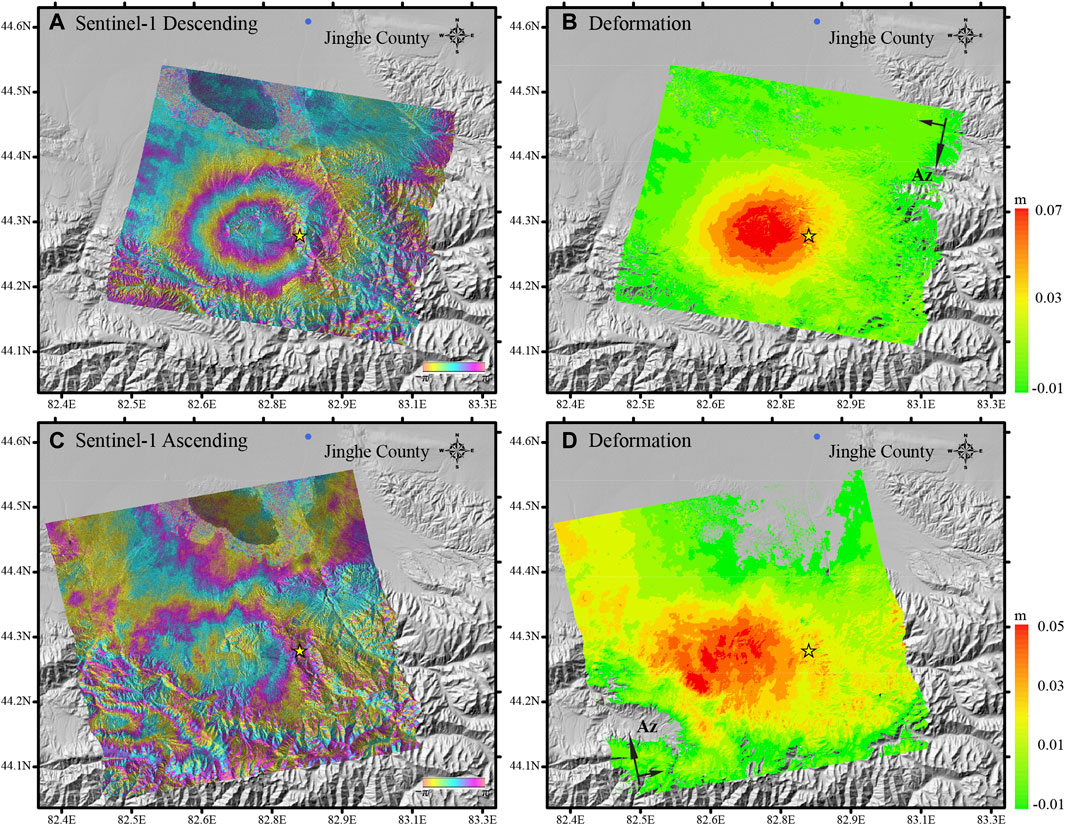
FIGURE 3. The wrapped and unwrapped interferograms. (A, C) Ascending and descending wrapped interferograms of the MS 6.6 Jinghe earthquake, respectively. (B, D) Ascending and descending unwrapped coseismic deformation maps, respectively. The yellow star indicates the epicenter of the mainshock. The blue dot represents Jinghe County.
The coseismic deformation data were downsampled using dense and sparse sampling. The main deformation was sampled at 500 m interval, and the area without obvious deformation was sampled at 1,000 m interval. This strategy can not only effectively retain the deformation information, but also effectively reduce the amount of subsequent calculation. Then, the actual satellite incident angle and its orbital azimuth angle at the sampling points were calculated. The final input data were obtained from 3,932 ascending and 4,816 descending InSAR LOS deformation observation points, which were jointly inverted for the fault parameters. Following the Okada elastic half-space dislocation theory (Okada, 1985), the inversion location and size of the fault were determined by a nonlinear inversion. To avoid overfitting the coseismic deformation data in the inversion, the seismological results were used as constraints. The focal mechanism solution includes two nodal planes. According to the geological investigation and geological background, we can confirm the result of south-inclined plane. So, the north-inclined nodal planes (Table 2, Nodal plane 2) were excluded. Based on multiple focal mechanism solutions, we used linear inversion to calculate the slip distribution of the fault corresponding to four fixed sets of strike angle, dip angle, and rake angle (Table 2, Nodal plane 1). The focal mechanisms are from the Institut De Physique Du Globe De Paris (IPGP), the China Earthquake Networks Center (CENC), the Global Centroid Moment Tensor (GCMT), and the United States Geological Survey (USGS). The 30 × 20 km2 fault plane was divided into 1.0 × 1.0 km2 square units. The total number of fault subunits was 600. The non-negative least squares method was used to invert the slip for each subunit. To avoid the loss of the matrix rank and oscillations in the slip distribution solution space during the solution process, Laplace smoothing constraints were added (Wright et al., 2003). The equation is
where
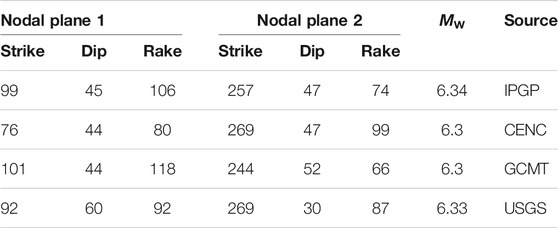
TABLE 2. Focal mechanism solutions of the 2017 Jinghe earthquake.
Several studies show a good correlation between the calculated positive coseismic Coulomb stress change and the location of aftershocks (Stein and Lisowski, 1983; Ma et al., 2005). According to the Coulomb failure criterion, the Coulomb stress change is
where
In the present study, we investigated coseismic Coulomb stress changes for the receiving fault of the mainshock rupture, KPF and maximum aftershock. We calculated coseismic Coulomb stress change using the software package PSGRN/PSCMP (Wang et al., 2006), which considers the coupling between the deformation and the earth’s gravity field. To further refine the Coulomb stress changes at different depths, we forward calculated four depths. Moreover, we calculated Coulomb stress changes for the KPF with different dip angle 40°–60° and Coulomb stress changes for maximum aftershock with different effective friction coefficient.
We applied the slip distribution inversion to the 2017 MS 6.6 Jinghe earthquake. We approximately determined the thrust earthquake mechanism, which is consistent with multiple seismological focal mechanism solutions. The deformation field is about 28 km long and 20 km wide. The uplift area is clearly near the epicenter. The maximum LOS displacements for the ascending and descending tracks are 49 and 68 mm, respectively. The deformation area is mainly on the west side of the mainshock.
Inverting the LOS coseismic deformation data from Sentinel-1 SAR images for both ascending and descending tracks with the constraints from the four focal mecahmisms, we obtained four slip distributions as well as four smoothing factors, ∼0.05. A 3D image of the Jinghe earthquake with the four slip distributions, aftershocks, and regional topography is shown in Figure 4. The main slip is on the west of the seismological source and concentrated at a depth of 10–20 km. The result, which is constrained by focal mechanism solutions from USGS, is at an upper depth of 8–15 km. All results show that the rupture did not reach the surface. The four maximum slips are 0.78 m constrained by IPGP data, 0.82 m constrained by CENC data, 0.83 m constrained by GCMT data, and 0.65 m constrained by USGS data. The four estimated seismic moments correpond to MW 6.31 constrained by IPGP data, MW 6.29 constrained by CENC data, MW 6.33 constrained by GCMT data, and MW 6.25 constrained by USGS data. These are almost equivalent to the moment magnitude MW 6.3 (Table 2). The aftershocks are concentrated on the NW direction of the fault plane above 15 km. The result shows that the Jinghe earthquake is a typical south-inclined thrust rupture event, which ruptured unilaterally from east to west.
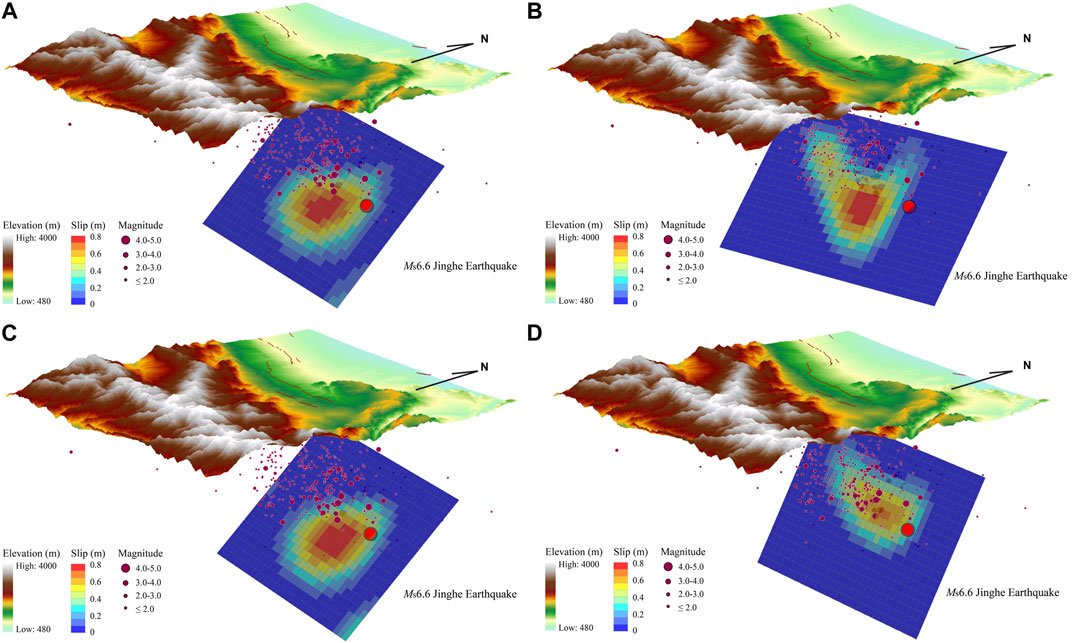
FIGURE 4. 3D stereograms of the Jinghe earthquake. The red lines on the topography denote active faults. The black arrow points north. The largest red dot indicates the mainshock. The dark red dots indicate the spatial distribution of precise located aftershocks (from Fang et al. (2017), personal communication). The red to blue shading indicates the amount of slip from large to small on the fault slip plane. Each patch is 1.0 × 1.0 km2. For clarity, the terrain elevation is 1.5 times the gain. Slip distribution are constrained by focal mechanism solutions from (A) IPGP, (B) CENC, (C) GCMT, and (D) USGS.
We calculated coseismic Coulomb stress changes by the 2017 MS 6.6 Jinghe earthquake using the software package PSGRN/PSCMP (Wang et al., 2006). Based on the distribution of slip and aftershocks between 2 and 18 km depth, we calcualted the Coulomb stress changes at four depth intervals: 4, 8, 12, and 16 km depth (Figure 5). Some works in the literature suggest that the effective friction coefficient should be 0.8 for a thrust fault (Parsons and Dreger, 2000; Ali et al., 2008). For all the Coulomb stress calculations we assumed the elastic half-space model with the fault slip distribution derived from the InSAR modelling, an empirical friction coefficient of 0.8, and the mainshock focal mechanism from IPGP for the receiving fault. In addition, to evaluate the effect of different slip distributions on the Coulomb stress changes, we also have calculated the Coulomb stress changes based on the other fault slips (Supplementary Figures S1–S3).
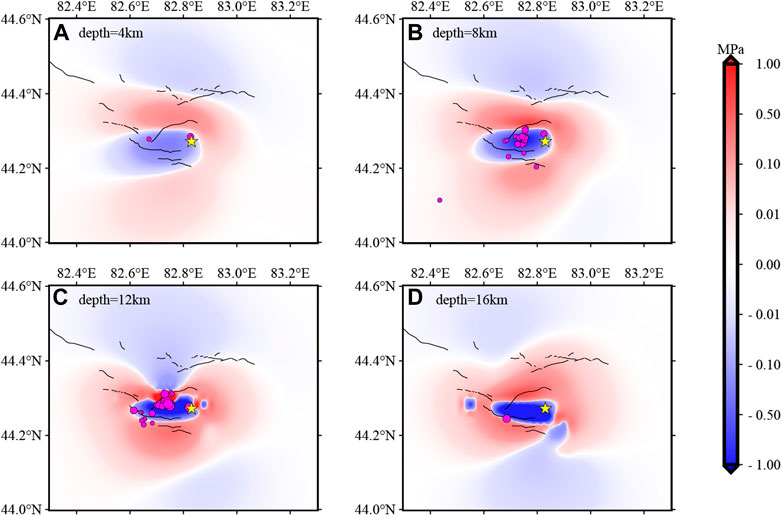
FIGURE 5. Coseismic Coulomb stress changes of slip distribution are constrained by IPGP with the receiving fault of the mainshock. (i.e., strike = 99°, dip = 45°, rake = 106°, and friction = 0.8). Coulomb stress changes at depths of 4, 8, 12, and 16 km, respectively. The black lines denote the active faults. The 2–6 km deep aftershock projection was in the 4 km plane (A), the 6–10 km deep aftershock projection in the 8 km plane (B), the 10–14 km deep aftershock projection in the 12 km plane (C), and the 14–18 km deep aftershock projection in the 16 km plane (D). The aftershocks (M ≥ 2.0) are denoted by black circles filled with rose. The epicenter of the mainshock is denoted by a yellow star.
Coseismic Coulomb stress changes for the KPF with different dip angle 40°–60° were calculated. In order to facilitate calculation and display, we have determined the location of the fault based on the surface traces from the geological investigation. Due to the uncertainty in the dip angle, we assumed three different dip angle values of 40°, 50° and 60° (Figure 6). The three results all show that the positive stress change area is at the depth of 5–10 km. And extending the SE direction of the fault, the positive stress change gradually becomes shallower. In comparison, the dip angle 60° of the fault parameters is more significantly affected by the Coulomb stress changes.
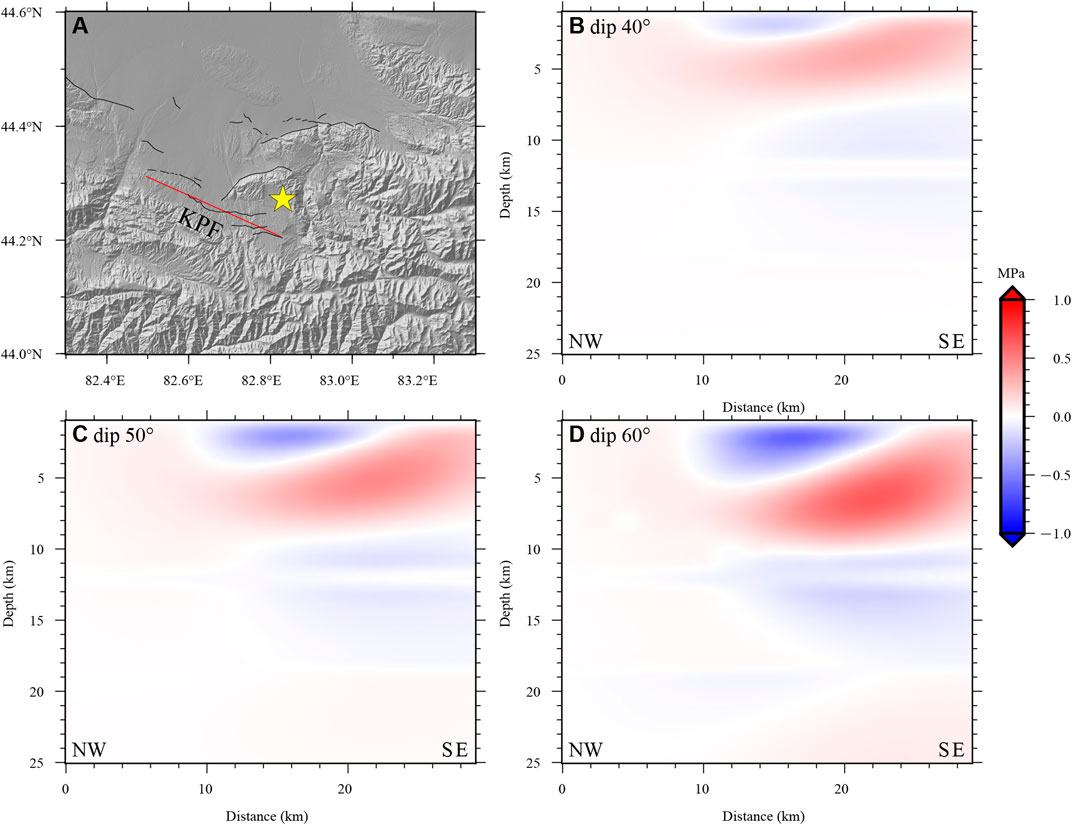
FIGURE 6. Coseismic Coulomb stress changes of slip distribution are constrained by IPGP with the receiving fault of KPF. (A) The red line is simplified surface trace of KPF. The epicenter of the mainshock is denoted by a yellow star. Coulomb stress changes on the fault plane in (B) dip angle 40°, (C) dip angle 50°, and (D) dip angle 60°.
On October 16, 2018, a MS 5.4 earthquake occurred to the southwest of the MS 6.6 Jinghe earthquake. The epicenter is determined to be 44.16°N, 82.52°E and with the depth 15.8 km. We plotted the Coulomb stress changes at a depth of 16 km for the effective friction coefficient of 0.4 and 0.8 respectively (Figure 7). The result shows that there is little Coulomb stress change produced by the MS 6.6 Jinghe earthquake to the MS 5.4 earthquake. To evaluate the effect of different slip distributions, we also calculated the Coulomb stress changes based on the parameters of several fault slips (Supplementary Figures S4–S6).
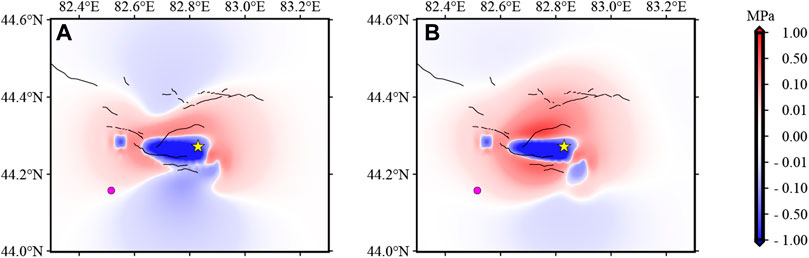
FIGURE 7. Coseismic Coulomb stress changes of the slip distribution are constrained by IPGP data with the receiving fault of the MS 5.4 earthquake focal mechanism (strike = 106.3°, dip = 53.1°, and rake = 100.0°) (from Liu et al., 2021; personal communication). The MS 5.4 earthquake on October 16, 2018, is denoted by black circle filled with rose. The epicenter of the mainshock is denoted by a yellow star. Friction is (A) 0.4 or (B) 0.8.
In general, for the moderate magnitude earthquakes (4.5 ≥ M ≥ 5.5), there is good agreement between InSAR centroid location and seismic hypocentre locations with a median difference of ∼6.3 km (Weston et al., 2012). We used the method of double-difference earthquake location to relocate the mainshok. It determined the initial location of mainshock. The distances between InSAR centroid locations and relocation of mainshock are ∼6.0 km. By comparison, the model obtained with CENC data better explain the observed ground deformation. For the descending, the area with the maximum displacement is larger and closer to the observation (Supplementary Figures S7–S10). The descending RMS of ∼0.004 m between observed and modeled is smaller than the other three models. The descending RMS of ∼0.007 m results from the noisier ascending data. Among the four results, the two slip distribution results are similar, which are based on the inversion of IPGP and GCMT parameters. They have the same trend as the InSAR inversion results obtained by Gong et al. (2019). From the relation between the mainshock and detailed slip patches, it can be seen that as well as the rupture from east to west, the fracture gradually became deeper along the south-inclined plane up to the depth of ∼20 km. The process of position travel from the mainshock to the main slip patches is very clear. This earthquake ruptured toward the southwest and downdip in ageement with seismological results (He et al., 2020; Zhang et al., 2020). The ∼45°S fault slip is consistent with the surface fault trace found by surface investigation. Considering the comprehensive information, the two inversion results constrained by IPGP and GCMT are reliable.
Several aftershocks occurred in 1 month after the mainshock and are precise located. These aftershocks are distributed over a zone which ∼38 km long with EW trending, predominantly at a depth of 3–15 km. The average error of aftershocks relocation is 1389 m in the vertical direction, while the RMS of all events is 0.26 s (Supplementary Figures S11, S12). To reveal the relation between the fault slip distribution and the aftershocks, we projected the positions of aftershocks parallel to the fault slip planes. Both the spatial distribution of the clustered aftershocks and the distributions of the larger fault slips are on the west side of the mainshock (Figure 8). However, note that the aftershocks are mainly in patches with low slip on the upper edge of the rupture. The aftershocks are obviously scarce in patches with a high slip at a depth of 13–17 km, which may be due to the full rupture of the mainshock in these patches.
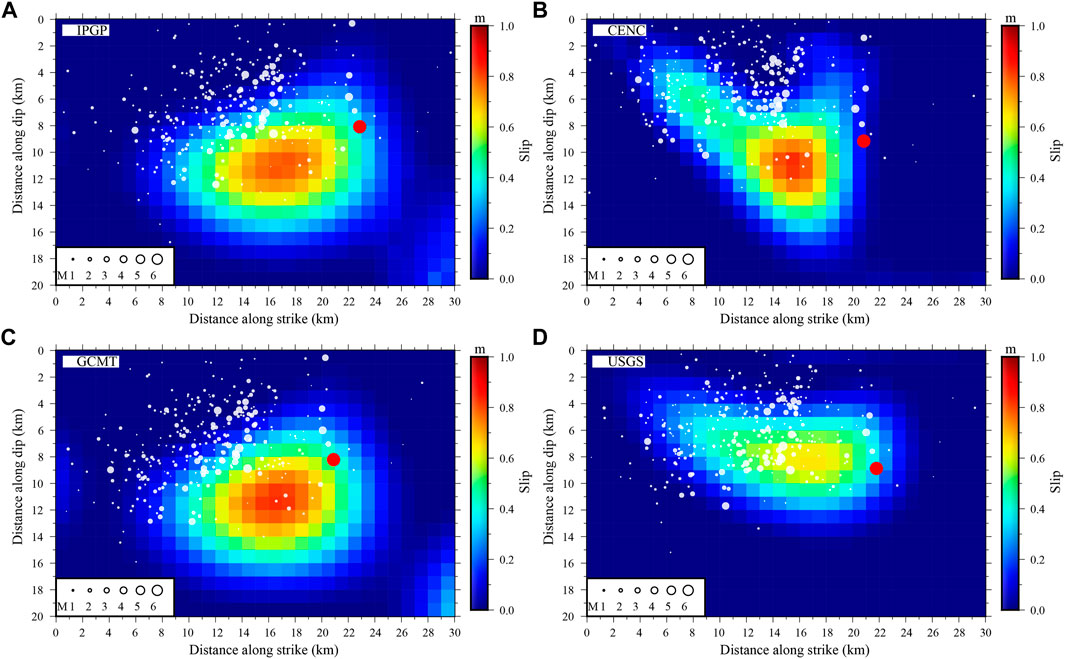
FIGURE 8. Projections of aftershocks parallel to the fault slip planes with EW trending. The red dot indicates the mainshock. The white dots indicate the aftershocks. Red to blue shading indicates the amount of slip from large to small on the fault slip plane. Slip distribution are constrained by focal mechanism solutions from (A) IPGP, (B) CENC, (C) GCMT, and (D) USGS.
As shown in Figure 5, the magnitude of Coulomb stress changes at depths of 8, 12, and 16 km are larger than at 4 km depth. The changes may be because the main coseismic slip occurred within the depth range of 10–20 km. Altogether, 55 aftershocks (M ≥ 2.0) occurred within 1 month after the mainshock around the epicenter of the mainshock. There are few aftershocks above 10 km in the positive stress change area. At a depth of 10–14 km, there are 32 aftershocks in the stress shadow area, 43.75% of which are in the positive stress change area. The Coulomb stress increased over 0.01 MPa in the positive stress change area. Therefore, some aftershocks in the layer 10–14 km deep may have been triggered by the mainshock. Although there are aftershocks below 14 km in the positive stress change area that increased by over 0.01 MPa, there are too few of them in the layer to explain the triggering mechanism of deep aftershocks. We speculate that the aftershocks below 14 km reflect the absence of high-pressure fluid sources at depth. This is based on the assumption that the focal mechanisms of the triggered aftershocks are similar to that of the mainshock. Moreover, the comparison shows that the different fault slips have a small influence on the Coulomb stress changes. However, the stratification of aftershocks above 10 km in the negative stress change area is not altered.
Due to the lack of focal mechanism parameters of the aftershocks, it is assumed that these are the same as the mainshock. In fact, the fault geometry parameters of these events may not be exactly the same. We believe that the inconsistency may result from the uncertainty in the focal mechanism parameters of the aftershocks. In particular, the occurrence of some shallow aftershocks above 10 km in the negative stress change area may be because we used a single fault plane. The triggering of aftershocks by the mainshock has an obvious stratification in depth. Similar stratification has also been described for other earthquakes (Yang et al., 2019), which may indicate that there is crustal medium difference in layer probably. In further research, we will calculate the Coulomb stress change on the faults around the epicenter and evaluate the seismic risk. Furthermore, it might be possible to use a viscoelastic layered model to assess the effects of historical earthquakes.
Besides, we can see that the mainshock transfered the stress to the KPF and the magnitude (≥0.01 MPa) is larger on the SE section of the fault at the depth of 5–10 km (Figure 6). The three results of different dip angle show that the higher dip angle the greater change. We think that it is essentially due to the distance from the mainshock. Similarly, the SE section of the KPF is more significantly affected than the NW section, which is also the reason. It indicates that the seismic risk of the eastern section of the KPF fault has been increased in the future.
As shown in Figure 7 and three other results (Supplementary Figures S4–S6), a comparison of the four different slip distributions shows that the polarity of the Coulomb stress is changed, as it ranges from −0.005 to 0.002 MPa. All the fault slips influence the Coulomb stress change in the area of the MS 5.4 earthquake. However, the epicenter of the MS 5.4 earthquake is relatively far away from the mainshock and the magnitude (<0.01 MPa) is too small for it to have been directly triggered. Considering that aftershocks are fluid-driven and decay rates controlled (Miller, 2020). It may be associated with transport of generated fluids through dehydration during aftershocks, or draining of trapped and high-pressure fluids in the area.
Combined with seismological information, the deformation from InSAR data, and a detailed geological investigation, we constructed a schematic geometry model of the seismogenic fault. For a while shortly after the earthquake, KPF was mistaken for a seismogenic fault. The reason is quite straightforward, as the epicenter of the Jinghe earthquake is near the eastern part of the KPF, which based on existing geological knowledge, is a thrust fault. However, we found that the mainshock is not on the strike of the known KPF. Moreover, the spatial distribution of the precisely located aftershocks shows that most aftershocks are on the north footwall of the south-inclined thrust KPF. The InSAR data and seismological results also suggest that the thrust seismogenic fault is north of the KPF. Other studies confirm this (Gong et al., 2019; He et al., 2020). We have mapped the spatial location of the inversion fault as accurately as possible on the schematic geometry model. The speculative extension of the ∼45°S fault slip can be matched with the Jinghenan fault surface trace (Figure 9). It is difficult to match the fault slip model with the spatial location and geometry of the KPF. We think the KPF is not the seismogenic fault. With the dominant extrusion background, fold-thrust belts to the north of the mountain front will propagate into the foreland. Although the trace of the Jinghenan fault is very discontinuous on the surface, it is a piece of important geological evidence for the existence of a non-single thrust fault to the north of piedmont. The thrust Jinghenan fault north of the KPF is inferred to be the seismogenic fault of this earthquake.
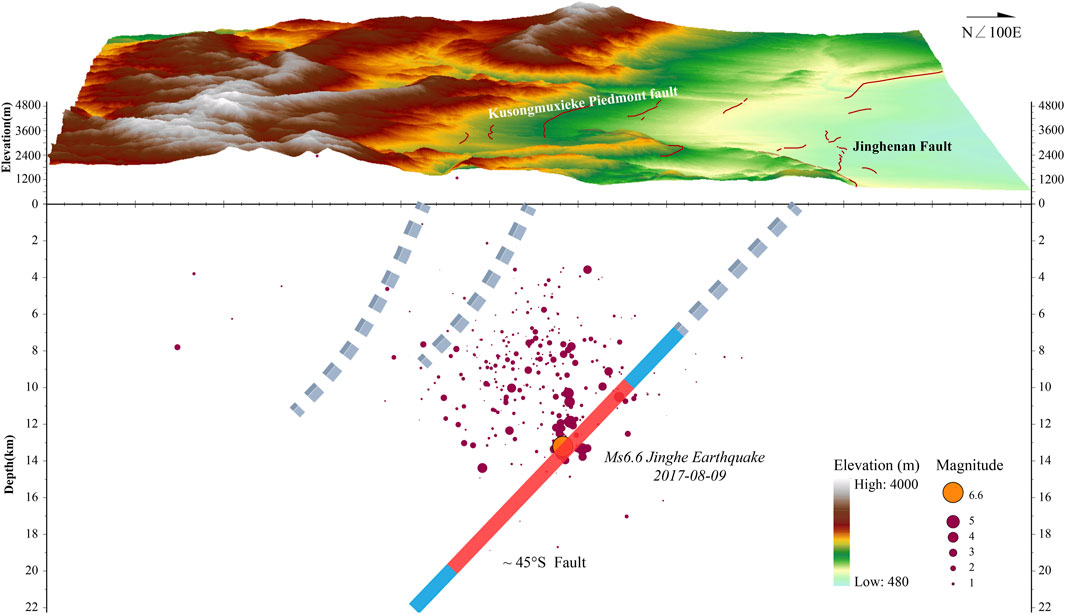
FIGURE 9. Schematic geometry model of the Jinghe earthquake. The thin red lines denote the active faults. The black arrow points the direction of northeastern 100°. The largest orange dot indicates the mainshock. The dark red dots indicate the aftershocks. The bold line indicates the fault slip model. The red part of the bold line is the main slip. The broken line is the speculative fault extension. The geoid up and geoid down are at the same scale specifically.
Some other studies have noted that the Jinghenan fault extends downward from the land surface with a dip of ∼46°S for the upper ramp bending to ∼42°S for the lower ramp (Hu et al., 2021). Since only the derived InSAR results not have sufficient resolution to distinguish changes in strike angle and dip angle within a certain range, the inversion above used fixed parameters. Although our study could not detect such a change of the dip angle, the relation between the Coulomb stress change and aftershocks suggests that there is stratification, which may indicate that there is a change of the crustal layer medium. Certainly, ascertaining whether there was a change in the geometric structure or the crustal medium requires more information, such as a seismic profile and geological trench.
The 2017 MS 6.6 Jinghe earthquake is a thrust earthquake without surface rupture. It occurred on fold-thrust belts to the north of the mountain front. The inversion slip distribution from InSAR deformation data, aftershocks, geological structure, and regional topography is used to construct a 3D reconstruction of the Jinghe earthquake. The characteristics of the fault slip distribution, aftershocks projection, and rupture process are based on a comprehensive analysis of the multidisciplinary data. Combined with a detailed geological investigation and existing geological knowledge, the position of the seismogenic fault is inferred. Furthermore, the Coulomb stress change is calculated. We use stress triggering theory to analyze the relation between the Coulomb stress change and aftershocks, particularly the MS 5.4 earthquake on October 16, 2018. This earthquake has a magnitude of less than 7 and lacked a surface rupture. Meanwhile, the seismogenic fault is an unknown fault. In addition, a strong aftershock occurred later. It is a complex seismic event, and similar seismic events occur frequently in active thrust systems pose hidden in mountain fronts (Diao et al., 2015; Li T. et al., 2016; He et al., 2016; Wang et al., 2019). The proposed integrated approach of our study may serve as a reference for evaluating seismogenic faults of similar blind thrust earthquakes and the relation between mainshock and aftershocks. The major conclusions of this study are as follows:
1. The maximum deformation area and the aftershocks are on the west side of the mainshock. They mutually confirm the characteristics of a unilateral rupture. The Jinghe earthquake unilaterally ruptured from east to west. The fracture gradually became deeper toward the southwest and downdip along the south-inclined plane to a depth of ∼20 km. The aftershocks are mainly in patches with low slip on the upper edge of the rupture. It can be seen that the combination of geodetic and seismological data can be used to reveal more details of fault geometry and rupture processes.
2. Based on the perspective of Coulomb stress change due to the mainshock, the aftershocks (M ≥ 2.0) within 1 month after the mainshock in a layer 10–14 km deep may have been triggered by the mainshock. The relation between the Coulomb stress change and aftershocks indicates stratification, probably due to the simple unified fault plane used and the change of the crustal layer medium. The stress transferred from the mainshock to the KPF leads to increase the seismic risk of the eastern section of the KPF fault in the future. The MS 5.4 earthquake is relatively far away from the mainshock and the magnitude (<0.01 MPa) is too small for it to have been directly triggered. It may be associated with transport of generated fluids through dehydration during aftershocks, or draining of trapped and high-pressure fluids in the area.
3. In the analysis of the multiple data sets and models, it is difficult to match the fault slip model with the spatial location and geometry of the KPF. The thrust Jinghenan fault north of the KPF is inferred to be the seismogenic fault of the MS 6.6 Jinghe earthquake.
The original contributions presented in the study are included in the article/Supplementary Material, further inquiries can be directed to the corresponding author.
WF was involved in all of the phases of this study. JR contributed to design, discuss and interpret the results. ZB conducted the InSAR data processing. JR and SH conducted the detailed geological investigation. WF wrote the manuscript with contributions from ZB, LZ, and SH. All authors reviewed the final article.
This study is supported by the National Key Research and Development Program of China (Grant No. 2017YFC1500502), the National Natural Science Foundation of China (NSFC Grant No. 41704094), and the Basic Scientific Funding of the Institute of Earthquake Forecasting, China Earthquake Administration (Grant No. 2018IEF0201).
The authors declare that the research was conducted in the absence of any commercial or financial relationships that could be construed as a potential conflict of interest.
All claims expressed in this article are solely those of the authors and do not necessarily represent those of their affiliated organizations, or those of the publisher, the editors and the reviewers. Any product that may be evaluated in this article, or claim that may be made by its manufacturer, is not guaranteed or endorsed by the publisher.
Sentinel-1 SAR data are copyrighted by the European Space Agency, and are additionally distributed by the Alaska Satellite Facility. Some figures were prepared using the public domain Generic Mapping Tools. Additional data related to this paper may be requested from the authors.
The Supplementary Material for this article can be found online at: https://www.frontiersin.org/articles/10.3389/feart.2021.734086/full#supplementary-material
Ali, S. T., Freed, A. M., Calais, E., Manaker, D. M., and McCann, W. R. (2008). Coulomb Stress Evolution in Northeastern Caribbean Over the Past 250 Years Due to Coseismic, Postseismic and Interseismic Deformation. Geophys. J. Int. 174, 904–918. doi:10.1111/j.1365-246X.2008.03634.x
Allen, M. B., Windley, B. F., Zhang, C., and Guo, J. (1993). Evolution of the Turfan Basin, Chinese Central Asia. Tectonics. 12, 889–896. doi:10.1029/93TC00598
Avouac, J. P., Tapponnier, P., Bai, M., You, H., and Wang, G. (1993). Active Thrusting and Folding Along the Northern Tien Shan and Late Cenozoic Rotation of the Tarim Relative to Dzungaria and Kazakhstan. J. Geophys. Res. 98, 6755–6804. doi:10.1029/92JB01963
Campbell, G. E., Walker, R. T., Abdrakhmatov, K., Schwenninger, J., Jackson, J., Elliott, J. R., et al. (2013). The Dzhungarian Fault: Late Quaternary Tectonics and Slip Rate of a Major Right-Lateral Strike-Slip Fault in the Northern Tien Shan Region. J. Geophys. Res. Solid Earth. 118, 5681–5698. doi:10.1002/jgrb.50367
Charreau, J., Saint-Carlier, D., Dominguez, S., Lavé, J., Blard, P.-H., Avouac, J.-P., et al. (2017). Denudation Outpaced by Crustal Thickening in the Eastern Tianshan. Earth Planet. Sci. Lett. 479, 179–191. doi:10.1016/j.epsl.2017.09.025
Chen, J., Shen, J., Li, J., Yang, J., Hu, W., Zhao, X., et al. (2007). Preliminary Study on New Active Characteristics of Kusongmuxieke Mountain Front Fault in the West Segment of North Tianshan. Nor. Seismol. J. 29, 335–340. (in Chinese). doi:10.3969/j.issn.1000-0844.2007.04.008
Costantini, M. (1998). A Novel Phase Unwrapping Method Based on Network Programming. IEEE Trans. Geosci. Remote Sensing. 36 (3), 813–821. doi:10.1109/36.673674
Deng, Q. D., Feng, X. Y., Zhang, P. Z., Xu, X. W., Yang, X. P., Peng, S. Z., et al. (2000). Active Tectonics of Tianshan. Beijing: Seismological Press. (in Chinese).
Diao, F., Walter, T. R., Motagh, M., Prats-Iraola, P., Wang, R., and Samsonov, S. V. (2015). The 2015 Gorkha Earthquake Investigated From Radar Satellites: Slip and Stress Modeling along the MHT. Front. Earth Sci. 3, 65. doi:10.3389/feart.2015.00065
Farr, T. G., Rosen, P. A., Caro, E., Crippen, R., Duren, R., Hensley, S., et al. (2007). The Shuttle Radar Topography Mission. Rev. Geophys. 45, 361. doi:10.1029/2005RG000183
Feng, W., Tian, Y., Zhang, Y., Samsonov, S., Almeida, R., and Liu, P. (2017). A Slip Gap of the 2016Mw 6.6 Muji, Xinjiang, China, Earthquake Inferred From Sentinel‐1 TOPS Interferometry. Seismological Res. Lett. 88, 1054–1064. doi:10.1785/0220170019
Goldstein, R. M., and Werner, C. L. (1998). Radar Interferogram Filtering for Geophysical Applications. Geophys. Res. Lett. 25, 4035–4038. doi:10.1029/1998GL900033
Gong, W., Zhang, Y., Li, T., Wen, S., Zhao, D., and Hou, L. (2019). Multi-Sensor Geodetic Observations and Modeling of the 2017 Mw 6.3 Jinghe Earthquake. Remote Sensing. 11, 2157. doi:10.3390/rs11182157
Guo, P., Han, Z., An, Y., Jiang, W., Mao, Z., and Feng, W. (2017). Activity of the Lenglongling Fault System and Seismotectonics of the 2016 M S6.4 Menyuan Earthquake. Sci. China Earth Sci. 60, 929–942. doi:10.1007/s11430-016-9007-2
He, P., Wang, Q., Ding, K., Wang, M., Qiao, X., Li, J., et al. (2016). Source Model of the 2015 M W 6.4 Pishan Earthquake Constrained by Interferometric Synthetic Aperture Radar and GPS: Insight into Blind Rupture in the Western Kunlun Shan. Geophys. Res. Lett. 43, 1511–1519. doi:10.1002/2015GL067140
He, X., Li, T., Wu, C., Zheng, W., and Zhang, P. (2020). Resolving the Rupture Directivity and Seismogenic Structure of the 2017 Jinghe Ms 6.6 Earthquake with Regional Seismic Waveforms. Chin. J. Geopys. 63, 1459–1471. (in Chinese). doi:10.6038/cjg2020N0309
Hu, Z., Li, T., Thompson Jobe, J., and Yang, X. (2021). Lower Portion Rupture of a Thrust Fault During the 2017 Mw 6.3 Jinghe Earthquake: Implications to Seismic Hazards in the Tian Shan Region. Seismol. Res. Lett. 92, 2134–2144. doi:10.1785/0220200295
Kulikova, G., and Krüger, F. (2017). Historical Seismogram Reproductions for the Source Parameters Determination of the 1902, Atushi (Kashgar) Earthquake. J. Seismol. 21, 1577–1597. doi:10.1007/s10950-017-9683-z
Li, T., Chen, J., Fang, L., Chen, Z., Thompson, J. A., and Jia, C. (2016a). The 2015Mw 6.4 Pishan Earthquake: Seismic Hazards of an Active Blind Wedge Thrust System at the Western Kunlun Range Front, Northwest Tibetan Plateau. Seismological Res. Lett. 87, 601–608. doi:10.1785/0220150205
Li, Y., Jiang, W., Zhang, J., and Luo, Y. (2016b). Space Geodetic Observations and Modeling of 2016 Mw 5.9 Menyuan Earthquake: Implications on Seismogenic Tectonic Motion. Remote Sensing. 8, 519. doi:10.3390/rs8060519
Liu, Q., Wen, X., and Shao, Z. (2016). Joint Inversion for Coseismic Slip of the 2013 MS7.0 Lushan Earthquake From GPS, Leveling and Strong Motion Observations. Chin. J. Geopys. 59, 2113–2125. (in Chinese). doi:10.6038/cjg20160617
Lu, R., He, D., Xu, X., Wang, X., Tan, X., and Wu, X. (2018). Seismotectonics of the 2016 M 6.2 Hutubi Earthquake: Implications for the 1906 M 7.7 Manas Earthquake in the Northern Tian Shan Belt, China. Seismol. Res. Lett. 89, 13–21. doi:10.1785/0220170123
Luo, H., Wang, T., Wei, S., Liao, M., and Gong, J. (2021). Deriving Centimeter-Level Coseismic Deformation and Fault Geometries of Small-To-Moderate Earthquakes From Time-Series Sentinel-1 SAR Images. Front. Earth Sci. 9, 636398. doi:10.3389/feart.2021.636398
Ma, K.-F., Chan, C. H., and Stein, R. S. (2005). Response of Seismicity to Coulomb Stress Triggers and Shadows of the 1999Mw= 7.6 Chi-Chi, Taiwan, Earthquake. J. Geophys. Res. 110, 05S19. doi:10.1029/2004JB003389
Miller, S. A. (2020). Aftershocks Are Fluid-Driven and Decay Rates Controlled by Permeability Dynamics. Nat. Commun. 11 (1), 1–11. doi:10.1038/s41467-020-19590-3
Molnar, P., and Tapponnier, P. (1975). Cenozoic Tectonics of Asia: Effects of a Continental Collision: Features of Recent continental Tectonics in Asia Can Be Interpreted as Results of the India-Eurasia Collision. Science. 189, 419–426. doi:10.1126/science.189.4201.419
Okada, Y. (1985). Surface Deformation Due to Shear and Tensile Faults in a Half-Space. Bull. Seismol. Soc. Am. 75, 1135–1154. doi:10.1785/bssa0750041135
Parsons, T., and Dreger, D. S. (2000). Static-stress Impact of the 1992 Landers Earthquake Sequence on Nucleation and Slip at the Site of the 1999 M=7.1 Hector Mine Earthquake, Southern California. Geophys. Res. Lett. 27, 1949–1952. doi:10.1029/1999GL011272
Remy, D., Bonvalot, S., Briole, P., and Murakami, M. (2003). Accurate Measurements of Tropospheric Effects in Volcanic Areas From SAR Interferometry Data: Application to Sakurajima Volcano (Japan). Earth Planet. Sci. Lett. 213, 299–310. doi:10.1016/S0012-821X(03)00331-5
Selander, J., Oskin, M., Ormukov, C., and Abdrakhmatov, K. (2012). Inherited Strike-Slip Faults as an Origin for Basement-Cored Uplifts: Example of the Kungey and Zailiskey Ranges, Northern Tian Shan. Tectonics. 31, a–n. doi:10.1029/2011TC003002
Stein, R. S., and Lisowski, M. (1983). The 1979 Homestead Valley Earthquake Sequence, California: Control of Aftershocks and Postseismic Deformation. J. Geophys. Res. 88, 6477–6490. doi:10.1029/JB088iB08p06477
Tapponnier, P., and Molnar, P. (1979). Active Faulting and Cenozoic Tectonics of the Tien Shan, Mongolia, and Baykal Regions. J. Geophys. Res. 84, 3425–3459. doi:10.1029/JB084iB07p03425
Wang, H., Liu-Zeng, J., Ng, A. H.-M., Ge, L., Javed, F., Long, F., et al. (2017). Sentinel-1 Observations of the 2016 Menyuan Earthquake: A Buried Reverse Event Linked to the Left-Lateral Haiyuan Fault. Int. J. Appl. Earth Observation Geoinformation. 61, 14–21. doi:10.1016/j.jag.2017.04.011
Wang, R., Lorenzo-Martín, F., and Roth, F. (2006). PSGRN/PSCMP-a New Code for Calculating Co- and Post-Seismic Deformation, Geoid and Gravity Changes Based on the Viscoelastic-Gravitational Dislocation Theory. Comput. Geosciences. 32, 527–541. doi:10.1016/j.cageo.2005.08.006
Wang, X., Xu, C., Wen, Y., Wang, S., Xu, G., Xiao, Z., et al. (2019). The 2016 Mw 6.0 Hutubi Earthquake: A Blind Thrust Event Along the Northern Tian Shan Front. J. Asian Earth Sci. 173 (APRa15), 79–87. doi:10.1016/j.jseaes.2019.01.011
Wen, Y., Xu, C., Liu, Y., and Jiang, G. (2016). Deformation and Source Parameters of the 2015 Mw 6.5 Earthquake in Pishan, Western China, From Sentinel-1A and ALOS-2 Data. Remote Sensing. 8, 134. doi:10.3390/rs8020134
Weston, J., Ferreira, A. M. G., and Funning, G. J. (2012). Systematic Comparisons of Earthquake Source Models Determined Using InSAR and Seismic Data. Tectonophysics. 532-535 (535), 61–81. doi:10.1016/j.tecto.2012.02.001
Windley, B. F., Allen, M. B., Zhang, C., Zhao, Z. Y., and Wang, G. R. (1990). Paleozoic Accretion and Cenozoic Redeformation of the Chinese TienShan Range, central Asia. Geology. 18, 128–131. doi:10.1130/0091-7613(1990)018<0128:PAACRO>2.3.CO;2
Wright, T. J., Lu, Z., and Wicks, C. (2003). Source Model for the Mw6.7, 23 October 2002, Nenana Mountain Earthquake (Alaska) From InSAR. Geophys. Res. Lett. 30, 1974. doi:10.1029/2003GL018014
Xu, X. W., Han, Z. J., and Yang, X. P. (2016). Seismotectonic Map in China and its Adjacent Regions. Beijing: Seismological Press. (in Chinese).
Yang, Y., Chen, Q., Xu, Q., Liu, G., and Hu, J.-C. (2019). Source Model and Coulomb Stress Change of the 2015 Mw 7.8 Gorkha Earthquake Determined From Improved Inversion of Geodetic Surface Deformation Observations. J. Geod. 93, 333–351. doi:10.1007/s00190-018-1164-9
Keywords: Jinghe earthquake, coseismic deformation, InSAR, Kusongmuxieke piedmont fault, Jinghenan fault
Citation: Feng W, Bai Z, Ren J, Huang S and Zhu L (2021) Coseismic Deformation and Speculative Seismogenic Fault of the 2017 MS 6.6 Jinghe Earthquake, China, Derived From Sentinel-1 Data. Front. Earth Sci. 9:734086. doi: 10.3389/feart.2021.734086
Received: 30 June 2021; Accepted: 01 September 2021;
Published: 15 September 2021.
Edited by:
Carolina Pagli, University of Pisa, ItalyReviewed by:
Alex Ng, Guangdong University of Technology, ChinaCopyright © 2021 Feng, Bai, Ren, Huang and Zhu. This is an open-access article distributed under the terms of the Creative Commons Attribution License (CC BY). The use, distribution or reproduction in other forums is permitted, provided the original author(s) and the copyright owner(s) are credited and that the original publication in this journal is cited, in accordance with accepted academic practice. No use, distribution or reproduction is permitted which does not comply with these terms.
*Correspondence: Jinwei Ren, cmVuQHNlaXMuYWMuY24=
Disclaimer: All claims expressed in this article are solely those of the authors and do not necessarily represent those of their affiliated organizations, or those of the publisher, the editors and the reviewers. Any product that may be evaluated in this article or claim that may be made by its manufacturer is not guaranteed or endorsed by the publisher.
Research integrity at Frontiers
Learn more about the work of our research integrity team to safeguard the quality of each article we publish.