 Xuanyi Chen
 Xiaofei Jing1*
 Yulong Chen
95% of researchers rate our articles as excellent or good
Learn more about the work of our research integrity team to safeguard the quality of each article we publish.
Find out more
ORIGINAL RESEARCH article
Front. Earth Sci. , 24 December 2021
Sec. Geohazards and Georisks
Volume 9 - 2021 | https://doi.org/10.3389/feart.2021.726336
This article is part of the Research Topic Mine Engineering Geological Disaster Forecasting, Monitoring, and Prevention View all 27 articles
The risk of tailings dam-break disaster is dependent on the type of slurry and its flow characteristics. The flow characteristics of slurry surging from tailings dams collapse are directly influenced by grain size, breach width, slurry concentration, and surface roughness of the gully. Among these parameters, slurry concentration plays the most critical role, but there are few studies on it. This paper focuses on the flow characteristics of slurry with different concentrations, and a series of flume experiments were carried out to obtain the flow characteristics of inundated height, impact force, and velocity in 30%, 40%, 50%, and 60% concentrations. The study confirms that the concentration of slurry has a significant influence on the flow characteristics. Through the experimental study, it is observed that, with the decreasing of slurry concentration, the impact force and velocity of slurry increased in varying degrees; on the contrary, the flow height elevated with the slurry concentration decreasing. The main reason is that the higher the slurry concentration, the higher the static yield stress and viscosity—in varying degrees. The results can provide a detailed understanding of the slurry concentration influence on the flow characteristics, which guides the evacuation time and height downstream.
Tailings are generated from mineral processing operations. The release of tailings to an open environment causes serious safety and environmental issues. The tailings are generally retained in the tailings storage facility (TSF) for reuse purposes. Once the TSF breaks, it causes flooding, which pollutes the environment; moreover, the slurry causes serious loss of life and property downstream.
TSF is a unique industrial structure and also a dangerous source of artificial debris flow with high potential energy (Tang et al., 2012; Detzel, 2016). In recent years, accidents of TSF caused by heavy rainfall or earthquakes have occurred frequently, resulting in loss of lives and property (Moxon, 1999; Jing et al., 2019). Therefore, it is necessary to conduct an in-depth study to improve the prevention and mitigation of TSF disasters. Previous research on tailings dams mainly focuses on environmental pollution, stability analysis, and the mechanical properties of tailings (Nelson, 1977; Finn, 1993; Rico et al., 2008; Yu et al., 2014; Bhuiyan, 2016). Wijewickreme and Lu study the mechanical properties of tailings through indoor geotechnical tests (Wijewickreme et al., 2005; Lu et al., 2019). Proskin analyzes the stability of the tailings dam under a freeze–thaw condition by examining the influence of the freeze–thaw cycle on the permeability of fine tailings (Proskin et al., 2010). Li, Dong, and Yu analyze the stability of the dam body based on the fluid–solid coupling theory and a numerical simulation analysis method (Dong et al., 2011; Li et al., 2012; Yu et al., 2013). They find that the burial depth of the saturation line is too shallow (Figure 1), which is the main reason for the local instability of the dam. Jing (Jing et al., 2019) studies the overtopping failure process of a reinforced tailings dam using a small-scale model test, which finds that the reinforcement layers could improve the anti-erosion capability of the tailings dam. However, these studies are limited to the dam body and do not take into account the flow characteristics of slurry after a dam break. Once a tailings dam breaks, the slurry causes catastrophic damage downstream.
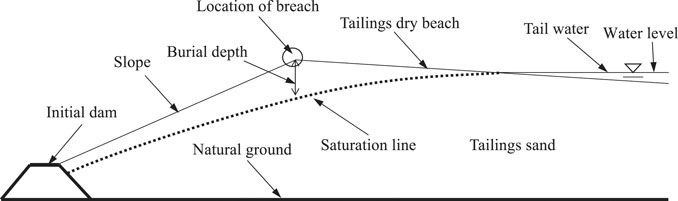
FIGURE 1. Cross-section diagram of tailings dam.
For this reason, Yin, Zhou, Jing, and Wang study the slurry resulting from a dam break with different dam heights and tailings particle sizes (Yin et al., 2010; Jing et al., 2012; Zhou et al., 2013; Wang et al., 2018). They analyze the disaster chain of a dam break according to disaster system theory and describe the evolution process of a dam-break disaster. Jeyapalan (Jeyapalan et al., 2000) and Kwak (Kwak et al., 2005) study the flow characteristics of slurry resulting from a tailings dam break through a series of flume tests and predicted the possible impact range. Jing (Jing et al., 2019) studies the effect of particle size on the flow characteristics of dam-break fluid with laboratory model tests, which observed that the flow height decreased with the particle size increasing, and the impact force and velocity decreased with the particle size decreasing. The flow characteristics of slurry are similar to those of natural debris flows. The particle size of debris flow is widely distributed, ranging from a few millimeters of clay to a few meters of stone as shown in Figure 2A (Bu et al., 2017). However, the particle size of slurry is about 0.1 mm with a uniform material source as shown in Figure 2B. The flow characteristics of slurry and debris flow are similar; therefore, the research results of a natural debris flow can be used as a reference to analyze tailings dam-break fluid. For natural debris flows, Chen et al. (2021), and Jeong (2010) study the impact characteristics of debris flows using different particle sizes, slurry viscosities, and solid-phase ratios with similar model tests (Chen et al., 2021; Jeong, 2010; He et al., 2014). It is believed that the average impact force of fluid increases with the slurry viscosity, solid-phase ratio, and particle size increasing.
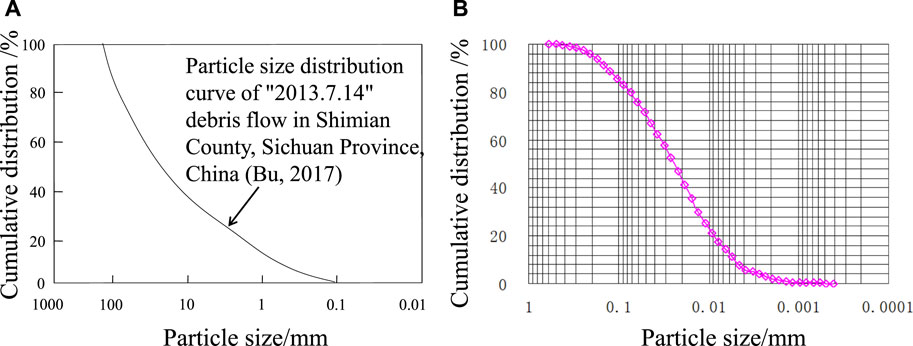
FIGURE 2. The grain-size distribution curve of debris flow and slurry, (A) debris flow, (B) slurry.
The flow characteristics of slurry surging from tailings dams collapse are directly influenced by grain size, breach width, slurry concentration, and surface roughness of the gully. Among these parameters, slurry concentration plays the most critical role, but there are few studies on it. To explore the flow characteristics of slurry with different concentrations, a detailed study is undertaken. The Yangtianqing tailings pond (in Yunnan Province, China) is used for this purpose. The location map of the Yangtianqing tailings pond is shown in Figure 3. A scaled-down version of the pond is developed in the laboratory for the dam-break tests. The tests are carried out for a range of slurry concentrations using an experimental simulation test device for a dam break (SSTDDB). The flow characteristics of slurry with different concentrations resulting from a tailings dam break through a series of flume tests predicted the possible impact range. The results provide a detailed understanding of the slurry concentration influence on the flow characteristic, which guides the evacuation time and height downstream.
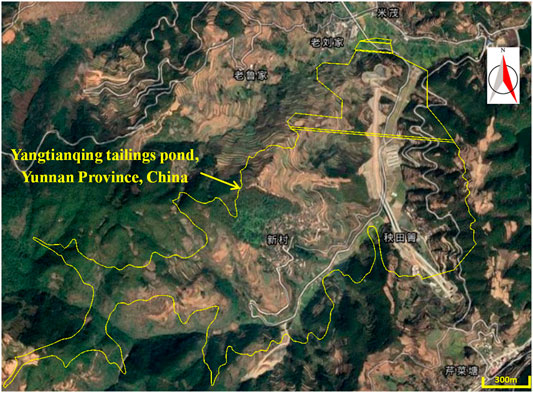
FIGURE 3. Location map of Yangtianqing tailings pond.
Understanding and analyzing the flow characteristics of slurry are the focus of the present work; a few terms which are used frequently in the paper are defined. These terms set the context for the readers:
TSF: tailing storage facilities.
Slurry: Mass concentration of tailings, which includes fluid along with sediment.
Tailings: Products of the mineral after ore-dressing practice; its useful mineral content is very low, so it cannot be used in production.
Flow height: The liquid level height from the bottom of the flume as shown in Figure 8.
Beneficiation technology: The beneficiation technology is the same as mineral processing technology. It refers to the separation of useful minerals from ores by mineral processing equipment based on the difference of physical and chemical properties.
Slope: The slope with a certain angle as shown in Figure 4A.
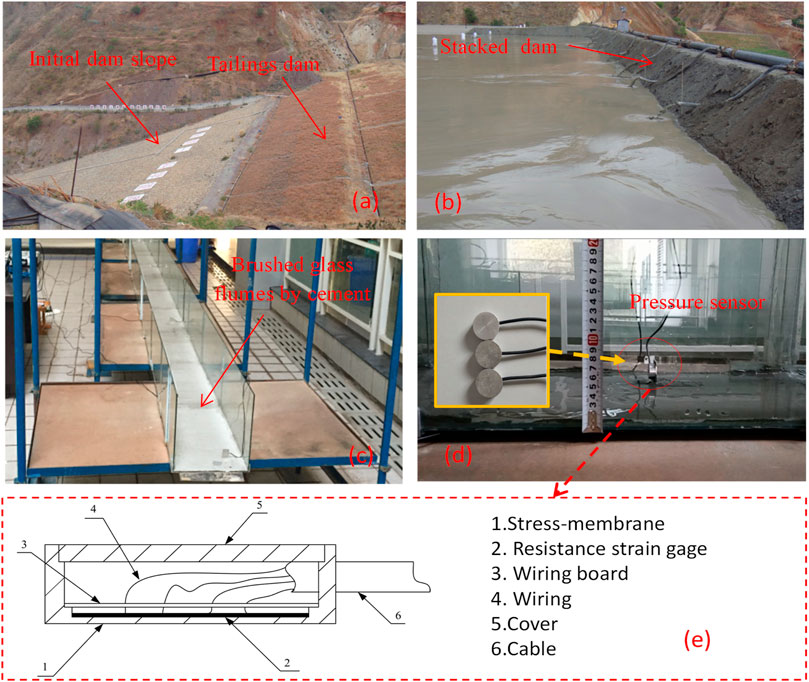
FIGURE 4. Physical drawing of terms and sensor installation, (A) Initial dam slope, (B) Stacked tailings dam, (C) Gully, (D) Sensor and measuring ruler, (E) Detail drawing of the pressure sensor.
Tailings Dam: The structure of intercepting tailwater in the tailings pond. As shown in Figure 4B, the dam consists of two slopes and one platform.
Gully: The flow pathway of tailings is brushed glass flumes by cement as shown in Figure 4C; the sensor in the gully is shown in Figure 4D, and the detailed drawing of the pressure sensor is shown in Figure 4E.
The experimental materials are tailings from the Yangtianqing tailings pond in Yunnan Province, China. We randomly divided the tailings sand into three parts and carried out particle size analysis and triaxial tests. We obtained the particle size distribution of tailings by the Microtrac S3500 tri-laser particle size analyzer (Measurement range: 0.02–2,800 μm, Microtrac Inc., United States) as shown in Figure 2B. Cumulative distribution refers to the proportion smaller than a certain particle size. The physical and mechanical properties of tailings are obtained by a triaxial test as shown in Table 1.

TABLE 1. Physical and mechanical index of tailings.
In China, more than 80% of tailings impoundments are built using the upstream method with a thickening of 20%–30% because it is considered to be more economic (Zheng, 2017). High-density thickened tailings (HDTT) discharge can save a lot of water resources, reduce environmental pollution, and improve the utilization of the reservoir. Therefore, more and more HDTT discharge was considered in recent years. The TSF design considered discharge of tailings at 62% solids of Sierra Gorda Sociedad Contractual Minera (SCM), Chile (Engels et al., 2018). So, the four common types of slurry with mass concentrations of 30%, 40%, 50%, and 60% were used for experimental research. The test conditions are shown in Table 2.
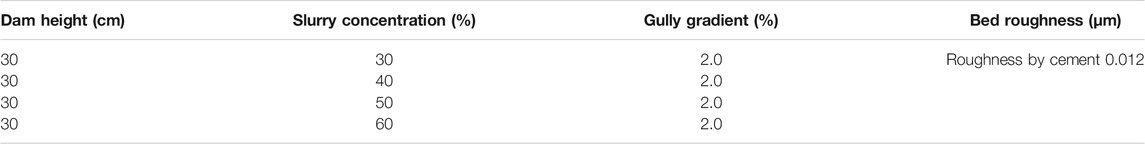
TABLE 2. The test conditions.
Based on the geometric size of the Yangtianqing tailings pond, an SSTDDB is developed in the ratio of 1:400. The kinematic similarity ratio is 1:20. The experimental apparatus (SSTDDB) consists of a reservoir area, downstream gully, slurry mixing system, gate (simulated dam), measurement device for impact force and velocity, flow monitoring system, and slope adjustment device. The panorama of the experimental apparatus (SSTDDB) is demonstrated in Figure 5A. The impact force–measuring device is composed of the pressure sensor (Type: BX-2, Range: 0–10kPa ± 0.5%F.S, Dandong city electronic instrument factory, Liaoning, China), sensor support plate, dynamic strain gauge, and computer as illustrated in Figure 5B. Figure 6 shows the schematic of the gate device and gate lifting device. The highest sampling frequency of the dynamic strain gauge is 1 kHz, and the sampling frequency is 5 Hz. The pressure sensor is fixed on the sensor support plate, and the height from the bottom of the gully is 2 cm. The pressure sensor and measuring rulers are installed at 2 and 4 m away from the dam. To thoroughly explore the flow characteristics of slurry in the downstream gully, the gully is constructed of transparent toughened glass.
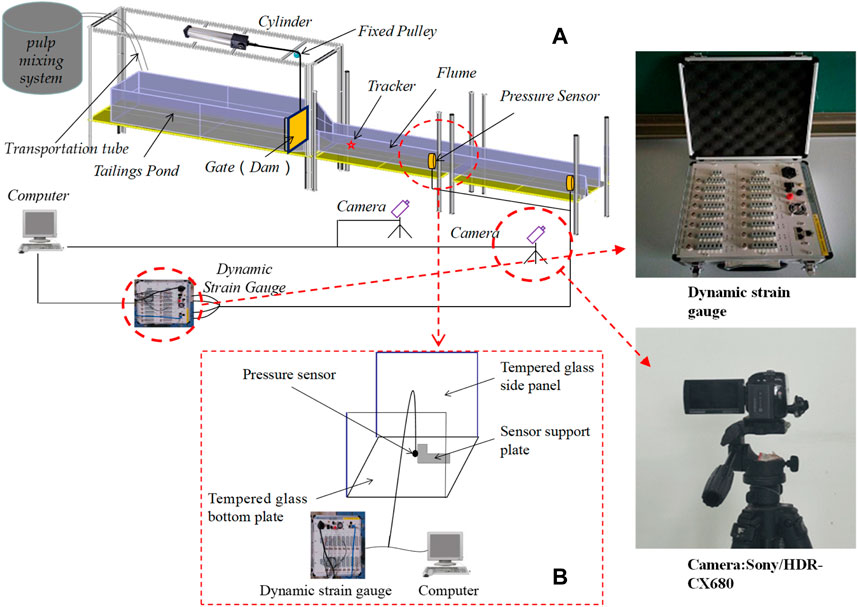
FIGURE 5. Simulation test device for dam-break (SSTDDB).
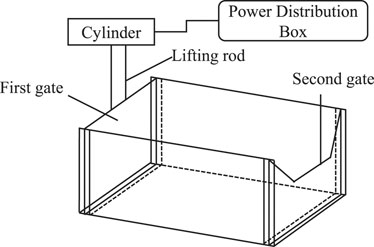
FIGURE 6. The schematic of the gate device and gate-lifting device.
The internal dimension of the tailings pond is 200 × 60 × 50 cm (length × width × height). The dimension of the gully is 400 × 30 × 40 cm (length × width × height). According to the actual topography of the Yangtianjing tailings dam in China, the slope ratio of the gully is set to be 2%, the floor is roughened with cement, and the bed roughness of the gully is calculated by Manning’s formula (i.e.,
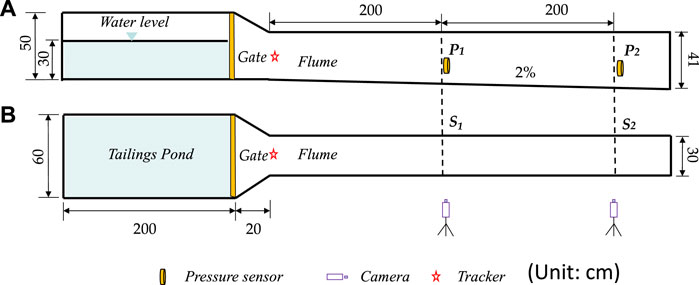
FIGURE 7. Monitoring points distribution, (A) lateral view, (B) top view.
(1) After the slope ratio of the gully is set to be 2%, the pressure sensor, dynamic strain gauge, and computer are connected and the impact force–measuring device is benchmarked so that the data is zero at the start. Moreover, the digital camera is placed in the research section (S1 = 2 m, S2 = 4 m).
(2) Then, the slurry is prepared by the slurry mixing system to concentrations of 30%, 40%, 50%, and 60%. The slurry is conveyed to the tailings pond through the conveying pipeline. At the same time, the slurry in the area is stirred to create a uniform suspension. The initial filling height in the tailings pond is 30 cm as shown in Figure 7. After the slurry surface is stable, the gate is completely opened in 0.5 s by the cylinder to simulate the instantaneous dam break of the tailings pond.
(3) The impact force, flow height, and velocity (using a displacement tracer method) of slurry are collected by pressure sensors, high-resolution cameras, computers, and measuring rulers.
(4) Each concentration test was performed three times, and the average value was taken as the data analysis value. The scale recommended by previous research (Jing, 2011) (flow height, impact force and time, 1:400, 1:557.3, and 1:20, respectively) is used for the flow height, impact force, and the time to reach the peak velocity.
The whole experimental procedure is shown in Figure 8.
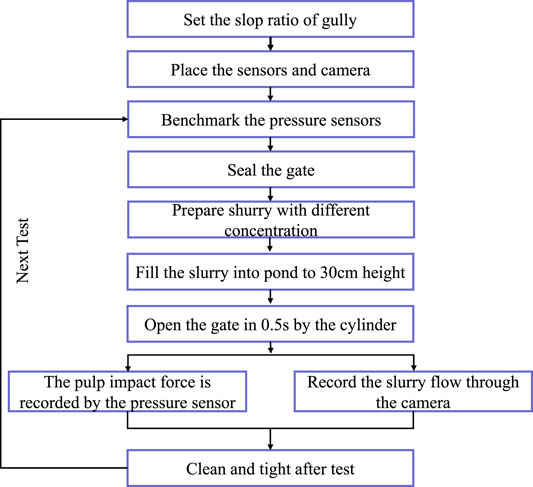
FIGURE 8. Experimental procedures of tailings dam-break test.
The flow height of the slurry at sections S1 and S2 were recorded by two high-resolution cameras placed S1 = 2 m and S2 = 4 m away from the dam toe. The flow pattern diagram of slurry with different concentrations after 4.0 s at section S1 is shown in Figure 9. It shows that the concentration of slurry has a significant effect on the flow pattern. The slurry is fluctuant at S1 = 2 m and S2 = 4 m; the flow pattern of slurry becomes flattered with the slurry concentration decreasing, which indicates that the flow pattern of slurry is a nonconstant flow. The flow height is monitored by measuring rulers and high-resolution cameras (Sony/HDR-CX680, Camera resolution: 1920 × 1080/50p, Sony (China) Co., Ltd., Beijing, China) in real time. The flow height with different concentrations at sections S1 and S2 is illustrated in Figure 10.
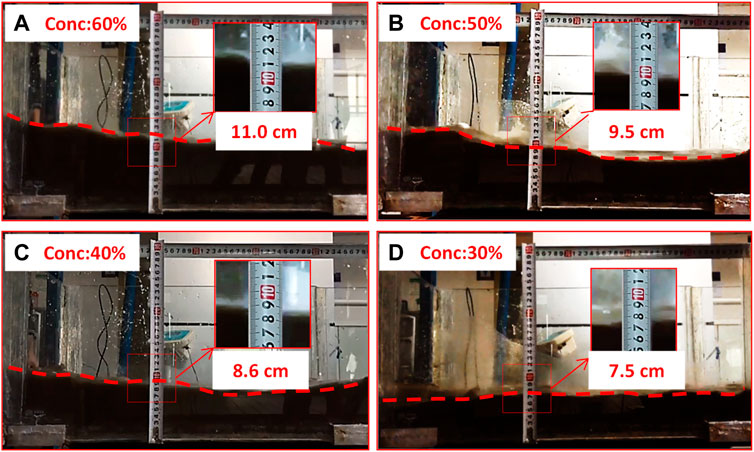
FIGURE 9. Flow pattern of slurry with different concentration at section S1 (2.0 m). (A) 60%, (B) 50%, (C) 40%, (D) 30%. (t = 4.0 s).
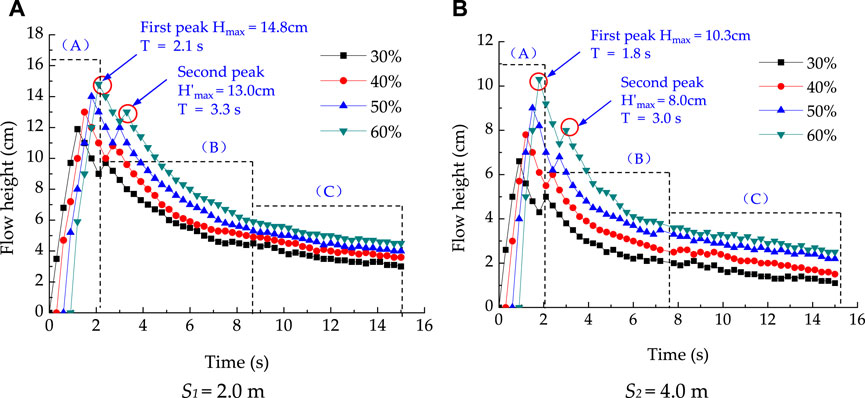
FIGURE 10. Flow height of slurry at sections S1 (2.0 m) and S2 (4.0 m) and away from the dam toe). Stage (A) rapid increase; Stage (B) rapid reduction; Stage (C) slow decline.
By analyzing the submerged peak of section S1, it is found that the curve of flow height includes two peaks; the first peak is 11.9, 13, 14, and 14.8 cm, and the second peak is 9.7, 10.8, 12, and 13 cm for slurry concentrations of 30%, 40%, 50%, and 60%, respectively. It also shows a submerged peak increase with a slurry concentration in the S1 and S2 sections. The main reason is the viscosity of slurry increases with increasing concentrations of slurry, which can enhance the friction force between slurry and gully; the flow height increased significantly at the S1 and S2 sections.
When the slurry concentration is 60%, in section S1, the first peak reaches 14.8 cm at 2.1 s, and the second peak reaches 13 cm at 3.3 s. As M. Rico (M Rico., 2008) says, the slurry resulting from dam break forms a lower viscosity “water stream” at the front and a higher viscosity “slurry” at the back. The water stream moves faster because of its low viscosity. Therefore, the first peak is formed by a water stream with lower viscosity, and the second peak is formed by slurry with higher viscosity. The flow of slurry in any section can be divided into three stages: stage (A) rapid increase; stage (B) rapid reduction; stage (C) slow decline. The graph of flow height presents a triangular shape, and the conclusion is consistent with that in reference (Xie, 1992). It can also be observed from Figure 10 that the slurry with higher concentration can take less time to reach the same section. It means the evacuation time downstream can increase.
The impact force of the slurry is obtained by pressure sensors at sections S1 and S2, respectively, and is shown in Figure 11 (the coordinate origin is the time when the slurry reaches S1 and S2). As illustrated in Figure 11, there are two peaks in the graph of impact force. In section S1, the graph shows that the first peak reaches 6.5 kPa at 1.0 s, and the second peak reaches 5.7 kPa at 2.1 s when the slurry concentration is 30%. The main reason is that, when the tailings dam collapses, the water stream with a lower concentration is the first to flow, followed by the slurry with a higher concentration. After the slurry reaches S1, the water stream first hits the pressure sensor. Because the concentration of the water stream is lower, its velocity is higher, so it produces the largest impact force peak, and then the first peak is formed. As the water stream flows away, the impact force gradually decreases, the slurry with its higher concentration hits the pressure sensor at this time. Because the sand in the slurry generates additional force on the sensor, the impact force increases, and the second peak is formed. The overall trend of the impact force graph is similar with different slurry concentrations. The impact force graph can be divided into three stages: stage (A), rapid increase; stage (B), rapid reduction; stage (C), slow decline.
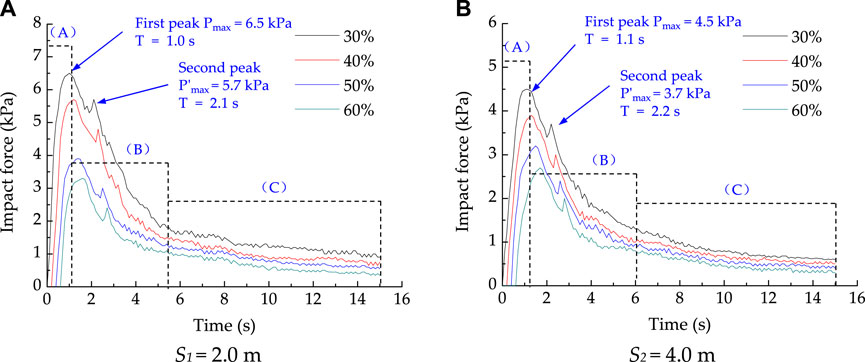
FIGURE 11. The impact force of slurry at sections S1 and S2 (2.0 and 4.0 m away from the dam toe). Stage (A) rapid increase stage; Stage (B) rapid reduction stage; Stage (C) slow reduction stage.
As depicted in Figure 11A, the first peak value of impact force produced by slurry with 30%, 40%, 50%, and 60% concentration at sections S1 is 6.5 kPa (equivalent to 3.62 MPa on site), 5.7 kPa (equal to 3.18 MPa on site), 3.9 kPa (equal to 2.17 MPa on site), and 3.3 kPa (equivalent to 1.84 MPa on site), respectively. It shows that the impact force of slurry decreases with the concentration increasing. The main reason is the viscosity of slurry increases with increasing the concentration of slurry, which can decrease the flow velocity. According to the relationship between flow velocity and impact force (Xie, 1992), it is observed that impact force is positively correlated with fluid velocity and also with the size of solid substances carried in the fluid. Therefore, liquid concentration is closely related to the impact force on buildings downstream. Figure 11 demonstrates that all the impact force curves reach the peak value within 2.0 s (equivalent to 40.0 s on site) with a rapid increase in front and a gentle decrease in back. This demonstrates that the growth rate of the impact force is much faster than the decrease rate.
The displacement tracer points are used to record the velocity of the slurry. The tracker and camera record the velocity at two sections S1 and S2. The front velocities at different monitoring points are explained in Table 3. The flow velocity curves of slurry with different concentrations at sections S1 and S2 are shown in Figure 12. (The coordinate origin is the front time of slurry reaching sections S1 and S2.) It is observed that the front velocities of slurry with 30%, 40%, 50%, and 60% slurry concentrations at section S1 are 3.61, 3.3, 3.0, and 2.77 m/s, respectively. This demonstrates that the velocity of the slurry decreases with the increasing concentration. The higher the concentration, the longer time it takes for the slurry to reach downstream. The time for 60% concentration to reach section S1 is 0.5 s longer than the 30% concentration, which is equivalent to an increase of 10 s at the actual site. It can extend the evacuation time in the event of a dam-break accident.
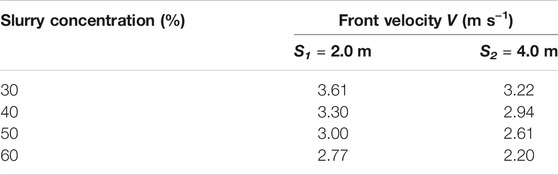
TABLE 3. Front velocity at different sections for the four different slurry concentrations.
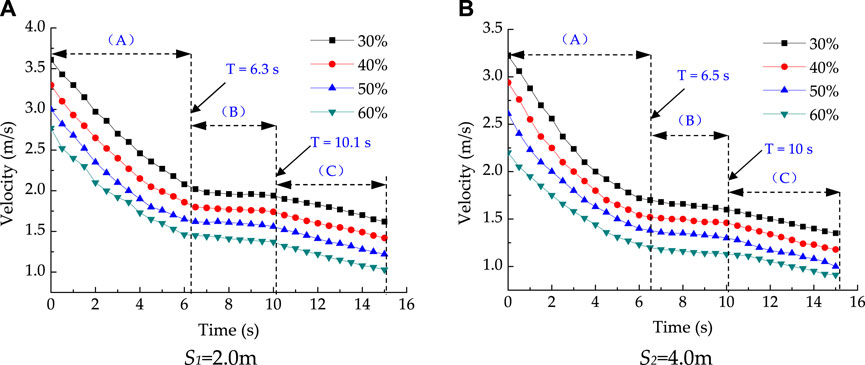
FIGURE 12. Velocity curve of slurry at section S1 and S2 (2.0 and 4.0 m away from the dam toe). The coordinate origin is the initial time of slurry reaching sections S1 and S2. Stage (A) Rapid reduction stage; Stage (B) Stable stage; Stage (C) Slow reduction stage.
Figure 12 also shows that the instantaneous velocity of slurry decreases with increasing the concentration. The reason is that the concentration can increase the viscosity of the slurry, which makes the slurry consume more energy in the flow process. The velocity curve of the slurry resulting from a dam break can be divided into three stages: stage (A) rapid reduction; stage (B) constant; stage (C) slow decline. Stage (A), rapid reduction in the leading section, is the initial stage when the dam break slurry reaches the characteristic sections. When the slurry reaches downstream, the speed at the front of the slurry is higher, and then it decreases rapidly, lasting about 6.0 s. For stage (B), the stable stage (dragon body), the velocity remains at the stable stage relatively. However, the average duration of velocity is distinctive respectively in different sections. In stage (C), slow reduction (dragon tail), as the flow of slurry from upstream decreases gradually and the energy of slurry from the dragon tail decreases slowly, the velocity of slurry decreases steadily until all slurry flows out of the gully.
TSF is a unique processing subsystem of a mining and mineral processing facility. The slurry resulting from a dam break is hazardous and may cause serious safety and environmental impact. The slurry concentration determines the viscosity and affects the energy conversion of the slurry in the downstream movement. There are thousands of TSFs in China, and the deposit methods of each tailings pond is different; the concentration of tailing disposal is also different. Therefore, the study of disaster damage from different slurry concentrations is significant. Then, the results can provide a detailed understanding of the flow characteristic by slurry concentration influence, which guides the evacuation time and height downstream.
Through the experimental study, it is observed that, with the decrease of slurry concentration, the impact force and velocity of slurry increase in varying degrees; on the contrary, the flow height is elevated with the slurry concentration decreasing. The main reason is that the higher the slurry concentration, the higher the static yield stress and viscosity are in varying degrees. The reduction of static yield stress and viscosity indicate that the resistance of slurry during movement decreases, and the slurry moves farther. According to the formula ΔH = τ0/γC∙ I (where H is the adhesive thickness, τ0 is the static yield stress of the slurry, γC is the bulk density of the slurry, and I is the longitudinal slope of the groove) (Jing, 2011), it is known that the flow height of the slurry (H) decreases with the decreasing of the static yield stress (τ0). As the static yield stress of the slurry has a nonlinear relationship with the concentration, it can be inferred that the flow height of the slurry varies nonlinearly with the change of concentration, which is also confirmed by the test results.
From the point of energy, before the tailings dam breaks, the slurry has a certain gravitational potential energy. The total energy of the slurry resulting from a dam break is derived from the total gravitational potential energy. The gravitational potential energy of the slurry is gradually transformed into kinetic energy after the dam break. As the concentration decreases, the viscosity of the slurry decreases gradually, making the substances in the slurry loose instead of gathering together, thus reducing the interaction between the materials, so the flow rate of slurry increases with the slurry concentration decreasing. A faster velocity leads to a tremendous conversion rate from potential to kinetic energy after the dam break, making the retained potential energy smaller in the limited space, and a lower flow height is generated downstream. According to research (Wu et al., 1990), the impact force of the flowing sand is proportional to the square of the velocity. Therefore, the impact force of slurry resulting from a dam break increases with the slurry concentration decreasing.
The experimental study finds that, at section S1, the impact range of the 30% concentration slurry was 0–6.5 kPa, whereas that of 60% concentration slurry was 0–3.3 kPa as shown in Figure 11. This shows that the fluctuation of the impact force of the low concentration is more intense. This phenomenon is consistent with Liu’s research on debris flow (Liu et al., 2019). As Liu says, when low-density debris flow interacts with obstacles, the maximum impact force mainly comes from the impact of particles in the fluid and obstacles, which exist throughout the impact process. When high-density debris flow interacts with obstacles, the maximum impact force appears when they just touch the obstacles, and the main contributor of the impact force is the high-viscosity “viscous body” composed of particles and water. Moreover, the fluid with a higher viscosity has a smaller flow velocity (Liu et al., 2019), so the fluctuation of the impact force of the low-concentration slurry is more intense.
After the tailings dam breaks, the slurry causes huge damage downstream; therefore, we can build a diversion channel or other structures downstream and build energy dissipation structures in the diversion channel, thereby reducing the damage degree of fluid (Kim et al., 2018). For example, Chen (Chen et al., 2015) built an energy dissipation structure by digging pits in the channel. The energy dissipation structure can reduce the debris flow velocity to the original 0.43 to 0.63 times. The establishment of a flexible net barrier is also a good energy dissipation measure. After the fluid impacts the flexible net barriers, its energy is greatly reduced. The degree of reduction depends on both the material textures and mesh sizes (Huo et al., 2018; Yuan et al., 2019). Therefore, it is suggested to build a flexible net barrier downstream or dig pits in the diversion channel to reduce the damage degree of dam break.
(1) The curve of flow height and impact force of slurry downstream includes two peaks. The first peak is formed by the front water stream with lower viscosity, and the second peak is formed by slurry with a higher viscosity. At section S1 (2.0 m from dam), the peak heights and impact force are 11.9, 13, 14, 14.8 cm and 6.5, 5.7, 3.9, and 3.3 kPa for slurry concentrations of 30%, 40%, 50%, and 60%, respectively. It is observed that the front velocities of slurry with 30%, 40%, 50%, and 60% concentrations at section S1 are 3.61, 3.3, 3.0, and 2.77 m/s.
(2) The curve of flow height and impact force can be divided into three stages: rapid increase, rapid decline, and slow decline. The velocity curve can also be divided into three stages: rapid decline, stable, and slow decline.
(3) Through the experimental study, it is observed that, with the decreasing of slurry concentration, the impact force and velocity of slurry increased in varying degrees; on the contrary, the flow height elevated with the slurry concentration decreasing. The main reason is that the higher the slurry concentration, the higher the static yield stress and viscosity—in varying degrees.
The results provide a detailed understanding of the slurry concentration influence on the flow characteristics, which guides the evacuation time and height downstream.
The original contributions presented in the study are included in the article/supplementary material, further inquiries can be directed to the corresponding authors.
Conceptualization, XJ; Methodology, CP; Validation, YC, XX, and WW; Writing—Original Draft Preparation, XJ and CP; Writing—Review and Editing, XJ.
This research is funded by the National Natural Science Foundation of China (Grants Nos. 51974051, 51804051, and 51804222), the Natural Science Foundation project of Chongqing Science and Technology Commission (No. cstc2018jcyjAX0231), the Chongqing Special Postdoctoral Science Foundation (Grant No. XmT2018017), the Post-Funded Projects of Chongqing University of Science and Technology (No. ckhqzz2008005), the Key Technological Projects for Prevention and Control of Major Accidents in Safety Production (Chongqing-0009-2018AQ, Chongqing-0006-2018AQ, Chongqing-0004-2017AQ). the Self-made Equipment Foundation of Chongqing University of Science and Technology (No. ZZSB2019013), the Scientific and Technological Research Program of Chongqing Municipal Education Commission (KJZD-K201901501).
WW was employed by Chongqing GaoXin Engineering Survey and Design Institute Ltd., Co.
The remaining authors declare that the research was conducted in the absence of any commercial or financial relationships that could be construed as a potential conflict of interest.
The handling editor declared a shared affiliation with one of the authors (WW) at time of review.
All claims expressed in this article are solely those of the authors and do not necessarily represent those of their affiliated organizations, or those of the publisher, the editors and the reviewers. Any product that may be evaluated in this article, or claim that may be made by its manufacturer, is not guaranteed or endorsed by the publisher.
Bu, X., Tang, C., and Qu, Y. P. (2017). Grain-size Distribution and Structure Dimension of “7. 4” Giant Debris Flow Deposition in Shimian County, Sichuan Province, China. J. Disaster Prev. Mitigation Eng. 37 (6), 1016–1022.
Chen, Y., Zuo, J., Liu, D., Li, Y., and Wang, Z., (2021). Experimental and Numerical Study of Coal-Rock Bimaterial Composite Bodies Under Triaxial Compression. Int. J. Coal Sci. Technol. 8, 908–924. doi:10.1007/s40789-021-00409-5
Chen, J., Chen, X., Li, Y., and Wang, F. (2015). An Experimental Study of Dilute Debris Flow Characteristics in a Drainage Channel with an Energy Dissipation Structure. Eng. Geology. 193, 224–230. doi:10.1016/j.enggeo.2015.05.004
Dong, L., Zhao, G., and Gong, F. (2011). Interval Analysis Model of Tailings Dam Seismic Stability and its Application, 42. Journal of Central South University, 164–169.
Engels, J., Gonzalez, H., Aedo, G., and McPhail, G. I. (2018). “Implementation of Spigot Discharge Systems for High-Density Tailings at Sierra Gorda Sociedad Contractual Minera, Chile,” in Proceedings of the 21st International Seminar on Paste and Thickened Tailings. Editors R. J. Jewell, and A. B. Fourie (Perth: Australian Centre for Geomechanics), 389–400. doi:10.36487/acg_rep/1805_32_engels
Finn, W. (1993). Seismic Stabilization of St. Joe State Park Tailings Dam. Proc. Geotechnical Pract. Dam Rehabil. , 25–28.
He, X., Tang, H., and Chen, H. (2014). Experimental Study on Impacting Characteristics of Debris Flow Considering Different Slurry Viscosities, Solid-phase Ratios, and Grain Diameters. Chin. J. Geotechnical Eng. 36 (5), 977–982. doi:10.11779/CJGE201405024
Huo, M., Zhou, J.-w., Yang, X.-g., and Zhou, H.-w. (2018). Dynamical Evolution Properties of Debris Flows Controlled by Different Mesh-Sized Flexible Net Barriers. Arab J. Geosci. 11, 465–477. doi:10.1007/s12517-018-3786-x
Jeong, S. W. (2010). Grain Size Dependent Rheology on the Mobility of Debris Flows. Geosci. J. 14, 359–369. doi:10.1007/s12303-010-0036-y
Jeyapalan, J. K., Duncan, J. M., and Seed, H. B. (2000). Investigation of Flow Failures of Tailings Dams. J. geotechnical Eng. 109, 172–189.
Jing, X., Chen, Y., Pan, C., Yin, T., Wang, W., and Fan, X. (2019). Erosion Failure of a Soil Slope by Heavy Rain: Laboratory Investigation and Modified GA Model of Soil Slope Failure. Ijerph 16 (6), 1075–1085. doi:10.3390/ijerph16061075
Jing, X., Chen, Y., Xie, D., Williams, D. J., Wu, S., Wang, W., et al. (2019). The Effect of Grain Size on the Hydrodynamics of Mudflow Surge from a Tailings Dam-Break. Appl. Sci. 9 (12), 2474. doi:10.3390/app9122474
Jing, X. F. (2011). Study on Sediment Flow Characteristics and Disaster Prevention of Tailings Dam Break. Chongqing: Chongqing University.
Jing, X., Yin, G., and Wei, Z. (2012). Study of Tailings Dam-Break Surges with Floating Pulp in the Model experiment in Different Collapse gates. Rock Soil Mech. 33, 745–752. doi:10.1007/s11783-011-0280-z
Jing., X., Chen., Y., Williams., D., Serna, M., and Zheng, H. (2019). Overtopping Failure of a Reinforced Tailings Dam: Laboratory Investigation and Forecasting Model of Dam Failure. Water 11 (2), 315–330. doi:10.3390/w11020315
Kim, M.-I., Kwak, J.-H., and Kim, B.-S. (2018). Assessment of Dynamic Impact Force of Debris Flow in Mountain Torrent Based on Characteristics of Debris Flowflow in Mountain Torrent Based on Characteristics of Debris Flow. Environ. Earth Sci. 77, 538–552. doi:10.1007/s12665-018-7707-9
Kwak, M., James, D. F., and Klein, K. A. (2005). Flow Behaviour of Tailings Paste for Surface Disposal. Int. J. mineral Process. 77, 139–153. doi:10.1016/j.minpro.2005.06.001
Li, Q., Zhang, L., and Qi, Q. (2012). Instability Characteristics and Stability Analysis of a Tailings Dam Based on Fluid-Solid Coupling Theory. Rock Soil Mech. 33, 243–250. doi:10.16058/j.issn.1005-0930.2017.03.012
Liu, D., You, Y., and Du, J. (2019). Spatio-temporal Distribution of the Impact Force of Debris Flow. Advaced Eng. Sci. 51 (3), 17–25.
Lu, X., Zhou, W., and Ding, X. (2019). Ensemble Learning Regression for Estimating the Unconfined Compressive Strength of Cemented Paste Backfill. IEEE Access, 2918177. doi:10.15961/j.jsuese.201801042
Nelson, J. (1977). Parameters Affection Stability of Tailings Dams. Ann Arbor: Proc of the Conf on Geotech Pmct for Disposal of Solid Water Mater, 440–460.
Proskin, S., Sego, D., and Alostaz, M. (2010). Freeze-thaw and Consolidation Tests on Suncor Mature fine Tailings (MFT). Cold Regions Sci. Techn. 63, 110–120. doi:10.1016/j.coldregions.2010.05.007
Rico., M., Benito., G., and Díez-Herrero, A. (2008). Floods from Tailings Dam Failures. J. Hazard. Mater. 154, 79–87. doi:10.1016/j.jhazmat.2007.09.110
Tang, L., Li, Z., Zhao, Y., Qin, J., and Lin, L. (2012). Life Cycle Oriented Hazards Identification for Tailings Facility. Proced. Eng. 43, 282–287. doi:10.1016/j.proeng.2012.08.048
Wang., K., Yang, P., Hudson-Edwards, K., Lyu, W., Yang, C., and Jing, X. (2018). Integration of DSM and SPH to Model Tailings Dam Failure Run-Out Slurry Routing across 3D Real Terrain. Water 10 (8), 1087–1101. doi:10.3390/w10081087
Wijewickreme, D., Sanin, M. V., and Greenaway, G. R. (2005). Cyclic Shear Response of fine-grained Mine Tailings. Can. Geotech. J. 42, 1408–1421. doi:10.1139/t05-058
Wu, J., Kang, Z., and Tian, L. (1990). Observing Study of Debris Flow in Jiangjiagou. Yunnan Province. Beijing: Science Press.
Yin, G., Jing, X., and Wei, Z. (2010). Experimental Study of the Similar Simulation of Tailings Dam-Break. Chin. J. Rock Mech. Eng. 29, 3830–3838.
Yu, G., and Song, C., (2014). Review of New Progress in Tailing Dam Safety in Foreign Research and Current State with the Development Trend in China. Chin. J. Rock Mech. Eng. 33, 3238–3248.
Yu, S., Shao, L., and Liu, S. (2013). Stability Analysis of Tailings Dam Based on Finite Element Limit Equilibrium Method. Rock Soil Mech. 34, 1185–1190.
Yuan, D., Liu, J., You, Y., Zhang, G., Wang, D., and Lin, Z. (2019). Experimental Study on the Performance Characteristics of Viscous Debris Flows with a Grid-type Dam for Debris Flow Hazards Mitigation. Bull. Eng. Geol. Environ. 78, 5763–5774. doi:10.1007/s10064-019-01524-z
Zheng, B. (2017). Research on the Basic Issues for Upstream Method of High Thickened Tailings and Stability Analysis of Tailings Dam [D]. Chongqing: Chongqing University.
Keywords: tailings dam, dam break, slurry concentration, flow characteristic, model experimental
Citation: Chen X, Jing X, Chen Y, Pan C and Wang W (2021) Tailings Dam Break: The Influence of Slurry with Different Concentrations Downstream. Front. Earth Sci. 9:726336. doi: 10.3389/feart.2021.726336
Received: 16 June 2021; Accepted: 15 November 2021;
Published: 24 December 2021.
Edited by:
Jie Chen, Chongqing University, ChinaReviewed by:
Yulong Cui, Anhui University of Science and Technology, ChinaCopyright © 2021 Chen, Jing, Chen, Pan and Wang. This is an open-access article distributed under the terms of the Creative Commons Attribution License (CC BY). The use, distribution or reproduction in other forums is permitted, provided the original author(s) and the copyright owner(s) are credited and that the original publication in this journal is cited, in accordance with accepted academic practice. No use, distribution or reproduction is permitted which does not comply with these terms.
*Correspondence: Xiaofei Jing, eGZqaW5nQGNxdXN0LmVkdS5jbg==; Yulong Chen, Y2hlbnl1bG9uZ0BjdW10Yi5lZHUuY24=; Changshu Pan, cGNzcXNsQDE2My5jb20=
Disclaimer: All claims expressed in this article are solely those of the authors and do not necessarily represent those of their affiliated organizations, or those of the publisher, the editors and the reviewers. Any product that may be evaluated in this article or claim that may be made by its manufacturer is not guaranteed or endorsed by the publisher.
Research integrity at Frontiers
Learn more about the work of our research integrity team to safeguard the quality of each article we publish.