 Weibin Yang
 Fulei Wang
 Yongbo Tie
 Dongpo Wang
 Chaojun Ouyang
- 1State Key Laboratory of Geohazard Prevention and Geoenvironment Protection, Chengdu University of Technology, Chengdu, China
- 2Key Laboratory of Mountain Hazards and Surface Process and Institute of Mountain Hazards and Environment (IMHE), Chinese Academy of Sciences, Chengdu, China
- 3University of Chinese Academy of Sciences, Beijing, China
- 4Chengdu Institute of Geology and Mineral Resources, China Geological Survey, Chengdu, China
On August 21, 2020, a landslide occurred in Zhonghai village of Hanyuan County, Sichuan Province, China. The landslide is triggered by two successive rounds of heavy rainfall. This landslide can be clearly divided into an initial landslide and a main landslide. The main landslide is activated by the intense impact and overloading of the initial landslide. The depth-integrated continuum method is adopted to simulate the dynamic process. Due to the complicated failure process, it is found that there is no proper unified parameters in Coulomb model which could well reproduce the two successive landslides. It implies that the dynamic process of landslides is highly associated with the characteristics of sliding bodies. Here, an implement of variable frictional coefficients for different parts is proposed and the parameters are calibrated. It is demonstrated that results from numerical modeling match well with the field investigation. The complicated landslides in two different stage can both be efficiently revealed by depth-integrated continuum modeling.
Introduction
Rainfall especially continuous rainfall and heavy rainfall is the most common cause of landslides. In the past several decades, rainfall-induced landslides have occurred frequently all over the world (Ayalew 1999; Lin and Jeng 2000; Chen and Lee 2004; Guzzetti et al., 2004; Huang 2009; Yin 2011). Recently, there are several catastrophe rainfall-induced landslides in China, which have caused devastating disasters and is a huge challenge to residents and project (Xu et al., 2012; Yin et al., 2016; Yin et al., 2017; Ouyang et al., 2018; Fan et al., 2020; Xue et al., 2021). For instance, the rainfall triggered landslide on June 28, 2010 in Guanling County destroyed two villages and killed 99 people (Xing et al., 2014). With frequent extreme weather (Wei et al., 2020; Yang and Huang 2021), it is essential to understand the failure mechanism and dynamic process under heavy rainfall.
Landslide runout analysis is mainly implemented in three ways: physical experiments, empirical-statistical methods and numerical models. Physical experiments are widely used to study on the runout mechanism and the deposition characteristics of landslides (Kokelaar et al., 2014), but it is usually limited by the size effect. Empirical-statistical methods mainly focus on geometrical correlations: 1) the correlation between the angle of reach and the landslide volume (Scheidegger 1973; Corominas 1996; Hunter and Fell 2003); 2) the correlation between deposition area of landslide and the landslide volume (Iverson et al., 1998; Griswold and Iverson 2008); 3) the correlation between the travel distance and other geometrical parameters (Finlay et al., 1999). By the empirical formula based on statistical data, the runout distance and deposition area can be predicted simply and effectively. In addition, empirical-statistical methods are useful for risk assessment mapping in large regional scales (Griswold and Iverson 2008; McDougall 2017). For all that, empirical-statistical methods cannot provide dynamic characteristics such as speed and deposition depth of landslides at a specific moment.
With the improvement of computer operation efficiency, various numerical models have been used to analysis the runout and dynamic characteristics of landslides. Common numerical models for landslide include: 1) discrete element method (Tang et al., 2009; Lin and Lin 2015); 2) the smoothed particle hydrodynamics (Pastor et al., 2009; Pastor et al., 2014); 3) discontinuous deformation analysis (Beyabanaki et al., 2016; Zhang et al., 2016); 4) the depth-integrated continuum method (Savage and Hutter 1989). Compared with other methods, the depth-integrated continuum method has a advantages of higher computational efficiency and less parameters (Iverson and Ouyang 2015), so it is widely used to simulate runout of landslides (Hungr 1995; Pirulli 2005; McDougall 2006; Beguería et al., 2009; Iverson and George 2014). Due to the complexity and diversity of landslides, it is difficult to determine motion parameters of different landslides and predict the runout of landslides accurately. Therefore, back analysis of the landslide parameters is very meaningful for understanding and predicting the runout of similar landslides. As a general rule, previous studies on numerical simulation of landslides mostly focused on the motion parameters inversion of single landslide and the parameters are used to predict the landslides at the same location. However, motion parameters of landslide at the same area could be different and even different zones of a landslide may have different motion parameters. Therefore, this study focuses on the motion parameters and processes of different landslides parts.
At 3:50 AM on August 21, 2020, a landslide (located at E 102°41′44″ and N 29°20′35″) occurred at Zhonghai village in Hanyuan County of Sichuan Province, China. The landslide killed nine fatalities, destroyed eight houses and caused traffic disruption of provincial road S435. During the heavy rainfall, deformation signs were found on the slope, and the landslide occurred after the rainfall. In this paper, the remote sensing method based on unmanned aerial vehicle (UAV) is used to obtain geographic reference digital surface model (DSM) and digital orthophoto model (DOM) and the failure mechanism of the landslide is analyzed. The terrain data is processed based on the pre- and post-disaster terrain and SLBL (Jaboyedoff et al., 2004; Jaboyedoff et al., 2009) is used to determine the sliding plane. Finally, the depth-integrated continuum method is used to inverse the dynamic process of the initial and main landslides.
Regional Geological and Geomorphology Setting
The landslide occurred in Hanyuan County, which is 285.7 km away from Chengdu and 147 km away from Ya’an City (Figure 1A). It is located in the transitional area between the Sichuan Basin and the Qinghai-Tibetan Plateau and its landform is mainly mountainous (Figure 1B). The Dadu River runs from west to east and the Liusha River runs from north to south through Hanyuan County. The center of the study area is river valley area and surrounded by high mountains. The highest peak reaches an altitude of 4021 m, the lowest altitudes is 550 m, and the maximum relative elevation difference is 3471 m in the study area. The region is prone to landslides due to high mountains, steep slopes and incision of rivers.
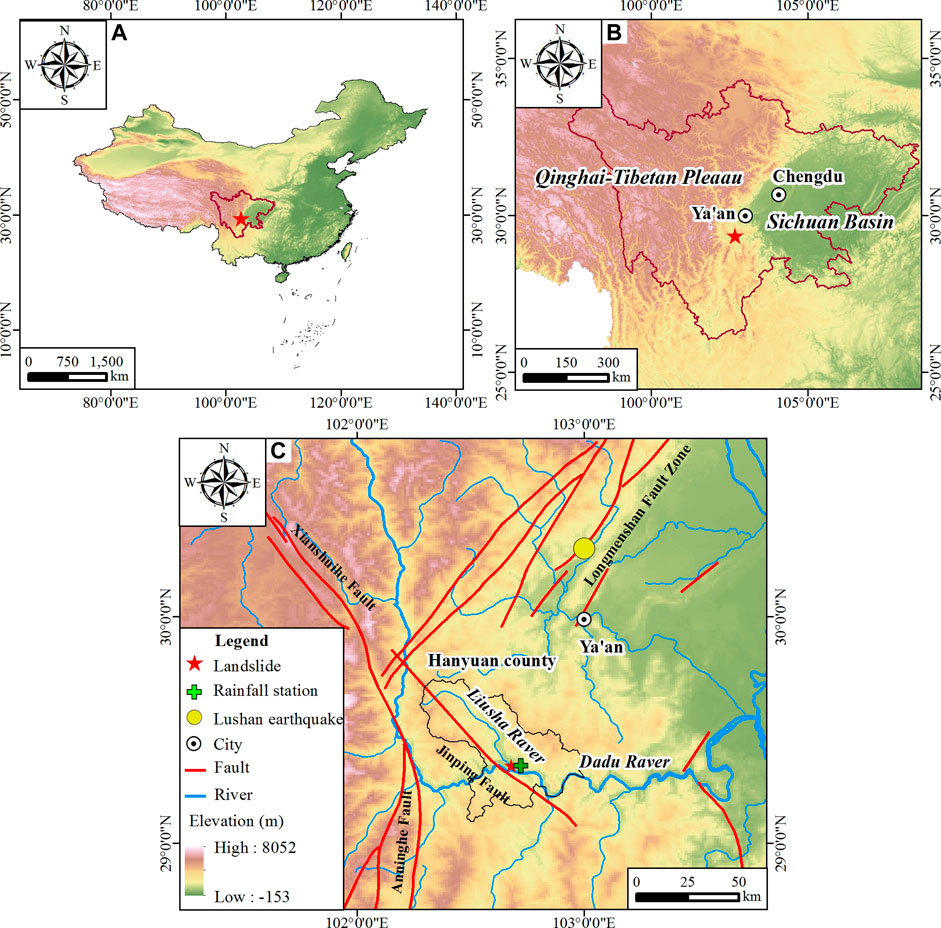
FIGURE 1. The location of the Zhonghai landslide in (A) China, (B) Sichuan Province. (C) The distribution of the faults and the river systems.
Due to frequent tectonic deformation in history, the soil mass is loose and the integrity of rock mass is poor in Hanyuan County. The overlying soil of the landslide area is cultivated soil and sandy soil. The bedrock is strongly weathered sand-mud interbeds, which have bad physical and mechanical properties. In past decade, multiple earthquakes such as the Lushan Ms 7.0 earthquake in 2013 (Figure 1C) occurred in nearby faults, which could further cause degradation of geological properties of rock and soil mass. Generally, The features of rock-mass body in the landslide area are relatively bad.
Hanyuan County have a subtropical monsoon-influenced humid climate with four distinct seasons. Annual mean temperature in the study area is 17.7°C (the maximum temperature is 40.9°C and the minimum temperature is −29°C). The study area has an mean annual rainfall of 741.8 mm, which has apparent seasonal mal-distribution. The rainfall in summer and autumn (from July to August) occupies 80% of the annual rainfall, while the rainfall in winter and spring (from November to April of the next year) occupies only 12% of the annual rainfall. There were two rounds of heavy rainfall and an accumulated rainfall 167.5 mm (Figure 2) before the landslide occurred. With the infiltration of rainwater, the weight of rock and soil in the slope increased and the mechanical properties decreased, resulting in slope failure. Hence, rainfall is deemed as the direct triggering factor of the landslide.
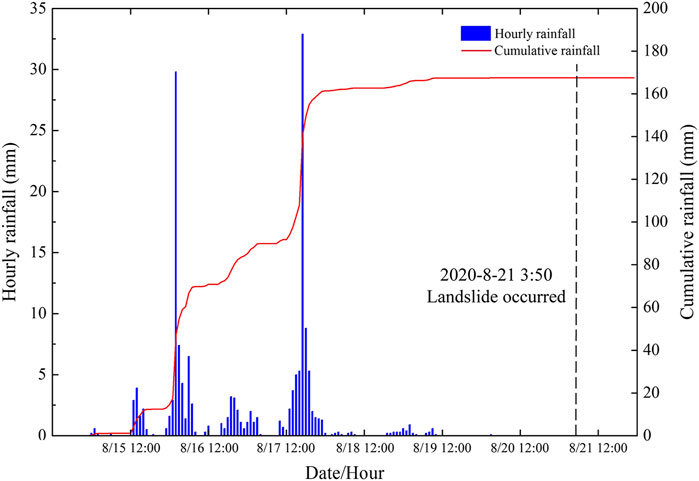
FIGURE 2. The rainfall in 1 h intervals and cumulative rainfall before the slide. The data is provided by Anle Town rainfall station which is 2.4 km away from the landslide.
General Description of the Zhonghai Landslide
On August 26, 2020, field investigations on Zhonghai landslides in detail were carried out. A total of 803 photographs were taken by UAV (unmanned aerial vehicle) covering an area of 0.3 km2. DSM and DOM with an accuracy of 0.055 m were established. The DOM of the landslide is shown in Figure 3. This landslide is relatively complicated and owns a different stage. It is not feasible to describe the landslide in a single process. Based on the field investigations, comparison from pre- and post-disaster, sliding plane analysis by SLBL (Jaboyedoff et al., 2004; Jaboyedoff et al., 2009), the landslide is partitioned into the initial landslide, the main landslide and two unstable mass.
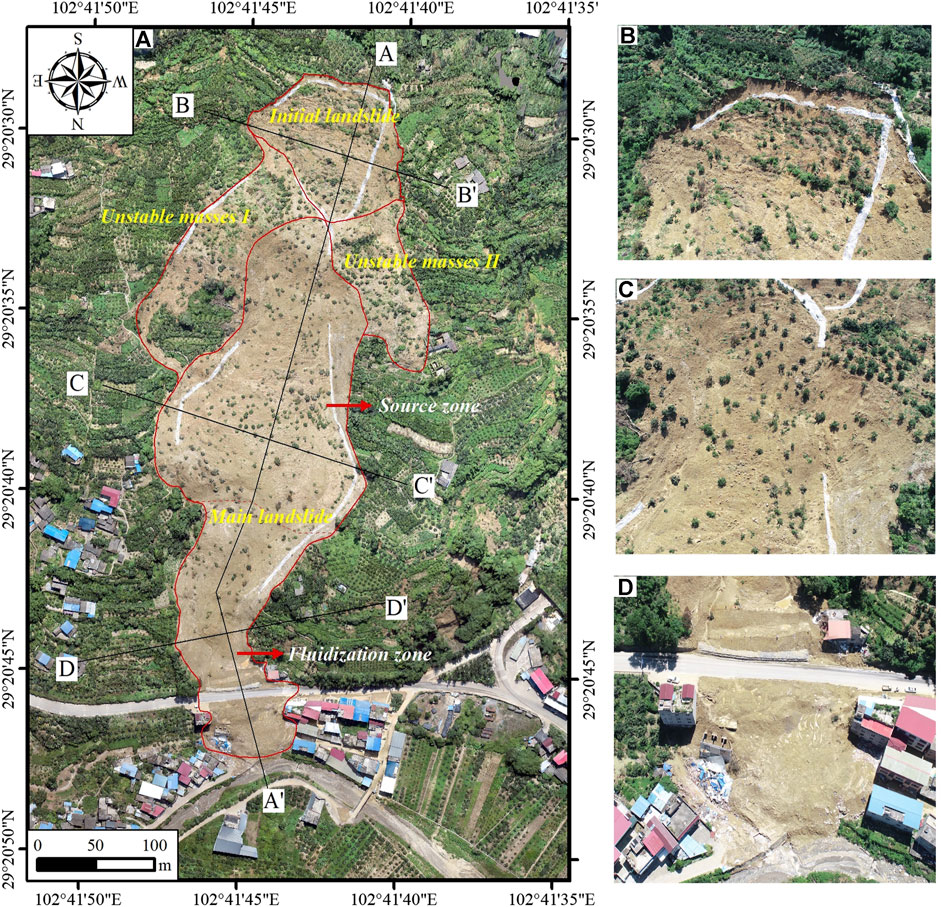
FIGURE 3. (A) The landslide boundary and partition based on field investigation and UAV image. (B) The upper scarp of the initial landslide. (C) The upper scarp of the main landslide. (D) The front edge of the main landslide.
Zhonghai landslide has a runout distance of 590 m, the highest elevation of 1013 m and the lowest elevation of 840 m with a total area of 7.8 × 10⁴ m2. The slide direction of the initial landslide was 16° NE. The initial landslide has the maximum elevation difference of 53 m, a length of 120 m and a maximum width of 134 m, covering an area of 1.1 × 10⁴ m2. The initial landslide volume is about 8.5 × 10⁴ m3 and there are scarps about 3–5 m high at the upper edge of the initial landslide. Two unstable mass and the main landslide is located below the initial landslide. The unstable mass Ⅰ with an area of 1.27 × 10⁴ m2 is located on the left side of the main landslide and the vegetation has been relatively well preserved in its lower part. The area of unstable mass Ⅱ on the right side of the main landslide is about 0.7 × 10⁴ m2.
The main landslide, which covers an area about 4.75 × 10⁴ m2, has a runout distance of 472 m and the maximum elevation difference of 124 m. Its volume is about 53 × 104 m3. There are scarps about 10–24 m high at the upper edge of the main landslide. According to the topography and fluidization characteristic, the main landslide can be divided into two zones: the source zone and the fluidization zone. The source zone has a length of 260 m, a maximum width of 185 m and an area of 3.15 × 10⁴ m2. The slide direction was 15.5° NE and plenty of deposition remains in the source zone. The fluidization zone is estimated at 230 m long and 80 m wide in average with an area of 1.6 × 10⁴ m2. The slide direction was firstly 21° NE and then 345° NW in the fluidization zone.
The topography of the original slope provided a favorable terrain condition for the initiation of the landslide. The original slope was high in the south and low in the north with irregular plane shape. The slope topography was summarized as “steep-gentle-steep”. The upper part of the slope is under good free face condition with a slope gradient of about 35° and the middle slope is gentle with a slope angle of 10°–20° as well as the lower slope is steep with a slope angle of 20°–25°. This topographic feature made the upper slope become unstable firstly and caused the chained reaction.
The overlying soil of Zhonghai landslide is cultivated soil and sandy soil, with loose structure, large gap and strong permeability which is beneficial to rainwater infiltration. The rock under the soil layer is weathered sand-mud interbeds. Under the long-term moistening of infiltration water, the mudstone interlayer is obviously softened and argillized, so its resistant shear strength is greatly reduced. The rock and soil in the landslide area lay the material foundation for the deformation and failure of the slope.
The landslide occurred in rainy season and experienced long-term rainfall before the landslide. According to the data of rainfall stations near the landslide (Figure 2), there are the two rounds of heavy rainfall and the most intense hourly rainfall is more than 30 mm/h. The continuous rainfall lead to increase the weight of the slope and decline the mechanical properties of rock and soil, especially weak mudstone interlayer, which is the direct triggering factor of the landslide.
At 3:50 am, on August 26, 2020, after two rounds of heavy rainfall, the steep slope in the upper area became unstable and formed the initial landslide. Under the influence of the impact and loading of the initial landslide, the slope in the middle area had intense deformation, resulting in two unstable mass and triggering the main landslide. The landslide mass in the source zone was relatively deep and its movement is constrained. It imposed strong impact and loading on the bottom slope. The landslide mass in the fluidization zone moved fast so it destroyed the house and buried the provincial road.
Dynamic Process Analysis
Model Description
To analyze the depth and velocity distribution of landslide in the process of sliding, the depth integral continuous statistical method is adopted. The governing equation is as follows
where
where
The above-metioned equations are solved by MacCormark-TVD method and it has been implemented in Massflow software (Ouyang et al., 2013). The Massflow has been successful applied different kinds of earth-surfaced flows, such as landslides (Ouyang et al., 2017; Wei et al., 2020), debris flows (Ouyang et al., 2015a; Horton et al., 2019) and floods (Ouyang et al., 2015b).
Analysis of the Numerical Results
The pre-disaster geomorphology and building distribution were obtained from the historical Google image. The pre-disaster terrain is obtained from Sichuan Bureau of Surveying, Mapping and Geoinformation with a resolution of 5 m. The post-disaster terrain is build based on UAV images with resolution of 0.055 m. In the computational procedure, all terrain data were resampled to 1 m grid. The ratio of mobility (H/L) of the initial landslide and the main landslide is determined to be 0.44 and 0.26. First, the ratio of motion are used as the friction coefficient in numerical simulation and the numerical results don’t match with the actual condition very well. Then, the parameters are adjusted for trial calculation. In addition, it is difficult to obtain good results by only using one parameter in the simulation of the main landslide. Finally, by parameter calibrations, the basal friction coefficient is set to be 0.5 for the initial landslide; the basal friction coefficient 0.31 (in the source zone) and 0.25 (in the fluidization zone) is adopted for the main landslide.
Deposition thickness contour map of the initial landslide at t = 0, 2, 4, 6, 8 s are shown in the Figure 4. At t = 2 s, the landslide mass moved down fast along the direction of 15.5° NE. At t = 4 s, the front of the landslide reached the mild slope. After 4 s, the landslide movement was blocked by smooth terrain and the landslide mass began to deposit. After 6 s, most of the mass was deposited in the mild slope and sliding surface. The final deposition area of the numerical simulation is compared with data acquired by DSM and field measurements. The result shows that the simulated deposition zone is mostly located in the actual boundary indicated by red line and the part without deposition matches well with the exposed scarp at the upper edge of the landslide. It is proved that the numerical and measured results are generally in agreement.
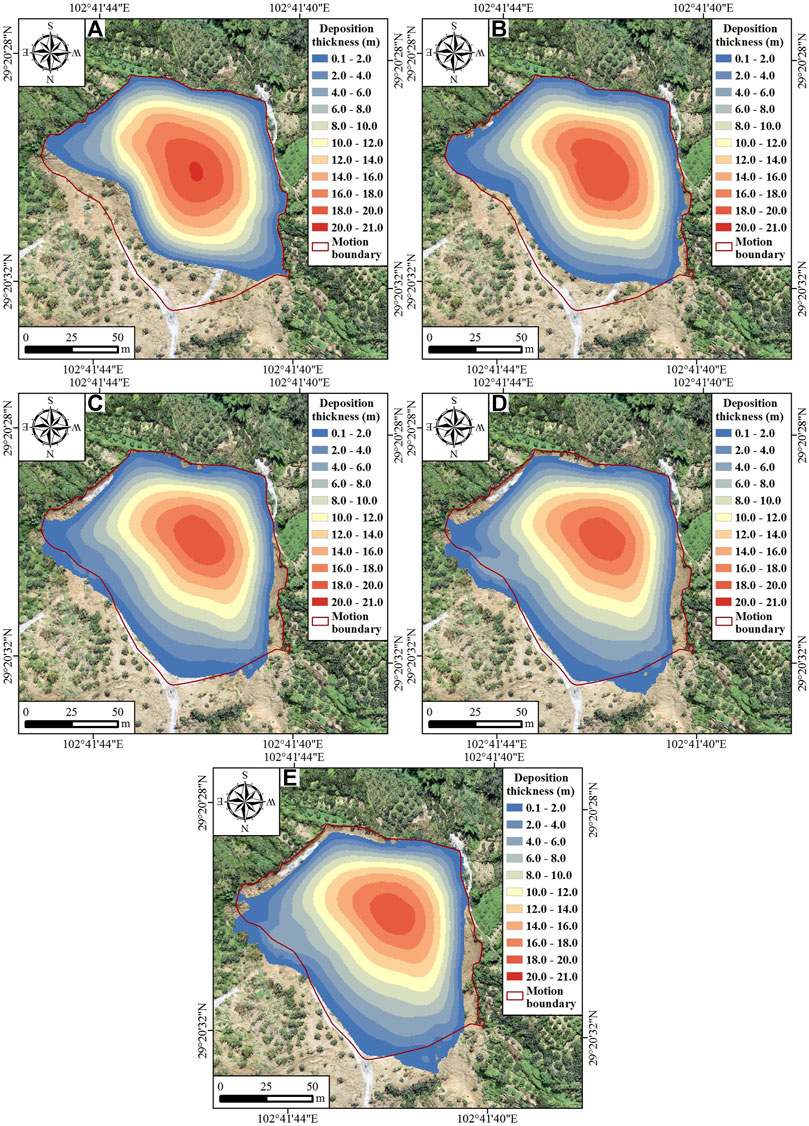
FIGURE 4. Thickness of the initial landslide at (A) t = 0 s, (B) t = 2 s, (C) t = 4 s, (D) t = 6 s, and (E) t = 8 s.
Flow speed contours of the initial landslide at t = 0, 2, 4, 6, 8 s are shown in the Figure 5. At t = 2 s, the speed of landslide front reached a speed 7 m/s with effect of geopotential. At t = 4 s, the front of the landslide was blocked, but the landslide mass on two sides still had a slow speed. After 4 s, the landslide mass began to deposit and the speed of mass on both sides decreased continuously. At t = 8 s, the most mass became static except for some on the steep scarp.
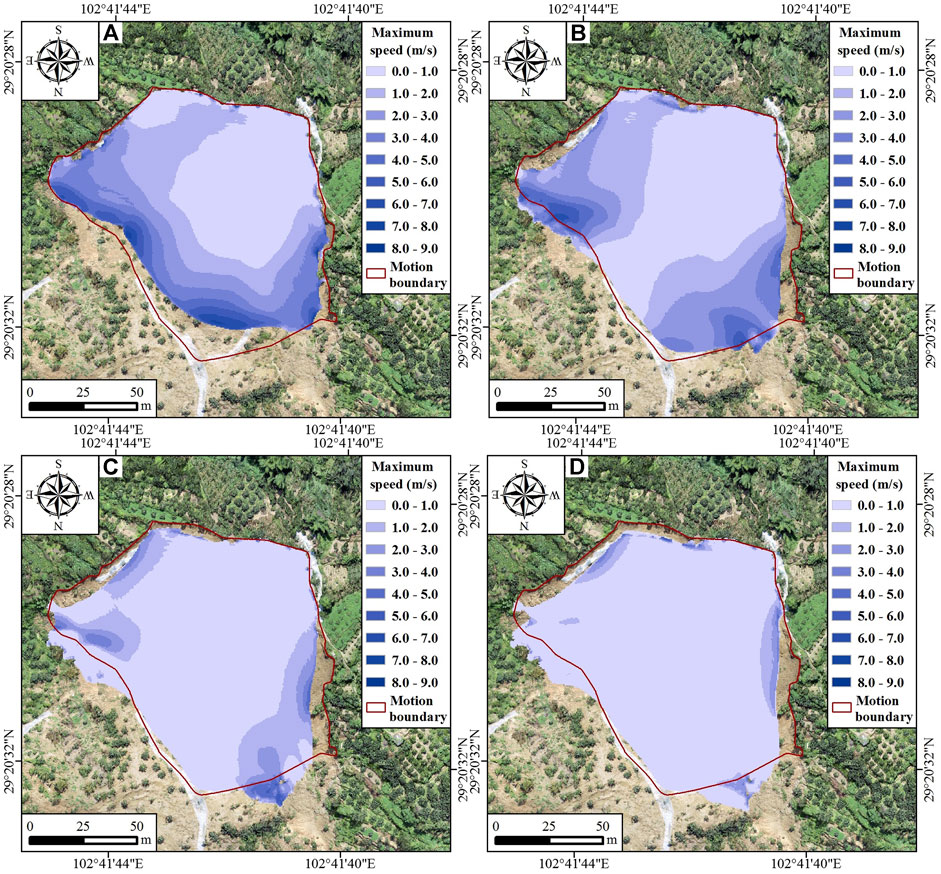
FIGURE 5. Speed of the initial landslide at (A) t = 2 s, (B) t = 4 s, (C) t = 6 s, and (D) t = 8 s.
The maximum deposition thickness and maximum flow speed contours of the initial landslide are shown in the Figure 6. The speed almost increased and then decreased from top to bottom. The slope below the initial landslide suffered from the violent impact and compression of the initial landslide, resulting in two unstable mass and triggering the main landslide.
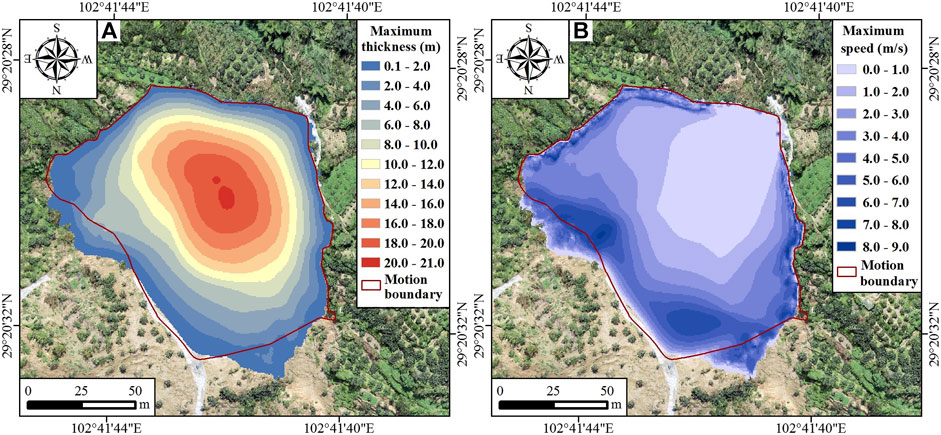
FIGURE 6. The maximum thickness and speed of the initial landslide during the sliding process.
Deposition thickness contours of the main landslide at t = 0, 8, 16, 24, 32 and 40 s are shown in the Figure 7. At t = 8 s, the front of the landslide destroyed houses on both sides of the provincial road. At t = 16 s, the front edge of the landslide moved to the bank and destroyed two houses near the bank. After 16 s, the landslide no longer moved forward and began to deposit mass affected by relatively flat terrain. At t = 40 s, the most landslide mass is completely deposited. The final deposition area of the numerical simulation is compared with data acquired by DSM and field measurements. The result shows that the main simulated deposition zone is mostly located in the actual boundary indicated by red line. The numerical simulation results matched well with actual deposition area.
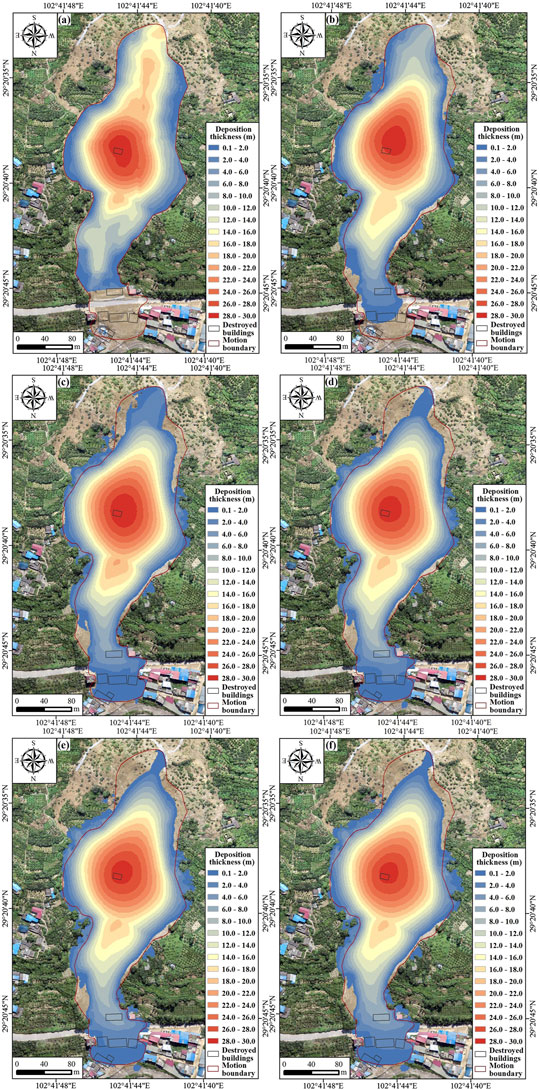
FIGURE 7. Thickness of the main landslide at (A) t = 0 s, (B) t = 8 s, (C) t = 16 s, (D) t = 24 s, (E) t = 32 s and (F) t = 40 s.
Flow speed contours of the main landslide at t = 0, 8, 16, 24, 32 and 40 s are shown in the Figure 8. At t = 8 s, the landslide front reached a speed of 8 m/s and some mass near free surface reached a speed of 12 m/s. At t = 16 s, the front edge of the landslide stopped moving due to the flat terrain and the basal friction and the speed of mass on the upper edge of the landslide decreased. After 16s, the boundary of landslide movement was no longer extended and the overall speed of the landslide decreased continuously. After 40 s, the landslide mass mostly stopped moving except for some on the steep slope.
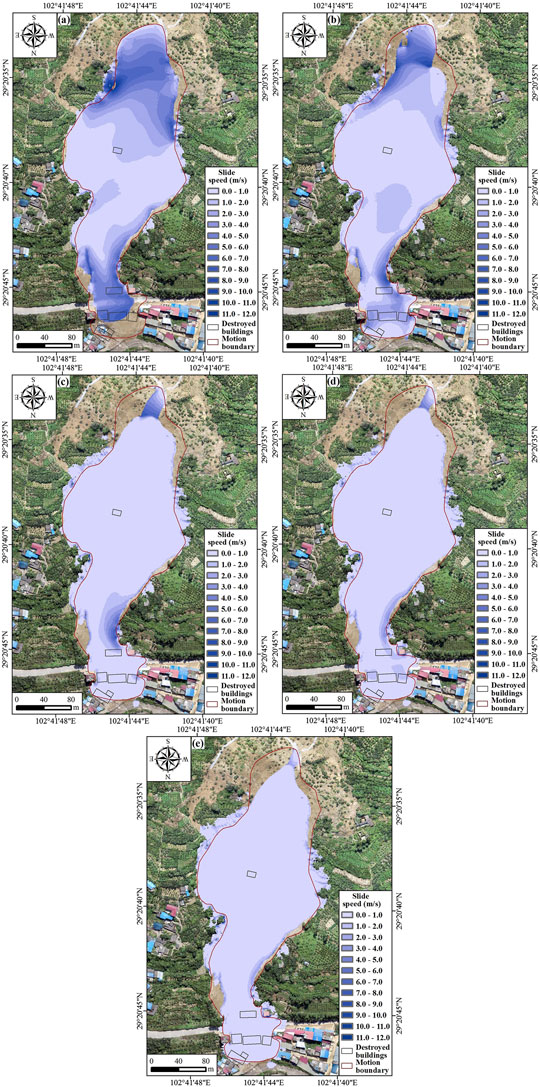
FIGURE 8. Speed of the main landslide at (A) t = 8 s, (B) t = 16 s, (C) t = 24 s, (D) t = 32 s and (E) t = 40 s.
The maximum deposition thickness and maximum speed of the main landslide are shown in the Figure 9. The speed almost decreased and then increased from top to bottom. The maximum speed was near the free surface on the upper edge of landslide. The high kinetic energy of the landslide destroyed houses in the fluidizaition zone.
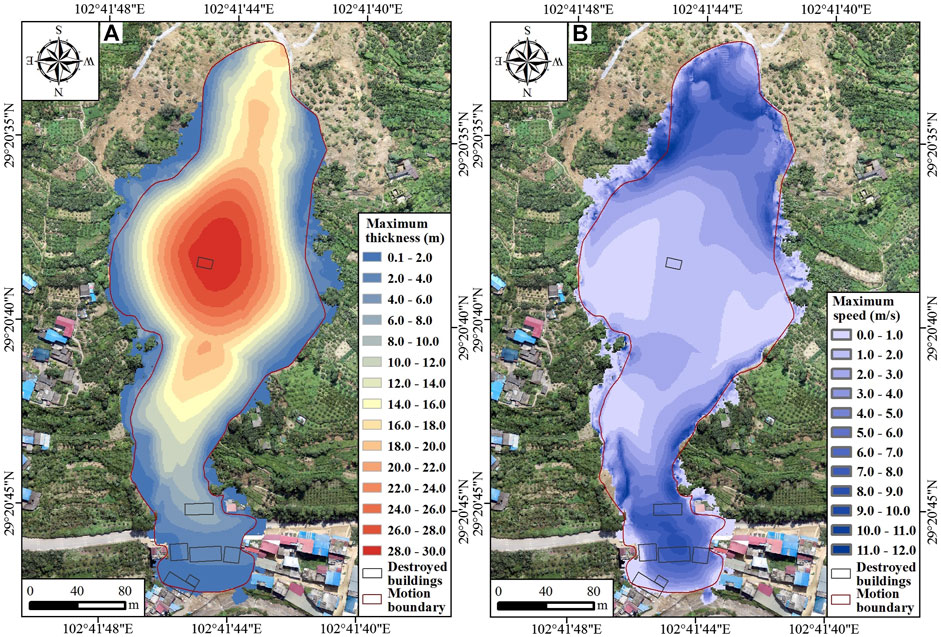
FIGURE 9. The maximum thickness and speed of the main landslide during the sliding process.
A comparison between simulation result and terrain aquired from UAV along the main sliding profile A-A’ and the transverse profiles is shown in Figure 10. For the main profile (Figure 10A), the computed and measured results are generally in agreement, except for the location of provincial road and houses. The landslide mass on the road has been cleared and the destroyed buildings have increased the deposition depth, leading to an difference between the simulated results and the real depth. For the several transverse profiles (Figures 10B–D), the computed results are generally consistent with the measured profile. In order to further quantify the accuracy of the simulation, the average error between the computed results and the real depth is calculated to be 2.2 m. It is proved that the deposition depth of simulation result matches with the actual depth very well and the depth-integrated continuum method can invert the dynamic process of the Zhonghai landslide.
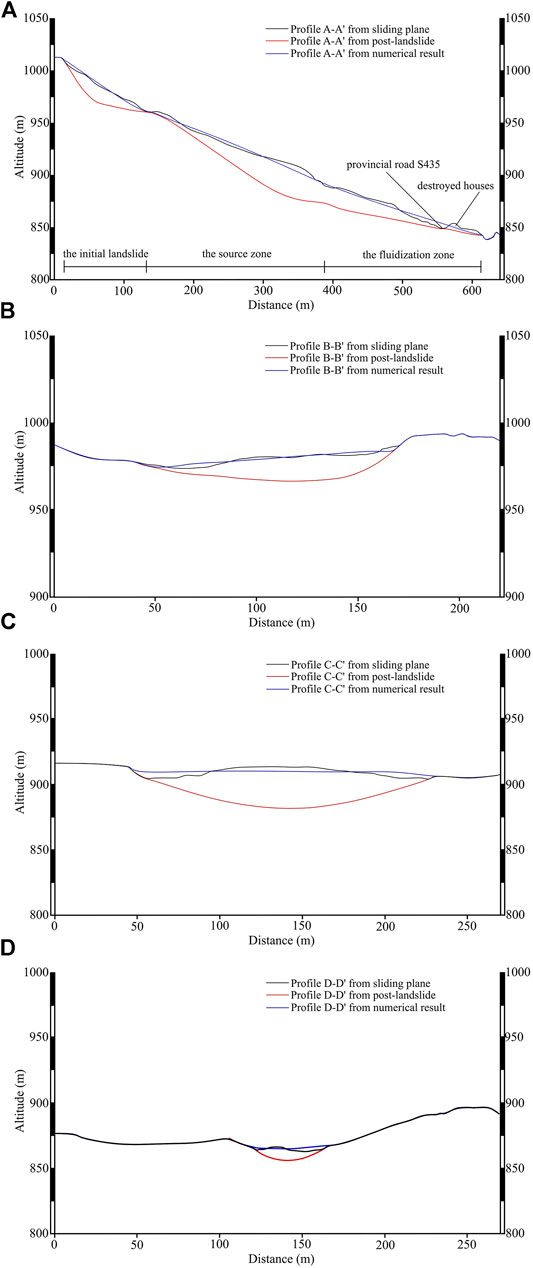
FIGURE 10. Comparison of the numerical results and field investigations along (A) the main sliding profile A-A’, (B) the transverse profile B-B’, (C) the transverse profile C-C’, and (D) the transverse profile D-D’.
In order to justify the parameters, numerical results for the initial landslide with μ = 0.45 and 0.55 are presented in Figures 11A,B. It is seen that the mass moves downstream further with μ = 0.45 and the runout distance is shorter with μ = 0.55. Obviously, the friction coefficient of 0.5 is the most reasonable. In addition, numerical results for the main landslide with μ = 0.27 and 0.31 are presented in Figures 11C,D. Although the front edge of the landslide is well matched with the real result relatively well, there is little mass in the upper part of the landslide in Figure 11C. Correspondingly, the deposition depth in the source zone of the main landslide and measured result are generally in agreement, but the landslide runout distance is shorter in Figure 11D. Hence, it is necessary to use different friction coefficients for different zones. On the other hand, pore pressure commonly increases with the decrease of slope height, so the lower sliding mass has greater mobility. Friction coefficient of 0.5, 0.31 and 0.25 is used from top to bottom as a result of the increase of pore water pressure. Therefore, from the aspect, the distribution of friction coefficient is reasonable.
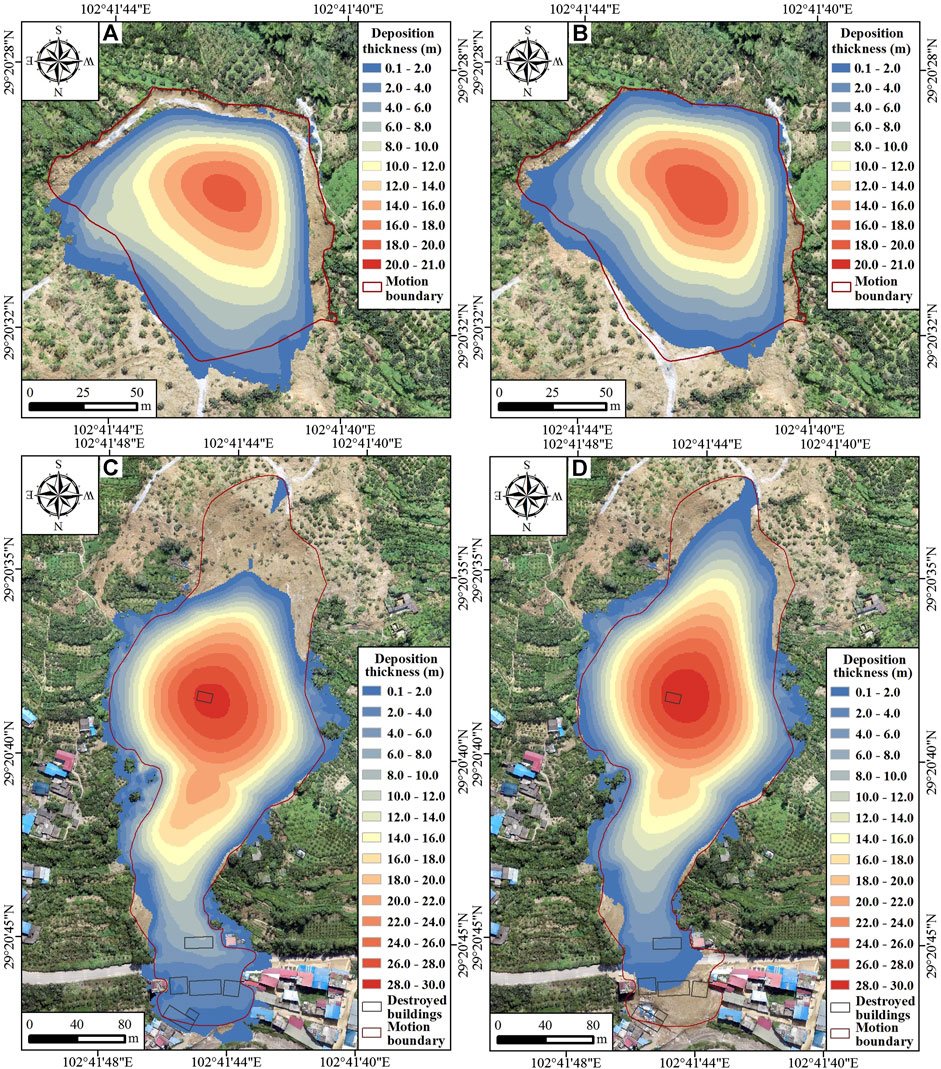
FIGURE 11. The final depth contours of the initial landslide (A) with μ = 0.45, (B) with μ = 0.55. The final depth contours of the main landslide (C) with μ = 0.27, (D) with μ = 0.31.
Conclusion and Discussion
The landslide occurred at Zhonghai village in Hanyuan County is comprehensively analyzed by field investigation, aerial image recognition and numerical modeling. The failure mechanism and movement characteristics are unique and worthy to be noticed. Some findings are summarized and discussed as follows.
1. For Zhonghai landslide, the two successive rounds of heavy rainfall was recognized as the main cause of its occurrence. Meanwhile, the steep terrain, loose soil and crashed rock mass with poor mechanical properties were its vulnerable conditions. Loose cultivated soil and sandy soil is beneficial to rainwater infiltration, which increases the weight of the slope. The weak mudstone intercalation is softened and argillized, under the long-term moistening of infiltration water, so its resistant shear strength is greatly reduced. The “steep-gentle-steep” terrain promoted the initiation of the landslide and lead a series of chain reactions. The initial landslide in the high elevation can trigger a serial of corresponding consequences. Thus, for risk evaluation of this kind of landslides, the chained reaction need attention.
2. The rainfall triggered landslides are a complicated process. Even if the landslides are located at the same area, the dynamic processes are apparently different. For the initial landslide, the speed almost increased and then decreased from top to bottom. Correspondingly, the back edge of the main landslide with good free surface condition and the fluidization zone with higher mobility had high speed as well as the middle part moved slowly. It brings a huge challenge for numerical modeling. Here, we adopted a scheme of variable friction coefficients to reveal the internal mechanism. Friction coefficient of 0.5, 0.31 and 0.25 is used from top to bottom and it obviously has the correlation with the pore pressure which commonly increases with the decrease of slope height. In the future, a unified model coupled with infiltration and pore pressure evolution might be a creditable attempt.
Data Availability Statement
The raw data supporting the conclusions of this article will be made available by the authors, without undue reservation.
Author Contributions
WY, and FW carried out the simulations and wrote the draft. Both YT, and DW authors contributed to the final version of the manuscript. CO developed the theoretical formalism and revise the manuscript.
Funding
Financial support from NSFC (Grant No. 42022054), Public Welfare Geological Survey Project: Geological survey of urban disaster in western Sichuan mountainous area (Grant No. DD20190640), National Key Research and Development Program of China (Project No. 2017YFC1501000), the Strategic Priority Research Program of CAS (Grant No. XDA23090303), and the Youth Innovation Promotion Association, is acknowledged.
Conflict of Interest
The authors declare that the research was conducted in the absence of any commercial or financial relationships that could be construed as a potential conflict of interest.
Publisher’s Note
All claims expressed in this article are solely those of the authors and do not necessarily represent those of their affiliated organizations, or those of the publisher, the editors and the reviewers. Any product that may be evaluated in this article, or claim that may be made by its manufacturer, is not guaranteed or endorsed by the publisher.
References
Ayalew, L. (1999). The Effect of Seasonal Rainfall on Landslides in the highlands of ethiopia. Bull. Eng. Geol. Env 58, 9–19. doi:10.1007/s100640050065
Beguería, S., Van Asch, T. W. J., Malet, J.-P., and Gröndahl, S. (2009). A Gis-Based Numerical Model for Simulating the Kinematics of Mud and Debris Flows over Complex Terrain. Nat. Hazards Earth Syst. Sci. 9, 1897–1909. doi:10.5194/nhess-9-1897-2009
Beyabanaki, S. A. R., Bagtzoglou, A. C., and Liu, L. (2016). Applying Disk-Based Discontinuous Deformation Analysis (Dda) to Simulate Donghekou Landslide Triggered by the Wenchuan Earthquake. Geomechanics and Geoengineering 11, 177–188. doi:10.1080/17486025.2015.1082647
Chen, H., and Lee, C. F. (2004). Geohazards of Slope Mass Movement and its Prevention in hong kong. Eng. Geology. 76, 3–25. doi:10.1016/j.enggeo.2004.06.003
Corominas, J. (1996). The Angle of Reach as a Mobility index for Small and Large Landslides. Can. Geotech. J. 33, 260–271. doi:10.1139/t96-005
Fan, X., Tang, J., Tian, S., and Jiang, Y. (2020). Rainfall-induced Rapid and Long-Runout Catastrophic Landslide on July 23, 2019 in Shuicheng, Guizhou, china. Landslides 17, 2161–2171. doi:10.1007/s10346-020-01454-y
Finlay, P. J., Mostyn, G. R., and Fell, R. (1999). Landslide Risk Assessment: Prediction of Travel Distance. Can. Geotech. J. 36, 556–562. doi:10.1139/t99-012
Griswold, J. P., and Iverson, R. M. (2008). Mobility Statistics and Automated hazard Mapping for Debris Flows and Rock Avalanches. US Department of the Interior, US Geological Survey.
Guzzetti, F., Cardinali, M., Reichenbach, P., Cipolla, F., Sebastiani, C., Galli, M., et al. (2004). Landslides Triggered by the 23 November 2000 Rainfall Event in the Imperia Province, Western Liguria, italy. Eng. Geology. 73, 229–245. doi:10.1016/j.enggeo.2004.01.006
Horton, A. J., Hales, T. C., Ouyang, C., and Fan, X. (2019). Identifying post-earthquake Debris Flow hazard Using Massflow. Eng. Geology. 258, 105134. doi:10.1016/j.enggeo.2019.05.011
Huang, R. (2009). Some Catastrophic Landslides since the Twentieth century in the Southwest of china. Landslides 6, 69–81.
Hungr, O. (1995). A Model for the Runout Analysis of Rapid Flow Slides, Debris Flows, and Avalanches. Can. Geotech. J. 32, 610–623. doi:10.1139/t95-063
Hunter, G., and Fell, R. (2003). Travel Distance Angle for "rapid" Landslides in Constructed and Natural Soil Slopes. Can. Geotech. J. 40, 1123–1141. doi:10.1139/t03-061
Iverson, R. M., and George, D. L. (2014). A Depth-Averaged Debris-Flow Model that Includes the Effects of Evolving Dilatancy. I. Physical Basis. Proc. R. Soc. A. 470, 20130819. doi:10.1098/rspa.2013.0819
Iverson, R. M., and Ouyang, C. (2015). Entrainment of Bed Material by Earth‐surface Mass Flows: Review and Reformulation of Depth‐integrated Theory. Rev. Geophys. 53, 27–58. doi:10.1002/2013rg000447
Iverson, R. M., Schilling, S. P., and Vallance, J. W. (1998). Objective Delineation of Lahar-Inundation hazard Zones. Geol. Soc. America Bull. 110, 972–984. doi:10.1130/0016-7606(1998)110<0972:odolih>2.3.co;2
Jaboyedoff, M., Baillifard, F., Couture, R., Locat, J., and Locat, P. (2004). Toward Preliminary hazard Assessment Using Dem Topographic Analysis and Simple Mechanical Modeling by Means of Sloping Local Base Level. Landslides Eval. stabilization Balkema, 2:199–205. doi:10.1201/b16816-27
Jaboyedoff, M., Couture, R., and Locat, P. (2009). Structural Analysis of Turtle Mountain (alberta) Using Digital Elevation Model: Toward a Progressive Failure. Geomorphology 103, 5–16. doi:10.1016/j.geomorph.2008.04.012
Kokelaar, B. P., Graham, R. L., Gray, J. M. N. T., and Vallance, J. W. (2014). Fine-grained Linings of Leveed Channels Facilitate Runout of Granular Flows. Earth Planet. Sci. Lett. 385, 172–180. doi:10.1016/j.epsl.2013.10.043
Lin, C.-H., and Lin, M.-L. (2015). Evolution of the Large Landslide Induced by Typhoon Morakot: A Case Study in the Butangbunasi River, Southern Taiwan Using the Discrete Element Method. Eng. Geology. 197, 172–187. doi:10.1016/j.enggeo.2015.08.022
Lin, M. L., and Jeng, F. S. (2000). Characteristics of Hazards Induced by Extremely Heavy Rainfall in Central Taiwan - Typhoon Herb. Eng. Geology. 58, 191–207. doi:10.1016/s0013-7952(00)00058-2
McDougall, S. (2006). A New Continuum Dynamic Model for the Analysis of Extremely Rapid Landslide Motion across Complex 3d Terrain. PhD Thesis. University of British Columbia.
McDougall, S. (2017). 2014 Canadian Geotechnical Colloquium: Landslide Runout Analysis - Current Practice and Challenges. Can. Geotech. J. 54, 605–620. doi:10.1139/cgj-2016-0104
Ouyang, C., He, S., and Xu, Q. (2015b). Maccormack-tvd Finite Difference Solution for Dam Break Hydraulics over Erodible Sediment Beds. J. Hydraulic Eng. 141, 06014026. doi:10.1061/(asce)hy.1943-7900.0000986
Ouyang, C., He, S., and Tang, C. (2015a). Numerical Analysis of Dynamics of Debris Flow over Erodible Beds in Wenchuan Earthquake-Induced Area. Eng. Geology. 194, 62–72. doi:10.1016/j.enggeo.2014.07.012
Ouyang, C., He, S., Xu, Q., Luo, Y., and Zhang, W. (2013). A Maccormack-Tvd Finite Difference Method to Simulate the Mass Flow in Mountainous Terrain with Variable Computational Domain. Comput. Geosciences 52, 1–10. doi:10.1016/j.cageo.2012.08.024
Ouyang, C., Zhao, W., Xu, Q., Peng, D., Li, W., Wang, D., et al. (2018). Failure mechanisms and characteristics of the 2016 catastrophic rockslide at su village, lishui, china. Landslides 15, 1391–1400. doi:10.1007/s10346-018-0985-1
Ouyang, C., Zhou, K., Xu, Q., Yin, J., Peng, D., Wang, D., et al. (2017). Dynamic Analysis and Numerical Modeling of the 2015 Catastrophic Landslide of the Construction Waste Landfill at Guangming, Shenzhen, china. Landslides 14, 705–718. doi:10.1007/s10346-016-0764-9
Pastor, M., Blanc, T., Haddad, B., Petrone, S., Sanchez Morles, M., Drempetic, V., et al. (2014). Application of a Sph Depth-Integrated Model to Landslide Run-Out Analysis. Landslides 11, 793–812. doi:10.1007/s10346-014-0484-y
Pastor, M., Haddad, B., Sorbino, G., Cuomo, S., and Drempetic, V. (2009). A Depth-Integrated, Coupled SPH Model for Flow-like Landslides and Related Phenomena. Int. J. Numer. Anal. Meth. Geomech. 33, 143–172. doi:10.1002/nag.705
Pirulli, M. (2005). Numerical Modelling of Landslide Runout, a Continuum Mechanics Approach. Politecnico di Torino: Unpublished Ph D Dissertation.
Savage, S. B., and Hutter, K. (1989). The Motion of a Finite Mass of Granular Material Down a Rough Incline. J. Fluid Mech. 199, 177–215. doi:10.1017/s0022112089000340
Scheidegger, A. E. (1973). On the Prediction of the Reach and Velocity of Catastrophic Landslides. Rock Mech. 5, 231–236. doi:10.1007/bf01301796
Tang, C.-L., Hu, J.-C., Lin, M.-L., Angelier, J., Lu, C.-Y., Chan, Y.-C., et al. (2009). The Tsaoling Landslide Triggered by the Chi-Chi Earthquake, Taiwan: Insights from a Discrete Element Simulation. Eng. Geology. 106, 1–19. doi:10.1016/j.enggeo.2009.02.011
Wei, K., Ouyang, C., Duan, H., Li, Y., Chen, M., Ma, J., et al. (2020). Reflections on the Catastrophic 2020 Yangtze River basin Flooding in Southern china. The Innovation 1, 100038. doi:10.1016/j.xinn.2020.100038
Xing, A. G., Wang, G., Yin, Y. P., Jiang, Y., Wang, G. Z., Yang, S. Y., et al. (2014). Dynamic Analysis and Field Investigation of a Fluidized Landslide in Guanling, Guizhou, china. Eng. Geology. 181, 1–14. doi:10.1016/j.enggeo.2014.07.022
Xu, Q., Fan, X., and Dong, X. (2012). Characteristics and Formation Mechanism of a Catastrophic Rainfall-Induced Rock Avalanche-Mud Flow in Sichuan, China, 2010. Landslides 9, 143–154. doi:10.1007/s10346-011-0278-4
Xue, Y., Kong, F., Li, S., Zhang, Q., Qiu, D., Su, M., et al. (2021). China Starts the World's Hardest "Sky-High Road" Project: Challenges and Countermeasures for Sichuan-Tibet Railway. The Innovation 2 (2), 100105. doi:10.1016/j.xinn.2021.100105
Yang, X., and Huang, P. (2021). Restored Relationship between Enso and Indian Summer Monsoon Rainfall Around 1999/2000. The Innovation 2, 100102. doi:10.1016/j.xinn.2021.100102
Yin, Y., Cheng, Y., Liang, J., and Wang, W. (2016). Heavy-rainfall-induced Catastrophic Rockslide-Debris Flow at Sanxicun, Dujiangyan, after the Wenchuan Ms 8.0 Earthquake. Landslides 13, 9–23. doi:10.1007/s10346-015-0554-9
Yin, Y. (2011). Recent Catastrophic Landslides and Mitigation in china. J. Rock Mech. Geotechnical Eng. 3, 10–18. doi:10.3724/sp.j.1235.2011.00010
Yin, Y., Xing, A., Wang, G., Feng, Z., Li, B., and Jiang, Y. (2017). Experimental and Numerical Investigations of a Catastrophic Long-Runout Landslide in Zhenxiong, Yunnan, Southwestern china. Landslides 14, 649–659. doi:10.1007/s10346-016-0729-z
Keywords: zhonghai landslide, landslide zoning, numerical modeling, dynamic process, depth-integrated continuum
Citation: Yang W, Wang F, Tie Y, Wang D and Ouyang C (2021) Characteristics and Dynamic Process Modeling of the Rainfall-Induced Landslide on August 21, 2020 in Hanyuan County, China. Front. Earth Sci. 9:720872. doi: 10.3389/feart.2021.720872
Received: 05 June 2021; Accepted: 27 July 2021;
Published: 12 August 2021.
Edited by:
Jia-wen Zhou, Sichuan University, ChinaReviewed by:
Aiguo Xing, Shanghai Jiao Tong University, ChinaYulong Cui, Anhui University of Science and Technology, China
Copyright © 2021 Yang, Wang, Tie, Wang and Ouyang. This is an open-access article distributed under the terms of the Creative Commons Attribution License (CC BY). The use, distribution or reproduction in other forums is permitted, provided the original author(s) and the copyright owner(s) are credited and that the original publication in this journal is cited, in accordance with accepted academic practice. No use, distribution or reproduction is permitted which does not comply with these terms.
*Correspondence: Chaojun Ouyang, Y2pvdXlhbmdAaW1kZS5hYy5jbg==
†These authors have contributed equally to this work