 Fan Wu
 Wei Zheng1*†
 Zongqiang Liu
95% of researchers rate our articles as excellent or good
Learn more about the work of our research integrity team to safeguard the quality of each article we publish.
Find out more
ORIGINAL RESEARCH article
Front. Earth Sci. , 25 August 2021
Sec. Environmental Informatics and Remote Sensing
Volume 9 - 2021 | https://doi.org/10.3389/feart.2021.720470
This article is part of the Research Topic Application of Satellite Altimetry in Marine Geodesy and Geophysics View all 18 articles
The accurate modeled GNSS-R reflection delay, which is indispensable for the quantification, modeling, and correction of the GNSS-R altimetry sea-state bias, can be obtained based on the accurate modeled position of the specular point. At present, the reflection surface model of the specular point positioning still has the mean dynamic topography (MDT) error and the deviation of the vertical (DOV) error relative to the instantaneous sea surface. In this study, the following studies have been carried out. Based on the ship-borne GNSS-R observations in China seas, we introduced various elevation parameters including the MDT to correct the elevation error of the reflection surface. We introduced the DOV based on the elevation correction, and the DOV correction positioning method was proposed to correct the slope error of the reflection surface. The specular point was positioned on the instantaneous sea reflection surface. We verified the instantaneous sea reflection surface model and the specular point positioning results, analyzed the relationship between the position correction distance and the reflection incident angle, and discussed the spatial distribution characteristics of the MDT correction distance. The results showed that the reflection surface modeling and the specular point positioning were accurate. The positioning error increased to varying degrees with the increase of the reflection incident angle. The MDT correction improved the positioning by 0.91 m, and the DOV correction further improved the positioning by 0.12 m. Based on the combined application of the two kinds of correction positioning, the positioning was comprehensively improved by 0.99 m. The MDT correction of China seas gradually increased from the north to south. While in the regional sea areas, it gradually decreased from the north to south and showed randomness. The relative position between the antennas and their random changes introduced uncertainty, which can be reduced by integration. The new instantaneous sea reflection surface model and the corresponding specular point positioning method can provide accurate modeled reflection delay for the sea-state bias correction of ship-borne GNSS-R observations, and they can be extended to satellite-borne global observations.
GNSS-R altimetry can provide global high-coverage sea surface height (SSH) observations for research on global ocean mesoscale and sub-mesoscale processes and global climate change as an auxiliary means to traditional altimeters (Martín-Neira, 1993; Wu et al., 1998; Stammer et al., 2000; Hajj and Zuffada, 2003; Saynisch et al., 2015; Zuffada et al., 2015; Li et al., 2016; Xie et al., 2018). Due to the waves, the sea surface is rough, skewed, and rapidly changing, especially for the reflection of the GNSS signal considering the wavelength. The signal is not specularly reflected on the sea surface, which leads to the deviation of the specular point position on the reflected power waveform. This deviation introduces bias to the delay of the reflected signal relative to the direct signal, which cannot be ignored for high-precision altimetry (Hajj and Zuffada, 2003; Rius et al., 2010; Yang and Zhang, 2012). Due to the principle of GNSS-R observation and the complexity of sea surface roughness, the quantitative analysis and correction of reflection delay sea-state bias (SSB) has been one of the technical difficulties and constraints to improve the accuracy of GNSS-R altimetry. This is a key problem to be solved for highly accurate SSH retrieval in GNSS-R altimetry satellite missions (Rodriguez, 1988; Rius et al., 2010; Martín-Neira et al., 2011).
Based on the difference between the observation reflection delay and the modeled reflection delay, the SSB is expected to be quantified. The difference can be used as a prior knowledge to construct the empirical parameter model of the SSB, and thus, it can be predicted and compensated. This requires a large number of observations to suppress random errors and to obtain high coverage of the empirical model parameters. On the other hand, obtaining accurate reflection delay based on model calculation is indispensable in the quantification of the SSB. This requires correcting the specular point geometric positioning error introduced by the difference between the modeled sea surface and the instantaneous sea surface. Ship-borne observations have unique advantages for obtaining both observation delay and modeled delay. For modeled delay, the path of the direct and the reflected signals passing through the atmosphere in ship-borne scenario can be considered the same, and no additional delay is caused. The effects of hull’s attitude change such as pitch and roll on observation delay and modeled delay can be considered to be the same and offset. In addition, the voyage of large research vessel (RV) is usually long and the route covers different sea areas, and this can support the study of the spatial distribution characteristics of specular point positioning correction. Based on the ship-borne GNSS-R, we conducted sea surface altimetry experiments in China seas (Gao et al., 2020) and carried out modeling and correction of delay SSB. This article focuses on the important basis for obtaining accurate modeled delay—the research on sea reflection surface modeling and specular point positioning.
The modeling of sea reflection surface has experienced the process of refinement of standard sphere, the earth ellipsoid, the geoid, and the ocean tidal surface (Wu et al., 1997; Wagner and Klokocnok, 2003; Kostelecky et al., 2005; Gleason and Gebre-Egziabher, 2009; Rius et al., 2010; Semmling et al., 2014; Jales and Unwin, 2017; Wu et al., 2019a; Wu et al., 2019b). However, the mean dynamic topography (MDT) error has not been corrected. The mean sea surface (MSS) is the average sea surface height after excluding interannual, semiannual, seasonal, and other periodic sea surface height changes over a longer period of time. The MDT is the fluctuation of the MSS relative to the geoid with a global amplitude of −2 ∼2 m. The MDT is the change of sea surface height caused by the external forces of global average flow field, marine hydrological factors, atmospheric pressure, and other nontidal factors. The most important influence on the MDT is caused by the global average flow field, and its highest point is the west Pacific affected by the Kuroshio (Andersen, 2011; Liu, 2014). In this study, the ship-borne experiment’s route passes through the influence area of the Taiwan warm current and the Yellow Sea warm current, tributaries of the Kuroshio. Furthermore, due to the difference of the earth’s gravity field, the MSS has different slopes relative to the ellipsoid at different locations, that is, the geoid deviation of the vertical (DOV). Martín-Neira’s analysis of the effect of the sea surface slope is based on the assumption that the position of the specular point remains unchanged (Martín-Neira, 1993). The resulting slope error needs to be corrected in the modeling of the sea reflection surface and the positioning of the specular point.
There are differences in the MDT of different oceans and seas. Our RV passed through the Yellow Sea, the East China Sea, and the South China Sea. These sea areas have significant sea surface topography differences (Andersen et al., 2016), which will inevitably lead to different specular point positioning corrections. Understanding the spatial distribution characteristics of the position correction distance can help develop targeted strategies of postprocessing and positioning error correction in different sea areas. This study provides a regional approach to acquire this prior knowledge, and it is expected to be extended to satellite-borne global observations.
In this study, we used ship-borne GNSS-R observations in China seas. Based on the geoid and the ocean tidal reflection surface model constructed in our previous research, we sequentially introduced the MDT and the DOV to correct the elevation error and the slope error with the corresponding specular point positioning method. The specular point is finally positioned on the instantaneous sea surface, and the positioning accuracy is improved. This study has laid the foundation for obtaining accurate modeled reflection delay and for the quantification and correction of the SSB. Data and Model introduces the ship-borne data and the geophysical models used, Methodologies introduces the reflection surface modeling and the specular point positioning methods, Results and Discussion discusses the results of the positioning, and Conclusion summarizes and prospects.
We carried Xiang Yang Hong 06 RV and used GNSS-R equipment to carry out a 3-week sea surface altimetry experiment. The route traverses most areas of China seas, including the Yellow Sea, the East China Sea, and the South China Sea. The hardware of the GNSS-R receiver system mainly included two antennas and a GNSS IF raw-data recorder. The up-looking antenna received the direct GPS/BDS signals, and the down-looking antenna received the signals reflected from the sea surface. The GNSS-R antennas are about 12 m high from the water surface. Figure 1 shows the side-section geometry of the ship-borne GNSS-R antennas. The center line of the up-looking antenna is vertical. The down-looking antenna is installed under the direct antenna, pointing diagonally downward to the sea surface. The angle γ between the center lines of the down-looking antenna and the up-looking antenna is 150°. The distance d between the two antennas’ phase centers is 0.283 m. We randomly selected 17,000 samples.
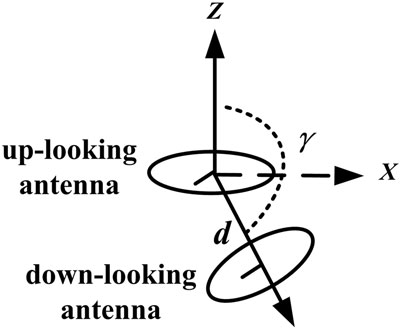
FIGURE 1. The side-section geometry of the ship-borne GNSS-R antennas.
The positioning of the specular point is based on the GNSS position, the position of the GNSS-R antenna, and the reflection surface. We regarded the phase centers of the direct antenna and the reflection antenna as one same position. The position is calculated from the geodetic coordinates of the ship-borne GNSS navigation antenna combined with the relative position of the navigation antenna and the GNSS-R equipment in the hull coordinate system. The relative position of the two is calculated by their coordinates in the hull coordinate system measured by the total station. The bow direction is the ship’s geodetic coordinate at the sampling time pointing to the ship’s next geodetic coordinate. The GNSS position is obtained from the ephemeris file.
The instantaneous sea reflection surface model is constructed by introducing a series of geophysical parameters into the earth ellipsoid. The used geophysical models included the geoid undulation of the EGM2008 model, the ocean tidal heights of the TPXO model, and the DTU15 MDT elevations. On this basis, we introduced the DOV from the GGMPlus gravitational field to correct the sea surface slope errors.
The EGM2008 model order is up to 2,159, equivalent to a spatial resolution of about 5′ × 5′. The commission error of the geoid undulation in the ocean area where the latitude is less than 66° is 5.8 cm. The commission error implied by EGM2008 geoid undulation. We used the highest spatial resolution product which is interpolated to a 1′ × 1′ grid, and the difference of interpolated values from those obtained via harmonic synthesis does not exceed ± 1 mm (Pavlis and Saleh, 2005; Pavlis et al., 2012).
The TPXO tidal model has performed harmonic analysis along the track on the altimetry data of satellites and incorporates data of tide gauge and satellites in the shallow water areas. The nonlinear 1/4-period day tidal constituent has also been considered to improve the accuracy in the offshore. High-resolution regional assimilation models are developed and added to TPXO global model calculation result with a resolution of 1/6°. These regions are mainly closed and semienclosed oceans, and most of the continental parts shelve coastal areas. The resolution in China seas is 1/30°. TPXO also uses the 1′ bathymetric data in available offshore areas to improve accuracy and spatial resolution (Egbert et al., 1994; Egbert and Ray, 2000; Egbert and Erofeeva, 2002). The average deviation between TPXO and the Global Ocean Tide (GOT) Model is 0.25 cm, and the standard deviation and the RMSE are both approximately 1.5 cm (Liu, 2014). The RMSE of the main tidal constituents of TPXO in China seas is of centimeter level (Wang et al., 2010). The TPXO model is suitable for our high-resolution ship-borne experiments which were mainly carried out in offshore.
The DTU15 MDT is obtained from the MSS height based on the satellite data from 1993 to 2015 minus the EGM2008 geoid fluctuation, with a spatial resolution of 1′ × 1′. In the study area, the short-wavelength residual MDT signal in the DTU15 MDT associated with EGM2008 ranges within ± 5 cm (Andersen et al., 2019). The difference between the MSS DTU15 and CNES15 models in the study area is basically within the range of ± 2 cm (Andersen et al., 2015).
The GGMplus model is a synthesis of GRACE and GOCE satellite gravity and EGM2008 and short-wave terrain gravity, with a spatial resolution of 0.002°, approximately 220 m. The DOV data include meridian component and prime component, and the accuracy is about one arc-second (Hirt et al., 2013).
GNSS orbital information is obtained from GNSS ephemeris files provided by the International GNSS Service (IGS) (Montenbruck et al., 2017). Unless otherwise specified, the position information used in this study is based on the ECEF WGS-84 coordinate system.
The modeled reflection path of GNSS-R starts from the GNSS transmitter to the specular point on the modeled reflection surface and then to the receiver’s antenna. For the modeled reflection delay, the elevation and the slope of the reflection surface determine the position of the specular point and then determine the modeled reflection path. In order to obtain the modeled reflection delay without sea-state error, it is necessary to construct an ideal smooth sea surface model with the elevation and the slope close to the instantaneous sea surface at the moment and the position of the specular point. We introduced the geophysical parameters that are one order of magnitude lower than the delay SSB or more into the reflection surface modeling (see Geophysical Models). In the previous research, we have gradually constructed the geoid reflection surface model and the ocean tidal reflection surface model. On this basis, we further introduced the MDT and the DOV to correct the elevation and slope errors. We constructed the instantaneous sea reflection surface model and positioned the specular point on it.
The modeling of the sea reflection surface is realized in the process of specular point positioning. The specular point is initially positioned on the reference ellipsoid to obtain its initial longitude l and latitude b, and the elevation is 0 (Wu et al., 1997). In the process of transforming geodetic coordinates to space coordinates, we introduced the geophysical parameter elevation at the position and the time of the specular point (Wu et al., 2019a). The spatial coordinate of the specular point is shown in
where HG, HT, and HMDT are the geoid undulation, the ocean tidal height, and the MDT elevation of the specular point.
The correction distance of the positioning accuracy of the MDT correction DMDT is the distance between the specular points before and after the MDT correction, given as follows:
The essence of the DOV correction is to use the prime component η and the meridian component ζ as the correction to correct the normal direction of the specular point successively. In the space coordinate system, we corrected the ellipsoid normal direction (x1, y1, z1) to the geoid normal direction (x2, y2, z2) to correct the reflection geometry and the position of the specular point. The steps are as follows:
(1) η correction: solving |x2′| and |y2′| in plane XOY.
When η > 0 and x1y1 > 0, or when η < 0 and x1y1 < 0, as shown in Figure 2A, there are
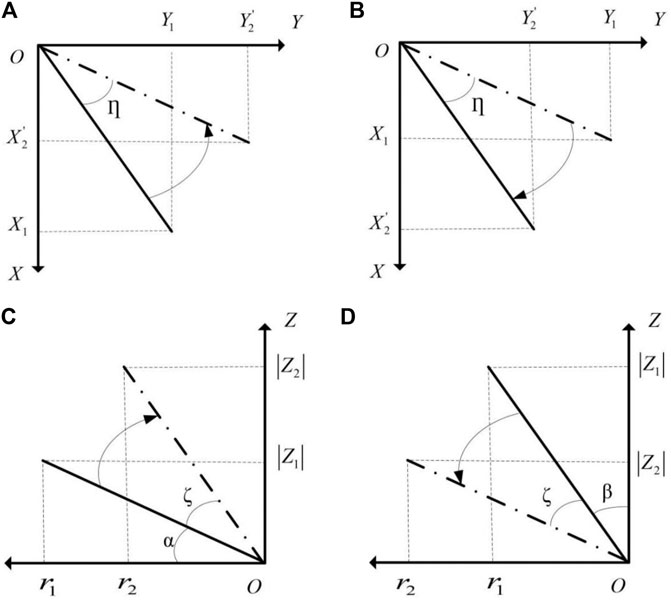
FIGURE 2. The DOV correction geometry.
When η < 0 and x1y1 > 0, or when η > 0 and x1y1 < 0, as shown in Figure 2B, there are
(2) ζ correction: solving |x2|, |y2|, and |z2| in plane XOY.
When ζ < 0 and z1 < 0, or when ζ> 0 and z1 > 0, as shown in Figure 2C, there are
where r is the modulo of the ellipsoid normal. Also,
When ζ > 0 and z1 < 0, or when ζ< 0 and z1 > 0, as shown in Figure 2D, there are
We obtained the geoid normal (x2, y2, z2) based on the above calculation. We used the nonapproximate normal projection correction method in the following correction. By directly solving the spatial geometric relationship between the projection of the normal on the plane and the reflection path, the specular point is corrected to the vertical plane of the geoid. The positioning error caused by the radial normal difference is reduced, and the influence of approximate substitution is reduced (Wu et al., 2019a). The positioning accuracy is further improved towards normal direction.
The average MDT elevation of our samples is 0.66 m, the maximum is 0.70 m, and the minimum is 0.58 m. In the space coordinate system, the correction distance is 0.91 m. The average error of the DTU15 MDT at the specular point is 2.67 cm. We calculated the difference between the specular point positions before and after adding the MDT error, and the mean value is 3.57 cm. The correction distance in the X, Y, and Z directions are −0.36, 0.53, and 0.18 m, respectively, and the corresponding modulus are 0.46, 0.53, and 0.39 m, respectively.
The GGMplus DOV data do not cover all the global oceans. There are 4,246 samples with DOV data. The average values of the prime components and the meridian components of the DOV are −0.0023° and 0.0012°, respectively. In the space coordinate system, the correction distance is 0.12 m. The error of the DOV model is one arc-second (Hirt et al., 2013). We calculated the difference between the positions before and after adding the one arc-second DOV error. The mean value of the difference is 1.96 cm. In the X, Y, and Z directions, the correction distances are −0.04, −0.03, and −0.02 m, respectively, and the moduli of the correction distance are 0.04, 0.03, and 0.04 m, respectively.
We combined the MDT and DOV correction positioning, and the comprehensive positioning correction distance is the final position compared to the position without these two kinds of corrections. For the samples with the DOV data, the combined correction distance is 0.99 m in the space coordinate system. We calculated the difference between the positions of the specular points before and after adding the MDT error and the DOV error, and the mean value is 5.23 cm. In the X, Y, and Z directions, the correction distances are −0.48, 0.47, and 0.14 m, and the moduli of the correction distance are 0.57, 0.49, and 0.40 m, respectively.
Figure 3 shows the specular point positioning correction distance of the MDT correction DMDT and the corresponding reflection incident angle θ. It can be seen that the θ of most segments changes from large to small and then to large, which is the usual process of GNSS-R equipment from being visible to invisible to a GNSS satellite. And, some of the θ changes from small to large and then to small, which is another relative motion mode. The change of DMDT is very consistent with θ for almost all the segments.
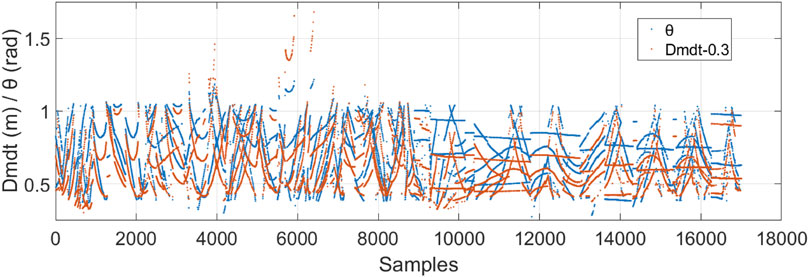
FIGURE 3. DMDT and the corresponding θ.
In order to further verify the corrected positioning result based on the instantaneous sea reflection surface model, DMDT is compared with the simulated positioning correction distance DMDT’. Figure 4 shows the elevation correction geometry of the reflection surface and we can have DMDT′ = HMDT/cosθ. SP is the specular point before correction, and SP’ is the corrected specular point. θ ranges from approximately 15° to approximately 70° in this study.
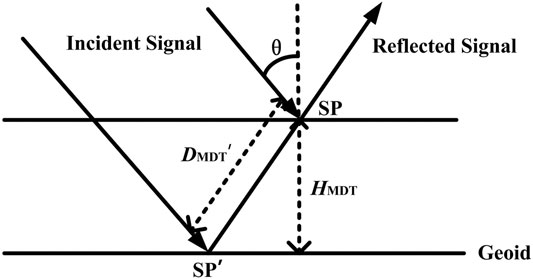
FIGURE 4. Elevation correction geometry of the reflection surface.
We calculated |ΔDMDT| = |DMDT’—DMDT|, and the average value is 1.09 m × 10–4 m, the standard deviation is 2.29 m × 10–4 m, and DMDT is very close to DMDT’. The correlation coefficient between DMDT and DMDT’ is 97.66%. Figure 5 shows the fitted straight line of DMDT and DMDT’, the slope is 1.004 ± 0.003, SSE of the fitted straight line is 19.98, and the RMSE is 3.43 × 10⁻², which are small. The correlation does not decrease significantly with the increase of DMDT or DMDT’. We arranged DMDT and DMDT’ in the ascending order of θ, and the correlation between DMDT and DMDT’ is 99.95%. Since the two are very similar, Figure 6 shows DMDT (the blue dots) and mean (HMDT)/cosθ (the red curve) in order to distinguish their trends of change. It can be seen that the changing trends of DMDT and mean (HMDT)/cosθ are very consistent and θ is the main influencing factor of DMDT. On the far right side of Figure 6, a small number of samples have large θ, resulting in large DMDT, which is consistent with the mean (HMDT)/cosθ of the corresponding θ. The above results have verified the high accuracy of the MDT correction positioning.
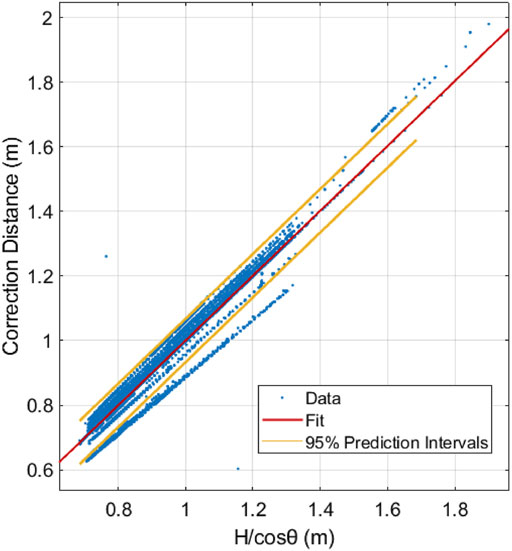
FIGURE 5. DMDT, DMDT’, and their fitted straight line; the X-axis is DMDT’ and the Y-axis is DMDT.
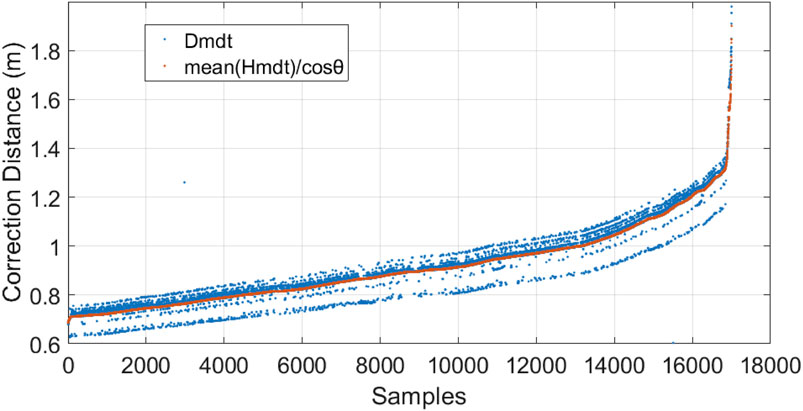
FIGURE 6. DMDT (the blue dots) and mean (HMDT)/cosθ arranged in the ascending order of θ.
We arranged ΔDMDT in the ascending order of θ, as shown in Figure 7. ΔDMDT is centered at 0 and has the characteristics of positive and negative symmetrical distributions. After approximately the 10,000th sample, as θ increases, ΔDMDT increases. This is because as θ increases, the reflection path lengthens and hence the uncertainty introduced by the relative position between the antennas and their change increases. The symmetry feature gradually disappears after approximately the 10,000th sample; this is because large θ introduces additional increase in ΔDMDT. The symmetry feature still exists after approximately the 15,000th sample, and it can be considered that this symmetrical distribution feature exists in the entire reflection incident angle range covered by the sampling. We arranged |ΔDMDT| in the ascending order of θ and performed linear fitting, as shown in Figure 8. The trend of |ΔDMDT| increases with θ. A small number of samples near the minimum and the maximum values of θ correspond to larger deviations.
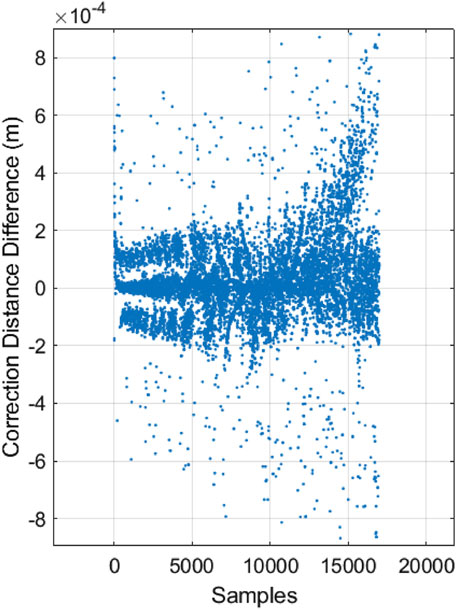
FIGURE 7. ΔDMDT arranged in the ascending order of θ.
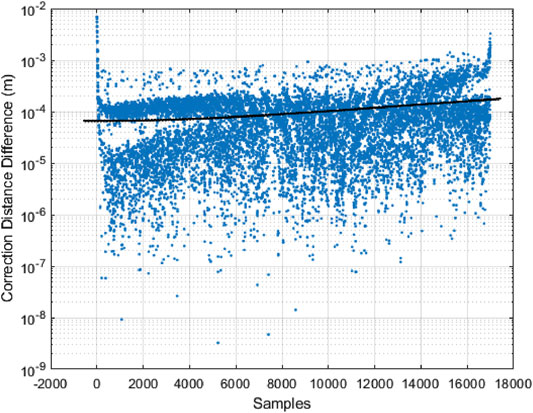
FIGURE 8. |ΔDMDT| arranged in the ascending order of θ and its linear fitting.
The DOV correction distance DDOV is arranged in the ascending order of θ (see Figure 9). DDOV shows an increasing trend with the increase of θ, but it is not so consistent with the change of θ like DMDT. For the samples of a single track, in the incident plane, when θ increases, the increasing direction of θ is not necessarily the same as the changing direction of the normal of the incident plane. When the two directions are consistent, DDOV will increase with θ; otherwise, DDOV will decrease. Therefore, the change of DDOV with θ has randomness. The comprehensive position correction distance DMDT+DOV is the distance between the specular points with and without the MDT and the DOV correction. DMDT+DOV is arranged in the ascending order of θ as shown in Figure 10. DMDT+DOV and θ generally have the same trend but are not completely consistent. As introduced above, the inconsistency is introduced by the randomness of DDOV relative to θ.
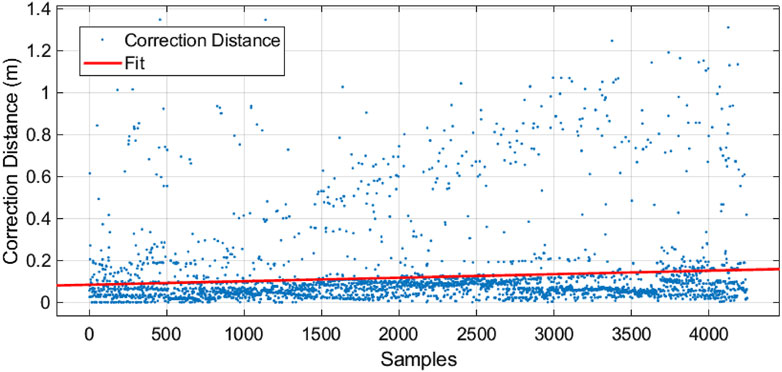
FIGURE 9. DDV arranged in the ascending order of θ and its linear fitting.
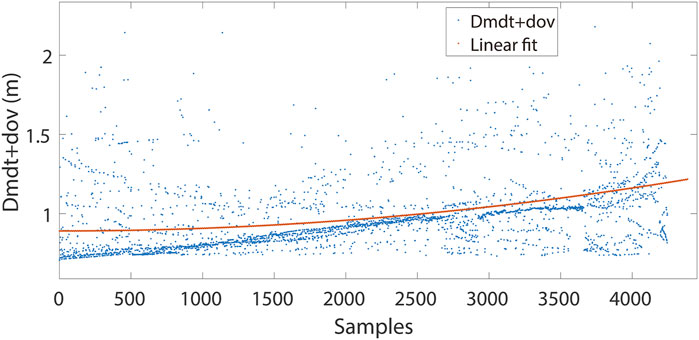
FIGURE 10. DMDT+DOV arranged in the ascending order of θ and its linear fitting.
The HMDT and DMDT in China seas covered by the sampling (17°N ∼ 35°N) show a gradual increase from the north to south (see Figure 11 and Figure 12). For both HMDT and DMDT, the Yellow Sea is the lowest, the East China Sea is higher, and the South China Sea is the highest (see Table 1). In the two sea areas from the southern part of the Yellow Sea to the northern part of the East China Sea (32°N ∼ 35°N) and the northern part of the South China Sea (17°N ∼ 21°N), both HMDT and DMDT show a gradual decrease from the north to south. They increase near Xiamen and reach maximum in the sea area from 20°N to 21°N of the South China Sea. In the South China Sea, where the sampling coverage of latitude and longitude are both high, HMDT and DMDT have a tendency to gradually decrease from the northwest to southeast (away from the coast in the northwest). In the entire China seas and some regional seas, DMDT is consistent with the trend of HMDT.
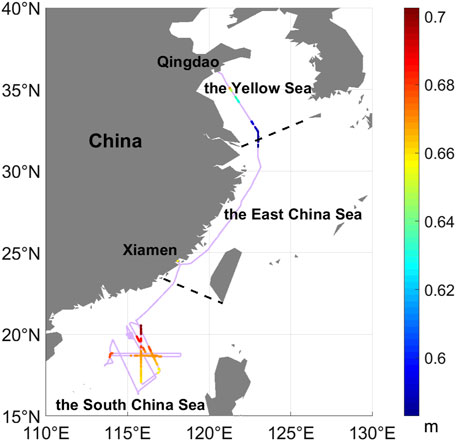
FIGURE11. Track of Xiang Yang Hong 06 (the pink curve) and the HMDT along the track.
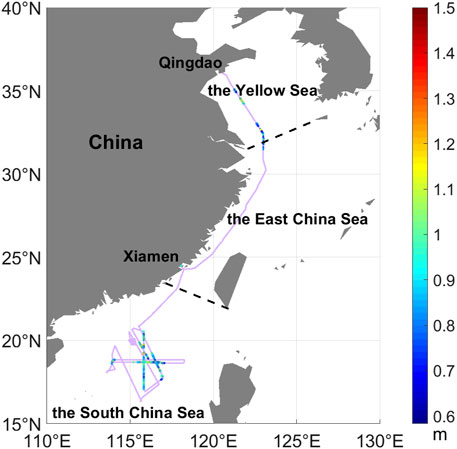
FIGURE 12. Track of Xiang Yang Hong 06 (the pink curve) and the DMDT along the track.
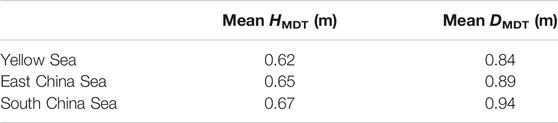
TABLE 1. The average values of HMDT and DMDT in different sea areas in China seas.
HMDT changes monotonously and smoothly in the entire China seas and the regional sea areas. Different from HMDT, the partial spatial variation of DMDT presents randomness. This feature is more obvious in the northern part of the South China Sea (17°N ∼ 21°N) where the sampling coverage of latitudes and longitudes are both high. The randomness of the spatial distribution of DMDT is due to the fact that in addition to HMDT, the determinants also include the reflection incident angle, the distance between the transmitter and the specular point, and the distance between the specular point and the down-looking antenna. For a continuous sample sequence of the same GNSS satellite, the abovementioned parameters in the reflection geometry are also continuously changing, and this change will cause the DMDT of the sequence to have monotonicity. The sequences with different monotonicities are intersected and connected to form the entire measurement segments along the track as shown in Figure 12. This makes the overall spatial variation of the segments of DMDT present randomness. We believe that this feature is also present in the satellite measurement segments. In addition, there is a distance between the up-looking antenna and the down-looking antenna. The relative position of the two antennas changes with the incident plane, the incident angle, and the hull attitude. The uncertainty introduced to the model reflection geometry is estimated to be in the order of decimeters, and it introduces random errors to the correction positioning result. The impact on the MDT model near the coast may introduce errors in the correction results. In the DTU15 MDT error map, the error near Xiamen does not increase significantly compared with other parts of the study area, and the number of samples in Xiamen is small, so this will not be the main source of error.
Accurate modeled reflection delay is indispensable for quantifying and correcting GNSS-R sea-state bias. Constructing an accurate instantaneous sea reflection surface model is the key to improve the accuracy of the modeled reflection delay. The MDT and the DOV are nonnegligible errors in the reflection surface modeling and need to be corrected. Based on the geoid and the ocean-tidal reflection surface model, this study has introduced the MDT to further correct the elevation error of the reflection surface model. Then, the DOV is introduced to correct the slope error of the reflection surface model, and the corresponding specular point positioning method is proposed. The specular point is finally positioned on the instantaneous sea surface.
The MDT positioning correction distance is very consistent with the geometric simulation result, the model, and the positioning accuracy. The MDT correction improves the positioning accuracy by 0.91 m, and the DOV correction further improves the positioning accuracy by 0.12 m. Based on the combined application of the two kinds of correction, the positioning accuracy is improved by 0.99 m. The MDT correction positioning error increases with the reflection incident angle. It is presumed that the relative position between the antennas and their change introduces greater uncertainty as the reflection incident angle increases. The correlation between the DOV correction positioning error and the reflection incident angle decreased compared to the MDT correction. This is because the difference between the direction of the DOV and that of the increase in the reflection incident angle introduces randomness. The positioning correction distance by the combined application of the two kinds of correction is consistent with the overall trend of the reflection incident angle. The MDT correction distance of China seas gradually increases from the north to south, the Yellow Sea being the lowest, the East China Sea being higher, and the South China Sea being the highest. In some partial sea areas, the MDT correction distance gradually decreases from the north to south. The MDT correction distance presents randomness locally. The randomness is introduced by the intersection between measurement segments of different GNSS satellites and the random changes of the relative position of the GNSS-R antennas. The distance between the antennas can be effectively reduced by hardware integration.
The instantaneous sea reflection surface model constructed in this study is expected to be applied to satellite GNSS-R sea surface altimetry to provide accurate modeled reflection delay for the separation, quantification, and modeling correction of sea-state bias. We hope to build a gridded global two-dimensional reflection surface model based on satellite observations, which can be directly used to position the specular points. The issues of interpolation and griding will be discussed in depth.
The original contributions presented in the study are included in the article/supplementary materials; further inquiries can be directed to the corresponding authors.
FW was responsible for the study design, data processing, scientific analysis, and manuscript writing. WZ took part in project management and manuscript modification. ZL and XS were involved in data processing. All authors contributed to the article and approved the submitted version.
This study was supported by the National Nature Science Foundation of China (41774014 and 41574014), the Liaoning Revitalization Talents Program (Grant XLYC2002082), the Frontier Science and Technology Innovation Project (085015) of the Central Military Commission, the Innovation Workstation Project of the Science and Technology Commission of the Central Military Commission, the Outstanding Youth Foundation of the China Academy of Space Technology, and the Independent Research and Development Start-Up Fund of Qian Xuesen Laboratory of Space Technology (Y-KC-WY-99-ZY-000-025).
The authors declare that the research was conducted in the absence of any commercial or financial relationships that could be construed as a potential conflict of interest.
All claims expressed in this article are solely those of the authors and do not necessarily represent those of their affiliated organizations, or those of the publisher, the editors and the reviewers. Any product that may be evaluated in this article, or claim that may be made by its manufacturer, is not guaranteed or endorsed by the publisher.
The ship-borne data were provided by the Institute of Space Science, Shandong University. The EGM2008 geoid undulation data is available on NGA website (http://earth-info.nga.mil/GandG/wgs84/gravitymod/egm2008/egm08_wgs84.html). The TPXO model is available on the server of Oregon State University (ftp://ftp.oce.orst.edu/pub/lana/TPXO8_atlas_30_v0/). The DTU15 model is available on the serve of National Space Institute of DTU (https://ftp.space.dtu.dk/pub/DTU15/). The GGMPlus DV data is available on the serve of Curtin University (http://ddfe.curtin.edu.au/gravitymodels/GGMplus/data/). The GNSS ephemeris is available on the IGS website (https://www.igs.org/).
Andersen, B. (2011). Range and Geophysical Corrections in Coastal Regions: And Implications for Mean Sea Surface Determination, Volume Coastal Altimetry. Technical University of Denmark Springer, 103–146. ISBN: 978-3-642-12795-3.
Andersen, B., Stenseng, L., Piccioni, G., and Knudsen, P. (2016). The DTU15 MSS (Mean Sea Surface) and DTU15 LAT (Lowest Astronomical Tide) Reference Surface. Prague, Czech: ESA Living Planet Symposium.
Andersen, O. B., Knudsen, P., Kenyon, S., Holmes, S., and Factor, J. K. (2019). “Evaluation of the Global Altimetric marine Gravity Field DTU15: Using marine Gravity and GOCE Satellite Gravity,” in International Association of Geodesy Symposia, 77–81. doi:10.1007/1345_2018_52
Andersen, O., Knudsen, P., and Stenseng, L. (2015). The DTU13 MSS (Mean Sea Surface) and MDT (Mean Dynamic Topography) from 20 Years of Satellite Altimetry. Int. Assoc. Geodesy Symposia 144, 111–121. doi:10.1007/1345_2015_182
Egbert, G. D., Bennett, A. F., and Foreman, M. G. G. (1994). TOPEX/Poseidon Tides Estimated Using a Global Inverse Model. J. Geophys. Res. 99 (C12), 24821–24852. doi:10.1029/94jc01894
Egbert, G. D., and Erofeeva, S. Y. (2002). Efficient Inverse Modeling of Barotropic Ocean Tides. J. Atmos. Oceanic Technol. 19 (2), 183–204. doi:10.1175/1520-0426(2002)019<0183:eimobo>2.0.co;2
Egbert, G. D., and Ray, R. D. (2000). Significant Dissipation of Tidal Energy in the Deep Ocean Inferred from Satellite Altimeter Data. Nature 405 (6788), 775–778. doi:10.1038/35015531
Gao, F., Xu, T., Wang, N., He, Y., and Luo, X. (2020). A Shipborne experiment Using a Dual-Antenna Reflectometry System for GPS/BDS Code Delay Measurements. J. Geodesy 94, 88. doi:10.1007/s00190-020-01421-4
Gleason, S., and Gebre-Egziabher, D. (2009). GNSS Applications and Methods. Norwood, MA, USA: Artech House, 53–71.
Hajj, G. A., and Zuffada, C. (2003). Theoretical Description of a Bistatic System for Ocean Altimetry Using the GPS Signal. Radio Sci. 38 (5), 1–10. doi:10.1029/2002RS002787
Hirt, C., Claessens, S., Fecher, T., Kuhn, M., Pail, R., and Rexer, M. (2013). New Ultrahigh-Resolution Picture of Earth's Gravity Field. Geophys. Res. Lett. 40 (16), 4279–4283. doi:10.1002/grl.50838
Jales, P., and Unwin, M. (2017). MERRByS Product Manual—GNSS Reflectometry on TDS-1 with the SGR-ReSI. Guildford, UK: Surrey Satellite Technology LTD.
Kostelecký, J., Klokočník, J., and Wagner, C. A. (2005). Geometry and Accuracy of Reflecting Points in Bistatic Satellite Altimetry. J. Geodesy 79, 421–430. doi:10.1007/s00190-005-0485-7
Li, Z., Zuffada, C., Lowe, S. T., Lee, T., and Zlotnicki, V. (2016). Analysis of GNSS-R Altimetry for Mapping Ocean Mesoscale Sea Surface Heights Using High-Resolution Model Simulations. IEEE J. Sel. Top. Appl. Earth Observations Remote Sensing 9 (10), 4631–4642. doi:10.1109/JSTARS.2016.2581699
Liu, Y. (2014). Calibration Technology for HY-2 Radar Atimeter Sea Surface Height. Ph.D. Thesis. Qingdao, China: Ocean University of China.
Martín-Neira, M. (1993). A Passive Reflectometry and Interferometry System (PARIS): Application to Ocean Altimetry. ESA J. 17, 331–355.
Martín-Neira, M., D'Addio, S., Buck, C., Floury, N., and Prieto-Cerdeira, R. (2011). The PARIS Ocean Altimeter In-Orbit Demonstrator. IEEE Trans. Geosci. Remote Sensing 49 (6), 2209–2237. doi:10.1109/TGRS.2010.2092431
Montenbruck, O., Steigenberger, P., Prange, L., Deng, Z., Zhao, Q., Perosanz, F., et al. (2017). The Multi-GNSS Experiment (MGEX) of the International GNSS Service (IGS) - Achievements, Prospects and Challenges. Adv. Space Res. 59 (7), 1671–1697. doi:10.1016/j.asr.2017.01.011
Pavlis, N. K., Holmes, S. A., Kenyon, S. C., and Factor, J. K. (2012). The Development and Evaluation of the Earth Gravitational Model 2008 (EGM2008). J. Geophys. Res. 117, a–n. doi:10.1029/2011JB008916
Pavlis, N. K., and Saleh, J. (2005). Error Propagation with Geographic Specificity for Very High Degree Geopotential Models. Gravity, Geoid and Space Missions 129, 149–154. doi:10.1007/3-540-26932-0_26
Rius, A., Cardellach, E., and Martín-Neira, M. (2010). Altimetric Analysis of the Sea-Surface GPS-Reflected Signals. IEEE Trans. Geosci. Remote Sensing 48 (4), 2119–2127. doi:10.1109/TGRS.2009.2036721
Rodríguez, E. (1988). Altimetry for Non-Gaussian Oceans: Height Biases and Estimation of Parameters. J. Geophys. Res. 93 (C11), 14107–14120. doi:10.1029/jc093ic11p14107
Saynisch, J., Semmling, M., Wickert, J., and Thomas, M. (2015). Potential of Space-Borne GNSS Reflectometry to Constrain Simulations of the Ocean Circulation. Ocean Dyn. 65 (11), 1441–1460. doi:10.1007/s10236-015-0886-y
Semmling, A. M., Beckheinrich, J., Wickert, J., Beyerle, G., Schön, S., Fabra, F., et al. (2014). Sea Surface Topography Retrieved from GNSS Reflectometry Phase Data of the GEOHALO Flight mission. Geophys. Res. Lett. 41, 954–960. doi:10.1002/2013GL058725
Stammer, D., Wunsch, C., and Ponte, R. M. (2000). De-aliasing of Global High Frequency Barotropic Motions in Altimeter Observations. Geophys. Res. Lett. 27 (8), 1175–1178. doi:10.1029/1999GL011263
Wagner, C., and Klokocnok, J. (2003). The Value of Ocean Reflections of GPS Signals to Enhance Satellite Altimetry: Data Distribution and Error Analysis. J. Geodesy 77, 128–138. doi:10.1007/s00190-002-0307-0
Wang, Y., Fang, G., Wei, Z., Wand, Y., and Wang, X. (2010). Accuracy Assessment of Global Ocean Tide Models Base on Satellite Altimetry. J. Adv. Earth Sci. 25 (4), 353–362. doi:10.11867/j.issn.1001-8166.2010.04.0353
Wu, F., Zheng, W., Li, Z., and Liu, Z. (2019a). Improving the GNSS-R Specular Reflection Point Positioning Accuracy Using the Gravity Field Normal Projection Reflection Reference Surface Combination Correction Method. Remote Sensing 11 (1), 33. doi:10.3390/rs11010033
Wu, F., Zheng, W., Li, Z., and Liu, Z. (2019b). Improving the Positioning Accuracy of Satellite-Borne GNSS-R Specular Reflection point on Sea Surface Based on the Ocean Tidal Correction Positioning Method. Remote Sensing 11 (13), 1626. doi:10.3390/rs11131626
Wu, S.-C., Meechan, T., and Young, L. (1997). The Potential Use of GPS Signals as Ocean Altimetry Observation. Santa Monica, CA, USA: the National Technical Meeting. doi:10.2118/97-05 Available at: http://hdl.handle.net/2014/21658
Wu, S. C., Romans, L. J., and Young, L. E. (1998). “A Novel GPS-Based Sensor for Ocean Altimetry,” in IEEE 1998 International Geoscience and Remote Sensing Symposium (IGARSS), Seattle, WA, USA, 6-10 July 1998 (IEEE). doi:10.1109/IGARSS.1998.703723
Xie, J., Bertino, L., Cardellach, E., Semmling, M., and Wickert, J. (2018). An OSSE Evaluation of the GNSS-R Altimetry Data for the GEROS-ISS mission as a Complement to the Existing Observational Networks. Remote Sensing Environ. 209, 152–165. doi:10.1016/j.rse.2018.02.053
Yang, D., and Zhang, Q. (2012). GNSS Reflected Signal Processing: Fundamentals and Applications. Beijing, China: Publishing House of Electronics Industry. ISBN: 978-7-121-16752-2.
Zuffada, C., Li, Z., Nghiem, S. V., Lowe, S., Shah, R., Clarizia, M. P., and Cardellach, E. (2015). “The Rise of GNSS Reflectometry for Earth Remote Sensing,” in IEEE 2015 International Geoscience and Remote Sensing Symposium (IGARSS), Milan, Italy, 26-31 July 2015 (IEEE), 5111–5114. doi:10.1109/IGARSS.2015.7326983
Keywords: global navigation satellite system-reflectometry, specular point positioning, instantaneous sea reflection surface model, mean dynamic topography, deviation of the vertical, China seas, sea state bias
Citation: Wu F, Zheng W, Liu Z and Sun X (2021) Improving the Specular Point Positioning Accuracy of Ship-Borne GNSS-R Observations in China Seas Based on Comprehensive Geophysical Correction. Front. Earth Sci. 9:720470. doi: 10.3389/feart.2021.720470
Received: 04 June 2021; Accepted: 20 July 2021;
Published: 25 August 2021.
Edited by:
Jinyun Guo, Shandong University of Science and Technology, ChinaCopyright © 2021 Wu, Zheng, Liu and Sun. This is an open-access article distributed under the terms of the Creative Commons Attribution License (CC BY). The use, distribution or reproduction in other forums is permitted, provided the original author(s) and the copyright owner(s) are credited and that the original publication in this journal is cited, in accordance with accepted academic practice. No use, distribution or reproduction is permitted which does not comply with these terms.
*Correspondence: Fan Wu, d3VmYW5AcXhzbGFiLmNu; Wei Zheng, emhlbmd3ZWkxQHF4c2xhYi5jbg==
†These authors have contributed equally to this work
Disclaimer: All claims expressed in this article are solely those of the authors and do not necessarily represent those of their affiliated organizations, or those of the publisher, the editors and the reviewers. Any product that may be evaluated in this article or claim that may be made by its manufacturer is not guaranteed or endorsed by the publisher.
Research integrity at Frontiers
Learn more about the work of our research integrity team to safeguard the quality of each article we publish.