 Yanfu Pi
 Jinxin Liu
 Li Liu1
95% of researchers rate our articles as excellent or good
Learn more about the work of our research integrity team to safeguard the quality of each article we publish.
Find out more
ORIGINAL RESEARCH article
Front. Earth Sci. , 03 September 2021
Sec. Economic Geology
Volume 9 - 2021 | https://doi.org/10.3389/feart.2021.711695
This article is part of the Research Topic New Advances in Geology and Engineering Technology of Unconventional Oil and Gas View all 24 articles
CO2 miscible flooding is an important technology for enhancing oil recovery and greenhouse gas storage in the world. As a tertiary recovery technology, it is usually applied after water flooding. Therefore, the actual reservoirs usually contain a lot of injected water in addition to connate water. The salinity of these formation waters varies from place to place. CO2 is an acid gas. After it is injected into the reservoir, it easily reacts with formation water and rock and affects the physical properties of the reservoir. However, no research results have been reported whether this reaction affects the minimum miscibility pressure (MMP) of CO2-crude oil, a key parameter determining miscible flooding in formation water. Based on CO2-formation water–rock interaction experiments, this paper uses the core flooding method to measure the CO2-crude oil MMP under different salinity in formation water. Results show that CO2 causes a formation water pH decrease from 7.4 to 6.5 due to its dissolution in formation water. At the same time, CO2 reacts with formation water, albite, potassium feldspar, and carbonate minerals in the cores to generate silicate and carbonate precipitates, which could migrate to the pore throat together with the released clay particles. Overall, CO2 increased core porosity by 5.63% and reduced core permeability by 7.43%. In addition, when the salinity of formation water in cores was 0, 4,767, and 6,778 mg/L, the MMP of CO2-crude oil was 20.58, 19.85, and 19.32 MPa, respectively. In other words, the MMP of CO2-crude oil decreased with the increase of salinity of formation water.
CO2 flooding is an effective method to improve oil recovery. There are two displacement modes: CO2 miscible flooding and CO2 immiscible flooding, depending on whether the reservoir pressure can reach the minimum miscible pressure (MMP) of CO2-crude oil (Zhang et al., 2019; Syed et al., 2020; Han et al., 2018; Jishun et al., 2015). CO2 miscible flooding can result in much higher oil recovery than CO2 immiscible flooding because the miscible condition can reduce capillary pressure to zero, and residual oil can be significantly reduced in flooded areas/zones. Therefore, MMP, which determines whether the reservoir oil and CO2 are miscible or not, is particularly important.
At present, studies on the influencing factors of MMP mainly focus on CO2 purity (Cumicheo et al., 2014; Zhao et al., 2020; Cumicheo et al., 2014), oil composition (Dong et al., 2001; Hemmati-Sarapardeh et al., 2014; Yalcin and Faruk, 2020), temperature, and pressure (Zolghadr et al., 2013; Jamiu, 2013; Jia et al., 2019; Moeini et al., 2014). In fact, the reservoir is usually flooded by water before CO2 injection, and inevitably, there is connate and injected water with different salinity in formation. As a highly active gas, CO2 easily reacts with formation water after being injected into a reservoir (Ampomah et al., 2017; Ren et al., 2019). It can impact the physico-chemical balance between reservoir rock and formation water and result in a change in the reservoir rock’s physical properties. However, no research has been reported about whether and how the interactions affect the MMP for the formations with different water salinity.
Both theoretical calculation and laboratory experimental methods have been used to obtain the MMP of CO2-crude oil (Zendehboudi et al., 2013; Ahmadi et al., 2015; Ahmadi et al., 2017; Ahmadi et al., 2018). Theoretical calculation methods mainly include empirical formulae (Yellig and Metcalfe, 1980), multiple contacts (Adekunle and Hoffman, 2016), numerical simulations (Ekechukwu et al., 2020), and equation of states (Karkevandi-Talkhooncheh et al., 2017), etc., because the application range of different calculation methods is different, and the results are greatly affected by parameters. The experimental measurement methods mainly include the slim tube test (STT) (Flock and Nouar, 1984; Mogensen, 2016), rising bubble apparatus (RBA) (Christiansen and Haines, 1987; Novosad et al., 1990; Czarnota et al., 2017), vanishing interfacial tension technique (VIT) (Rao, 1997; Saeedi Dehaghani and Soleimani, 2020), X-ray computerized scanner (Liu et al., 2015; Ahmad et al., 2016), magnetic resonance imaging technique (MRI) (Liu et al., 2016; Karkevandi-Talkhooncheh et al., 2018), core displacement experiment (Zhang and Gu, 2015; Ennin and Grigg, 2016), and so on. Among these methods, STT is the most common method that has been widely used because it usually has a long tube packed with sand or glass beads and can effectively simulate the fluid flow in porous media. However, core tubing cannot represent the mineral composition, porosity, permeability, and connate water saturation of real reservoir rocks. Therefore, it cannot be used for our study because our goal is to investigate formation the water salinity effect on the MMP of CO2-crude oil in reservoirs. In this paper, we use CO2-formation water–rock interaction experiments to reveal their interaction mechanisms using reservoir rock samples. On the basis of these experiments, MMP is measured using core displacement experiments in the formation water with different salinity. The results are of great significance to the optimization design of CO2 miscible flooding.
The oil samples were taken from Y oilfield. Their components and related properties are shown in Tables 1, 2, respectively, at reservoir pressure (22.05 MPa) and temperature (98.5°C).
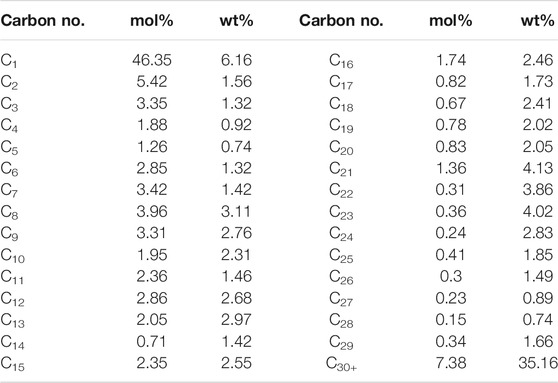
TABLE 1. Compositional results of the oil sample.
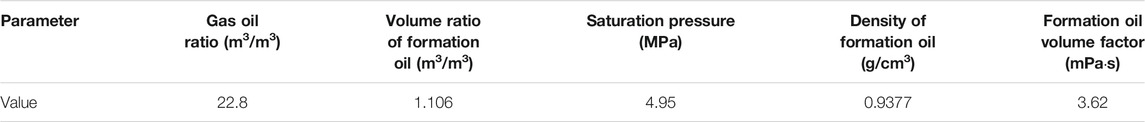
TABLE 2. Physical properties of the oil sample.
Distilled water and synthetic formation water from different areas of Y oilfield were used for the experiments. The composition and salinity of the formation waters are shown in Table 3. The pH values of the two formation waters were 7, 7.4, and 7.8, respectively. CO2 with purity of 99.99% was provided by United Gas Ltd. for CO2-water–rock interaction and core displacement tests.

TABLE 3. Compositions of formation water.
The wettability of four natural cores from Y oilfield is water wet. The length, diameter, porosity, and permeability of natural cores were 30 cm, 2.5 cm, 23%, and 50 × 10−3 μm2, respectively. The core minerals are mainly composed of 53% quartz, 32% feldspar (plagioclase, potassium feldspar), and 15% lithic (clay minerals, a small amount of carbonate minerals). The carbonate minerals are mainly calcite and ankerite.
The core flooding apparatus shown in Figure 1 was used to investigate the CO2-water–rock interaction and obtain MMP. The apparatus is composed of an ISCO pump (260D, Teledyne ISCO Inc., United States), core holder (40 MPa), backpressure regulator, pressure gauges (OMEGA Engineering INC., Canada) with an accuracy of ±0.01 MPa, accumulators (40 MPa), and an oven. Both the accumulator and core holder were put in the oven to simulate reservoir temperatures. The changes in the porous throat before and after the CO2-water–rock reaction were observed by Nano Voxel-4000 CT scanner (Sanying Precision Instrument Inc., China). The PH value of the produced water was tested by a PHB-4 pH detector (Sinameasure AOTumation Technology Inc., China).
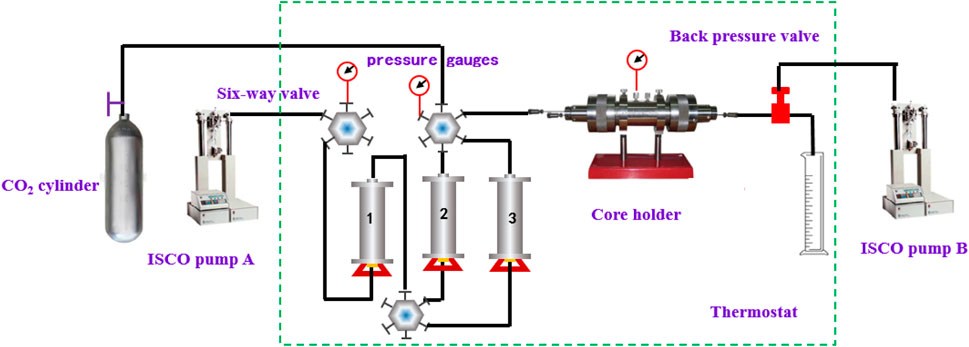
FIGURE 1. Connection diagram of core displacement device.
Through the CO2-formation water–rock interaction experiment, the reaction mechanism of gas, water, and rock is revealed. The procedures are listed as follows in detail:
1) To compare the changes of core physical properties before and after displacement, the end face of the core is cut. The remaining core is put into the core holder or vacuum and then saturated with formation water.
2) CO2 and formation water are injected into the container through the ISCO pump A, and the formation water is in the supersaturated state during the whole experiment.
3) The formation water is injected into the core at a flow rate of 0.3 ml/min. Effluent samples are taken at the outlet every 10 min. The pH value and ion concentration of these samples are measured by the PHB-4 pH detector and DiONEX 500 chromatograph.
4) After the core flooding test, the core is put into the oven for drying. When the mass of the core is no longer changed, the physical parameters of the core are measured, and the core and the original undergo CT scan.
The CO2 miscible flooding experiment is used to measure the CO2-crude oil MMP in the formation water with different salinity. The detailed procedures are as follows:
1) The core is placed into the core holder and vacuumed; then it is saturated with distilled water by manual pump.
2) The core is placed into the core holder and vacuumed; then it was saturated with distilled water by manual pump.
3) The pressure of the backpressure valve is set by ISCO pump B, and its value is below the injection-end pressure of 0.8–1 MPa. A constant pressure flow of 5 MPa is set by ISCO pump A. Then, the displacement experiment is carried out. When the volume of cumulative injection is greater than 1.5 PV, the displacement is stopped, and the oil recovery at this pressure is calculated.
4) The displacement experiment at the next pressure is carried out. CO2 pressures were 5, 10, 15, 20, 25, 27, and 30 MPa. The pressure in the CO2 cylinder is 5 MPa. Displacement pressure is adjusted by two containers.
5) After completion of the experiments at each pressure, the core and formation water were replaced to carry out the next experiment.
CO2 is a kind of acidic gas, which easily reacts with formation water after being injected into the reservoir, breaking the physical-chemical balance between rock and formation water and then affecting the core physical parameters. To reveal the law of CO2-water–rock interaction, the PH value of the produced liquid and the concentration of related ions were measured.
The test results of PH values of the produced liquid are shown in Figure 2. When the formation water is saturated with CO2 in the container, the formation water is weakly acidic, and the pH value decreases from 7.4 to 6.48. After the formation water was injected into the core, the pH value of the solution increased significantly at the beginning of the experiment, and then decreased to a stable level with the increase of the injected PV. The analysis is as follows: The main reason for the formation water changing from alkaline to acidic is that CO2 acidifies the water and forms free H2CO3. The reaction equation is as follows:
The variation curve of pH values with injected PV suggests that the reactions occurred between core, water, and CO2, which significantly reduced the content of H+ in the above equation, and then the pH value of the solution slowly decreased to a stable level as the reaction reached equilibrium.
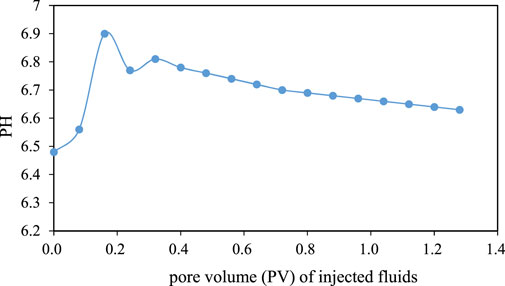
FIGURE 2. Curve of pH values of produced water over the PV.
Figure 3 shows the changed Na+ and K+ concentrations of produced water with the injected PV. The mass concentrations of Na+ and K+ increased first and then decreased to a stable level with the increase of injected PV. The chemical reactions between CO2, core, and water depend on the mineral compositions of the core. The known mineral compositions of the cores are mainly quartz, plagioclase, potassium feldspar, clay minerals, and carbonate minerals (ankerite and calcite). The change of mass concentrations of Na+ and K+ in produced effluent samples indicates that albite (NaAlSi3O8) and potassium feldspar (KAlSi3O8) in the core reacted with acidic formation water. The reaction equation is as follows:
These reactions generated silicate minerals and released Na+ and K+, leading to a significant increase in their mass concentration at the beginning of the experiment. With the progress of the experiment, albite (NaAlSi3O8) and potassium feldspar (KAlSi3O8) reached solve-precipitation equilibrium, and the ion concentration decreased to a stable level.
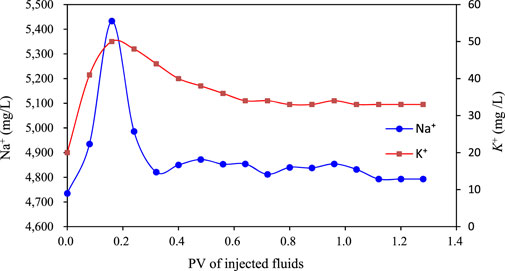
FIGURE 3. Curve of Na+ and K+ concentration of produced water over the PV.
Figures 4, 5 show the changes of Mg2+, Ca2+, and Fe2+ concentrations. The concentrations of Mg2+, Ca2+, and Fe2+ increased first and then fluctuated to a stable level with the increase of injected PV. The change of the mass concentration of Mg2+, Ca2+, and Fe2+ in the reaction solution was mainly related to the dissolution and precipitation of calcite and ankerite. At the beginning of the experiment, the concentrations of Ca2+, Fe2+, and Mg2+ increased, which indicated that carbonate minerals (calcite and ankerite) were corroded by the CO2 acid solution. The reaction consumes H+ in the solution, which leads to the increase of pH value in the solution. The calcite dissolution equation of the solution is shown in Eq. 4, and the ankerite dissolution equation is shown in Eq. 5.
At the same time, with the progress of the experiment, the above reaction promoted the continuous ionization of H2CO3 and lowered the PH value of the solution. Meanwhile, some cations in the solution, such as Mg2+ and Ca2+, react with bicarbonate to form insoluble carbonate. This reaction released a large amount of H+, which reduced the concentration of metal cations in the solution. The reaction formulas are shown in Eq. 1, Eqs 6–8:
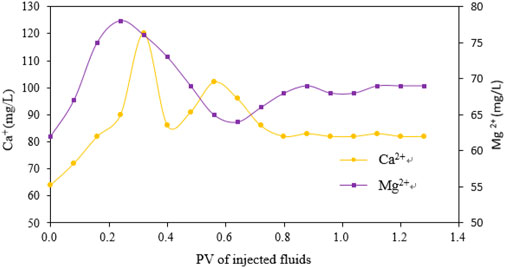
FIGURE 4. Curve of Ca2+ and Mg2+ concentration of produced water over the PV.

FIGURE 5. Curve of Fe2+ concentration of produced water over the PV.
Figures 6, 7 show the CT scanning results of natural cores before and after the experiment. The pore volume of the core increases obviously after displacement. This is consistent with the core porosity measurement results after the experiment (Table 4). However, the core permeability decreases obviously after displacement. The relevant analysis is as follows: The formation water filled with saturated Ca2+ dissolves the core. At the same time, it generates corresponding precipitates (Al2Si2O5(OH)4, H4SiO4), and a lot of Mg2+ and Ca2+. With the increase of the concentration of these divalent ions, they react with the bicarbonate in the formation water to generate MgCO3 and CaCO3 precipitates. The dissolution of these new mineral phases with carbonate cements releases clay particles that were transported by fluid to the pore throats, where the pores were blocked and the permeability of the core was reduced.
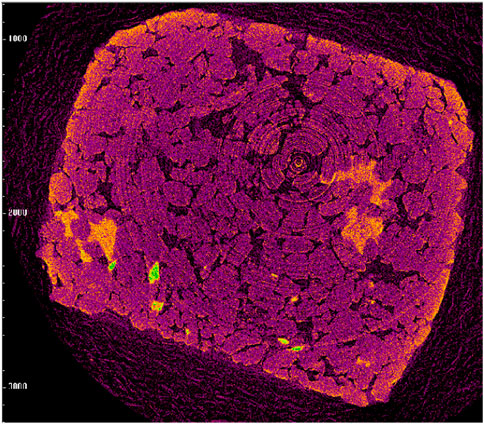
FIGURE 6. T scan of original core.
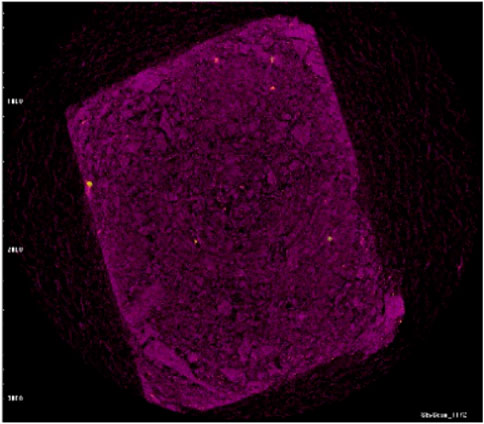
FIGURE 7. T scan of core after experiment.

TABLE 4. Changes of core porosity and permeability before and after the experiment.
To reveal the influence of formation water salinity on the MMP of CO2 and crude oil, the core displacement method is used to measure the MMP under different formation water. It can be seen from Figures 8–10 that the MMP is 20.80, 19.85, and 19.21. The MMP of CO2-crude oil decreases. The analysis is as follows:
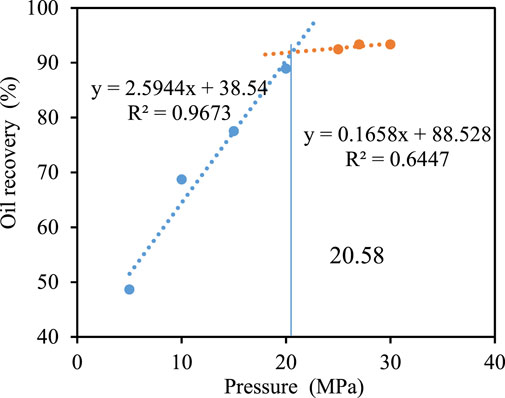
FIGURE 8. Oil recovery under different displacement.
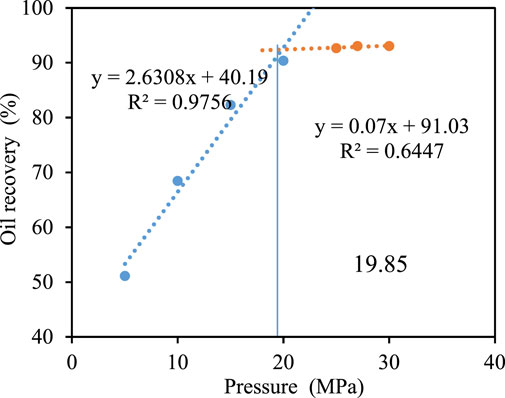
FIGURE 9. Oil recovery under different displacement. Pressure when formation water salinity is 0 mg/L pressure when formation water salinity is 6778 mg/L.
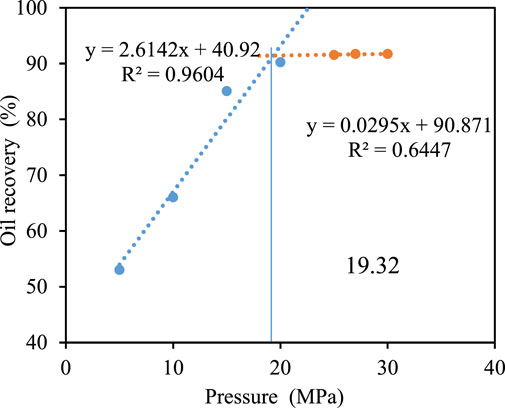
FIGURE 10. Oil recovery under different displacement pressure when formation water salinity is 15,000 mg/L.
There is a spatial competition effect in the dissolution of CO2 in formation water. Compared with CO2, the ionic radius of inorganic salt is smaller, and it more easily fills the gap in water molecules (Figure 11). This reduces the dissolution space for CO2, resulting in less CO2 soluble in water and more CO2 soluble in crude oil in the core saturated with high salinity, resulting in more miscibility. Therefore, the higher the salinity of the formation water, the smaller the MMP between CO2 and crude oil.

FIGURE 11. Spatial competition between ions of inorganic salt and CO2.
When the pressure is greater than 7.38 MPa, CO2 reaches supercritical state. Under the action of its extraction and pore-throat capillary force, NaCl in the formation water is pumped to the mineral surface. The precipitated NaCl crystals with mineral precipitation of CO2-water–rock interaction are carried by CO2 for blocking the pore throat.
This increases the pore volume and reduces the permeability of the core. The change of the physical properties of the core increase the gas breakout time and make the compositional exchange between CO2 and crude oil more intense in the smaller pore space. Thus, the MMP between CO2 and crude oil is lower.
Molecular model of CO2 and distilled water Molecular model of CO2 and formation water.
Based on CO2-formation water–rock interaction and core displacement method experiments, the following conclusions are drawn in this paper:
1)CO2 can react with formation water to decrease the formation water pH from 7.4 to 6.5.
2) CO2 can react with minerals in the core to form insoluble silicate and carbonate precipitates. These new minerals migrate to the pore throat together with the released clay particles, resulting in the increase of the core porosity by 5.63% and the decrease of the core permeability by 7.43%.
3)Formation water salinity influences MMP. MMP of CO2-crude oil decreased with the increase of formation water salinity in the cores.
The original contributions presented in the study are included in the article/Supplementary Material, further inquiries can be directed to the corresponding author.
YP conceived and designed the analysis JL wrote the paper and performed the analya CL collected the data ZL collected the data.
This work was supported by the National Natural Foundation of China (The influence mechanism and rules of low-permeability sandstone reservoir water shield on the minimum miscible pressure of CO2-crude oil Project No.52174023), and the Natural Science Foundation of Heilongjiang Province of China (The Influence of Formation Water on CO2-Crude Oil MMP under Reservoir Conditions Project No.E2018013).
XG was employed by the China United Coalbed Methane Co., Ltd. CL was employed by CNOOC Safety Technology Service Co., Ltd. Shanghai Branch.
The remaining authors declare that the research was conducted in the absence of any commercial or financial relationships that could be construed as a potential conflict of interest.
All claims expressed in this article are solely those of the authors and do not necessarily represent those of their affiliated organizations, or those of the publisher, the editors and the reviewers. Any product that may be evaluated in this article, or claim that may be made by its manufacturer, is not guaranteed or endorsed by the publisher.
Adekunle, O., and Hoffman, B. T. (2016). Experimental and analytical methods to determine minimum miscibility pressure (MMP) for Bakken formation crude oil. J. Pet. Sci. Eng. 146, 170–182. doi:10.1016/j.petrol.2016.04.013
Ahmad, W., Vakili-Nezhaad, G., Al-Bemani, A. S., and Al-Wahaibi, Y. (2016). Experimental Determination of Minimum Miscibility Pressure. Proced. Eng. 148, 1191–1198. doi:10.1016/j.proeng.2016.06.629
Ahmadi, M. A., Zahedzadeh, M., Shadizadeh, S. R., and Abbassi, R. (2015). Connectionist model for predicting minimum gas miscibility pressure: Application to gas injection process. Fuel 148, 202–211. doi:10.1016/j.fuel.2015.01.044
Ahmadi, M. A., Zendehboudi, S., and James, L. A. (2017). A reliable strategy to calculate minimum miscibility pressure of CO2-oil system in miscible gas flooding processes. Fuel 208, 117–126. doi:10.1016/j.fuel.2017.06.135
Ahmadi, M. A., Zendehboudi, S., and James, L. A. (2018). Developing a robust proxy model of CO2 injection: Coupling Box-Behnken design and a connectionist method. Fuel 215, 904–914. doi:10.1016/j.fuel.2017.11.030
Ampomah, W., Balch, R. S., Cather, M., Will, R., Gunda, D., Dai, Z., et al. (2017). Optimum design of CO2 storage and oil recovery under geological uncertainty. Appl. Energ. 195, 80–92. doi:10.1016/j.apenergy.2017.03.017
Christiansen, R. L., and Haines, H. K. (1987). Rapid Measurement of Minimum Miscibility Pressure with the Rising-Bubble Apparatus. SPE Reservoir Eng. 2 (04), 523–527. doi:10.2118/13114-pa
Cumicheo, C., Cartes, M., Segura, H., Müller, E. A., and Mejía, A. (2014). High-pressure densities and interfacial tensions of binary systems containing carbon dioxide+n-alkanes: (n-Dodecane, n-tridecane, n-tetradecane). Fluid Phase Equilibria 380, 82–92. doi:10.1016/j.fluid.2014.07.039
Czarnota, R., Janiga, D., Stopa, J., and Wojnarowski, P. (2017). Determination of minimum miscibility pressure for CO 2 and oil system using acoustically monitored separator. J. CO2 Utilization 17, 32–36. doi:10.1016/j.jcou.2016.11.004
Dong, M., Huang, S., Dyer, S. B., and Mourits, F. M. (2001). A comparison of CO2 minimum miscibility pressure determinations for Weyburn crude oil. J. Pet. Sci. Eng. 31 (1), 13–22. doi:10.1016/s0920-4105(01)00135-8
Ekechukwu, G. K., Falode, O., and Orodu, O. D. (2020). Improved Method for the Estimation of Minimum Miscibility Pressure for Pure and Impure CO2–Crude Oil Systems Using Gaussian Process Machine Learning Approach[J]. J. Energ. Resour. Tech. 142 (12), 132–138. doi:10.1115/1.4047322
Ennin, E., and Grigg, R. B. (2016). CO2 flooding and minimum miscibility pressure study in Texas Farnsworth Field[C]//SPE Trinidad and Tobago section energy resources conference. Canada: Society of Petroleum Engineers.
Flock, D. L., and Nouar, A. (1984). Parametric Analysis on the determination of the minimum miscibility pressure in slim tube displacements[J]. J. Can. Pet. Tech. 23 (05), 80–88. doi:10.2118/84-05-12
Han, J., Han, S., Sung, W., and Lee, Y. (2018). Effects of CO2 miscible flooding on oil recovery and the alteration of rock properties in a carbonate reservoir. J. CO2 Utilization 28, 26–40. doi:10.1016/j.jcou.2018.09.006
Hemmati-Sarapardeh, A., Ayatollahi, S., Ghazanfari, M.-H., and Masihi, M. (2014). Experimental Determination of Interfacial Tension and Miscibility of the CO2-Crude Oil System; Temperature, Pressure, and Composition Effects. J. Chem. Eng. Data 59 (1), 61–69. doi:10.1021/je400811h
Jamiu, M. (2013). Ekundayo. Minimum Miscibility Pressure Measurement with Slim Tube Apparatues-How Unique is the Value? [J]. SPE, 165966.
Jia, B., Tsau, J.-S., and Barati, R. (2019). A review of the current progress of CO2 injection EOR and carbon storage in shale oil reservoirs. Fuel 236, 404–427. doi:10.1016/j.fuel.2018.08.103
Jishun, Q. I. N., Haishui, H. A. N., and Xiaolei, L. I. U. (2015). Application and enlightenment of carbon dioxide flooding in the United States of America[J]. Pet. Exploration Dev. 42 (2), 232–240.
Karkevandi-Talkhooncheh, A., Hajirezaie, S., Hemmati-Sarapardeh, A., Husein, M. M., Karan, K., and Sharifi, M. (2017). Application of adaptive neuro fuzzy interface system optimized with evolutionary algorithms for modeling CO 2 -crude oil minimum miscibility pressure. Fuel 205, 34–45. doi:10.1016/j.fuel.2017.05.026
Karkevandi-Talkhooncheh, A., Rostami, A., Hemmati-Sarapardeh, A., Ahmadi, M., Husein, M. M., and Dabir, B. (2018). Modeling minimum miscibility pressure during pure and impure CO2 flooding using hybrid of radial basis function neural network and evolutionary techniques. Fuel 220, 270–282. doi:10.1016/j.fuel.2018.01.101
Liu, Y., Jiang, L., and Tang, L. (2015). Minimum miscibility pressure estimation for a CO2/n-decane system in porous media by X-ray CT[J]. Experiments in Fluids 56 (7), 1–9. doi:10.1007/s00348-015-2025-4
Liu, Y., Jiang, L., Song, Y., Zhao, Y., Zhang, Y., and Wang, D. (2016). Estimation of minimum miscibility pressure (MMP) of CO2 and liquid n-alkane systems using an improved MRI technique. Magn. Reson. Imaging 34 (2), 97–104. doi:10.1016/j.mri.2015.10.035
Moeini, F., Hemmati-Sarapardeh, A., Ghazanfari, M.-H., Masihi, M., and Ayatollahi, S. (2014). Toward mechanistic understanding of heavy crude oil/brine interfacial tension: The roles of salinity, temperature and pressure. Fluid phase equilibria 375, 191–200. doi:10.1016/j.fluid.2014.04.017
Mogensen, K. (2016). A novel protocol for estimation of minimum miscibility pressure from slimtube experiments. J. Pet. Sci. Eng. 146, 545–551. doi:10.1016/j.petrol.2016.07.013
Novosad, Z., Sibbald, L. R., and Costain, T. G. (1990). Design of miscible solvents for a rich gas drive-comparison of slim tube and rising bubble tests[J]. J. Can. Pet. Tech. 29 (01), 54–57. doi:10.2118/90-01-03
Rao, D. N. (1997). A new technique of vanishing interfacial tension for miscibility determination[J]. Fluid phase equilibria 139 (1), 311–324. doi:10.1016/s0378-3812(97)00180-5
Ren, M., Sevilla, M., Fuertes, A. B., Mokaya, R., Tour, J. M., and Jalilov, A. S. (2019). Pore Characteristics for Efficient CO2 Storage in Hydrated Carbons. ACS Appl. Mater. Inter. 11 (47), 44390–44398. doi:10.1021/acsami.9b17833
Saeedi Dehaghani, A. H., and Soleimani, R. (2020). Prediction of CO 2 ‐Oil Minimum Miscibility Pressure Using Soft Computing Methods. Chem. Eng. Technol. 43 (7), 1361–1371. doi:10.1002/ceat.201900411
Syed, F. I., Neghabhan, S., Zolfaghari, A., and Dahaghi, A. K. (2020). Numerical Validation of Asphaltene Precipitation and Deposition during CO2 miscible flooding. Pet. Res. 5 (3), 235–243. doi:10.1016/j.ptlrs.2020.04.002
Yalcin, Erik. Nazan, and Faruk, Ay (2020). Use of petrological and organic geochemical data in determining hydrocarbon generation potential of coals: miocene coals of Malatya Basin (Eastern Anatolia-Turkey). Int. J. Coal Sci. Technol. doi:10.1007/s40789-020-00376-3
Yellig, W. F., and Metcalfe, R. S. (1980). Determination and Prediction of CO2 Minimum Miscibility Pressures (includes associated paper 8876 ). J. Pet. Tech. 32 (01), 160–168. doi:10.2118/7477-pa
Zendehboudi, S., Ahmadi, M. A., Bahadori, A., Shafiei, A., and Babadagli, T. (2013). A developed smart technique to predict minimum miscible pressure-eor implications. Can. J. Chem. Eng. 91 (7), 1325–1337. doi:10.1002/cjce.21802
Zhang, K., and Gu, Y. (2015). Two different technical criteria for determining the minimum miscibility pressures (MMPs) from the slim-tube and coreflood tests. Fuel 161, 146–156. doi:10.1016/j.fuel.2015.08.039
Zhang, N., Yin, M., Wei, M., and Bai, B. (2019). Identification of CO2 sequestration opportunities: CO2 miscible flooding guidelines. Fuel 241, 459–467. doi:10.1016/j.fuel.2018.12.072
Zhao, X., Zhou, L., Pu, X., Jin, F., Shi, Z., Han, W., et al. (2020). Formation conditions and enrichment model of retained petroleum in lacustrine shale: A case study of the Paleogene in Huanghua depression, Bohai Bay Basin, China. Pet. Exploration Dev. 47 (5), 916–930. doi:10.1016/s1876-3804(20)60106-9
Keywords: CO2 miscible flooding, minimum miscibility pressure, formation water salinity, core displacement experiment, CO2-formation water-rock interaction experiment
Citation: Pi Y, Liu J, Liu L, Guo X, Li C and Li Z (2021) The Effect of Formation Water Salinity on the Minimum Miscibility Pressure of CO2-Crude Oil for Y Oilfield. Front. Earth Sci. 9:711695. doi: 10.3389/feart.2021.711695
Received: 19 May 2021; Accepted: 15 July 2021;
Published: 03 September 2021.
Edited by:
Yuwei Li, Liaoning University, ChinaReviewed by:
Hui Pu, University of North Dakota, United StatesCopyright © 2021 Pi, Liu, Liu, Guo, Li and Li. This is an open-access article distributed under the terms of the Creative Commons Attribution License (CC BY). The use, distribution or reproduction in other forums is permitted, provided the original author(s) and the copyright owner(s) are credited and that the original publication in this journal is cited, in accordance with accepted academic practice. No use, distribution or reproduction is permitted which does not comply with these terms.
*Correspondence: Jinxin Liu, MTU5MzI1NDYwN0BxcS5jb20=
Disclaimer: All claims expressed in this article are solely those of the authors and do not necessarily represent those of their affiliated organizations, or those of the publisher, the editors and the reviewers. Any product that may be evaluated in this article or claim that may be made by its manufacturer is not guaranteed or endorsed by the publisher.
Research integrity at Frontiers
Learn more about the work of our research integrity team to safeguard the quality of each article we publish.