 Matthew J. Edwards
 Julia Eychenne
 Laura Pioli
- 1Department of Earth Sciences, University of Geneva, Geneva, Switzerland
- 2Laboratoire Magmas et Volcans, CNRS, IRD, OPGC, Université Clermont Auvergne, Clermont-Ferrand, France
- 3CNRS, INSERM, Institut de Génétique Reproduction et Développement, Université Clermont Auvergne, Clermont-Ferrand, France
- 4Dipartimento di Scienze Chimiche e Geologiche, Università di Cagliari, Cittadella Universitaria di Monserrato, Cagliari, Italy
Open conduit volcanoes are characterized by frequent, small scale explosive eruptions, which have a significant impact. Ash-forming explosions are impacting over larger areas with respect to effusive or poorly explosive events and, consequently, are more significant for hazard assessments. Quantifying the hazard associated with them requires understanding the processes and parameters controlling explosive style, and tephra dispersal and obtaining a comprehensive dataset to constrain syn-eruptive dynamics and particle transport in the volcanic plume. We present a study focused on Etna volcano (Italy), which, despite its continuous outgassing through the summit vents, has very frequent explosive eruptions dispersing ash along the southern Mediterranean area. The goal of this study is to obtain a statistically valid dataset on ash morphology and texture and investigate how various particle types distribute spatially in the tephra blanket. We chose a small scale, ash-forming eruption occurred in May 2016, sampled a few hours after tephra deposition. Analyses of grainsize distribution were coupled with further data on tephra texture and morphology, and numerical simulations. Several components were identified based either on purely textural or purely shape characteristics. Shape parameters related to the form of the grains (aspect ratio) are consistent across grainsizes and components. However, roughness parameters (solidity, convexity, concavity index) vary non-uniformly with particle size and componentry. Ash was formed through complex fragmentation of heterogenous magma, starting in the conduit, extending to the explosion jet, and resulting into a large variability of particle shapes, density and textures which distribute non-uniformly across grainsizes. This variability determines variable traveling potential within the volcanic plume and thus non uniform distribution in the deposit. Componentry variations along the dispersal axis suggest that density is the most effective parameter in controlling particle settling. However, extreme shapes, such as very elongated particles formed by surface tension instabilities in the jet, have the largest potential of being transported in the plume and can disperse downwind up to tens of km. Our results suggest that heterogeneities in textures and morphologies of particles are fundamental characteristics of tephra from frequently erupting volcanoes and should be accounted for plume dispersal modelling and hazard assessment.
Introduction
The impact of explosive eruptions on the environment depends on their magnitude, intensity, dispersal, frequency, and chemistry of the erupted magma (Deligne et al., 2017). Explosive manifestations at mafic volcanoes are in general characterized by low to moderate explosivity (Taddeucci et al., 2015) but can be very frequent and last for several days to weeks, especially in the case of open vent systems. They can also emit large amounts of ash (Pioli et al., 2008; Andronico et al., 2009a), which is the finest fraction of tephra (grainsize smaller than 2 mm). Dispersal and deposition of tephra has considerable impact on the areas and populations surrounding the volcano (Horwell and Baxter, 2006; Wilson et al., 2012; Scollo et al., 2013; Andronico et al., 2015). Understanding how the eruption dynamics affects the properties of tephra (size distribution, morphology, texture), which in turn control its transport in the atmosphere, is of capital importance for deciphering the tephra hazard and for setting up efficient strategies of volcano monitoring and risk reduction. Because of the effective transport of ash, tephra falls can be laterally extensive despite being produced from relatively small eruptions (Andronico et al., 2014; Scollo et al., 2015; Poret et al., 2018). Additionally, ash dispersal affects regional aviation and commercial networks due to the temporaneous disruption of air traffic, even at Strombolian scale (Scollo et al., 2013). For these reasons, small-scale, ash-forming eruptions at frequently erupting volcanoes represent a major hazard with highly relevant impacts. Quantifying the hazard related to these events requires forecasting ash cloud dispersal and sedimentation, which implies: i) understanding the mechanisms controlling the eruption onset and dynamics, and ii) determining the main eruption source parameters which are needed for modelling the eruption scenario (Marzocchi and Bebbington, 2012; Hayes et al., 2020), such as column height, the size distribution and morphological properties of tephra, which are key parameters in tephra transport modelling, in parallel with meteorological conditions (Mastin et al., 2009; De Micheli Vitturi et al., 2016).
To achieve these two goals comprehensive studies coupling eruption monitoring, tephra and petrological studies are required. Because of its rapid quenching, ash records the characteristics of magma at syneruptive times, but it is also an important tool for reconstructing the processes of conduit ascent and explosive fragmentation, uncovered through morphological and textural analysis. Ash studies, usually performed over thousands of particles, have a pivotal role in the understanding of the mechanisms controlling explosive eruptions, because they are able to provide statistically representative datasets that can be related to magma properties and eruption dynamics. After the pioneering approach of Wohletz (1983) and Heiken and Wohletz (1985) studies on ash morphology and texture have become increasingly popular in the last decade (Cioni et al., 2008; Miwa et al., 2009; Andronico et al., 2014; Liu et al., 2015a; Liu et al., 2015b; Schmith et al., 2018; Saxby et al., 2020). Magma texture (bubble shapes, number densities and sizes) exert a primary control on ash shape regardless of the fragmentation mechanisms (i.e., magmatic or phreatomagmatic). This is because it controls the geometry of the fracture distribution in the magma continuum (Kueppers et al., 2006; Grady, 2010), and because the final particle morphology often depends on how these fractures intersect bubbles (Mele et al., 2011; Genareau et al., 2013; Liu et al., 2015b). The fluidal morphology of some basaltic tephra such as Pele’s tears and hairs (Porritt et al., 2012; Villermaux, 2012; Cannata et al., 2019) suggests that capillary forces drive fragmentation of low viscosity magma under certain conditions (Gonnermann, 2015; Jones et al., 2019; Edwards et al., 2020). Consequently, ash textural properties and componentry can be used to identify eruption style and reconstruct conduit dynamics (e.g., Taddeucci et al., 2002; Wright et al., 2012; Nurfiani and de Maisonneuve, 2018; Schmith et al., 2018). The relation between the texture (crystallinity, vesicularity) of ash particles and their shape has however been analysed only in a few studies (Pompilio et al., 2017; Pardo et al., 2020; Thivet et al., 2020). Yet, numerous eruptions are fed by mingled/heterogeneous magmas (e.g.; Taddeucci et al., 2002; Wright et al., 2012; Thivet et al., 2020), which produce texturally heterogeneous tephra which should have contrasting morphological features. Relating morphology to texture would be an invaluable tool to decipher magma heterogeneity and hence eruption dynamics.
Ash morphology and componentry studies are often performed based on single location sampling. However, even for steady eruptions and atmospheric conditions, tephra settling velocity and thus sedimentation distances from the eruptive centre vary with particle density, size and shape (Bonadonna et al., 1998; Mele et al., 2011; Bagheri and Bonadonna, 2016; Miwa et al., 2020; Saxby et al., 2020; Rossi et al., 2021). For this reason, particles with different shapes and densities but similar diameters can settle at variable distances from vent. The representativity of studies reconstructing the entire population of particles erupted based on a single location sampling has been poorly assessed (Pioli et al., 2019). This strongly limits our ability to: i) interpret data in terms of fragmentation mechanisms, ii) compare the data from various eruptions, and iii) fully understand the actual impact of ash dispersal. For example, in contrast with grainsize or textural studies (Gurioli et al., 2015), the community lacks a shared protocol for ash sampling for morphology studies as to obtain a uniform dataset with significant potential to give fundamental insights into ash formation processes.
To address these issues, we investigated the particle shape and componentry relationship of ash erupted during a well monitored and studied eruption, the 21 May 2016 Etna paroxysm. For the first time, we coupled morphology, texture and componentry data on a statistically relevant number of particles collected along the dispersal axis, at variable distance from the vent. Due to extensive monitoring and the numerous studies published on its activity, Etna volcano has become the archetypal example of open vent, frequently erupting, mafic volcano, also marked by relatively high explosivity events ranging from Subplinian to Strombolian scale (Branca and Del Carlo, 2005). In its eruptions the tephra produced is typically ash-rich, regardless of the eruption style (Taddeucci et al., 2004a; Scollo et al., 2013; Andronico et al., 2014; Polacci et al., 2019). Etna explosions, such as several other mafic systems, emit heterogeneous magmas marked by distinct crystallinities and vesicularities (Taddeucci et al., 2004b; Andronico et al., 2009a). Usually, the relative proportions of magma types vary with eruption intensity and style (Maria and Carey, 2007; Cimarelli et al., 2010; Liu et al., 2015a; Polacci et al., 2019; Thivet et al., 2020). At Etna specifically, high vesicularity, glassy ash is associated with higher intensity activity of Strombolian explosions and lava fountaining, while low vesicularity, microcrystalline ash is associated with lower intensity cessation phases and less explosive eruptions (Taddeucci et al., 2004a; Andronico et al., 2009b; Polacci et al., 2019). The May 2016 eruption is an ideal case due to its low intensity and the combination of effusive and explosive manifestations. Three paroxysmal explosions dispersed a narrow tephra deposit which was sampled at various distances from the source within hours of its deposition (Edwards et al., 2018). Monitoring and petrology data were compared to reconstruct the eruption dynamics and the geometry of the magma reservoirs which fed the eruption (Edwards et al., 2018). In this study, we briefly review the parameters used for shape analysis and the properties of the end-members ash components. We analyse two grainsize fractions, the 1 mm–710 μm fraction, which is the closest to the median particle size deposited at the locations studied, and the 180–125 µm fraction, which corresponds to the smallest particle size settling individually at any location according to several studies (Eychenne et al., 2017; Freret-Lorgeril et al., 2019). We compare the spatial variability in componentry and morphology at three distances between 6 and 27 km from the eruptive centre and infer the effect of transport processes on the distribution of particle properties using numerical modelling. Finally, we discuss the results in terms of fragmentation processes and eruption dynamics.
Case Study-The 21 May 2016 Etna Paroxysm
The 21 May 2016 explosive event was the last of three which occurred during the 17 to 25 May 2016 Etna eruption, all of which were accompanied by lava flowing from the same vent. It lasted approximately 130 min, from ∼02:15 to 04:25 GMT and produced a 6 km a.s.l. high (the vent elevation is about 3.35 km a.s.l.), weak ash plume which spread towards the SSE (Figure 1). The total erupted mass was 4.6–6.5 × 10⁶ kg with a mass eruption rate (MER) of 5.9–8.3 × 10² kg/s. A narrow tephra fall deposit formed, bounded at the coast by Catania to the south and Capo Mulini to the north (Figure 1). The median size of the particles erupted correspond to 640 µm (Edwards et al., 2018). By size and duration, this paroxysm corresponds to a medium scale event at this volcano. These events span over frequencies of 10 up to 66 per year and are typical of the high explosivity activity of Etna since the 70s (Corsaro et al., 2017). The total grainsize distribution of the deposit calculated from tephra samples collected a few hours after the explosion consists of 95 wt.% of ash (particles <2 mm in size) and 0.5 wt.% fine ash (particles <63 μm; Edwards et al., 2018). Further details about this paroxysm and the entire eruption are provided in Edwards et al. (2018).
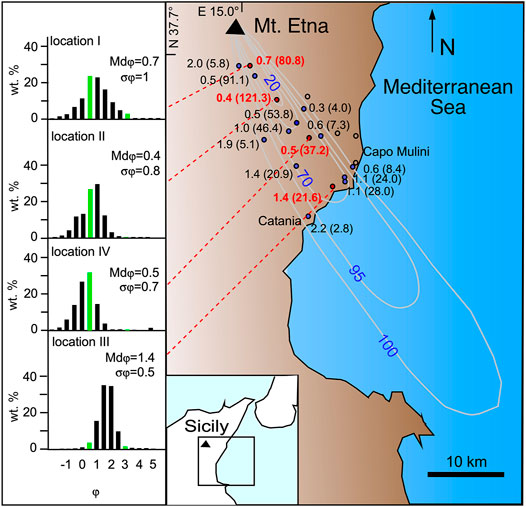
FIGURE 1. Isomass map of the tephra fall deposit formed by the 21 May 2016 Etna paroxysm, with inset location on Sicily (bottom left). Blue numbers on the isolines represent the percentage of deposit mass enclosed. Blue dots: sampling locations. Numbers indicate median grainsize (in phi) and mass load in brackets (in g/m2). Red dots: location where the deposit was sampled for ash characterisation. Light green bars in histograms of grainsize distributions: grain size fractions analysed for shape characteristics. Data from Edwards et al. (2018).
General Characteristics of the Tephra Produced by Etna Eruptions
Etnean scoria spans a continuous spectrum from glassy to crystalline, these two end-members being represented by sideromelane and tachylite (Taddeucci et al., 2004a; Polacci et al., 2019). Within the ash fraction, these components have typical morphologies and textures: 1) sideromelane particles are yellow/brown, fluidal to irregularly shaped and highly vesicular, 2) tachylite particles are grey/black, blocky and poorly vesicular. These components are also clearly distinguishable in thin section by groundmass texture, with sideromelane being glassy whilst tachylite has micro-to crypto-crystalline groundmass. In addition to the spectrum of sideromelane to tachylite, other components are also present in tephra fall deposits – free crystals, lithics, accretionary pellets (as in Brown et al., 2012), and often mingled tephra consisting of a single particle with distinct groundmass zones of sideromelane and tachylite. Various processes have been proposed for the formation of sideromelane and tachylite, such as different cooling processes, hydromagmatic basaltic activity and differences in conduit residence time (Heiken and Wohletz, 1985; Taddeucci et al., 2004a; Cimarelli et al., 2010). More recently, other authors have suggested that sideromelane tephra represents fragmentation of a hot, low viscosity, vesiculating central magma rising in the conduit, while tachylite tephra comes from the fragmentation of a cooler, higher viscosity, degassed and crystallised magma along the conduit walls (Polacci et al., 2006; Pompilio et al., 2017). At Etna specifically, Polacci et al. (2019) suggested at least three mechanisms for the formation of such end-member tephra components: 1) the aforementioned process of central vs. conduit-edge magma fragmentation, associated with lava fountain activity, 2) progressive emptying and fragmentation of an increasingly cooler, more crystalline magma body, associated with low energy explosive activity, or final throes of a prolonged eruption, and 3) collapse of conduit walls and intracrateric material, associated with the end of Strombolian episodes, or phases between explosive events. In these scenarios, eruption energies are progressively lower, highlighting the prevalence of sideromelane during high energy fountaining and Strombolian activity, and the prevalence of tachylite during weak activity (Taddeucci et al., 2004; Andronico et al., 2008, Andronico et al., 2009b; Andronico et al., 2018).
Methods
Ash Sampling and Preparation
The tephra fall deposit was sampled in the hours after settling of the May 21 plume. Analysis of the ash collected from four locations within 1 km perpendicular to the dispersal axis of the 21 May 2016 tephra fall deposit (Figure 1) is presented here. Location I represents the most proximal sampling location, 6 km from the eruptive centre. Location II represents a medial sampling location, 12 km from the eruptive centre. Location III represents the most distal sampling location, 27 km from the eruptive centre. Location IV is located in between II and III, at about 18 km from the eruptive centre. Sampling was done by sweeping tephra fallen on flat, smooth surfaces. Samples were first dried at 105°C for 18 h and then dry sieved at half Φ intervals (with Φ corresponding to the negative logarithm in base 2 of the diameter of particles, expressed in mm), from 5 to −2.5 Φ. The 125–180 μm (3–2.5 Φ) and 710–1,000 μm (0.5–0 Φ) fractions were chosen for componentry and morphology analyses. The 710–1,000 μm fraction is close to the median grain size of the deposit (Edwards et al., 2018). The 125–180 μm fraction is the tail end of the grain size distributions and one of the finest size ranges where a suitable number of particles was available for significant statistical analysis. Additionally, the particle size was large enough so that 10 s of particles could be imaged at once by the SEM. Larger particles were also inspected with SEM, but the number of particles analysed was too small for statistical analyses. Results were used only for identification of textural characteristics (vesicularity and identification of textural types) The two fractions were halved using a splitter to analyse the same samples, with half being used for SEM analysis and half used for optical particle analysis (described in the following sections). Thin sections of ash from both size fractions at each location were prepared for SEM by scattering ash in resin and polishing to 50 μm thickness before carbon coating. Clasts from locations I, II and III were used for both componentry and shape analysis. Clasts from location IV, because of the similarity in grainsize distribution with sample II, were used only for morphological analyses.
Componentry Analyses
Grains immersed in resin from samples from location I, II and III were analysed at the University of Geneva using the JEOL JSM-700IFA Scanning Electron Microscope (SEM). Images of grains within the sections were acquired for each sample using a working distance of ∼10 mm, 55x magnification and a 15 kV accelerating voltage. At 55x magnification, the 710–1,000 μm grains were too large to be imaged by SEM in significant numbers for statistical analysis. Lowering the image resolution resulted in distorted images, rendering them unsuitable for the subsequent particle shape analysis. Therefore, only the 125–180 μm fractions were detailed using the SEM. A total of 66 images were taken for the 125–180 μm fraction with each image containing up to 78 particles. Each image measured 2,560 × 2048 pixels for a constant image resolution of 1,180 px/mm.
The textural componentry, which distinguishes sideromelane, tachylite, crystal and lithic particles, and the shape componentry, which distinguishes globular, elongated, blocky and irregular particles, were performed on all the SEM images (more than 500 particles counted per sampling location). Dual textural and shape componentry (i.e., both a textural and shape category was assigned to each particle) was performed using a subset of SEM images (about 100 particles per sampling location).
Single particle vesicularity was assessed by image analysis using the software Fiji (Schindelin et al., 2012), based on SEM binary images; it was measured on a total of 73 particles, 45 of 710–1,000 µm size and 27 of the 125–180 µm size.
Particle Morphology Analyses
In this study, we quantify ash morphology by roughness and form, through image analysis using the following set of 2D shape parameters: 1) the Concavity Index (CI), which is based on the solidity (SLD) and the convexity (CVX) following the equation CI =
Particle shape data were obtained for both the 125–180 and 710–1,000 μm undifferentiated clast fractions from samples I, II, III and IV at the Laboratoire Magmas et Volcans in Clermont-Ferrand, France using the Malvern Morphologi G3 Particle Characterisation System (hereafter referred to as G3). Following the method of Leibrandt and Le Pennec (2015), ash particles were loaded into a sample cartridge before being automatically dispersed onto a glass plate and illuminated from below. The 2D projected area and shape of the particles – the Apparent Projected Shape of Ash (APASH) – were measured by the G3 microscope at 2.5x magnification. Morphological parameters such as size and 2D shape parameters were automatically analysed from APASH measurements. Raw data were filtered from the G3 output to remove particle clusters from the final datasets.
Shape analysis of SEM images was performed with Fiji and using the shape macro from Liu et al. (2015b). Each image was thresholded to binary and particles smaller than 1,000 px2 excluded remove fragments produced by the thin section preparation. An image of numbered particle outlines was then created for later referencing of particles. As the crop resulted in a square canvas, adjacent particles were often included on the edges. These were manually removed. Clustering of particles was negligible due to effective grain separation. However, where this occurred such particle clusters were excluded from the dataset. Holes within particles were filled in order to calculate particle area. An equivalent image set was created for the convex area of each particle and used to calculate particle convexity. Particle measurements (area, perimeter, Feret diameter - maximum and minimum, convex hull area, and convex hull perimeter) were measured directly in Fiji using the appropriate image set. These primary measurements were used to calculate CI, AR and FF.
On all the SEM images, textural componentry was associated with the particle morphology data via the outlined reference images. Both textural and shape componentry were associated with the particle morphology data on a subset of SEM images. Lithics and accretionary pellets were present but were poorly resolvable at SEM conditions suitable for bulk particle analysis due to the different brightness of the various components. Therefore, these were counted for the componentry percentages but not measured in the shape analysis.
Ash Settling Modelling
In order to explore the impact of the morphological and textural variability of the ash particles produced by the eruption on their terminal velocity and hence their sedimentation behaviour, the settling of individual ash particles during the 21 May 2016 Etna eruption was simulated. We used the theoretical settling scheme of Ganser (1993) for non-spherical particles in the atmospheric conditions on the day of the eruption. These simulations reproduce the advection by the wind and the fall of individual particles due to gravity through a simplified atmosphere, from a given column height (3.5 km a.s.l. corresponding to 150 m above vent, and 6 km a.s.l. corresponding to the max plume height measured) to the ground (accounting for the topography of the Mount Etna’s slopes).
The settling scheme and related equations are detailed in Eychenne et al. (2017) and summarized here. The terminal fall velocity (Vt), drag coefficient (Cd) and particle Reynolds number (Re) are expressed as:
where D is the particle diameter, g the gravitational force, ρa the density of the atmosphere, ρp the density of the particle, and µa the dynamic viscosity of the atmosphere. K1 and K2 are Ganser’s shape factors, defined as:
where ψ is the 3D sphericity of the particle.
The troposphere is modelled as a stack of 500 m-thick layers, in which wind speed and direction, temperature (T, in Kelvin), pressure (P), ρa and µa are assumed constant. The wind data are extracted from weather forecasts (ARPA-SIM, the HydroMeteorological Service of the Emilia-Romagna Regional Agency for Environmental Protection in Italy) at the location of Mount Etna on 21 May 2016, while the other parameters are calculated following the International Standard Atmosphere model:
where T0 and P0 are the temperature and pressure at sea level (288.2 K and 101.29 × 10³ Pa, respectively), L is the lapse rate for the troposphere (6.5 K/km), h is the altitude, and R is the gas constant for air (287 m2s−2K−1).
Re, Vt and Cd are inter-dependent and are thus calculated iteratively in each atmospheric layer. Given that Vt depends also on the air properties, it varies with the altitude.
Particle variability was accounted for by simulating the settling of sideromelane particles, tachylite particles, mafic crystals and plagioclases varying their form factors, densities, and grain sizes. FF was varied between 0 and 1 for all components. Mafic and plagioclase crystals’ densities were set to 3,300 and 2,700 kg/m3 respectively. The density of vesicular tephra particles follows a sigmoidal increase with decreasing grainsize (Eychenne and Le Pennec 2012; Cashman and Rust 2016; Rossi et al., 2021). Based on these known variation profiles, we assumed that the density of sideromelane and tachylite will follow a linear decrease on a semi-log plot, between 4 mm (Φ = −2), and 63 µm (Φ = 4) and 90 µm (Φ = 3.5), respectively (Supplementary Figure S1.1), and will remain constant for smaller grainsizes, representing the tail where particle density reaches the solid density. The solid density was taken as ρp = 2,890 kg/m3 for both sideromelane and tachylite particles (Edwards et al., 2018). The linear decrease was interpolated between known values of densities using the vesicularities assessed by image analyses (Supplementary Figure S1.1): i) in the 125–180 µm fraction (Φ = 3), average densities of 2,790 and 2,580 kg/m3 were used for tachylite and sideromelane, respectively, corresponding to mean vesicularities of 4 and 11%, respectively (Table 1), ii) in the 710–1,000 µm fraction (Φ = 0.5), average densities of 2,240 and 2070 kg/m3 were used for tachylite and sideromelane, respectively, corresponding to mean vesicularities of 14 and 28%, respectively (Table 1).
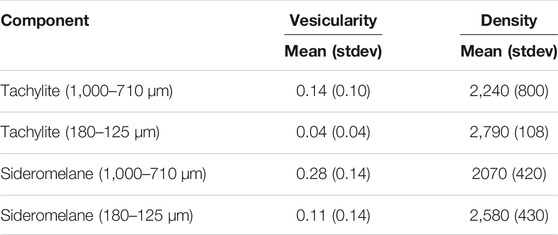
TABLE 1. Vesicularity and density of juvenile components.
Results
Shape Componentry
Combining shape, roughness and vesicularity, we define four shape categories of juvenile particles: i) blocky, ii) globular, iii) elongated, iv) irregular (Figure 2). Blocky particles are angular, crystalline and vesicle-free to vesicle-poor. Globular particles are rounded, vesicle free to vesicle poor and glassy. Elongated particles have one axis much larger than the other, are glassy, with small or no vesicles, marked by filaments down to a few mm thick. Irregular particles are vesicular, with shapes controlled by broken vesicles, they are glassy or crystalline, but the ones with high vesicularity are generally glassy. Their form (aspect ratio) is variable, depending on the vesicle texture. The relative proportions of these particle types vary with particle size. Only irregular particles and rare blocky particles (crystals) occur in the 710–1,000 μm ash fraction. In the 125–180 μm ash fraction the type proportions vary with distance from vent between 6 and 27 km (Figures 3, 4): elongated particles increase from 2 to 6%; globular particles increase from 5 to 15%; irregular particles increase from 31 to more than 40% with a peak at 52% 12 km away from vent; blocky particles decrease from 62 to 36%. Irregular, globular and elongated particles are overwhelmingly sideromelane, while blocky particles are divided between tachylite, crystals, sideromelane and lithics, with a majority of tachylite and crystals.
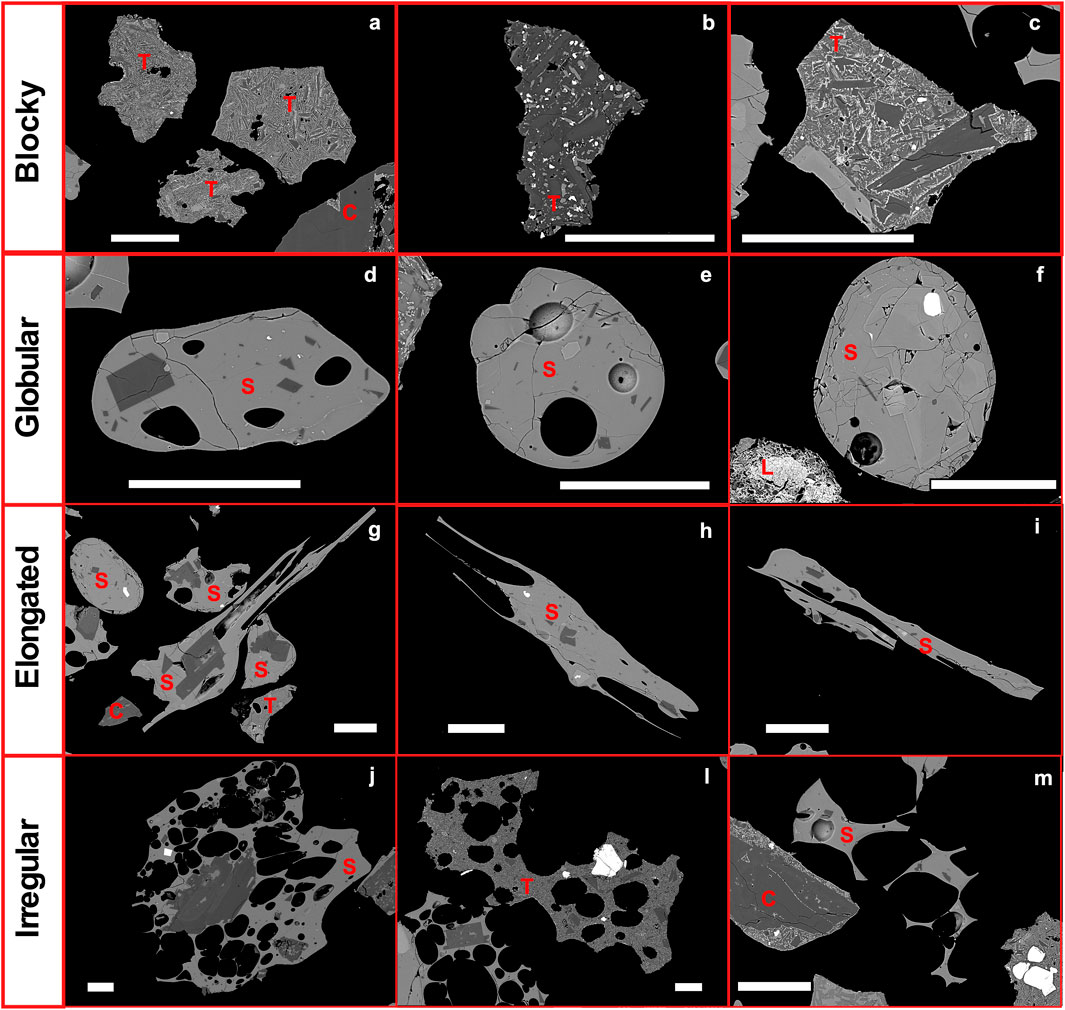
FIGURE 2. Representative SEM-BSE images of 125–180 μm sideromelane (S), tachylyte (T) crystal (C) and lithic (L) particles, grouped by shape categories. Images are grouped based on the shape category of the main particle in the picture. Scale bars are 100 µm long.

FIGURE 3. Componentry of 125-180 μm ash at the sampling locations (red points), in terms of both morphology and textural types. Componentry bars heights are normalized to relative mass load. Numbers indicate mass proportion of deposit within the isoline.
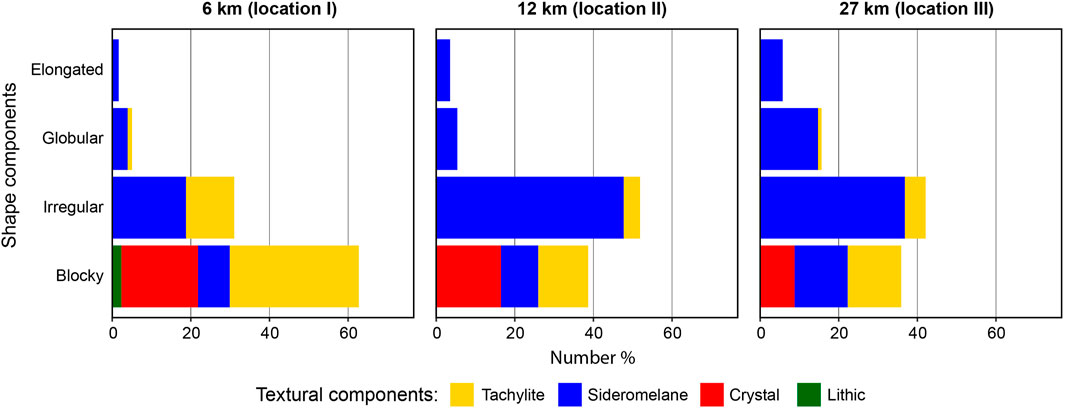
FIGURE 4. Componentry of the 125–180 µm ash fraction at locations I (6 km from vent), II (12 km from vent) and III (27 km from vent), in terms of both morphology and textural types. Data represented in number %.
Textural Componentry
Based on their textural characteristics, particles are divided into juvenile, crystals, lithic clasts, and occasional accretionary pellets (<1%). Lithic clasts are particles displaying diffuse crystal and glass alteration. Free crystals are divided in plagioclase and mafic (olivine and pyroxene) phases. They are generally blocky, contain partially crystallised melt inclusions, and are often surrounded by thin films of glass or matrix, which can make their contours rough (Figure 2). Accretionary pellets are unstructured aggregates of fine ash particles. Due to the spectrum of textures, juvenile particles are classified as sideromelane if the groundmass is <50% crystalline, and tachylite if the groundmass is >50% crystalline, after Taddeucci et al. (2004). However, textural and morphological features are variable for both particle categories. Sideromelane is present as elongated (fluidal) to blocky particles. Microlites in sideromelane are primarily plagioclase, sparse clinopyroxene, Fe- Ti oxides and rare olivine. Sideromelane vesicularity is variable, consisting of small (<30 μm) round, isolated (typically 0–5) vesicles, to elongated vesicles in fluidal particles (Figure 2). Tachylite is present as irregular to blocky particles with highly crystalline groundmasses of the same crystal makeup as sideromelane (Figure 2). Some tachylite particles have a similar number range and size of isolated, rounded vesicles as sideromelane, others have low vesicularity due to very small (<10 μm), irregular vesicles with irregular walls. Particle vesicularity range from 0 vol.% (most crystals and some tachylite particles) up to 54 vol.% (sideromelane particles). On average, vesicularity decreases with grainsize, with mean values ranging from 26 to 5 vol.% in 710–1,000 μm and 125–180 µm particles, respectively. As shown in Table 1, Sideromelane particles display average vesicularity of 28 vol.% (710–1,000 µm) and 11 vol.% (125–180 µm). Tachylite particles have mean vesicularity of 14 vol.% (710–1,000 µm) and 4 vol.% (125–180 µm).
The proportions of each component determined through classification of particles in SEM-BSE images are shown in Figure 4 and Supplementary Table S1.1. Sideromelane particles increase from 49% at location I to 74% at location II before decreasing to 68% at location III. Tachylite particles decrease from 46% at location I to 20 and 24% at locations II and III, respectively. Plagioclase crystals increase from 3% at location I to 4% at location II and decrease to 3% at location III. Mafic crystals account for 1% at locations I and II, and 3% at location III. Lithics and accretionary pellets (grouped due to their low proportions) have similar proportions at locations I and II (1%) and increase to 2% at location III. No composite particles showing both sideromelane and tachylite textures were observed in the 125–180 μm fraction. Mingling was however common in the 710–1,000 μm fraction, making the classification of juvenile material in a specific textural category difficult.
Quantitative Morphological Characterization
Bulk Tephra
Morphological properties of the bulk 125–180 μm and 710–1,000 μm fractions assessed by Morphologi G3, and of the bulk 125–180 μm fraction assessed by SEM, are compared in Figure 5; Table 2. The Morphologi G3 datasets show variations in CI and FF with grainsize (increase in CI and decrease in FF with the particles coarsening), suggesting a smoothening of the particle contours with decreasing grainsize, potentially due to the breakage of the grains below the size of the largest vesicle population found in these tephra. AR values increase only slightly with the grainsize, suggesting a faint trend of elongation of the particles towards finer grainsizes. CI, FF and AR assessed with the Morphologi G3 dataset show little changes with distance between 6 and 27 km from vent in both the size fractions investigated, highlighting the inability of the bulk tephra population to depict the shape-dependant fractionation processes occurring during transport in the plume. This is confirmed by the SEM dataset in the 125–180 µm fraction, which also shows little change with distance for the three morphological parameters computed here. The Morphologi G3 and the SEM datasets in the 125–180 µm fraction show striking differences, with SEM data consistently displaying rougher (higher CI and lower FF values) and more elongated forms (lower AR and FF values), and a larger variability, than G3 data. Such differences, also highlighted in a previous work (Buckland et al., 2018), are related to the smoothing effect of imaging projected shapes with Morphologi G3 vs. the roughening effect of imaging cross sections with the SEM. The ranges of AR and FF values measured here by Morphologi G3 are in good agreement with data acquired on other Etna ash (2002 eruption) by previous work using SEM imaging of grain silhouette (i.e., projected shapes; Coltelli et al., 2008).
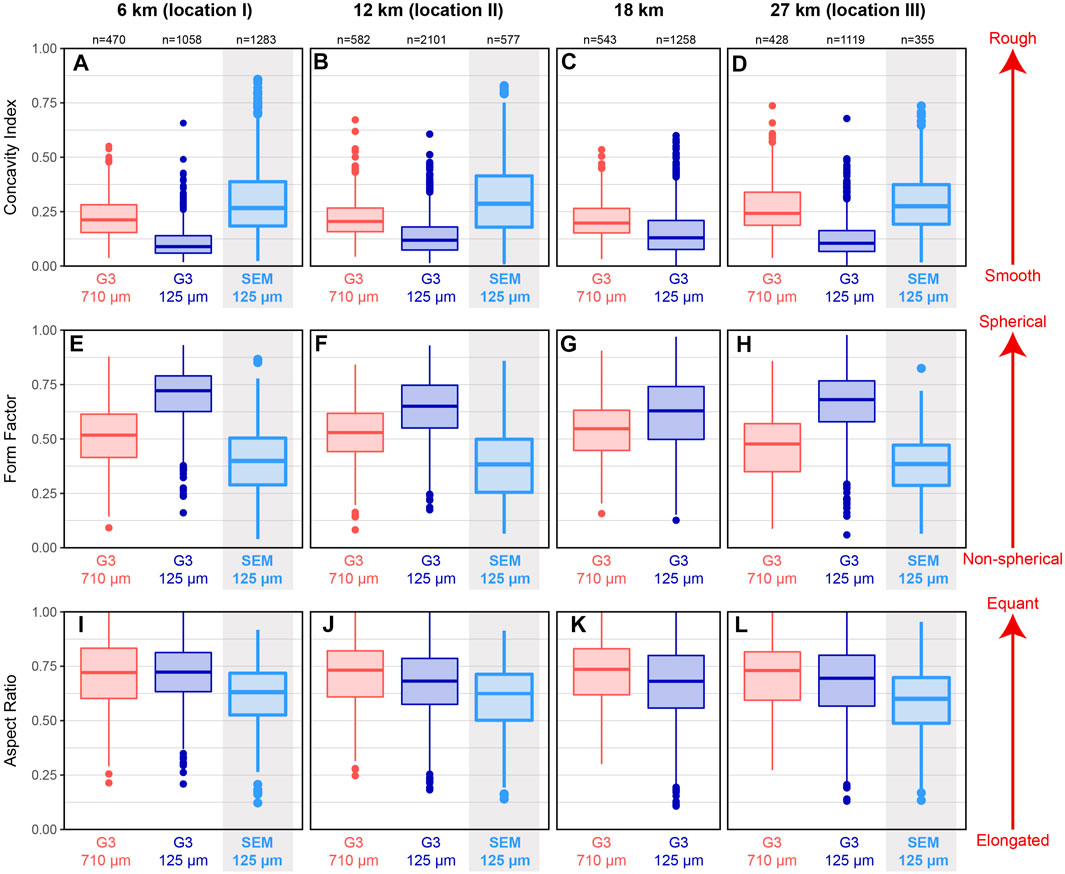
FIGURE 5. Variations with distance from vent of the Concavity Index, Form Factor and Aspect Ratio of the bulk 710–1,000 μm and 125–180 µm fractions represented by Tukey whiskers plots (where the thick middle line is the median, the lower and upper hinges are the 25th and 75th percentiles, the lower and upper whiskers extend from the hinge to the smallest or largest value no further than 1.5 x the inter quartile range, i.e. distance between the first and third quartiles, outliers are plotted individually). The Concavity Index (after Liu et al. (2015a)) is a measure of the roughness of the particles, while the Aspect Ratio is a measure of the form of the grains. The Form Factor is a mixed descriptor of roughness and form, and sometimes referred to as Sphericity.
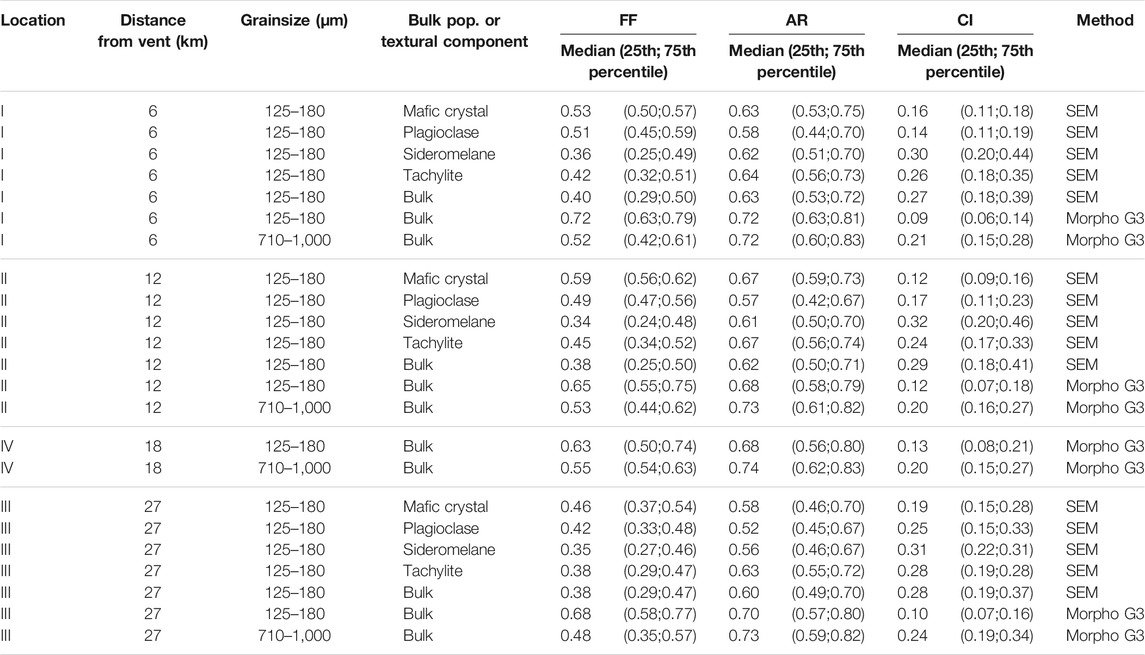
TABLE 2. Main 2D Morphological parameter of the bulk grain population in the 1,000–710 μm and 125–180 μm fractions, and the textural components in the 125–180 μm fraction, of the Etna 21 May tephra fall deposit at varying distances from vent (Morpho G3 and SEM measurements).
Shape Components
Using a subset of SEM images acquired in the 125–180 µm size fraction, CI, FF and AR were measured in each shape componentry groups, irrespectively of distance from vent (Figure 6; Table 3). As expected, the elongated particles have low AR while the globular, irregular and blocky particles have high AR (Figure 6C). The three latter also display a wider range of AR than elongated particles. As also expected, irregular particles have high values of CI (Figure 6A), in agreement with the rough contours inherited from their high vesicularity (Figure 2). Interestingly, elongated particles also show relatively high values of CI, which can be related to elongated vesicles generating extremely concave contours (Figure 2). Globular and blocky particles appear smoother (low CI values, Figure 6A). These characteristics translate into low FF values for elongated and irregular particles, and intermediate FF values for globular and blocky particles, highlighting the higher sensitivity of FF to concavity than form in this dataset (Figure 6B).
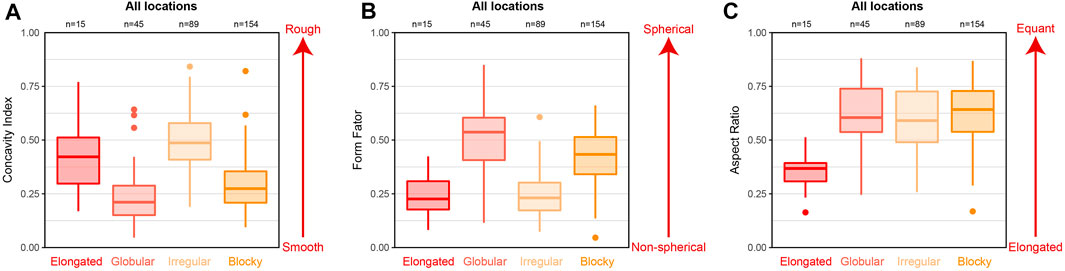
FIGURE 6. Concavity Index, Form Factor and Aspect Ratio of the 125–180 µm fraction from all the studied locations, separated by morphological component and represented by Tukey Whiskers plots (see caption of Figure 5 for a description of these boxplots). A subset of randomly picked SEM images from the 125–180 µm fraction was used to assess these shape parameters on the individual morphological components.

TABLE 3. Main 2D Morphological parameters of the shape components in the 125–180 µm fraction of the Etna 21 May tephra fall deposit, averaged over locations I, II and III (SEM measurements).
Textural Components
The shape parameters of each textural componentry group were calculated using the 125–180 µm SEM dataset (Figures 7, 8, Table 2). Due to the paucity of lithic particles, shape parameters were not assessed for this component, while crystals were separated into mafic crystals (olivine and pyroxene) and plagioclases. In the AR vs. CI and FF vs. CI spaces (Figure 7), the different componentry groups show distinctive characteristics despite some overlapping. Sideromelane particles are characterised by the largest variability of the three parameters. They show the lowest and highest CI values (Figure 7), which correspond to particles with very smooth (CI close to 0) and highly rough contours (CI > 0.7), respectively. The former are most certainly particles from the globular category, which is mostly composed of sideromelane (Figure 4) and have the lowest CI values of all the morphological components (Figure 6A). The latter are probably from the irregular category, which is dominated by sideromelane (Figure 4) and display the highest CI values of all the morphological components (Figure 6A). Sideromelane also show a wide range of AR and the lowest values, probably corresponding to particles from the elongated componentry category, which is entirely constituted of sideromelane particles (Figure 4). Tachylite particles also show variable shape parameters, but to a lesser extent than sideromelane (Figures 7, 8). Few tachylite particles have CI values >0.5, and none close to 0, which evidence the absence of very smooth (globular) and irregular particles among tachylite and confirm the results from the componentry analyses (Figure 4). AR values for tachylite are also >0.25, highlighting the absence of elongated particles (Figure 4). To conclude, while sideromelane grains are highly variable in terms of roughness and form, tachylite particles are more homogeneous and display equant regular shapes. Yet, sideromelane grains are relatively homogeneous texturally, while tachylite particles have highly heterogeneous textures (Figure 2 and Shape Componentry). Both mafic crystals and plagioclases show a narrow range of low CI values (Figure 8), indicating relatively smooth contours, and a wider range of AR values (Figure 8), suggesting a variety of crystal shapes from equant to elongated, in agreement with the habits of these crystals. FF for all the components mirror CI, as demonstrated by the negative correlation appearing in the FF vs. CI space where high FF values correspond to low CI values (Figure 7). This confirms that FF is mostly controlled by roughness in our dataset.
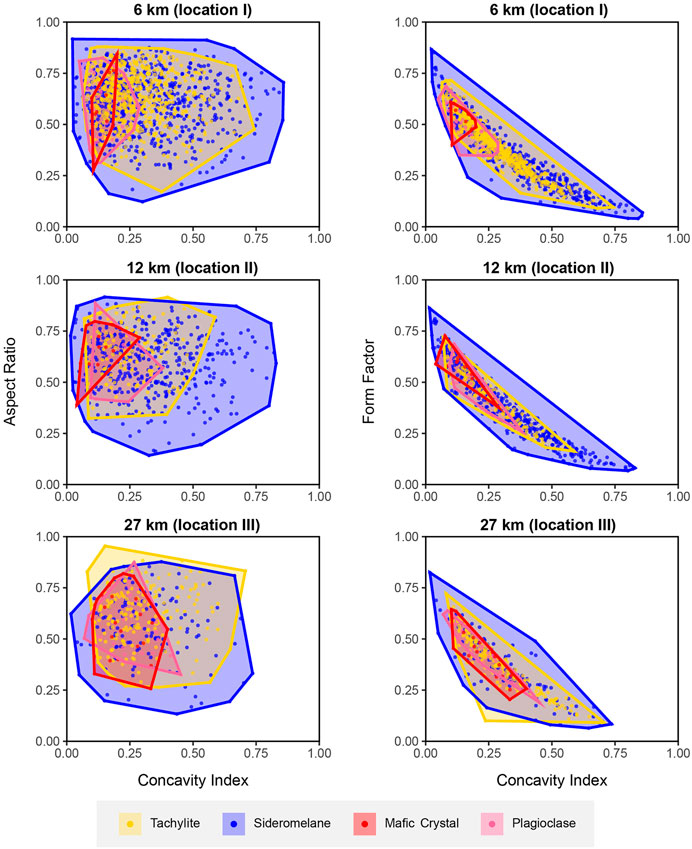
FIGURE 7. Aspect Ratio vs. Concavity Index and Form Factor vs. Concavity Index for the different textural componentry groups in the 125–180 µm size fraction at different distances from vent. Parameters measured by SEM image analysis. The convex hulls of each scatter plot separated by componentry groups are represented by the thick contours and shaded areas.
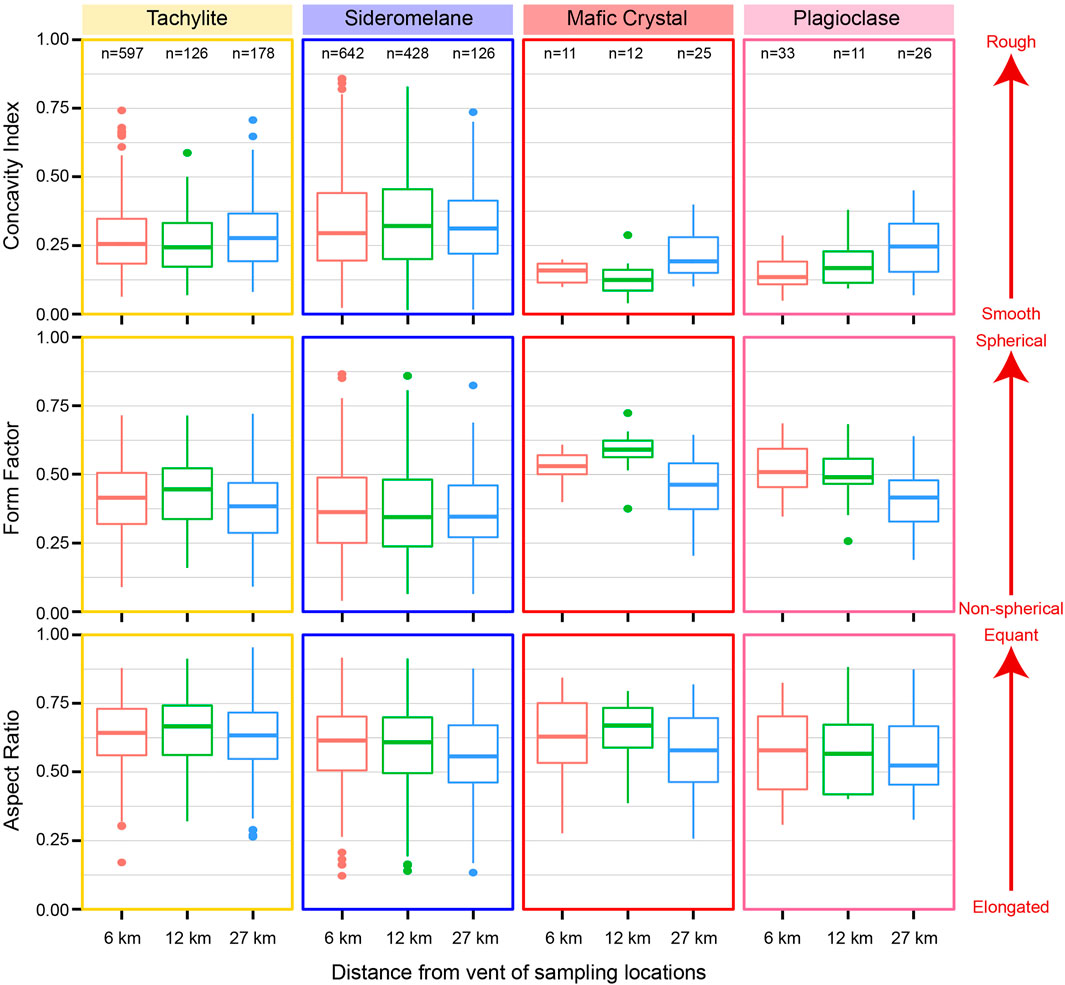
FIGURE 8. Variations with distance from vent of the Concavity Index, Form Factor and Aspect for the different textural componentry groups in the 125–180 µm size fraction, represented by Tukey whiskers plots (see caption of Figure 5 for a description of these boxplots).
CI, FF and to a minor extent AR show some dependence to the distance from vent, most apparent for the crystals and more crudely for sideromelane and tachylite (Figure 8). Crystals, particularly plagioclases, show an increase in CI and a decrease in FF with distance (Figure 8), meaning that crystals with rougher contours are transported further away in the plume. A similar but more subtle tendency towards increasing roughness with distance (i.e., increasing CI and decreasing FF) is observed with tachylite and sideromelane (Figure 8). On the other hand, a shallow decrease in AR with distance from vent is notable, particularly for plagioclases and sideromelane components (Figure 8), indicating that more elongated particles are transported further away. Notably, mafic crystals show higher CI values and lower AR values at location I (6 km from vent but slightly off-axis) than location II (12 km from vent but right on the axis), suggesting a crosswind fractionation effect that will be discussed in Transport Processes and Particle Fractionation. Note that the mafic crystal category combines olivine and pyroxene, which have different shapes and densities, which could explain some of the scatter in the trend.
Terminal Fall Velocities and Travelled Distances
We explored the impact of the morphological and textural variability of the ash particles produced by the eruption on the particle settling velocity using the theory of individual particle settling (Ganser 1993). We calculated the terminal fall velocity (Vt) of particles with the same properties than the clasts studied in this work (Figure 9). The densities of the particles were modelled based on the textural components identified here (i.e., sideromelane, tachylite, plagioclase and mafic crystals, see Methods for details on the density profiles), and the effect of the morphological variability was explored using the 125, 180, 710 and 1,000 μm grain sizes.
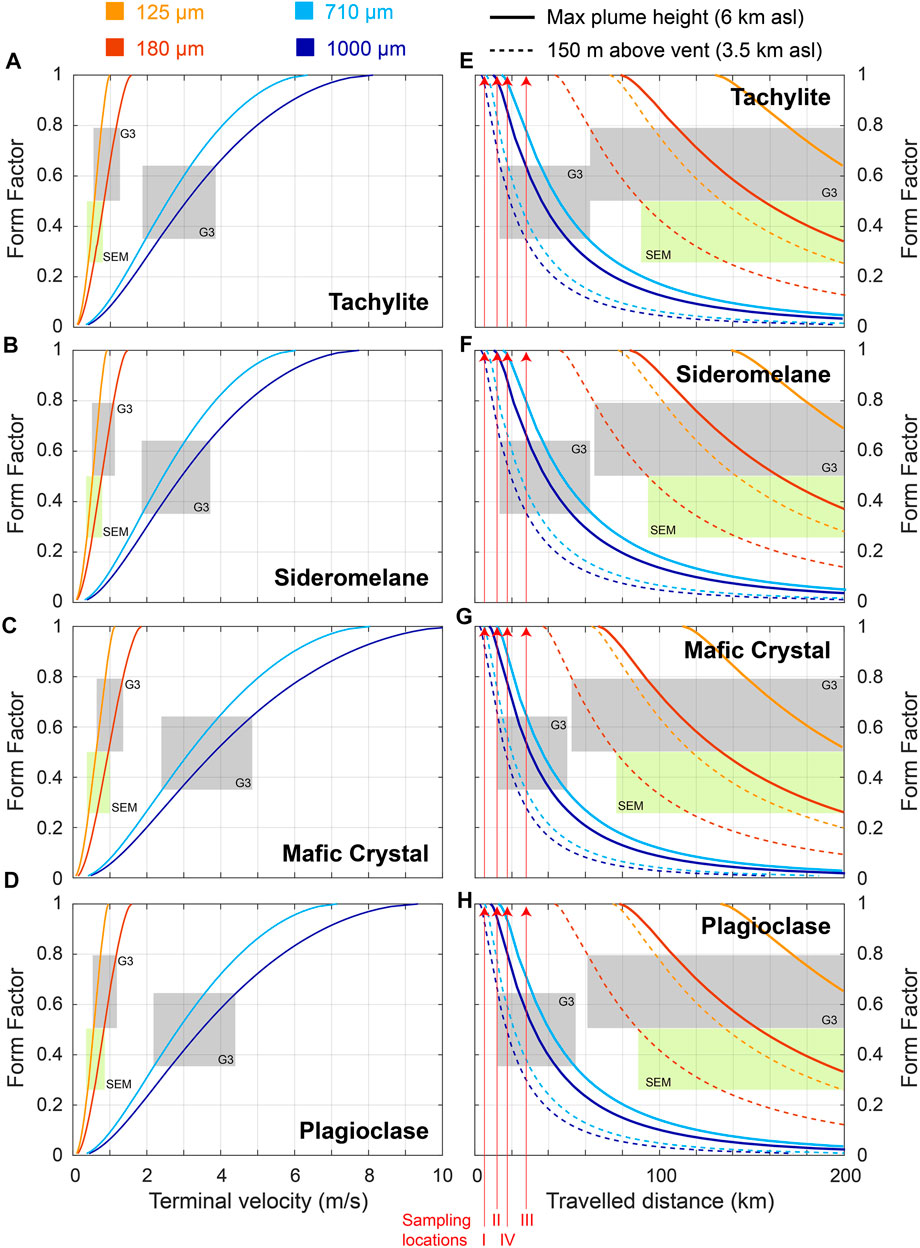
FIGURE 9. (A–D) Variations of the terminal fall velocity (Vt, taken here at 2 km a.s.l.) of each textural component with the Form Factor (FF) of the grains. (E–H) Variations of the distance travelled by each textural component with FF.
Vt and the travelled distances were computed for four grain sizes corresponding to the limits of the size fractions studied here (125–180 μm and 710–1,000 µm). Vt was calculated using the theoretical settling scheme for individual particles of Ganser (1993). The travelled distances were modelled using the measured wind field in the Mt. Etna area on the day of the eruption and assuming particle release from two endmember heights. The shaded areas correspond to ranges of FF values measured in our samples on the bulk population of grains (Figure 5), and the red arrows the distances from vent of the four sampling locations studied here (Figure 1).
All the textural components show large variations of Vt with FF, where Vt increases with FF (Figures 9A–D), i.e. with smoother particle contours and more equant forms. This effect increases with the grainsize, and with the particle density. The FF values inferred from Morphologi G3 analyses on the bulk particle population (Figure 5 and Table 2) are comprised between 0.3 and 0.7 (25th and 75th percentiles) for 710–1,000 µm particles, and 0.5 and 0.78 for 125–180 µm particles. These correspond to Vt values comprised between 2 and 5 m/s, and below 1.2 m/s, respectively, for all particle types (Figure 9), with maximum speed for the densest particles (i.e., mafic crystals). The FF values inferred from SEM analyses on the bulk 125–180 µm particle population (Figure 5 and Table 2) are lower, indicating lower Vt values (<0.9 m/s) than those inferred from G3 data (Figure 9).
These Vt trends translate into increasing travelled distances with decreasing FF (Figures 9E–H), meaning that rough and elongated particles are transported further away from vent than equant and smooth grains. The trend in travelled distances appears asymptotic towards low FF values, particularly for small grainsizes (<180 μm; Figures 9E–H), meaning that particles with small grainsizes and extreme morphologies (both in terms of roughness and form) have longer atmospheric residence times, assuming they are falling individually. We also note that the higher the particle release height, the further the particles travel (Figures 9E–H). As expected, smaller grainsizes and lower density components (sideromelane and tachylite) are also transported further. Interestingly, the modelled trends for 125 and 180 µm-sized particles indicate no particle settling before about 40–50 km from vent, even for a release height 150 m above vent (3.5 km a.s.l.), which is in disagreement with the field data (Figure 1). We note though that the 125–180 µm grainsize fraction is subordinate at all the sampling locations studied here (Figure 1). When accounting for the G3 and SEM-derived FF values, even longer travelled distances are expected (Figures 9E–H), and we observe that the difference between G3 and SEM-derived FF values translates into 20–25 km difference in travelled distances for this grainsize fraction. On the other hand, the model shows that the 710–1,000 µm particles are expected to settle at all the locations studied (Figures 9E–H), assuming a particle released height varying between 150 m above vent and the maximum plume height (6 km a.s.l.). This is to be expected given the bent-over character of the plume (Edwards et al., 2018), where maximum plume height increases with distance, leading to particles not all being released from the same height. For the 710-1,000 μm fraction (0.5 Φ), being close to the median diameter of all the samples studied here (Figure 1), results are in agreement with the field data and indicate individual particle settling at their Vt. Yet, the G3-derived FF values for this grainsize fraction indicate longer travelled distances than those observed in the field (Figures 9E–H).
Discussion
Comparison of Particles Analysis Methods
Differences exist between the two methods used in this study for determining the shape parameters of the volcanic ash particles. Morphologi G3 consistently gives lower mean CI values, and higher mean FF and AR values for the 125 µm particles compared to the SEM method (Figure 5). The differences can be associated with the different imaging methods, i.e., projected shape (G3) vs. randomly cut section of the particle (SEM). Top-down photography in the G3 method has the effect of producing 2D images of the 3D particles, leading to concavities within the particles often not being preserved, creating an artificial smoothness. Contrary to this, the SEM method images a single cross-section of the particle, leading to concavities not being reduced by wider over- or underlying particle regions.
Our results demonstrate that these different methods are each best adapted to distinct endpoints. SEM morphology data tend to give a wider range of shape parameters values, and thus a broader and more detailed view of the morphological characteristics of the grains, allowing distinguishing families of grains and interpreting in terms of fragmentation mechanisms. G3 morphology data are more representative of the whole particle, as can be done by SEM investigations of projected shapes (silhouette; Riley et al., 2003; Coltelli et al., 2008), and thus represent better the particles when they are falling through a fluid. Indeed, our G3-derived FF values appear closer to theoretical trends than SEM-derived FF values (Figure 9). We thus conclude that using both methods was critical in the work presented here, where we investigated both fragmentation and transport mechanisms.
Variability of the Particle Morphologies and Textures
There is a large variability in particle morphology and texture in our Etna samples. This translates into the two types of juvenile particles (sideromelane and tachylite) having overlapped morphological properties, which suggests that no single particle parameter (textural or morphological) can fully depict particle complexity. A single morphological classification of the particles, which is fundamental for modelling transport processes, is not able to depict the variability of particle types as seen from a more comprehensive analysis including textural features (Gurioli et al., 2015). In parallel, groundmass crystallisation textures cover an almost continuous range both in terms of crystallinity and crystal sizes. Variable groundmass textures have already been documented for tephra from the 3 days explosion series of December 2015 (Pompilio et al., 2017); in this case it was suggested that the variability was generated by a thermal gradient within the conduit, controlled by the balance between magma refill and crystallization. Textural properties of ash fragments, which rapidly quenched after fragmentation, are representative of magma texture at the time of fragmentation. As a consequence, textural heterogeneities in the ash properties reflect heterogeneities in the magma, occurring at a scale larger to the investigated ash size. Visual inspection of the ash fragments showed significantly different microlite textures even among completely crystallized particles, which testifies of significantly different crystallization conditions (decompression rates and possibly non-equilibrium) in addition to a variability of cooling rates (Figure 2). The compositions of the glass and crystals in tephra from this eruption measured in a previous study (Edwards et al., 2018) indicate interaction and mobilisation of multiple magma batches during the entire May 2016 eruptive crisis. These findings suggest that all the sideromelane clasts represent the lower crystallinity, hotter magma which rose from a depth of about 1 km a.s.l. and erupted through a recently emplaced, cooler and more crystalline shallow magma (stored within the volcano edifice). This shallow magma body is likely represented by the tachylite fragments characterized by large and euhedral crystals in the groundmass (Figure 2B). This interaction was associated with magma mingling up to the sub mm-scale, as also suggested by crystal incorporation from the crystalline magma into the gas-rich magma (Edwards et al., 2018). In parallel, tachylite particles with textures marked by very small, dendritic (i.e., <5 μm) crystallites (Figures 2A,C), are possibly formed by fast cooling within the plume itself or represent recycled particles (D’Oriano et al., 2014). Moreover, crystallinity heterogeneities do coexist in larger particles suggesting magma mixing at the microscale and possibly turbulence just before/at fragmentation. These complex relationships result into two textural types, which are only partially linked with morphological characteristics. Because componentry varies within the deposit, data from a single location are unlikely representative of the total tephra population. Sideromelane is the dominant component at all distances along the dispersal axis (Figure 3). A rough, first order magma budget approximated from the weight proportion of the different textural components in the 125–180 µm size fraction at the three sampling locations analysed in this work, suggests that the explosion emitted about 58% sideromelane and 37% tachylite particles, as well as 3% of plagioclase, 1% of mafic crystals and 1% of lithics. The relative proportion in the larger ash sizes analysed in this work is hard to quantify because of their mingled textures.
Insights on Fragmentation Mechanisms and Eruption Dynamics
Contrasting data on shape componentry confirm this complexity, and suggest multiple origins for tachylite particles and non-uniform fragmentation dynamics. Despite sideromelane and tachylite particles having overlapping morphological characteristics, sideromelane particles show a larger variability. Particles with intermediate and high CI values, either glassy or crystalline, are vesicular and show external shapes controlled by bubble wall geometries (Figures 2J,L,M). They appear similar to ash produced during silicic explosions (Heiken and Wholetz, 1985) and violent strombolian activity (Pioli et al., 2008; Wong and Larsen, 2010), suggesting fragmentation driven by bubble nucleation and gas expansion (Polacci et al., 2019). The large frequency of irregular particles, being the majority of the 710–1,000 mm particle sizes, which is the median of the distribution, suggests that bubble driven fragmentation is the main mechanism controlling explosivity in this event (Namiki et al., 2021). Sideromelane particles showing CI values below 0.1, corresponding to droplet-like, equant, rounded and bubble-free particles, and particles with AR values below 0.3, corresponding to elongated, filament-like shapes (Figures 2G–I–I, 7), suggest a primary role of surface tension forces in the fragmentation process (i.e., fragmentation within the magma jet; Villermaux, 2012; Jones et al., 2019). Blocky particles could have been formed by grinding/brittle fragmentation of cooled and degassed magma, possibly portions of previously emplaced lava flows interacting with the fragmenting volatile-rich magma batch or even the upper, degassed portions of the magma column which is outgassing in intereruptive times. Finally, crystalline irregular particles are probably recycled from explosions of the previous days (Figure 2L). Thus, the morphology range of ash particles of the May 2016 eruption suggests complex fragmentation processes occurring during lava fountain episodes at Etna. It starts within the conduit with the rapid expansion of bubbles in the fast rising, volatile rich magma batch which controlled the onset of the paroxysmal explosion. We suggest a passive role for the crystal-richer, degassed magma in the explosive event; it mingled and fragmented during the interaction with the rising magma batch, likely contributing to the fine tail of the tephra distribution. Finally, the combination of low viscosities and fast exit speeds determined the onset of capillary instabilities in the magma jet above the vent and secondary breakup of the sideromelane component with formation of globular and elongated particles. Based on the magma properties and vesicularity and eruption parameters (Edwards et al., 2018) we estimate a Ohnesorge number (quantifying the ratio between viscous and surface tension forces) comprised between 10–1 to 10 and fountain Re number (quantifying the ratio between inertial and viscous forces) between 104 and 106. These values suggest both turbulent dynamics but also confirm the significant role of surface tension forces in forming instabilities leading to secondary fragmentation in the fountain (Villermaux, 2012; Jones et al., 2019).
Transport Processes and Particle Fractionation
The morphological characteristics of the bulk tephra population do not change with distance from vent (Figure 5), while individual components are clearly fractionated during transport (Figures 3, 4), with higher density particles (tachylite and crystals) settling closer to vent than low density particles (vesicular material, i.e., irregular grains). Similar particle fractionation during transport was evidenced at Etna by componentry studies in the fallout deposit from the 24 November 2006 eruption (Polacci et al., 2019), and is mostly related to the contrasting densities of the components. Yet, within each textural componentry category, shape correlates with distance from vent (Figure 8), with smooth and equant particles settling closer to vent than rough and elongated ones, in line with results from previous studies (Saxby et al., 2020), and in agreement with the trends modelled by the settling simulations (Figure 9). This is particularly well illustrated by the behaviour of crystals (Figure 8), which are characterised by a small range of densities. The roughest and most elongated crystals (high CI and low AR values, respectively) settle further away than the smoother and more equant ones (low CI and high AR values, respectively). This trend exists but is more subtle for sideromelane and tachylite (Figure 8), which can be related to their large variability in density due to their heterogeneous textures. These results show that density-driven fractionation dominates over shape-driven fractionation during proximal transport, which explains why the overall morphological characteristics of the bulk particle population is virtually unchanged at the distances investigated here, while the textural componentry is strongly affected. Additionally, our data demonstrate that form and roughness are both important for describing the aerodynamic behaviour of particles. This suggests that using a single hybrid parameter such as FF in numerical models of tephra transport and deposition is restrictive, especially given the intrinsic heterogeneity of volcanic ash.
The complex relationship between particle shape and texture and their variability within the Etna May 2016 tephra population results into a non-linear spatial distribution of the different types of particles within the deposit (Figures 3, 4). Within juvenile particles, higher density (lower vesicularity) favours earlier deposition of most tachylite particles with respect to sideromelane. However, the elongated sideromelane particles are transported further away. They are likely predominant within the most distally settled material, which is rarely sampled given that studies usually focus on the areas surrounding Mt. Etna up to the sea coast. In other words, most studies on Etna tephra have likely overlooked the most aerodynamic category of particles (i.e., the one with the largest transport distances and thus potential impact) because of objective sampling limitations.
The trends obtained when applying the theory of individual particle settling to the 21 May 2016 Etna eruption are in good agreement with the findings derived from the morphological analyses (Figure 9). Namely, rough and elongated grains are expected to travel further than smooth and equant particles, when density and grainsize are constant. Yet, the modelled travelled distances poorly reproduce the grainsize trend observed in the fallout deposit, even when considering variable components and FF values (Figure 9). In the case of the 125–180 µm grainsize fraction, the discrepancy between modelled and observed trends is not surprising, given that this fraction is subordinate (tail of the grainsize distribution) at all the sampling locations studied in this work (Figure 1). Our simulations confirm that the particles in this size range did not settle individually, but rather via a process of enhanced sedimentation, potentially aggregation or gravitational settling (Brown et al., 2012; Manzella et al., 2015). This is also supported by the 125–180 µm fraction being the most prevalent at proximal locations (see location I in Figure 1), where collective settling mechanisms are helped by the high particle concentration in the plume. In the case of the 710–1,000 µm fraction, the model suggests higher FF values than those derived from G3 analyses, which points towards larger travelled distances than those observed in the field (Figures 9E–H). While G3-derived FF values appears more appropriate than SEM-derived FF values, they are still too low for the settling equation used here. This can be because FF corresponds to a 2D sphericity, while the equation used for the drag coefficient here requires values for 3D sphericity (Ganser, 1993). It has been demonstrated that 2D and 3D sphericity values for similar objects can depart significantly, with an impact on settling simulations for volcanic ash particles (Saxby et al., 2018).
Interestingly, the 21 May 2016 Etna fallout deposit has some striking sedimentological features with a narrow shape and asymmetric Md and mass load spatial distributions that do not correlate (Figure 1 and Supplementary Figure S1.2). Most importantly, the Md and mass load do not follow a typical decreasing trend with increasing distance from vent (Supplementary Figure S1.2). Downwind, this translates into a fairly constant Md along the deposit axis and a mass load maximum at about 5–12 km from the vent (Figure 1 and Supplementary Figure 1.2). Crosswind, this translates into a decreasing trend in median grainsize (increasing Φ-based Md values) along North East to South West transects perpendicular to the dispersal axis, while the mass load values show a symmetric decrease away from the dispersal axis along the same transects (Figure 1). We suggest that this is caused by complex local wind circulations which strongly affect the deposition from the weak plume (Poulidis et al., 2021). Indeed, strong orographic effects can be expected on the slopes of Mount Etna, which is an edifice of the same spatial scale than the weak plume generated by the eruption investigated here. Specifically, the crosswind asymmetry in grainsize suggests wind shear (change in wind direction below the maximum plume height) that was not resolved in the wind data used in our simulations. Because the sampling locations studied here were chosen on the dispersal axis, they show relatively small Md variations compared to the crosswind trends. Yet, componentry variations, and subtle morphological changes in textural groups, can be observed. This indicates that, along the dispersal axis and at the proximal sampling distances investigated here, density-fractionation dominated not only over shape-fractionation but also over size-fractionation. This is potentially caused by the complex wind effects discussed above, but is also probably due to the narrow total grainsize distribution of this deposit (Edwards et al., 2018). These findings suggest that proximal grainsize data, especially when originating from volcano slopes where orographic effects are enhanced (Poulidis et al., 2021), should be handled with caution, and that both downwind and crosswind grainsize, mass load, componentry and morphological trends should be confronted to obtain a reliable picture of the sedimentation processes at play.
General Implications
Mafic, ash-rich eruptions are particularly frequent at Etna (Branca and Del Carlo, 2005) but are also typical of other open conduit arc volcanoes such as Villarrica, Stromboli, or Ambryn volcanoes. The implication of such activity in term of volcanic hazard is relevant, especially in the case of frequently erupting volcanoes in densely populated areas such as Etna, but also for air transportation activities. The May 21, 2016 eruption at Etna can be considered as a type case; it shows how frequent magma recharge associated with continuous outgassing affects shallow magma properties. Shallow magma interacts with primitive magma rising in syneruptive times generating eruptions fed by heterogeneous melts. This phenomenon typically generates tephra which is non uniform for textural, physical and morphological features (Taddeucci et al., 2004a; Alfano et al., 2009; Perez et al., 2009; DeVitre et al., 2019). Identification of magma types (end members, hybrid) by petrographic investigations is relatively straightforward (Taddeucci et al., 2002; Polacci et al., 2019); quantifying how magma types distribute within tephra populations and how they relate to the morphological properties of the pyroclastic particles requires a more comprehensive approach based on several analytical techniques. This work demonstrates that a purely morphological study, even if performed on statistically relevant samples, is not capable of depicting this complexity and instead could provide results suggesting a false uniformity of clast properties across the tephra blanket (Supplementary Figure S1.3), because it neglects the role of textural (and thus density) differences in particle fractionation. Clast heterogeneity needs to be accounted for eruption modelling and hazard assessments; in fact, simulations assuming homogeneous tephra population (in terms of texture, density and shape) could significantly underestimate ash dispersal (by neglecting the occurrence of very elongated particles, which are rarely sampled at proximal/medial locations) or, on the contrary, underestimate proximal ash settling (by neglecting dense, tachylite, equant grains and lithic fragments).
Conclusion
Understanding the dynamics of small scale, ash forming, mafic, explosive eruptions is a complex task which requires detailed data on eruption parameters, particle morphology and texture and how they affect transport within the plume. Open conduit conditions, frequent magma recharge (and eruption) determine significant heterogeneities in the magma involved in the eruptive activity and are likely responsible for the variable eruptive dynamics (from effusive to subplinian explosions) which characterise Etna, which is a type example of frequently erupting, open conduit mafic system fed by water rich mafic magma. Fragmentation processes are heterogeneous and mostly controlled by the fast rise of a volatile rich magma batch, which mingles with a residual, crystal rich and degassed magma, producing tephra with contrasting textures and morphologies, and also characterized by a dominant ash fraction, which forms either by inertia (i.e., gas expansion) and capillary dominated (i.e., jet instabilities) processes. Consequently, tephra shows significant variability both in terms of shape and texture, which distributes non-uniformly within the deposit and across grainsizes. The quantification of the property distribution of the actual population of ash particles generated in these eruptions is, however, not straightforward, because of differential transport in the plume and thus, non-uniform distribution in the tephra blanket. This effect is even more important in the case of a few thousands of m high, weak plumes which are typical of moderate explosivity activity generated by these volcanoes. Individual particle settling from an increasing height explains well the median grainsize of the deposit at all the sampling locations studied, as well as the changes of grain morphology within texturally homogeneous groups characterized by a narrow range of density, but it fails in explaining some of the collected data; mostly because more complex transport and sedimentation processes (such as particle aggregation and complex local winds) could have controlled the plume dynamics. This study main limitation is the impossibility of sampling tephra at distances from the vent larger than 27 km, thus it is likely underestimating the percentage of the most aerodynamical particles erupted in the eruption.
Data Availability Statement
The original contributions presented in the study are included in the article/Supplementary Material, further inquiries can be directed to the corresponding author.
Author Contributions
LP and ME sampled the deposit; ME performed grainsizes, componentry and SEM observations and image collection; LP did shape componentry data, JE did G3 analyses and numerical simulations. ME wrote a first draft of the paper; all the authors collaborated into conceiving the study, developing the final model, data check and comparison and drafting the final version of this manuscript.
Funding
ME and LP were supported by FNS project n. 200021_162439 (to LP).
Conflict of Interest
The authors declare that the research was conducted in the absence of any commercial or financial relationships that could be construed as a potential conflict of interest.
Publisher’s Note
All claims expressed in this article are solely those of the authors and do not necessarily represent those of their affiliated organizations, or those of the publisher, the editors and the reviewers. Any product that may be evaluated in this article, or claim that may be made by its manufacturer, is not guaranteed or endorsed by the publisher.
Acknowledgments
We are grateful to Mr. J.C. Boccard for having prepared samples for SEM observations, to D. Andronico and A. Cristaldi for the fieldwork, and to Krzysztof Suchorski for assisting with the Morphologi G3 analyses. This is Laboratory of Excellence ClerVolc contribution n° 494.
Supplementary Material
The Supplementary Material for this article can be found online at: https://www.frontiersin.org/articles/10.3389/feart.2021.709657/full#supplementary-material
References
Alfano, F., Pioli, L., Clarke, A. B., Ort, M. H., Roggensack, K., and Self, S. (2009). Highly Explosive Mafic Eruptions from the Interplay between High Viscosity and Low Viscosity Magma: The Sunset Crater (AZ, USA) Eruption. San Francisco: AGU Fall meeting, V23C–V2838.
Andronico, D., Behncke, B., De Beni, E., Cristaldi, A., Scollo, S., Lopez, M., et al. (2018). Magma Budget from Lava and Tephra Volumes Erupted during the 25-26 October 2013 Lava fountain at Mt Etna. Front. Earth Sci. 6, 116. doi:10.3389/feart.2018.00116
Andronico, D., Cristaldi, A., Del Carlo, P., and Taddeucci, J. (2009a). Shifting Styles of Basaltic Explosive Activity during the 2002–03 Eruption of Mt Etna, Italy. J. Volcanol. Geotherm. Res. 180 (2–4), 110–122. doi:10.1016/j.jvolgeores.2008.07.026
Andronico, D., Cristaldi, A., and Scollo, S. (2008). The 4-5 September 2007 Lava fountain at South-East Crater of Mt Etna, Italy. J. Volcanol. Geotherm. Res. 173, 325–328. doi:10.1016/j.jvolgeores.2008.02.004
Andronico, D., Scollo, S., Cristaldi, A., and Ferrari, F. (2009b). Monitoring Ash Emission Episodes at Mt. Etna: The 16 November 2006 Case Study. J. Volcanol. Geotherm. Res. 180 (2–4), 123–134. doi:10.1016/j.jvolgeores.2008.10.019
Andronico, D., Scollo, S., and Cristaldi, A. (2015). Unexpected Hazards from Tephra Fallouts at Mt Etna: The 23 November 2013 Lava fountain. J. Volcanol. Geother. Res. 304, 118–125. doi:10.1016/j.jvolgeores.2015.08.007
Andronico, D., Scollo, S., Lo Castro, M. D., Cristaldi, A., Lodato, L., and Taddeucci, J. (2014). Eruption Dynamics and Tephra Dispersal from the 24 November 2006 Paroxysm at South-East Crater, Mt Etna, Italy. J. Volcanol. Geotherm. Res. 274, 78–91. doi:10.1016/j.jvolgeores.2014.01.009
Bagheri, G., and Bonadonna, C. (2016). “Aerodynamics of Volcanic Particles,” in Volcanic Ash. Editors K. Cashman, H. Ricketts, A. Rust, and M. Watson (Amsterdam: Elsevier), 39–52. doi:10.1016/b978-0-08-100405-0.00005-7
Bonadonna, C., Ernst, G. G. J., and Sparks, R. S. J. (1998). Thickness Variations and Volume Estimates of Tephra Fall Deposits: the Importance of Particle Reynolds Number. J. Volcanol. Geotherm. Res. 81, 173–187. doi:10.1016/s0377-0273(98)00007-9
Branca, S., and Carlo, P. D. (2005). Types of Eruptions of Etna Volcano AD 1670-2003: Implications for Short-Term Eruptive Behaviour. Bull. Volcanol. 67, 732–742. doi:10.1007/s00445-005-0412-z
Brown, R. J., Bonadonna, C., and Durant, A. J. (2012). A Review of Volcanic Ash Aggregation. Phys. Chem. Earth 45-46, 65–78. doi:10.1016/j.pce.2011.11.001
Buckland, H. M., Eychenne, J., Rust, A. C., and Cashman, K. V. (2018). Relating the Physical Properties of Volcanic Rocks to the Characteristics of Ash Generated by Experimental Abrasion. J. Volcanol. Geotherm. Res. 349, 335–350. doi:10.1016/j.jvolgeores.2017.11.017
Cannata, C. B., De Rosa, R., Donato, P., Donato, S., Lanzafame, G., Mancini, L., et al. (2019). First 3D Imaging Characterization of Pele’s Hair from Kilauea Volcano (Hawaii). Sci. Rep. 9, 1711. doi:10.1038/s41598-018-37983-9
Cashman, K., and Rust, A. (2016). “Volcanic Ash: Generation and Spatial Variation,” in Volcanic Ash, Hazard Observation (Amsterdam: Elsevier), 5–22. doi:10.1016/b978-0-08-100405-0.00002-1
Cimarelli, C., Di Traglia, F., and Taddeucci, J. (2010). Basaltic Scoria Textures from a Zoned Conduit as Precursors to Violent Strombolian Activity. Geology 38 (5), 439. doi:10.1130/g30720.1
Cioni, R., D'Oriano, C., and Bertagnini, A. (2008). Fingerprinting Ash Deposits of Small Scale Eruptions by Their Physical and Textural Features. J. Volcanol. Geotherm. Res. 177, 277–287. doi:10.1016/j.jvolgeores.2008.06.003
Coltelli, M., Miraglia, L., and Scollo, S. (2008). Characterization of Shape and Terminal Velocity of Tephra Particles Erupted during the 2002 Eruption of Etna Volcano, Italy. Bull. Volcanol. 70 (9), 1103–1112. doi:10.1007/s00445-007-0192-8
Corsaro, R. A., Andronico, A., Behncke, B., and Branca, S. (2017). Monitoring the December 2015 summit Eruptions of Mt. Etna (Italy): Implications on Eruptive Dynamics. J. Volcanol. Geotherm. Res. 341, 53–69. doi:10.1016/j.jvolgeores.2017.04.018
D'Oriano, C., Bertagnini, A., Cioni, R., and Pompilio, M. (2014). Identifying Recycled Ash in Basaltic Eruptions. Scientific Rep. 4 (1), 1–8. doi:10.1038/srep05851
De Michieli Vitturi, M., Engwell, S. L., Neri, A., and Barsotti, S. (2016). Uncertainty Quantification and Sensitivity Analysis of Volcanic Columns Models: Results from the Integral Model PLUME-MoM. J. Volcanol. Geotherm. Res. 326, 77–91. doi:10.1016/j.jvolgeores.2016.03.014
Deligne, N. I., Horspol, N., Canessa, S., Matcham, I., Williams, G., and Wilson, G. (2017). Evaluating the Impacts of Volcanic Eruptions Using RiskScape. J. Appl. Volcanol. 6, 18. doi:10.1186/s13617-017-0069-2
DeVitre, C. L., Gazel, E., Allison, C. M., Soto, G., Madrigal, P., Alvarado, G. E., et al. (2019). Multi-stage Chaotic Magma Mixing at Turrialba Volcano. J. Volcanol. Geotherm. Res. 381, 330–346. doi:10.1016/j.jvolgeores.2019.06.011
Edwards, M. J., Pioli, L., Andronico, D., Scollo, S., Ferrari, F., and Cristaldi, A. (2018). Shallow Factors Controlling the Explosivity of Basaltic Magmas: The 17–25 May 2016 Eruption of Etna Volcano (Italy). J. Volcanol. Geotherm. Res. 357, 425–436. doi:10.1016/j.jvolgeores.2018.05.015
Edwards, M. J., Pioli, L., Harris, A. J. L., Gurioli, L., and Thivet, S. (2020). Magma Fragmentation and Particle Size Distributions in Low Intensity Mafic Explosions: The July/August 2015 Piton de la Fournaise Eruption. Sci. Rep. 10, 13953. doi:10.1038/s41598-020-69976-y
Eychenne, J., and Le Pennec, J. L. (2012). Sigmoidal Particle Density Distribution in a Subplinian Scoria Fall deposit. Bull. Volcanol. 74 (10), 2243–2249. doi:10.1007/s00445-012-0671-4
Eychenne, J., Rust, A. C., Cashman, K. V., and Wobrock, W. (2017). Distal Enhanced Sedimentation from Volcanic Plumes: Insights from the Secondary Mass Maxima in the 1992 Mount Spurr Fallout Deposits. J. Geophys. Res. 122 (10), 7679–7697. doi:10.1002/2017jb014412
Freret-Lorgeril, V., Donnadieu, F., Eychenne, J., Soriaux, C., and Latchimy, T. (2019). In Situ terminal Settling Velocity Measurements at Stromboli Volcano: Input from Physical Characterization of Ash. J. Volcanol. Geotherm. Res. 374, 62–79. doi:10.1016/j.jvolgeores.2019.02.005
Ganser, G. H. (1993). A Rational Approach to Drag Prediction of Spherical and Nonspherical Particles. Powder Techn. 77 (2), 143–152. doi:10.1016/0032-5910(93)80051-b
Genareau, K., Mulukutla, G. K., Proussevitch, A. A., Durant, A. J., Rose, W. I., and Sahagian, D. L. (2013). The Size Range of Bubbles that Produce Ash during Explosive Volcanic Eruptions. J. Appl. Volcanol. 2 (1), 4. doi:10.1186/2191-5040-2-4
Gonnermann, H. M. (2015). Magma Fragmentation. Ann. Rev. Earth Planet. Sci. 43, 431–458. doi:10.1146/annurev-earth-060614-105206
Grady, D. E. (2010). Length Scales and Size Distributions in Dynamic Fragmentation. J. Fract. 163, 85–99. doi:10.1007/s10704-009-9418-4
Gurioli, L., Andronico, D., Bachelery, P., Balcone-Boissard, H., Battaglia, J., Boudon, G., et al. (2015). MeMoVolc Consensual Document: a Review of Cross-Disciplinary Approaches to Characterizing Small Explosive Magmatic Eruptions. Bull. Volcanol. 77, 49. doi:10.1007/s00445-015-0935-x
Hayes, T., Wilson, T., Deligne, N. I., Lindsay, J. M., Leonard, G. S., Tsang, S. W. R., et al. (2020). Developing a Suite of Multi-hazard Volcanic Eruption Scenarios Using an Interdisciplinary Approach. J. Volcanol. Geotherm. Res. 392, 106763. doi:10.1016/j.jvolgeores.2019.106763
Horwell, C. J., and Baxter, P. J. (2006). The Respiratory Health Hazards of Volcanic Ash: a Review for Volcanic Risk Mitigation. Bull. Volcanol. 69 (1), 1–24. doi:10.1007/s00445-006-0052-y
Jones, T. J., Reynolds, C. D., and Boothroyd, S. C. (2019). Fluid Dynamic Induced Break-Up during Volcanic Eruptions. Nat. Comm. 10 (1), 1–7. doi:10.1038/s41467-019-11750-4
Kueppers, U., Scheu, B., and Spieler, O. (2006). Fragmentation Efficiency of Explosive Volcanic Eruptions: a Study of Experimentally Generated Pyroclasts. J. Volcanol. Geoth. Res. 153, 125–135. doi:10.1016/j.jvolgeores.2005.08.006
Leibrandt, S., and Le Pennec, J. L. (2015). Towards Fast and Routine Analyses of Volcanic Ash Morphometry for Eruption Surveillance Applications. J. Volcanol. Geoth. Res. 297, 11–27. doi:10.1016/j.jvolgeores.2015.03.014
Liu, E. J., Cashman, K. V., Rust, A. C., and Gislason, S. R. (2015a). The Role of Bubbles in Generating fine Ash during Hydromagmatic Eruptions. Geology 43, 239–242. doi:10.1130/g36336.1
Liu, E. J., Cashman, K. V., and Rust, A. C. (2015b). Optimising Shape Analysis to Quantify Volcanic Ash Morphology. Geo. Res. J. 8, 14–30. doi:10.1016/j.grj.2015.09.001
Manzella, I., Bonadonna, C., Phillips, J. C., and Monnard, H. (2015). The Role of Gravitational Instabilities in Deposition of Volcanic Ash. Geology 43, 211–214. doi:10.1130/g36252.1
Maria, A., and Carey, S. (2007). Quantitative Discrimination of Magma Fragmentation and Pyroclastic Transport Processes Using the Fractal Spectrum Technique. J. Volcanol. Geotherm. Res. 161 (3), 234–246. doi:10.1016/j.jvolgeores.2006.12.006
Marzocchi, W., and Bebbington, M. (2012). Probabilistic Eruption Forecasting at Short and Long Time Scales. Bull. Volcanol. 74, 1777–1805. doi:10.1007/s00445-012-0633-x
Mastin, L. G., Guffanti, M., Servranck, R., Webley, P., Barsotti, S., Dean, K., et al. (2009). A Multidisciplinary Effort to Assign Realistic Source Parameters to Models of Volcanic Ash-Cloud Transport and Dispersion during Eruptions. J. Volcanol. Geotherm. Res. 186, 10–21. doi:10.1016/j.jvolgeores.2009.01.008
Mele, D., Dellino, P., Sulpizio, R., and Braia, G. (2011). A Systematic Investigation on the Aerodynamics of Ash Particles. J. Volcanol. Geotherm. Res. 203 (1-2), 1–11. doi:10.1016/j.jvolgeores.2011.04.004
Miwa, T., Iriyama, Y., Nagai, M., and Nanayama, F. (2020). Sedimentation Process of Ashfall during a Vulcanian Eruption as Revealed by High-Temporal-Resolution Grain Size Analysis and High-Speed Camera Imaging. Prog. Earth Planet. Sci. 7 (1), 3. doi:10.1186/s40645-019-0316-8
Miwa, T., Toramaru, A., and Iguchi, M. (2009). Correlations of Volcanic Ash Texture with Explosion Earthquakes from Vulcanian Eruptions at Sakurajima Volcano, Japan. J. Volcanol. Geotherm. Res. 184 (3–4), 473–486. doi:10.1016/j.jvolgeores.2009.05.012
Namiki, A., Patrick, M. R., Manga, M., and Houghton, B. F. (2021). Brittle Fragmentation by Rapid Gas Separation in a Hawaiian fountain. Nat. Geosci. 14, 242–247. doi:10.1038/s41561-021-00709-0
Nurfiani, D., and de Maisonneuve, C. B. (2018). Furthering the Investigation of Eruption Styles through Quantitative Shape Analyses of Volcanic Ash Particles. J. Volcanol. Geotherm. Res. 354, 102–114. doi:10.1016/j.jvolgeores.2017.12.001
Pardo, N., Avellaneda, J. D., Rausch, J., Jaramillo-Vogel, D., Gutiérrez, M., and Foubert, A. (2020). Decrypting Silicic Magma/plug Fragmentation at Azufral Crater lake, Northern Andes: Insights from fine to Extremely fine Ash Morpho-Chemistry. Bull. Volcanol. 82, 79. doi:10.1007/s00445-020-01418-z
Pérez, W., Freundt, A., Kutterolf, S., and Schmincke, H.-U. (2009). The Masaya Triple Layer: A 2100 Year Old Basaltic Multi-Episodic Plinian Eruption from the Masaya Caldera Complex (Nicaragua). J. Volcanol. Geotherm. Res. 179, 191–205. doi:10.1016/j.jvolgeores.2008.10.015
Pioli, L., Bonadonna, C., and Pistolesi, M. (2019). Reliability of Total Grainsize Distribution of Tephra Deposits. Sci. Rep. 9, 10006. doi:10.1038/s41598-019-46125-8
Pioli, L., Erlund, E., Johnson, E., Cashman, K. V., Wallace, P., Rosi, M., et al. (2008). Explosive Dynamics of Violent Strombolian Eruptions: The Eruption of Parícutin Volcano 1943–1952 (Mexico). Earth Planet. Sci. Lett. 271, 359–368. doi:10.1016/j.epsl.2008.04.026
Polacci, M., Andronico, D., de’ Michieli Vitturi, M., Taddeucci, J., and Cristaldi, A. (2019). Mechanisms of Ash Generation at Basaltic Volcanoes: The Case of Mount Etna, Italy. Front. Earth Sci. 7 (August), 193. doi:10.3389/feart.2019.00193
Polacci, M., Corsaro, R. A., and Andronico, D. (2006). Coupled Textural and Compositional Characterization of Basaltic Scoria: Insights into the Transition from Strombolian to Fire fountain Activity at Mount Etna, Italy. Geology 34, 201–204. doi:10.1130/G22318.1
Pompilio, M., Bertagnini, A., Carlo, P., and Roberto, A. (2017). Magma Dynamics within a Basaltic Conduit Revealed by Textural and Compositional Features of Erupted Ash: the December 2015 Mt. Etna Paroxysms. Sci. Rep. 7, 4805. doi:10.1038/s41598-017-05065-x
Poret, M., Costa, A., Andronico, D., Scollo, S., Gouhier, M., and Cristaldi, A. (2018). Modeling Eruption Source Parameters by Integrating Field, Ground‐Based, and Satellite‐Based Measurements: The Case of the 23 February 2013 Etna Paroxysm. J. Geophys. Res. 123, 5427–5450. doi:10.1029/2017jb015163
Porritt, L. A., Russell, J. K., and Quane, S. L. (2012). Pele's Tears and Spheres: Examples from Kilauea Iki. Earth Planet. Sci. Lett. 333–334, 171–180. doi:10.1016/j.epsl.2012.03.031
Poulidis, A. P., Biass, S., Bagheri, G., Takemi, T., and Iguchi, M. (2021). Atmospheric Vertical Velocity - a Crucial Component in Understanding Proximal Deposition of Volcanic Ash. Earth Planet. Sci. Lett. 566, 116980. doi:10.1016/j.epsl.2021.116980
Riley, C. M., Rose, W. I., and Bluth, G. J. S. (2003). Quantitative Shape Measurements of Distal Volcanic Ash. J. Geophys. Res. Solid Earth 108 (B10), 2504. doi:10.1029/2001jb000818
Rossi, E., Bagheri, G., Beckett, F., and Bonadonna, C. (2021). The Fate of Volcanic Ash: Premature or Delayed Sedimentation? Nat. Commun. 12, 1303. doi:10.1038/s41467-021-21568-8
Saxby, J., Beckett, F., Cashman, K., Rust, A., and Tennant, E. (2018). The Impact of Particle Shape on Fall Velocity: Implications for Volcanic Ash Dispersion Modelling. J. Volcanol. Geotherm. Res. 362, 32–48. doi:10.1016/j.jvolgeores.2018.08.006
Saxby, J., Rust, A., Cashman, K., and Beckett, F. (2020). The Importance of Grain Size and Shape in Controlling the Dispersion of the Vedde Cryptotephra. J. Quat. Sci. 35, 175–185. doi:10.1002/jqs.3152
Schindelin, J., Arganda-Carrera, I., Frise, E., Kaynig, V., Longair, M., Pietzsch, T., et al. (2012). Fiji: an Open-Source Platform for Biological-Image Analysis. Nat. Methods 9, 676–682. doi:10.1038/nmeth.2019
Schmith, J., Höskuldsson, Á., Holm, P. M., and Larsen, G. (2018). Large Explosive Basaltic Eruptions at Katla Volcano, Iceland: Fragmentation, Grain Size and Eruption Dynamics. J. Volcanol. Geotherm. Res. 354, 140–152. doi:10.1016/j.jvolgeores.2018.01.024
Scollo, S., Boselli, A., Coltelli, M., Leto, G., Pisano, G., Prestifilippo, M., et al. (2015). Volcanic Ash Concentration during the 12 August 2011 Etna Eruption. Geophys. Res. Lett. 42, 2634–2641. doi:10.1002/2015gl063027
Scollo, S., Coltelli, M., Bonadonna, C., and Del Carlo, P. (2013). Tephra hazard Assessment at Mt. Etna (Italy). Nat. Haz. Earth Syst. Sci. 13 (12), 3221–3233. doi:10.5194/nhess-13-3221-2013
Taddeucci, J., Edmonds, M., Houghton, B., James, M. R., and Vergniolle, S. (2015). “Hawaiian and Strombolian Eruptions,” in Encyclopedia of Volcanoes. Editors H. Sigurdsson, B. F. Houghton, S. R. McNutt, H. Rymer, and J. Stix (London: Academic Press), 485–503. doi:10.1016/b978-0-12-385938-9.00027-4
Taddeucci, J., Pompilio, M., and Scarlato, P. (2004a). Conduit Processes during the July-August 2001 Explosive Activity of Mt. Etna (Italy): Inferences from Glass Chemistry and crystal Size Distribution of Ash Particles. J. Volcanol. Geotherm. Res. 137, 33–54. doi:10.1016/j.jvolgeores.2004.05.011
Taddeucci, J., Pompilio, M., and Scarlato, P. (2002). Monitoring the Explosive Activity of the July–August 2001 Eruption of Mt. Etna (Italy) by Ash Characterization. Geophys. Res. Lett. 29, 71–1. doi:10.1029/2001gl014372
Taddeucci, J., Spieler, O., Kennedy, B., Pompilio, M., Dingwell, D. B., and Scarlato, P. (2004b). Experimental and Analytical Modeling of Basaltic Ash Explosions at Mount Etna, Italy, 2001. J. Geophys. Res. 109 (B08203), 9. doi:10.1029/2003jb002952
Thivet, S., Gurioli, L., Di Muro, A., Derrien, A., Ferrazzini, V., Gouhier, M., et al. (2020). Evidences of plug pressurization triggering secondary fragmentation during the September 2016 basaltic eruption at Piton de la Fournaise (La Réunion Island, France). Geoch. Geophys. Geosyst. 21. doi:10.1029/2019gc008611
Villermaux, E. (2012). The Formation of Filamentary Structures from Molten Silicates: Pele’s Hair, Angel Hair, and Blown Clinker. CR Mécanique 340, 555–564. doi:10.1016/j.crme.2012.06.003
Wilson, T. M., Stewart, C., Sword-Daniels, V., Leonard, G. S., Johnston, D. M., Cole, J. W., et al. (2012). Volcanic Ash Impacts on Critical Infrastructure. Phys. Chem. Earth 45, 5–23. doi:10.1016/j.pce.2011.06.006
Wohletz, K. H. (1983). Mechanisms of Hydrovolcanic Pyroclast Formation: Grain-Size, Scanning Electron Microscopy, and Experimental Studies. J. Volcanol. Geotherm. Res. 17 (1), 31–63. doi:10.1016/0377-0273(83)90061-6
Wong, L. J., and Larsen, J. F. (2010). The Middle Scoria Sequence: A Holocene Violent Strombolian, Subplinian and Phreatomagmatic Eruption of Okmok Volcano, Alaska. Bull. Volcanol. 72, 17. doi:10.1007/s00445-009-0301-y
Keywords: ash morphology, magma fragmentation, tephra dispersal, explosive volcanism, volcanic hazard
Citation: Edwards MJ, Eychenne J and Pioli L (2021) Formation and Dispersal of Ash at Open Conduit Basaltic Volcanoes: Lessons From Etna. Front. Earth Sci. 9:709657. doi: 10.3389/feart.2021.709657
Received: 14 May 2021; Accepted: 16 August 2021;
Published: 30 August 2021.
Edited by:
John Stix, McGill University, CanadaReviewed by:
Shane Rooyakkers, GNS Science, New ZealandAdrian Hornby, Cornell University, United States
Copyright © 2021 Edwards, Eychenne and Pioli. This is an open-access article distributed under the terms of the Creative Commons Attribution License (CC BY). The use, distribution or reproduction in other forums is permitted, provided the original author(s) and the copyright owner(s) are credited and that the original publication in this journal is cited, in accordance with accepted academic practice. No use, distribution or reproduction is permitted which does not comply with these terms.
*Correspondence: Laura Pioli, bGF1cmEucGlvbGlAdW5pY2EuaXQ=