 Frédérick Massin
 John Clinton
 Maren Böse
- Swiss Seismological Service, ETH Zürich, Zürich, Switzerland
The Swiss Seismological Service (SED) at ETH has been developing methods and open-source software for Earthquake Early Warning (EEW) for more than a decade and has been using SeisComP for earthquake monitoring since 2012. The SED has built a comprehensive set of SeisComP modules that can provide EEW solutions in a quick and transparent manner by any seismic service operating SeisComP. To date, implementations of the Virtual Seismologist (VS) and Finite-Fault Rupture Detector (FinDer) EEW algorithms are available. VS provides rapid EEW magnitudes building on existing SeisComP detection and location modules for point-source origins. FinDer matches growing patterns of observed high-frequency seismic acceleration amplitudes with modeled templates to identify rupture extent, and hence can infer on-going finite-fault rupture in real-time. Together these methods can provide EEW for all event dimensions from moderate to great, if a high quality, EEW-ready, seismic network is available. In this paper, we benchmark the performance of this SeisComP-based EEW system using recent seismicity in Switzerland. Both algorithms are observed to be similarly fast and can often produce first EEW alerts within 4–6 s of origin time. In real time performance, the median delay for the first VS alert is 8.7 s after origin time (56 earthquakes since 2014, from M2.7 to M4.6), and 7 s for FinDer (10 earthquakes since 2017, from M2.7 to M4.3). The median value for the travel time of the P waves from event origin to the fourth station accounts for 3.5 s of delay; with an additional 1.4 s for real-time data sample delays. We demonstrate that operating two independent algorithms provides redundancy and tolerance to failures of a single algorithm. This is documented with the case of a moderate M3.9 event that occured seconds after a quarry blast, where picks from both events produced a 4 s delay in the pick-based VS, while FinDer performed as expected. Operating on the Swiss Seismic Network, that is being continuously optimised for EEW, the SED-ETHZ SeisComP EEW system is achieving performance that is comparable to operational EEW systems around the world.
Introduction
Earthquake Early Warning (EEW) aims to detect seismic events and quantify their impact as soon as possible after they occur, ideally allowing seconds of warning time in advance of the arrival of strong ground motion in affected areas. If appropriate protective actions are promptly taken, the impact of an earthquake can be reduced. EEW systems are used to deliver public warnings in Japan (Doi, 2011), Mexico (Cuéllar et al., 2014), South Korea (Sheen et al., 2017), Taiwan (Hsiao et al., 2009), and along the west coast of the United States of America (Given et al., 2018). EEW systems and underlying algorithms are tested worldwide (e.g., Allen and Melgar, 2019), including Europe (Clinton et al., 2016) and Switzerland (Behr et al., 2015).
In Switzerland EEW has been in a demonstration phase for more than a decade. Over this period, the operational EEW algorithms have evolved, the background software has changed, and the network has been both densified and upgraded with a focus on low latency data flow. Together, these changes have significantly improved the existing EEW system in terms of speed and reliability. Speed has been chiefly addressed by network changes. Reliability has been improved by incorporating a second EEW algorithm that is independent of phase picking.
There are both scientific and technical challenges that need to be addressed when building an EEW system. Using the same single software framework that integrates EEW algorithms as well as other basic seismic monitoring services saves time and resources that would be required to develop and maintain independent systems, and improves the reliability of both EEW and standard network processes. In 2012, the Swiss Seismological Service (SED) at ETH Zurich migrated to the SeisComP framework (Hanka et al., 2010) for seismic data acquisition and management, and automatic and manual earthquake monitoring (Diehl et al., 2013). In the ensuing years, two complimentary EEW algorithms were added to SeisComP, first the Virtual Seismologist (VS, Cua, 2005; Cua and Heaton, 2007) was included in 2013 (Behr et al., 2016), followed by the Finite-Fault Rupture Detector (FinDer) algorithm (Böse et al., 2012; Böse et al., 2015; Böse et al., 2018a) in 2017. The development and testing of both algorithms, using datasets that include large events, are summarised in the Method section. Currently, these two algorithms are integrated in SeisComP via four modules developed by the SED and Gempa GmbH. We name our technical framework implemented in SeisComP the ETHZ-SED SeisComP EEW system (ESE). ESE is currently limited to the production of source parameters, and further work is required to translate these into alerting parameters.
In this paper, we summarise the EEW architecture in place in Switzerland and report on the performance of ESE during the 2020 earthquake sequence that included the MLhc4.3 Elm mainshock. We also review the real-time performance over the last decade, and demonstrate how the current ESE configuration would perform in real-time simulations (playbacks) of the major earthquakes recorded in Switzerland since 2009. Our study documents steadily decreasing EEW delays since 2009, with relatively small location and magnitude errors, as well as consistent performance during the vigorous Elm sequence. We show how an EEW system that includes multiple independent algorithms can perform in a robust manner, even during complicated seismicity patterns.
The ETHZ-SED SeisComP EEW System
ESE consists of two EEW algorithms embedded in SeisComP: 1) The Virtual Seismologist (VS) which provides fast network-based magnitude estimates for moderate-sized point-source earthquakes using conventional triggering and phases association techniques; and 2) the Finite-Fault Rupture Detector (FinDer), which matches the evolving patterns of high-frequency seismic ground motions to track ongoing rupture extent without requiring phase picks.
Virtual Seismologist
The Virtual Seismologist was developed as a Bayesian approach for estimating the earthquake magnitude, location, and peak ground motion distribution using P-wave arrival detection and ground motion amplitudes, predefined prior information (e.g., network topology, station health status, regional hazard maps, earthquake forecasts, Gutenberg-Richter magnitude-frequency relationship), and envelope attenuation relationships (Cua, 2005; Cua and Heaton, 2007; Cua et al., 2009). In operational systems, so far only the magnitude component has been used, with origins (nucleation time, hypocenter, and related quality metrics) derived from independent location algorithms. The first real-time VS prototype system was developed at SED-ETH Zurich in 2006–2012 using the location from Earthworm origins (Johnson et al., 1995) for input to the VS magnitude estimation. The current approach in SeisComP adopts this same strategy–a SeisComP VS magnitude module, scvsmag, provides rapid magnitude estimates based on independently determined rapid point-source pick-based origins, from SeisComP modules, such as scautoloc (Behr et al., 2015) or scanloc (Gempa GmbH, 2016; Grigoli et al., 2018). Hence, VS can be easily tested using existing SeisComP setups.
The Earthworm implementation of VS was one of the three EEW algorithms included in the original CISN ShakeAlert EEW system (Behr et al., 2015), and it was continuously real-time tested in California (from 2008 to 2016) and Switzerland (2010–2016). VS was integrated into SeisComP by SED-ETH Zurich and gempa GmbH in 2012–2013, with funding from the EU projects NERA (Network of European Research Infrastructures for Earthquake Risk Assessment and Mitigation) and REAKT (Strategies and Tools for Real-Time EArthquake RisK ReducTion). Both (Earthworm and SeisComP-based) VS implementations are based on a point-source hypothesis and focus on the processing of available pick and envelope data, without including prior information.
The VS magnitude estimation relationships consist of 1) a relationship between observed ground motion ratios (between vertical acceleration and vertical displacement) and magnitude, and 2) envelope attenuation relationships describing how various channels of envelope amplitudes vary as a function of magnitude and distance. These relationships were derived from a Southern California dataset with events in the 2.5 to 7.6 magnitude range and the Next Generation Attenuation (NGA) strong motion dataset (Cua, 2005). These relationships, as well as VS performance during large magnitude earthquakes, have been shown to work reasonably well in Northern California and Switzerland with a standard magnitude error of ±0.5 magnitude units (Behr et al., 2012; Behr et al., 2016). The VS magnitude evaluation procedure is used as defined in Cua (2005) and Cua and Heaton (2007), without taking into account station-specific amplification corrections. The only change in the SeisComP implementation (since Behr et al., 2016) is the reduction in the length of the earliest ground motion envelope window from 3 to 1 s. Although SeisComP can produce origins for earthquakes at any depth, the VS magnitude estimation relationships are calibrated with earthquakes of an average depth of 3 km. For this reason, it is expected that VS magnitudes may systematically underestimate magnitudes for deep earthquakes.
Since EEW alerts from VS use traditional locators for early origins, all sensor types can be used in the location process–even from high gain broadband or short period sensors that subsequently clip. The VS magnitude module only uses on-scale data, and will use high-gain data as long as it does not saturate (saturation is identified as having been reached by a configurable ratio or 223 counts, sufficient in Switzerland as all data is recorded from high dynamic range sensors on 24 bit digitisers).
Finite Fault Rupture Detector
While VS is a classical point-source algorithm, the second algorithm integrated into ESE, the Finite-Fault Rupture Detector (FinDer), determines line-source models, which are characterized by a length, strike and centroid position that describe the fault rupture (Böse et al., 2012; Böse et al., 2015; Böse et al., 2018a). These models can be determined for all earthquakes with M > 2.5, but they are most important in large events (M > 6) when the point-source approximation becomes invalid. This is because EEW usually predicts seismic ground-motions outside of the epicentral area and these motions are strongly controlled by the rupture-to-site distance rather than hypocentral distance that a point-source algorithm could provide.
In contrast to VS and many other point-source EEW algorithms, FinDer does not rely on phase picks, but interprets the spatially distributed peak ground motions. FinDer is a template matching approach which compares temporally and spatially evolving high-frequency seismic ground-motions to theoretical template maps. These templates are pre-calculated for different magnitudes and line-source models from empirical ground-motion models using a grid of 5 km × 5 km resolution. This means that all FinDer determined source locations (which are centroids rather than hypocenters) basically have an uncertainty of 2.5 km. The FinDer magnitude, Mfd, is estimated empirically from the length of the FinDer line-source.
FinDer has undergone extensive real-time and offline tests in California (Böse et al., 2018a), Central America (Porras et al., 2021, subm.), Chile (Carrasco and Böse, 2017), Italy (Böse et al., 2018b), Japan (Meier et al., 2020), and China (Li et al., 2020; Li et al., 2021 subm.) for small to large earthquakes using seismic data, and for large global earthquakes using felt-reports (Böse et al., 2021b). FinDer is one of two seismic algorithms adopted by the US West Coast ShakeAlert warning system (Given et al., 2018). The FinDer core code has been jointly developed by Caltech, USGS and SED-ETHZ.
For the Swiss installation, we use two FinDer template sets that account for different attenuation characteristics of PGA amplitudes in the Swiss foreland and alpine regions (Cauzzi et al., 2014). To trigger, FinDer requires PGA >2.0 cm/s/s at three neighboring stations. FinDer uses a cascade of increasing PGA thresholds in its binary template matching (2.0/4.6/10.5/23.2/48.6/90.7/148.8 cm/s2). See Böse et al. (2018a) for details. The goal of this setting is to detect earthquakes with magnitude over 3.5, but as demonstrated in this manuscript, FinDer may detect events as small as M2.7, if they show abnormally strong high-frequency radiation and station geometry is favourable. The FinDer template sets and thresholds are the only configuration adjustments for operating FinDer in Switzerland. FinDer uses data from both strong motion and high gain broadband sensors (but, unlike VS, not from short period sensors), with high gain sensors initially preferred when sensors are co-located. Once the ground motion is observed to exceed the dynamic range of a high gain sensor, if there is no co-located strong motion sensor, the corresponding station is removed from processing.
Integration in SeisComP3
The SeisComP software (Hanka et al., 2010) is an open-source real-time platform for seismic monitoring widely adopted by the seismological community. It was originally developed for tsunami early warning. All of its components (acquisition and processing) are implemented in a real-time manner, involving delays only where methodologically required (e.g., STA/LTA is delayed by the duration of STA; Allen, 1982; or VS station magnitudes require 1s duration post-pick; Behr et al., 2015). The same software can be used for acquisition, data management, automatic and manual processing, from separate clients, while connected and informed from a central network management instance, thus allowing minimal maintenance. SeisComP includes all the components required for the implementation of new approaches: an extensive data model, an efficient messaging system, multiple input and output interfaces, an API for C++ and python.
Figure 1 summarises the overall architecture of how EEW, and in particular the VS and FinDer algorithms, are embedded with SeisComP. A generic pre-processing module, sceewenv, (that can alternatively be used directly as a library within the individual EEW modules) listens to incoming seismic data and provides real-time EEW parameters to the client EEW algorithms. For the VS module, scvsmag, these are 1 s ground motion displacement and acceleration envelopes. For the FinDer module, scfinder, these are 1 s ground motion acceleration envelopes. This module can also produce other EEW parameters that could be used in different EEW algorithms that may be added to SeisComP in future, such as ground motion displacement from high rate GNSS displacement time series for use in EEW methods based on real-time GNSS data, such as FinDerS or FinDerS+ (Böse et al., 2021a). The EEW modules provide locations and magnitudes, with uncertainties and other algorithm-specific output, to sceewlog, which collates solutions from the different algorithms, and disseminates low-latency messages to be used by end-user client applications, such as the open source client software EEW Display (Cauzzi et al., 2016) as well as providing summary reports to EEW operators e.g., via email. The method-agnostic processing and logging modules sceewenv and sceewlog have been released in 2021, replacing the original VS-specific scenvelope and scvsmaglog modules, as described in Behr et al. (2016), in order to support the integration of FinDer.
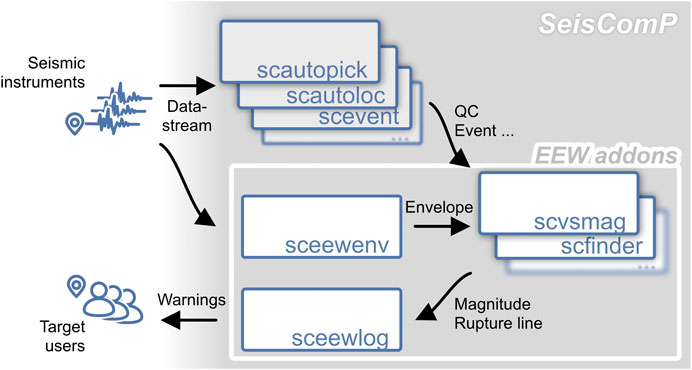
FIGURE 1. Schematic workflow of the SED-ETHZ SeisComP EEW system (ESE). The main SeisComP framework includes automatic picking and location modules (scautopick and scautoloc) which can be tuned for event detection with P-wave arrival detection at four stations. The VS algorithm is implemented in the scvsmag module. FinDer is a stand-alone library that is integrated in the scfinder wrapper module. SeisComP event detections are fed into VS together with acceleration and displacement envelope amplitudes (provided by the sceewenv module), while FinDer only relies on envelopes for detecting intermediate events with co-seismic ground motion detection at three stations. Both can provide EEW to target users via the sceewlog module using multiple real-time dissemination interfaces. It allows the EEWD open-source client software to display end-user EEW information (Cauzzi et al., 2016).
VS relies on the SeisComP picking and location modules. SeisComP can be tuned in order to allow event detection with four stations only. This can be done via the primary SeisComP location module (scautoloc) with conservative adjustments preventing origins to be located in regions without picks at closest stations, or using the scanloc location module (Grigoli et al., 2018; Scanloc Documentation, 2021). The VS module listens for these origins and creates fast magnitudes using the acceleration and displacement envelope amplitudes continuously made available by the sceewenv module. A first magnitude is available once 1 s of envelope data at a single station becomes available. VS magnitudes are updated every second for up to a maximum of 30 s. The original VS station magnitude relationships are generated using the entire waveforms of the training dataset, including surface waves. New stations that are included from picked stations when updated origins become preferred (new origins become available at least every 10 s, as long as new picks continue to be associated). Since mid-2017 in the online (real-time) system, scautoloc has been configured to provide first origins using four instead of six stations; since late 2018 a second location algorithm, scanloc, was added that is also capable of providing first origins from four station picks. We also use an automatic secondary picking that is triggered by the initial STA/LTA picks, using the method of Baer and Kradolfer (1987) that provides more precise picks, although with added latency.
FinDer has been implemented as a library (since FinDer version 2; Böse et al., 2018a) which is integrated within a SeisComP wrapper module (scfinder). This module also integrates the same envelope library as used in sceewenv. FinDer only uses envelopes from broadband high-gain seismographs and accelerographs, using the same logic as VS in case of velocimeter clipping. The scfinder module provides an amplitude-based, independent evaluation of the centroid location, length, azimuth, and magnitude of a finite-fault rupture assuming a line-source. We have started using FinDer in for online (real-time) testing in Switzerland in mid-2017.
In addition to being operated in real-time online, the ESE system can be operated in playback mode, replaying events as though they were occurring “in real-time.” The playback ESE system presented in this paper has the same configuration as the current real-time system. This allows us to demonstrate the capabilities of the current ESE configuration for past earthquakes. In this paper, we use the playback system with the 100 largest earthquakes with magnitudes over 2.7 within Switzerland since 2009. We describe the outcome for the eight largest earthquakes with magnitudes from 3.9 to 4.6 in the result section, and present complete results for all 100 events in the Supplementary Material.
Seismic Monitoring and Seismicity in Switzerland
Swiss Seismic Network
The current Swiss Seismic Network consists of over 200 permanent stations (CH network code; Swiss Seismological Service (SED) at ETH Zurich, 1983). The goal of this network is to monitor seismicity of the territory, support science and assess the seismic risk. In recent years, efforts have been made towards making this network ready for EEW. The majority of the stations (currently 171) include modern broadband EpiSensor strong motion accelerometers. All stations operate modern ultra-low latency digitisers–mainly Nanometrics Centaur, though there are significant numbers of Nanometrics Taurus and Kinemetrics Q330. A major densification of the strong motion network has occurred in the framework of the SSMNet renewal project that started in 2009, and is nearing completion, with the addition of 100 new strong motion stations. In the last 7 years, the first generation broadband seismic network and many legacy short period stations, installed around the turn of the century, have been upgraded, with all existing sites being refurbished with replacement of digitisers and addition of strong motion sensors. Additionally, about 10 new stations with both broadband and strong motion sensors have been installed. The growth in stations and sensor types in the CH network, since 2000, is shown in Figure 2.
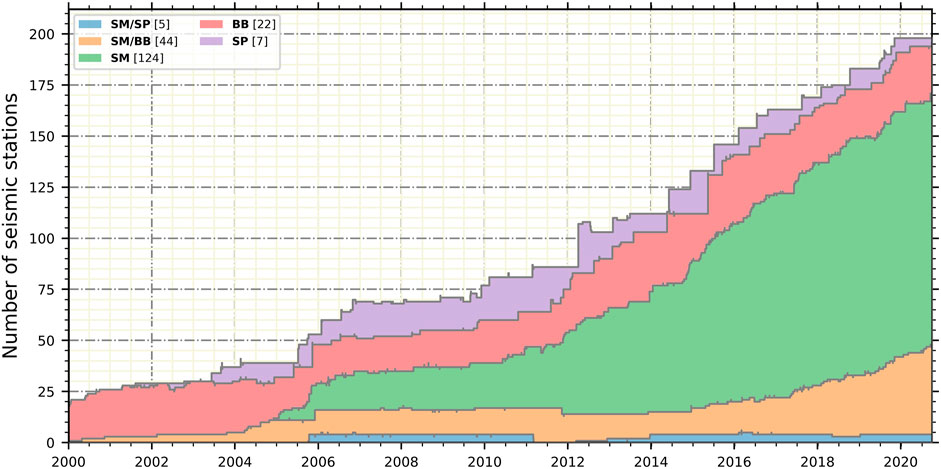
FIGURE 2. Evolution of seismic instrumentation in the Swiss National Network (network code CH) since 2000. Only modern high quality, real-time instruments are shown (neglecting analog low gain short period and strong motion instruments). SM: strong motion accelerograph. BB: broadband seismograph. SP: short period seismograph. The numbers of stations deployed today in each category are indicated in the legend.
This modern network is augmented by a 1) varying number of temporary stations targeting scientific and engineering risk studies, monitoring aftershock sequences, and industrial activity, in particular geothermal projects–the majority of these also stream in real time with low latency similar to the national network, currently this numbers ∼70 stations; as well as 2) about 50 stations from neighbouring agencies that are important to ensure high quality earthquake analysis–these stations have varying latency.
The Swiss Seismic Network uses the Seedlink protocol for all real time communications. Although this is not optimum for EEW since it has a fixed 512-byte packet size, the high sampling rates adopted at all Swiss stations (200 sps for stations that include high gain sensors; 250 sps for strong motion only stations) means the packet reception interval ranges between 1 and 2 s (Supplementary Figure SA1a). The data packet reception delay is under 0.5 s on average (Supplementary Figure SA1a). Together, this means the data sample delay–estimated as (transmission delay added to half of the packet reception interval) averages at 1.46 s with a standard deviation of +1.17 s/−0.30 s. Figure 3A presents the data sample delays for each of the 272 low-latency stations operated by the SED in April 2020.
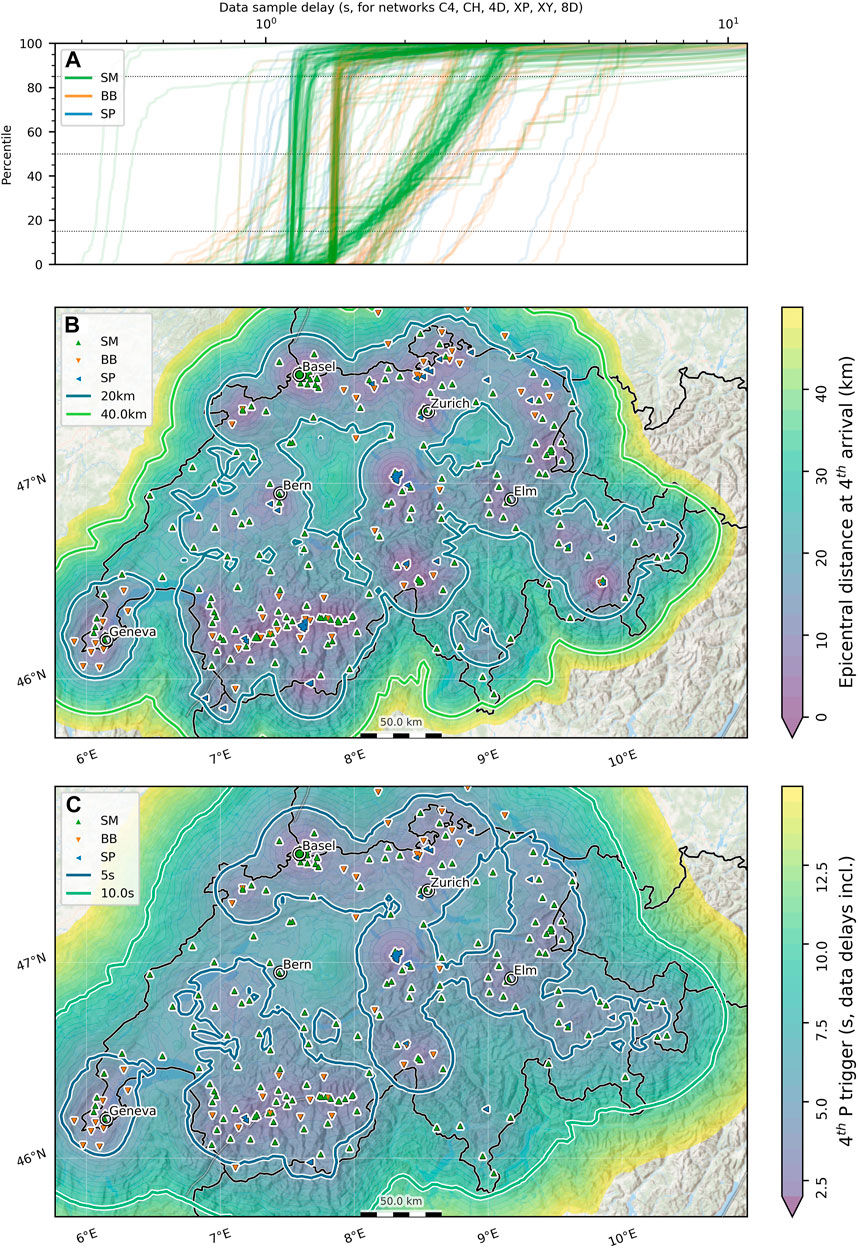
FIGURE 3. Summary of Swiss seismic network performance for EEW. (A) shows data sample delay percentiles for each seismic sensor operated by SED. The majority of stations have very fast, reliable delays of either 1.1 or 1.3 s, depending on sampling rate. Stations operating older dataloggers exhibit larger delays with higher range. Data sample delays are defined as the sum of the packet reception delay from end-time to reception, and half of the inter-packet reception interval. (B) Station map with channel type distribution and map of the distance to the fourth closest station. (C) Station map with channel type distribution and P-wave delays for triggering four stations (for iasp91 velocity model, hypocenters at 5 km depth, and seismic data sample delays in (A). The corresponding image considering only the closest station is provided in the Supplementary Figure SA2. The map shows all permanent and temporary stations operated by the SED across the Switzerland region in April 2021. Stations operated by foreign networks are not included. SM: strong motion accelerograph. BB: broadband seismograph. SP: short period seismograph. Indicated are the major cities, as well as the village of Elm close to the sequence discussed in this paper.
Figures 3B,C present a map of the current network, showing the real-time stations monitored and operated by the SED, omitting stations operated by foreign agencies. All stations indicated in green include a strong motion sensor–either stand-alone or together with another high gain sensor. If there is no strong motion sensor, the colour indicates whether the available sensor is broadband or short period. In Figure 3B, the background colour indicates the distance to the fourth closest seismic station at any given point–this shows the network density, tailored for the VS algorithm, which requires four station picks to trigger a first location. The majority of the country lies within 20 km of the fourth station, and in many places where seismicity is high, as seen in Figure 4, for example in the Basel region or in the Canton of Valais in the SW, this distance is reduced to under 10 km. In Figures 3A,C map of theoretical EEW delay is shown, assuming shallow 5 km earthquake sources. For this figure, the travel times computed with the iasp91 velocity model from all sources to each station are combined with the observed latencies for the individual station (Figure 3A). Event processing and magnitude determination add very small additional delays (Behr et al., 2015), though any additional latency arising from sending alerts to the public is not included. A significant part of the country is expected to provide the first alert within 5 s of origin time, and the entire country lies within 10 s.
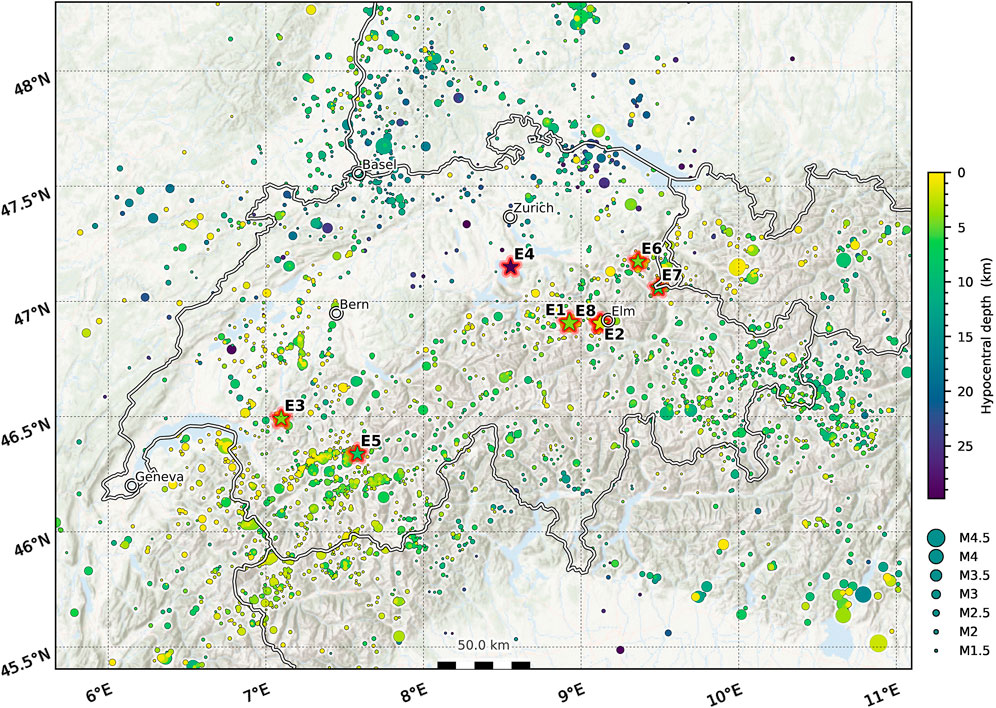
FIGURE 4. Seismicity from the SED-ETHZ earthquake catalogue within and around Switzerland between January 2009 to April 2021. Circles: all earthquakes with magnitude over 1. The significant events listed in Table 1 are indicated with stars: E1: MLh4.6 Linthal 2017; E2: MLh4.3 Elm 2020; E3: MLh4.3 Chateau-d’Oex 2017; E4: ML4.2 Zug 2012; E5: MLh4.1 Leukerbad 2016; E6: ML4.1 Buchs 2009; E7: MLh4.1 Sargans 2013; E8: MLhc3.9 Elm 2020.
Seismic Activity in Switzerland
Switzerland is a country with moderate seismic hazard. On average, between 1,000 and 1,400 earthquakes are identified every year, of which 24 are equal to or above M2.5 (Diehl et al., 2021) and about 25 are felt by the population. There is a roughly 1% probability for a damaging earthquake with magnitude M6+ to occur in or near Switzerland each year (Wiemer et al., 2016).
The seismicity between 2009 to today (which covers the testing period of EEW in Switzerland) is presented in Figure 4. Highlighted in this map are all earthquakes with a local magnitude over 3.9 in Switzerland within the time window, that are also listed in Table 1. The largest earthquake occurred in 2017 in Central Switzerland, near the village of Urnerboden, with MLh4.6. A particular focus of this paper relates to events associated with the joint second largest earthquake to occur in the time window, the MLh4.3 earthquake near Elm that occurred in 2020.
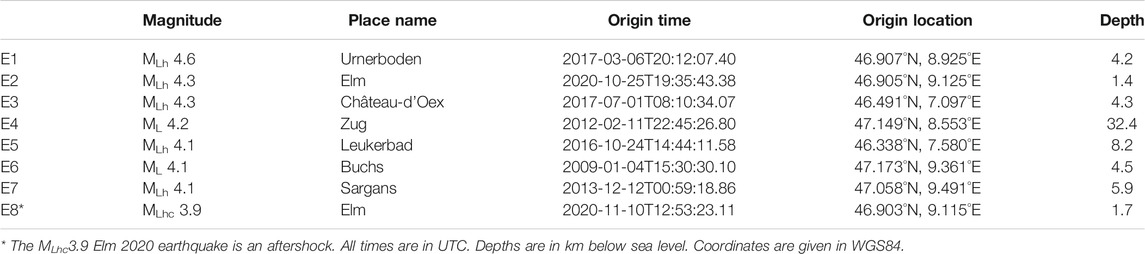
TABLE 1. Source parameters of the eight earthquakes to occur within Switzerland with magnitude 3.9 ≤ ML ≤ 4.6 since 2009.
All catalogue events described in this paper are provided with their local magnitude. The local magnitude scale has evolved over time at the SED in an effort to use all available data from the also evolving seismic network, although efforts have been made to remain calibrated to the original implementation of Kradolfer and Mayer-Rosa (1988), which was based on a very limited amount of observations from a sparse network, with few near-field records and all stations located on hard rock sites. All local magnitudes prior to October 2012 are labelled ML, even though the original implementation was modified in 2000 to be computed using horizontal components, now possible due to the newly installed three component seismometers. In 2012, as part of a migration to SeisComP, all local magnitudes were labelled as MLh, although the attenuation relation was not changed. In November 2020, the SED migrated to MLhc as the preferred magnitude scale. This scale is extended to take into account site amplification factors (allowing usage of the increasing number of stations deployed in soft sediments, in particular the new strong motion sites located in urban areas) as well as a new calibration for stations at close epicentral distances (Racine et al., 2020). For EEW magnitudes, we adopt the convention MVS (VS) and Mfd (FinDer). The FinDer magnitude is sensitive to high-frequency motions and thus related to the energy magnitude (Böse et al., 2018a; Li et al., 2020).
Real-Time EEW Performance During the 2020 Elm Sequence
The MLh 4.3 Elm earthquake on October 25, 2020 and its aftershock sequence occurred in the upper Sernftal in the Glarus Alps, a region with a moderate station density. Fortunately the network in this region had very recently been densified–a few months earlier, a foreshock on 26 May MLh 3.1, triggered the exercise of the ETHZ-SED aftershock pool, presently consisting of six streaming, autonomous stations with short period and strong motion sensors. Two stations (8D.ELM0 and 8D.ELM1) were installed within a few kilometers of the sequence. Hence, by the time of the mainshock, the region was well monitored with low latency strong motion instruments, with four stations within 10 km (Figure 3). Winter was drawing in, and the aftershock stations in the Sernftal, a deep alpine valley that receives little sunlight and can expect heavy snowfall, were at risk of losing power. Hence, a third aftershock station (8D.ELM3), on mains power, was immediately deployed even closer to the on-going cluster. The sequence was vigorous, with on the order of 300 events detected in the 2 months following the mainshock, extending over a roughly EW trend, with events being particularly shallow between 0 and 3 km. On November 10, 2020, the largest aftershock (MLhc 3.9) of the series so far occured.
Both the mainshock and the largest aftershock triggered both EEW algorithms. Strong motions observed by the aftershock stations for both events are remarkable. Despite the moderate event size, a peak ground acceleration (PGA) of 405 cm/s2 and peak ground velocity (PGV) of 6.1 cm/s was observed at 8D.ELM0 (at 2.4 km epicentral distance) during the mainshock–this is the strongest ground motion in terms of both PGA and PGV ever recorded at a free-field station in Switzerland. In the aftershock, extreme motions were also observed at the closest station (PGA 103 cm/s2 and PGV 1.3 cm/s at 8D.ELM3 at 1.6 km epicentral distance). The main MLhc3.9 aftershock was preceded by a small MLhc 1.0 quarry blast that occurred near Brugg, Canton Valais (Figure 5), 21 s before and at a distance 130 km, that had important effects on the ESE system.
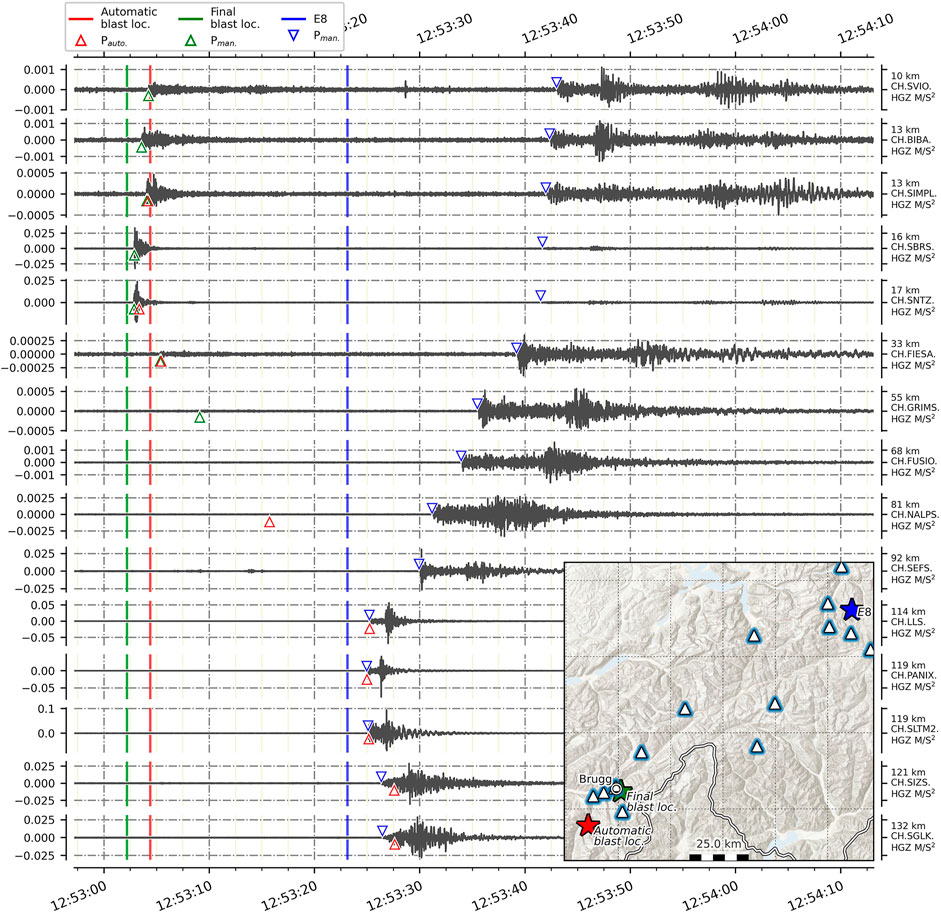
FIGURE 5. Seismograms recorded during the MLhc3.9 Elm aftershock. The map inset shows the seismic stations (triangles) as well as the locations of the aftershock (E8, blue); the MLhc1.0 quarry blast that preceded the event (green), and the automatic blast location that included Elm aftershock phases (red). The seismograms are ordered and labelled by distance to the quarry blast. Vertical lines and stars mark origin times in the seismograms and event locations on the map, respectively. P-wave arrivals are marked by triangles on the seismograms. The final origins of the blast and E8 are associated with manually picked arrival times. The automatic blast location is based on automatic P-wave picks, and erroneously incorporates stations close to E8.
Figure 6 summarises the network density, out to 35 km, and observed ground motions for the mainshock (top) and the aftershock (bottom). For each station, the temporal evolution of PGA is shown until the time when final PGA is reached. Expected P- and S-wave arrival times are also indicated. For the mainshock, there are four stations within 10 km, and the sixth closest station is at 16 km distance. The P-wave arrived at the fourth and sixth station after 2.5 and 3.5 s, respectively. For the aftershock, now also recorded at 8D.ELM0, the time to the fourth station is only marginally reduced, while the time to the sixth station is reduced by 1.5 s. As expected, in both events, the PGA at all stations is reached during, or shortly after, the S-wave arrival.
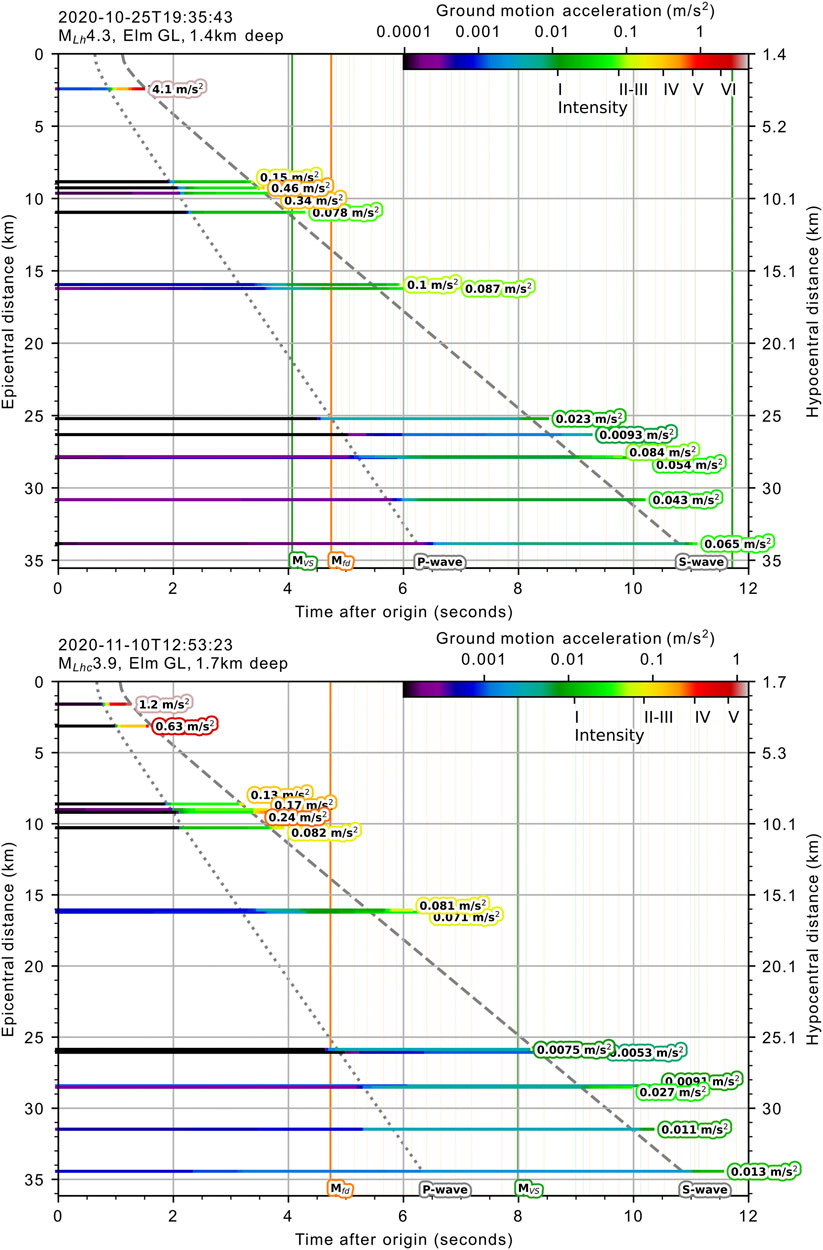
FIGURE 6. Available seismic data for the MLh 4.3 Elm earthquake (top) and MLhc 3.9 aftershock (bottom) as a function of time and distance from origin. Each line shows the temporal evolution of horizontal peak ground acceleration (PGA) at a given station until its peak value is reached (labels left-sided on PGA time, with highest PGA plotted on top). Intensity equivalents are derived from Faenza and Michelini (2010). Vertical lines indicate the first magnitude estimates from VS (MVS) and FinDer (Mfd). Dotted and dashed curves show the theoretical P- and S-wave arrivals computed with the iasp91 velocity model.
During the mainshock, at the closest station 8D.ELM0, the PGA of 405 cm/s2 (equivalent to intensity VI, Faenza and Michelini, 2010), is reached shortly after the S-wave arrival, only 1.5 s after origin time and before the P-wave arrives at the fourth station. The first EEW alert from VS was produced 4.1 s after the origin time, roughly at the same time when the PGA (46 cm/s2, intensity IV) was reached at the fourth station. The first FinDer solution was available 0.8 s later.
The MLhc3.9 aftershock was detected by FinDer with a similar delay as the mainshock (4.7 s after origin time), while the first VS alert was issued 8 s after origin time, almost 4 s later than observed in the mainshock. This delay was produced by erroneous mixing of picks from the closest stations to this event and those from the small quarry blast. As shown in Figure 5, the theoretical P-wave arrivals from this event almost coincide with the nucleation time at Elm, thus triggering association of the arrival times at stations close-by Elm to an incorrect origin location for the blast. In the next section we describe how we resolved this issue afterwards.
In order to model ground motions, the Swiss Seismic Network adopts Swiss-specific GMPE based on stochastic simulations (Cauzzi et al., 2015) and GMICE (Faenza and Michelini, 2010) that provide earthquake intensity in the EMS-98 scale, as adopted in SED shakemaps (Cauzzi et al., 2015) that are available for each event on the SED website (http://seismo.ethz.ch, last accessed August 2021). In this study the accurate prediction of ground motion is not a primary goal, rather we wish to compare the predicted peak motions and corresponding felt intensities for the evolving EEW solutions alongside the final catalogue parameters. Hence, for simplicity, we use the empirical intensity prediction equation from Allen et al. (2012) that provides intensity in Modified Mercalli Intensity, and use a simple iasp91 velocity model to estimate the distance of S-wave fronts at a given time. The maps in Figure 7 show the estimated earthquake locations, predicted MMI intensity and available warning (or lead) times between the first alert (assuming alerts are available as soon as the first EEW solution is available, and there is no delay due to downstream alert dissemination to users) and the arrival of the peak ground motion (assumed to coincide with the S-wave arrival) for the two events. The 5 km resolution adopted by FinDer (see FinDer section) appears coarse compared to the expected rupture dimension of such a small earthquake, but is acceptable considering location uncertainties. While the main strength of FinDer is in the finite-source characterization of large earthquakes (M > 5.5), the algorithm can often provide reasonable estimates of fault rupture strike in smaller events if their spatial PGA distributions show effects of rupture directivity (Böse et al., 2018a). This, however, is not the case in the Elm events and the FinDer estimated strike does not match the strike predicted by the focal mechanism (Figure 7) and aftershock distribution.
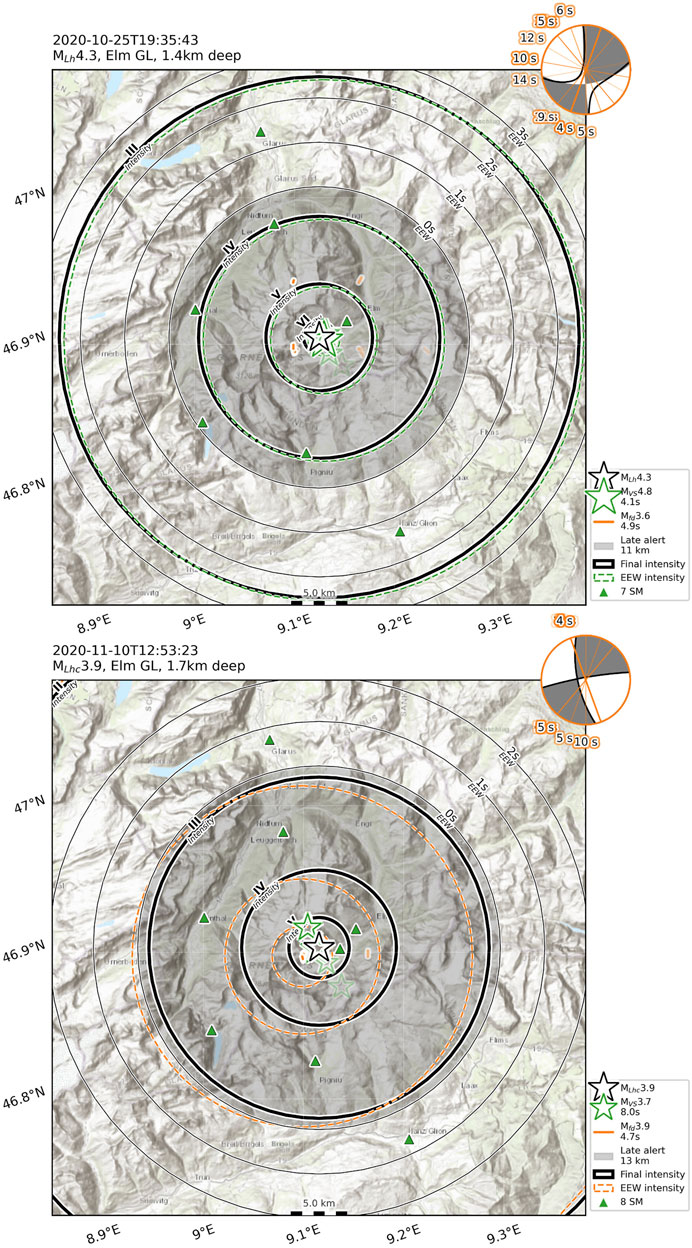
FIGURE 7. Geographical comparison of VS (green), FinDer (orange) and catalogue (black) earthquake parameters estimates for the MLh 4.3 Elm earthquake (top) and MLhc 3.9 aftershock (bottom). Origin locations are represented with stars or lines for rupture models from FinDer, the brightest symbols representing the earliest estimates (see first delay in legend). Intensity iso-lines from the catalogue origin (solid black) can be compared to the earliest EEW estimates (dashed lines), following a generic intensity prediction equation (Allen et al., 2012). The late alert area (grey circle) and available warning (lead) time from the EEW (thin black lines, modeled as the time difference between the S-wave arrivals, as predicted from the iasp91 velocity model, and the first EEW solution) are indicated. The polar plot in the upper right corner shows the evolution of the FinDer fault-line model azimuths (orange, labelled with delay after origin), and the catalogue focal mechanism (grey).
The late alert zone (where the S-wave arrives before the alert) extends to 11 and 13 km from the mainshock and aftershock, respectively. For the MLh 4.3 Elm earthquake an EEW message provided without additional latency could have preceded the felt ground shaking within 11–15 km around the epicenter, where intensity exceeded III.
Figure 8 illustrates the temporal evolution of VS and FinDer results during the MLh4.3 Elm mainshock (top, A–D), and the MLhc 3.9 aftershock (bottom, E–H). In general, the performance of the two algorithms is similar during both events, though the VS solution for the aftershock was delayed due to the earlier described picking problem.
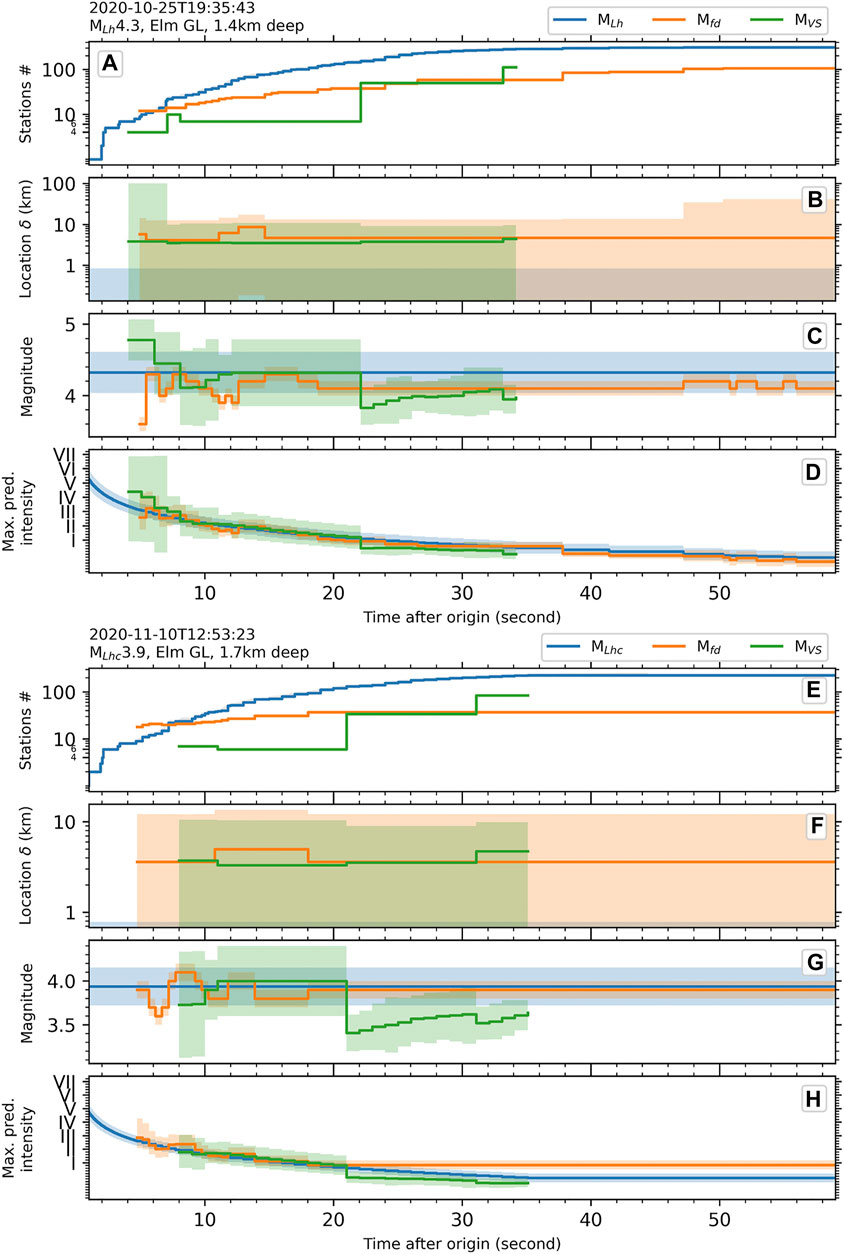
FIGURE 8. Temporal evolution of VS (green) and FinDer (orange) earthquake parameter estimates for the MLh 4.3 Elm earthquake (top) and MLhc 3.9 aftershock (bottom). Parameters from catalogue solution are indicated in blue. (A,E): number of stations contributing to locations for each algorithm; blue line shows the cumulative number of stations where P-wave has reached. (B,F): EEW centroid hypocentral location errors (lines, uncertainty indicated by shaded area). (C,G): Magnitudes (lines, uncertainty indicated by shaded area). (D,H): Maximum predicted intensity (see Supplemental Material, section Maximum predicted intensity) at the reference S-wave front edge considering final centroid location, using the reference final source parameters (blue line) and EEW parameters (green and orange lines) and related uncertainties (shaded areas).
VS origins are derived from automatic picks, with a minimum of four and increasing in number as energy appears at later stations received at the processing hub. In contrast, in order to constrain the location, FinDer uses all stations streaming, including those that did not yet record the event. The FinDer station counts in Figures 8A,E show stations with PGA over 2 cm/s2, so these numbers are not directly comparable to the pick counts for VS. Nevertheless, it is apparent that FinDer integrates new stations at a faster rate than VS, since in the current configuration, VS origins are only updated every 10 s and not on significant change in station number.
VS and FinDer origins/centroid locations are similar and relatively stable over time (Figures 8B,F). The magnitude estimates provided by the two algorithms show more significant fluctuation over time (Figures 8C,G). For VS, the magnitude is updated every 1 s, and at least 1 s of data after the P-wave pick is required at each station. Since initial magnitudes use very short waveform durations from a few stations, initially fluctuations can be expected. There also is a significant difference in the magnitude evolutions of FinDer and VS as they integrate new stations. FinDer magnitudes, which are updated irregularly in response to the changing ground-motion field, tend to stabilize over time, while VS magnitudes can jump as updated origins include additional stations for magnitude determination.
Figures 8D,H show the maximum intensity at any point on the evolving S-wave front edge (see Supplementary Material for explanation). The uncertainties in location and magnitude are taken into account in the uncertainty in the intensity prediction. For both the mainshock and aftershock, the maximum predicted intensity evaluated for VS and FinDer do not deviate from the reference prediction by more than their uncertainties, demonstrating the stability of both algorithms in this example.
The ESE system operated throughout the Elm sequence, with VS providing results for all earthquakes with magnitude over 1.2 and FinDer only providing results for five earthquakes with magnitudes above 2.0. Since FinDer requires a threshold in amplitude to be exceeded at three or more sensors across the network, it only produces solutions for the largest events in this sequence. VS builds on traditional STA/LTA picks, so it is sensitive to much smaller events.
Figure 9 shows the delays of the first MVS and Mfd for the entire Elm sequence following the mainshock for magnitudes above ML2. Also indicated is the delay to the fourth observed P-wave arrival time after origin time (neglecting data delay), providing an estimate of the best possible EEW delay considering the actual network geometry. Apparent is the effect of the installation of the last aftershock station in the days after the 25 October mainshock. In general, we observe delays of 1.5–2 s for travel times, and first EEW estimates, the majority from VS, became available within 4–6 s.
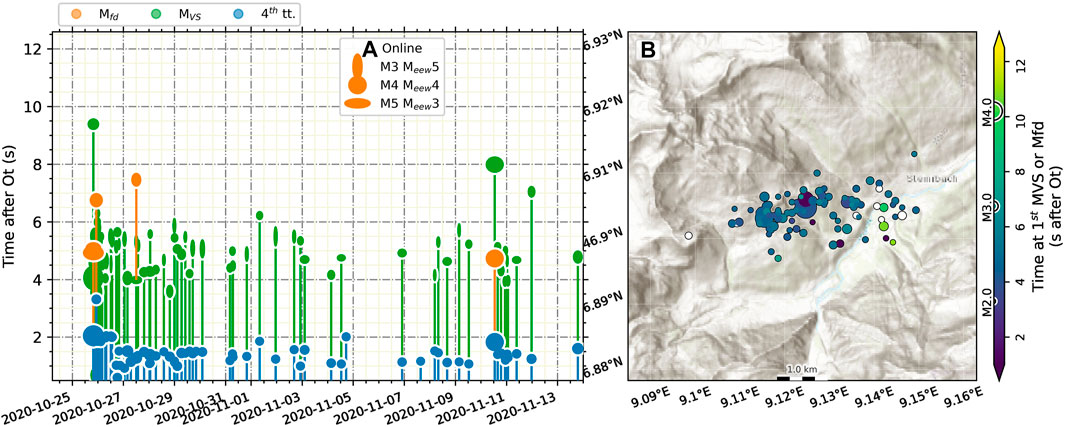
FIGURE 9. Temporal (A) and geographical (B) overview of the VS (green, 83 earthquakes), and FinDer (orange, five earthquakes) performances for the first 3 weeks of the Elm earthquake sequence, showing events with magnitude over 1.2. (A) Delays for each event: the first VS and first FinDer origin times are indicted by the green and orange ellipses, respectively. For comparison, the delay to the P-wave arrival at the fourth active station, indicating the lower boundary for EEW (neglecting data delay), is shown in blue. The heights of the ellipses for VS and FinDer represent the first EEW magnitude estimates, and their widths represent the final magnitude (following magnitude scale in B). While first VS magnitudes for some of the smaller events tend to be overestimated, they converge towards correct solutions during subsequent updates. (B) The final locations are color-coded with delays of the first EEW (VS or FinDer) solution. Further details on errors are provided in Figure 10.
Figure 10 provides an overview for the errors in hypocentral location, timing and magnitude for all EEW estimates (with 83 earthquakes for VS, and five earthquakes for FinDer). The median location error of the first EEW estimates is about 5 km. Larger location errors are produced with the earliest VS origins from a handful of smaller earthquakes. These poor origins were produced by unrelated or false picks across the network, and subsequent origins quickly migrate to close to the catalogue solution when integrating additional data. Magnitude errors are centered at about +0.1 unit of magnitude, with stronger over-estimation when associated with origins with large location errors. The median magnitude error in FinDer is about zero, though there is a heavy tail with magnitude overestimates of 0.5–1.6 over the 60th percentile–which is an outlier from a single event.
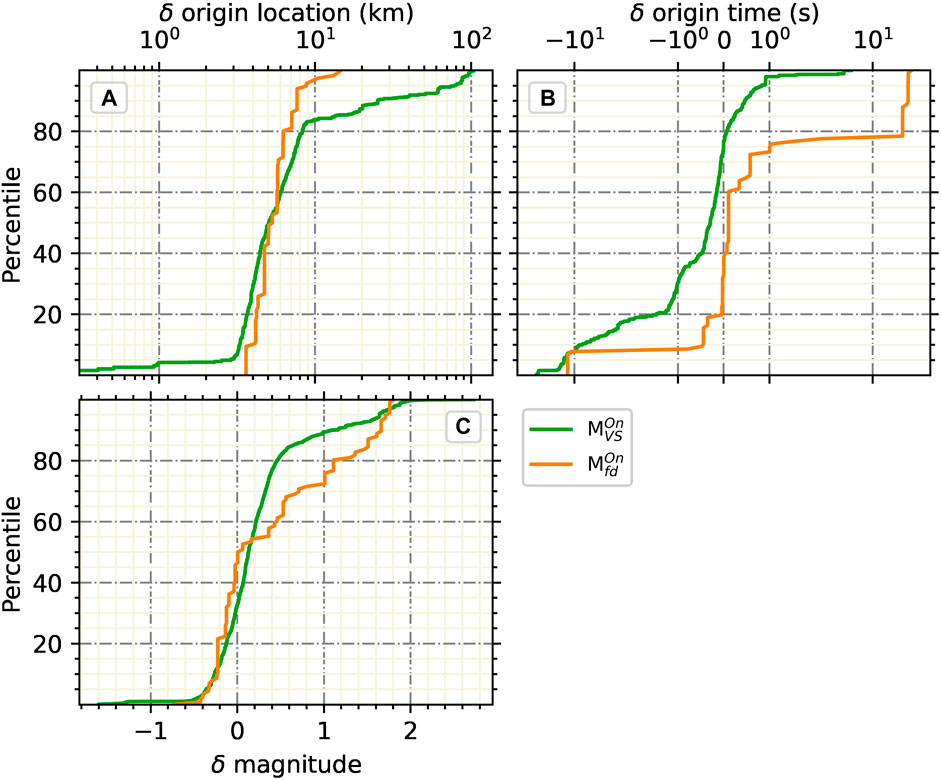
FIGURE 10. Cumulated distributions of errors (δ) from VS (green, 83 earthquakes) and FinDer (orange, five earthquakes) from online operation during the Elm earthquake sequence for events with magnitude above 1.2. Errors are inferred as the difference between the attributes of the final and the EEW (VS or FinDer) solutions. (A) Errors in hypocentral location. (B) Errors in earthquake origin time. (C) Errors in magnitude.
Real-Time and Playback EEW Performance During Significant Events
The ESE supports real-time re-processing of all historic events associated with archived waveforms using the latest system and algorithm configurations (note that the system and algorithms underwent a number of changes during the testing period). These playbacks allow us to evaluate EEW performance for historical earthquakes, neglecting packet delay (with a 0.4 s median, Supplementary Figure SA1a), while still being subject to the original packet reception interval (with a median of 1.6 s, Supplementary Figure SA1b).
We run ESE playbacks for the 100 largest earthquakes with magnitudes over 2.7 within Switzerland (and Liechtenstein) since 2009. We also collect the corresponding EEW solutions provided in real-time for the same events beginning from late-2014 for VS and mid-2017 for FinDer. The VS primary location method has been configured to use four stations instead of six since mid-2017. The full overview of the playback results is provided in the Supplementary Figure SA3 and Supplementary Table SA1. Here we focus on the performance for the eight largest playback earthquakes over magnitude 3.9, as presented in Table 1.
Figure 11 provides an overview of ESE real-time and playback performance for these eight events. Earthquakes E6, E4 and E7 (Ml4.1 Buchs 2009, Ml4.2 Zug 2012, and MLh4.1 Sargans 2013) occurred before 2015, without available real-time results. Although they have observed arrival time delays of 2–7 s (after reference origin time) to the fourth closest station, EEW times are slow. This is because a significant number of key near field strong motion stations were recorded on offline, low resolution (12 or 16 bit) accelerometers (that have subsequently been replaced)–thus in playback there are relatively long packet reception intervals, since we use a constant 512-byte packet size. As a consequence for playbacks, first VS estimates are produced in 7–9 s while FinDer requires 9–12 s, a situation that would not be repeated today. This is confirmed in Supplementary Figure SA3, where the delay times to the fourth closest stations are observed to reduce over time, and are now generally stable and match that in the theoretical delays seen in Figure 3.
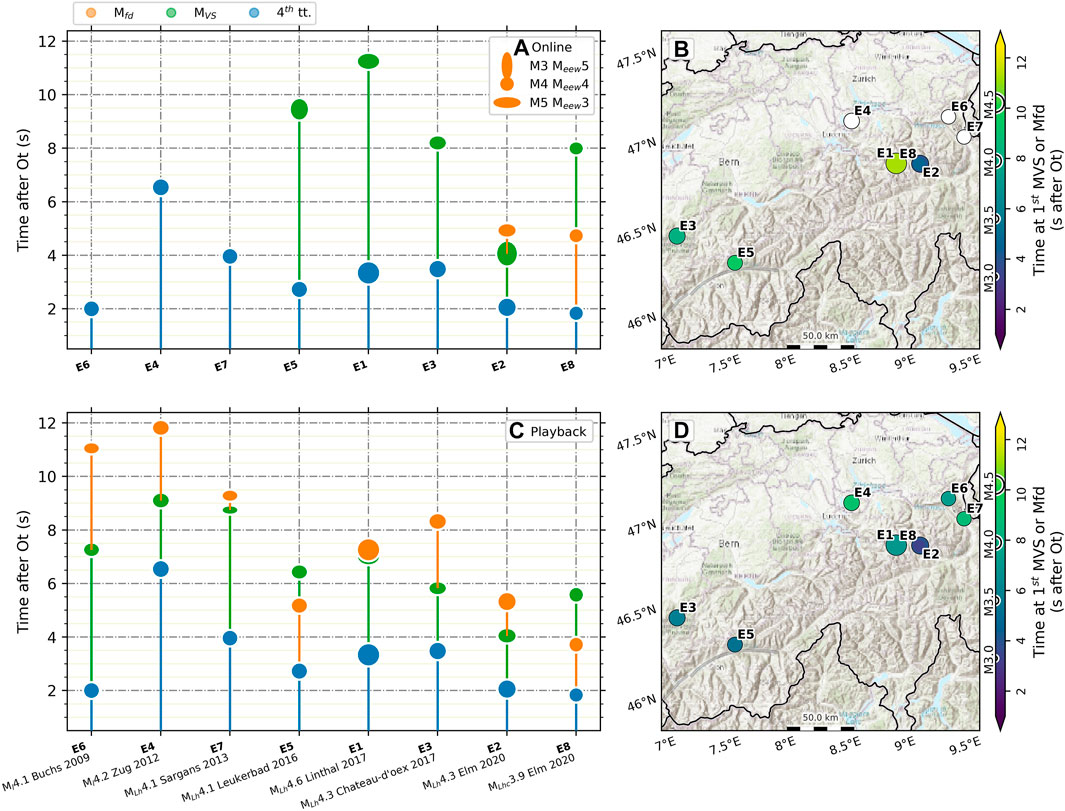
FIGURE 11. Temporal (A,C) and geographical (B,D) overview of the VS (green), and FinDer (orange) performance for the eight largest earthquakes over magnitude 3.9 in Switzerland since 2009. The plotting conventions are the same as for Figure 9. (A,B) Online (real-time) results, provided by the real-time ESE system. The online ESE database includes VS results since late-2014, and FinDer results since mid-2017. The VS primary location method has been configured for using four stations since mid-2017. (C,D) Playback results, obtained with the ESE playback system. The EEW methods in the playback system are configured in a similar way to the post-2019 online system with the exception of one parameter in one of the VS location methods, adjusted for not aggregating triggers more than 7 s apart. Further details on errors are provided in Figure 12.
Earthquakes E5, E1, E3 (MLh4.1 Leukerbad 2016, MLh4.6 Linthal 2017, and MLh4.3 Chateau-d’Oex 2017) occurred before FinDer was included in ESE, and before the VS configuration was adjusted to provide a location with four stations. Thus, despite travel time delays of 3–4 s, online VS results came in 8–11 s, with incorrect first location for E5 and E1. These issues are corrected in playback, with VS in 6–7 s and similar FinDer performance.
Earthquakes E2 and E8 (MLh4.3 Elm 2020, and MLhc3.9 Elm 2020) both occurred when FinDer was online and VS configured for location with four stations. Their playback results are similar to those obtained online with the exception of improved VS performance for the MLhc3.9 Elm 2020 aftershock. This improvement was achieved by adjusting one parameter in the scanloc location method (Scanloc Documentation, 2021, Grigoli et al., 2018) avoiding aggregation of late triggers separated by an unrealistically large time difference to be related to the same event, considering that many stations are available in between but not triggered.
In general, the performance of the top 100 events in both real-time and playback matches these largest earthquakes, as seen in Supplementary Figure SA3. Since 2013, with the dense network and well configured algorithms, the large majority of events would have been first characterised within 10 s, and many far faster.
A detailed error analysis of all EEW solutions for these eight largest earthquakes is shown in Figure 12. FinDer systematically has higher errors in location than VS, because it is using a coarser location grid and determining a centroid rather than hypocenter location (see FinDer section). Playback results are observed to be on average slightly worse for both algorithms, though this is explained since additional, older events, with a relatively sparse data coverage, are included in playback. For these largest events, in real-time both algorithms tend to underestimate magnitudes by 0.2 on average. In playback, VS performs worse with a 0.4 average underestimation. Since playback using the latest configuration allows solutions using fewer stations, playbacks result in faster earliest solutions but with slightly increased errors (faster solutions in playback are also facilitated by neglecting the packet reception delay). Nevertheless, in playback, both FinDer and VS provide rapid, blunder-free and complimentary EEW performance. Both algorithms perform well even for intermediate magnitude earthquakes in Switzerland. Supplementary Figure SA4 presents the error analysis for all 100 largest events. A more reduced average magnitude underestimation by VS of about 0.15 magnitude units is apparent.
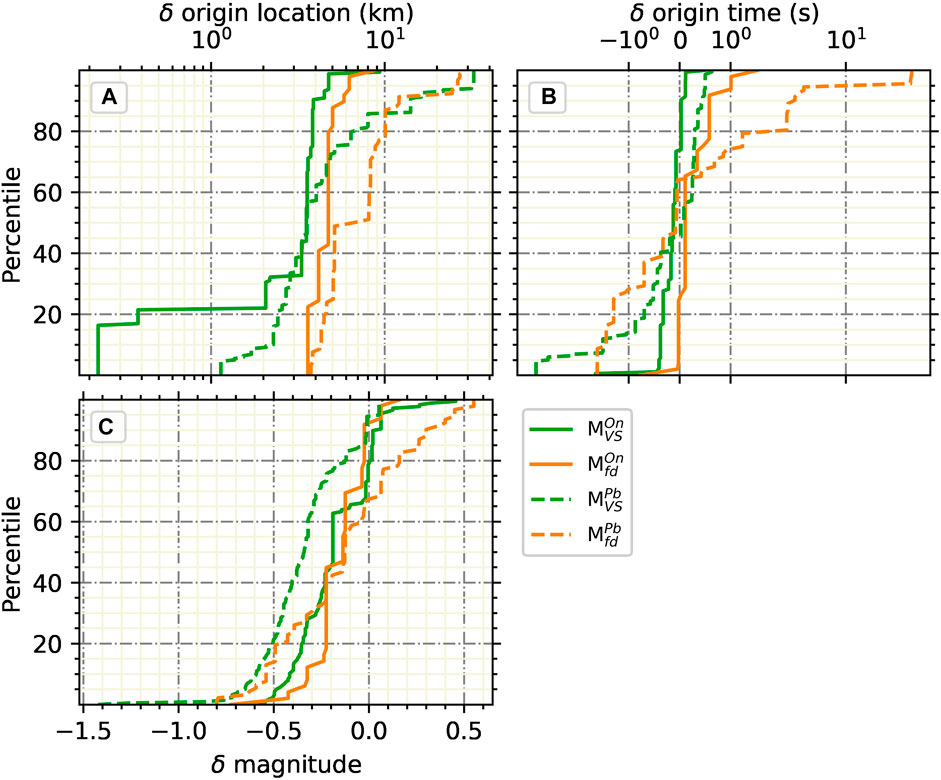
FIGURE 12. Cumulated distributions of errors (δ) from VS (green) and FinDer (orange) for the eight largest earthquakes over magnitude 3.9 in Switzerland and Lichtenstein since 2009. We use the same plotting conventions as in Figure 10, adding playback results (Pb, dashed lines) to the online (real-time) results (On, solid lines).
Discussion
The Swiss Seismological Service (SED) operates a prototype EEW system for Switzerland, called ESE (SED-ETHZ SeisComP EEW system). The key recent change of ESE is the integration of the FinDer algorithm in mid-2017 alongside the existing VS algorithm. Having two independent algorithms adds robustness to the system as demonstrated here for the MLhc3.9 Elm earthquake. A small quarry blast that occurred in another part of Switzerland in the seconds before this event caused significant delays in the pick-based VS algorithm, while FinDer, based on the emerging spatial patterns of strong motion, was unaffected and provided timely alerts.
The EEW performance presented in this study is made possible by sustained efforts to develop and maintain an EEW-ready seismic monitoring infrastructure. The Swiss Seismic Network was not primarily developed for EEW. However, since 2009, every opportunity to upgrade and extend the permanent network has been taken with EEW in mind. In particular, the number of strong motion stations has grown very rapidly (Figure 2) to the stage where today over 175 permanent stations are equipped with strong motion sensors (Figure 3B). Further, the majority of stations have dataloggers that support low latency streaming (Figure 3A). Finally, uptime for the majority of stations averages over 99% each year. With this observational capability, Switzerland provides an excellent opportunity for developing, testing and demonstrating EEW. Further, these high-quality waveform data are available in real-time and in open archives. Although seismicity in Switzerland is moderate, a number of events with magnitude over four have recently been recorded available to demonstrate performance.
These measures ensure event detection for significant seismic events is now routinely observed in under 10 s across the country (last 5 years in Supplementary Figure SA3a) resulting in a maximum late-warning area of 32 km radius (S-wave distance for 10 s in Supplementary Figure SA5c). Further, for large portions of the country, in particular regions with significant recent and historic seismicity (Figure 3C), alerts are available in the order of 5 s (late-warning area of 14 km radius, Supplementary Figure SA5). Our study does not address missed and false alerts because event playback does not allow us to look into false positive rates, and configuration changes do not allow us to go further back in time before 2018. Since 2018, 1.5% of the MVS exceeding 2.5 did not correspond to true seismic events. The rate of false positives from FinDer has been variable over time, but during the last 6 months no MVS or Mfd solution exceeded 2.5 without a true seismic event.
ESE performance in Switzerland compares well with the US ShakeAlert system, the state-of-the art EEW system currently operating across the US West Coast. ShakeAlert and ESE in Switzerland are both operating on dense networks that have been optimised for low latency. Like ESE, ShakeAlert combines FinDer with a point source algorithm, EPIC (Kohler et al., 2020). The FinDer delays in both systems are similar, while VS in Switzerland is about 1 s slower than EPIC in ShakeAlert. The fastest alerts in ShakeAlert (both EPIC and FinDer) are about 3 s, 20% of alerts are faster than 5.5 s, the median alert delay after event nucleation throughout the US West Coast is 7.2 s, with 80% of first alerts faster than 10.5 s, and 90% of first alerts are faster than 13.5 s, varying with epicentral station density (and magnitude for marginal events; J. Andrews, written communication, May 2021).
We demonstrated in this paper, the current EEW performance of ESE in Switzerland using the observed seismicity occurring over the last 10 years, with a maximum magnitude of ML 4.6. Of course events of this type are not the target for the EEW system–damage is not observed and shaking intensities are moderate and restricted to narrow regions around the epicenter. Nevertheless, the delays and the precision in location and magnitude presented here can be expected to be repeated during more significant events since VS and FinDer have been extensively tested as described in the method section. ESE also operates effectively in regions with larger events M6+ seismicity, the ESE framework is being continuously tested in Nicaragua, El Salvador, and Costa Rica (Massin et al., 2018, 2020, Porras et al., 2021). In addition, the performance of FinDer is continuously monitored and improved in the US West Coast ShakeAlert warning system (Given et al., 2018), which uses another, Earthworm-based wrapper but the same FinDer algorithm code.
This study also documents the impact of recent improvements in the configuration of VS as compared to Behr et al. (2015). In addition to the network densification, key VS configuration changes include the SeisComP location module migration from the six station configuration of scautoloc to the four station configuration of both scautoloc and scanloc; and implementation of 1 s magnitude windows instead of the original 3 s. In Behr et al. (2015), the observed real-time VS delays fell between 12 and 14 s for the 16th and 84th percentile for earthquakes within Switzerland, while we report real-time VS delays since 2014 from 6.5 to 12.5 s, respectively (with a 8.7 s median or a 27 km late alert zone radius, Supplementary Figure SA5). The median first magnitude delay in playback is about 7.3 s for VS and 5.8 s for FinDer, corresponding to the propagation of S-waves over 22 and 17 km, respectively (varying by about 4 km depending on the depth). Comparing VS and FinDer on the intersecting subsets of nine earthquakes since 2017 that have results for both algorithms shows real-time median delays of 8.5 and 7 s for VS and FinDer, both improving by about 1s in playback (Supplementary Figure SA6).
In ESE in Switzerland, the first VS magnitude is generally available 4–5 s after the P-wave arrives at the fourth station; for FinDer the performance is less predictable in the magnitude range considered here (FinDer requires PGA >2 cm/s/s at three neighboring stations). Playbacks with the current configuration are faster than real-time performance, though earliest playback solutions tend to have larger errors. FinDer can overestimate magnitudes of small earthquakes (Supplementary Figure SA4), but does not for earthquakes over M3.9 (Figure 12). VS, by contrast, allows continuous (configuration and metadata) quality control with background seismicity and computation stress testing with intense sequences of non-damaging events, but shows increased magnitude under-estimation errors on the largest earthquakes (by 0.7 and 0.4 units in median for playbacks and online, Figure 12) compared to smaller earthquakes (by 0.2 and 0.3 units in median for playbacks and online, Supplementary Figure SA4).
In general, comparing playback and online results in the current configuration of the ESE underlines the trade-off between detection speed and location errors. Although each processing stage of the ESE provides quality metrics, an independent and unified real-time quality evaluation procedure of EEW magnitudes is still missing for detecting potential errors in EEW. VS uses quality parameters of the origin location and magnitude to produce likelihood estimates of correct event detection (Behr et al., 2016). The VS likelihood is an example of an empirical approach for identifying incorrect event parameters, while FinDer uses cross-correlation coefficients and misfit values. With the introduction of FinDer as a major component of ESE, it is critical to develop a tool for quantitative decision-making in the EEW context. Minson et al. (2017), for example, demonstrate how an optimal EEW solution can be identified among multiple options, using available ground motion observations. We intend to implement a similar methodology in ESE in future.
The current ESE configuration can still be improved. We demonstrate how an adjustment of the ESE configuration can improve EEW in presence of a simultaneous quarry blast during the MLhc3.9 Elm 2020 aftershock using the playback functionality of the ESE (developed by Behr et al., 2015; Behr et al., 2016). Future improvement towards a better VS location method configuration might tend toward more location updates. The current ESE configuration for VS limits the location update interval to 10 s, ignoring stations that become available for origin and subsequent magnitude evaluation. This arbitrary limitation aiming at controlling usage of computing resources will hopefully become unnecessary in the short term.
Conclusion
We document the latest status of ESE, the SED-ETHZ SeisComP EEW system, that includes the VS and FinDer algorithms. In general, both algorithms are observed to be similarly fast. The pick-based VS method provides fast locations and magnitudes for any event that triggers the national network. Since 2014, the median delay for the first VS alert is 8.7 s after origin time. FinDer relies on recognition of peak amplitudes exceeding a certain threshold (here 2 cm/s2), so is only activated for larger events (M > 3.5), but events as small as M2.7 have been detected. Since 2017, the median delay for the first FinDer alert is 7 s. Playbacks of the largest 100 events, with M ≥ 2.7, over the last 10 years using the current configuration indicate median delays of 7.3 and 5.8 s for VS and FinDer, respectively–though FinDer only provides a solution for 37 of these events. The median value for the travel time of the P waves from event origin to the fourth station accounts for 3.5 s of delay; with an additional 1.4 s for data sample delays in real-time testing.
Operating two independent algorithms provides redundancy and increase the tolerance to failures of a single algorithm. In this manuscript, we demonstrate this for the MLhc3.9 Elm earthquake, for which an independent quarry blast in the seconds before delays the pick-based VS by 4 s, while FinDer is not affected by the small amplitudes of quarry blast signals and performs as expected.
The Swiss Seismic Network continues to be optimised for EEW–today over 175 permanent stations include strong motion stations, and the majority of stations have been upgraded to include low-latency streaming. Station uptime is high. With the EEW methodologies integrated in SeisComP, and the quality of the monitoring infrastructure, the ESE system in Switzerland is achieving a performance in terms of speed that is similar to the US ShakeAlert EEW system.
Data Availability Statement
The original contributions presented in the study are included in the article Supplementary Material, further inquiries can be directed to the corresponding author. We use waveform data from the permanent networks CH (Swiss Seismological Service (SED) at ETH Zurich, 1983) and C4 (CERN, 2016); as well as the temporary networks 4D (Swiss Seismological Service (SED) at ETH Zurich, 1985), 8D (Swiss Seismological Service (SED) at ETH Zurich, 2005), XY (Swiss Seismological Service (SED) at ETH Zurich, 2018) and XP (Swiss Seismological Service (SED) at ETH Zurich, 2012). The SED-ETHZ station inventory, waveform and event catalogue data are available at http://eida.ethz.ch via webservices following the International Federation of Digital Seismograph Networks (https://www.fdsn.org/webservices). The 100 largest earthquakes within Switzerland over magnitude 2.7 since 2009 can be extracted from querying the SED-ETHZ FDSN web-service with https://tinyurl.com/3f8wzdu3. The results provided in this study are produced within the SeisComP software (Helmholtz Centre Potsdam GFZ German Research Centre for Geosciences and gempa GmbH, 2008), analysed with Obspy (The ObsPy Development Team, 2019), all figures are made with Matplotlib (Hunter, 2007) and all maps with The Basemap toolkit (https://github.com/matplotlib/basemap) and the “World Ocean Base” map layer (Esri, GEBCO, NOAA, Garmin, HERE, and other contributors. “World_Ocean_Base” [basemap]. Scale Not Given. “World Ocean Base.” February 24, 2014. https://www.arcgis.com/home/item.html?id=1e126e7520f9466c9ca28b8f28b5e500). The SeisComP playback utility that we use for real-time simulation is available at https://github.com/SED-EEW/sc3-playback. Licenses, documentations and source codes for VS and FinDer can be found on the SED-ETHZ website at http://seismo.ethz.ch/en/research-and-teaching/fields_of_research/earthquake-early-warning. All websites were last accessed in August 2021. Supplemental material contains one table, five figures and a detailed description of the ground-motion intensity prediction method.
Author Contributions
FM: Co-responsible for EEW at SED-ETHZ. Contributed to the design of the work and technical information, provided analysis of data, figures, and draft. MB: Co-responsible for EEW at SED-ETHZ and for the development of FinDer. Contributed to the design of the work, technical information, interpretation, analysis of data, draft and critical revision. JC: Director of seismic networks at SED and the related activities. Contributed to the design of the work, technical information, interpretation, analysis of data, draft and critical revision.
Conflict of Interest
The authors declare that the research was conducted in the absence of any commercial or financial relationships that could be construed as a potential conflict of interest.
Publisher’s Note
All claims expressed in this article are solely those of the authors and do not necessarily represent those of their affiliated organizations, or those of the publisher, the editors and the reviewers. Any product that may be evaluated in this article, or claim that may be made by its manufacturer, is not guaranteed or endorsed by the publisher.
Acknowledgments
The ETHZ-SED seismic network receives real-time seismic waveforms from the Zentralanstalt für Meteorologie und Geodynamik in Vienna (ZAMG, network code OE, https://doi.org/10.7914/SN/OE), the Istituto Nazionale di Geofisica e Vulcanologia in Rome (INGV, network code IV, https://doi.org/10.13127/SD/X0FXNH7QFY), the Istituto di Geofisica, Università di Genova (network code GU, https://doi.org/10.7914/SN/GU), the Zivilschutz der Autonomen Provinz Bozen-Südtirol (network code SI), the Istituto Nazionale di Oceanografia e di Geofisica Sperimentale (OGS, network code OX, https://doi.org/10.7914/SN/OX) in Trieste, the Landeserdbebendienst Baden-Württemberg in Freiburg (LED, network code LE), the Bundesanstalt für Geowissenschaften und Rohstoffe in Hannover (BGR, network code GR, https://doi.org/10.25928/mbx6-hr74), the Réseau Sismologique et Géodésique Français (RESIF, network code FR, http://dx.doi.org/10.15778/RESIF.FR and RA, https://doi.org/10.15778/RESIF.RA), and the AlpArray Seismic Network Team (AlpArray Seismic Network, network code Z3, https://doi.org/10.12686/alparray/z3_2015). The authors especially thank the SED Electronic Laboratory team, who build and maintain the seismic network, as well as Philipp Kästli, Stefan Heimers, Roman Racine and Luca Scarabello who maintain and develop the hardware and software infrastructure of the seismic network.
Supplementary Material
The Supplementary Material for this article can be found online at: https://www.frontiersin.org/articles/10.3389/feart.2021.707654/full#supplementary-material
References
Allen, R. (1982). Automatic Phase Pickers: Their Present Use and Future Prospects. Bull. Seismological Soc. America 72, S225–S242. doi:10.1785/bssa07206b0225
Allen, R. M., and Melgar, D. (2019). Earthquake Early Warning: Advances, Scientific Challenges, and Societal Needs. Annu. Rev. Earth Planet. Sci. 47, 361–388. doi:10.1146/annurev-earth-053018-060457
Allen, T. I., Wald, D. J., and Worden, C. B. (2012). Intensity Attenuation for Active Crustal Regions. J. Seismol 16 (3), 409–433. doi:10.1007/s10950-012-9278-7
Baer, M., and Kradolfer, U. (1987). An Automatic Phase Picker for Local and Teleseismic Events. Bull. Geol. Soc. America 77 (4), 1437–1445. doi:10.1785/bssa0770041437
Behr, Y., Clinton, J. F., Cauzzi, C., Hauksson, E., Jónsdóttir, K., Marius, C. G., et al. (2016). The Virtual Seismologist in SeisComP3: A New Implementation Strategy for Earthquake Early Warning Algorithms. Seismological Res. Lett. 87, 363–373. doi:10.1785/0220150235
Behr, Y., Clinton, J., Kästli, P., Cauzzi, C., Racine, R., and Meier, M.-A. (2015). Anatomy of an Earthquake Early Warning (EEW) Alert: Predicting Time Delays for an End-To-End EEW System. Seismological Res. Lett. 86 (3), 830–840. doi:10.1785/0220140179
Behr, Y. D., Cua, G. B., Clinton, J. F., and Heaton, T. H. (2012). Evaluation of Real-Time Performance of the Virtual Seismologist Earthquake Early Warning Algorithm in Switzerland and California, 53. American Geophysical Union.
Böse, M., Clinton, J., Massin, F., Cauzzi, C., Smith, D., and Andrews, J. (2018b). Offline-Performance of FinDer v.2 during the 2016/17 Central Italy Earthquake Sequence. EGU Gen. Assembly 20, 4650. doi:10.13140/RG.2.2.14290.04808
Böse, M., Felizardo, C., and Heaton, T. H. (2015). Finite-Fault Rupture Detector (FinDer): Going Real-Time in Californian ShakeAlert Warning System. Seismological Res. Lett. 86, 1692–1704. doi:10.1785/0220150154
Böse, M., Heaton, T. H., and Hauksson, E. (2012). Real-time Finite Fault Rupture Detector (FinDer) for Large Earthquakes. Geophys. J. Int. 191, 803–812. doi:10.1111/j.1365-246X.2012.05657.x
Böse, M., Hutchison, A. A., Manighetti, I., Li, J., Massin, F., and Clinton, J. F. (2021a). “FinDerS(+): Real-Time Earthquake Slip Profiles and Magnitudes Estimated from Backprojected Slip with Consideration of Fault Source Maturity Gradient,”. in press in The New Frontiers of Earthquake Early Warning Systems.
Böse, M., Julien-Laferrière, S., Bossu, R., and Massin, F. (2021b). Near Real-Time Earthquake Line-Source Models Derived from Felt Reports. Seismol. Res. Lett. 92 (3), 1961–1978. doi:10.1785/0220200244
Böse, M., Smith, D. E., Felizardo, C., Meier, M.-A., Heaton, T. H., and Clinton, J. F. (2018a). FinDer v.2: Improved Real-Time Ground-Motion Predictions for M2-M9 with Seismic Finite-Source Characterization. Geophys. J. Int. 212, 725–742. doi:10.1093/gji/ggx430
Carrasco, S., and Böse, M. (2017). “FinDer Performance Using CSN Network: a strong-motion Based Algorithm for Earthquake Early Warning,” in Third Colloquium of Geophysical Signatures of Earthquakes and Volcanoes, Chile.
Cauzzi, C., Behr, Y., Clinton, J., Kästli, P., Elia, L., and Zollo, A. (2016). An Open‐Source Earthquake Early Warning Display. Seismological Res. Lett. 87 (3), 737–742. doi:10.1785/0220150284
Cauzzi, C., Edwards, B., Fäh, D., Clinton, J., Wiemer, S., Kästli, P., et al. (2014). New Predictive Equations and Site Amplification Estimates for the Next-Generation Swiss ShakeMaps. Geophys. J. Int. 200 (1), 421–438. doi:10.1093/gji/ggu404
Clinton, J., Zollo, A., Marmureanu, A., Zulfikar, C., and Parolai, S. (2016). State-of-the Art and Future of Earthquake Early Warning in the European Region. Bull. Earthquake Eng. 14 (9), 2441–2458. doi:10.1007/s10518-016-9922-7
Cua, G. B. (2005). Creating the Virtual Seismologist: Developments in Ground Motion Characterization and Seismic Early Warning. California: California Institute of Technology Pasadena.
Cua, G., Fischer, M., Heaton, T., and Wiemer, S. (2009). Real-time Performance of the Virtual Seismologist Earthquake Early Warning Algorithm in Southern California. Seismological Res. Lett. 80 (5), 740–747. doi:10.1785/gssrl.80.5.740
Cua, G., and Heaton, T. (2007). “The Virtual Seismologist (VS) Method: a Bayesian Approach to Earthquake Early Warning,” in Earthquake Early Warning Systems (Berlin, Heidelberg: Springer Berlin Heidelberg), 97–132. doi:10.1007/978-3-540-72241-0_7
Cuéllar, A., Espinosa-Aranda, J. M., Suárez, R., Ibarrola, G., Uribe, A., Rodríguez, F. H., et al. (2014). “The Mexican Seismic Alert System (SASMEX): Its Alert Signals, Broadcast Results and Performance During the M 7.4 Punta Maldonado Earthquake of March 20th, 2012,” in Early Warning for Geological Disasters. Advanced Technologies in Earth Sciences. Editors F. Wenzel, and J. Zschau (Berlin, Heidelberg: Springer). doi:10.1007/978-3-642-12233-0_4
Diehl, T., Clinton, J., Cauzzi, C., Kraft, T., Kästli, P., Deichmann, N., et al. (2021). Earthquakes in Switzerland and Surrounding Regions during 2017 and 2018. Swiss J. Geosci. 114 (1), 4–29. doi:10.1186/s00015-020-00382-2
Diehl, T., Deichmann, N., Clinton, J., Husen, S., Kraft, T., Plenkers, K., et al. (2013). Earthquakes in Switzerland and Surrounding Regions during 2012. Swiss J. Geosci. 106 (3), 543–558. doi:10.1007/s00015-013-0154-4
Doi, K. (2011). The Operation and Performance of Earthquake Early Warnings by the Japan Meteorological Agency. Soil Dyn. Earthquake Eng. 31 (2), 119–126. doi:10.1016/j.soildyn.2010.06.009
Faenza, L., and Michelini, A. (2010). Regression Analysis of MCS Intensity and Ground Motion Parameters in Italy and its Application in ShakeMap. Geophys. J. Int. 180 (3), 1138–1152. doi:10.1111/j.1365-246x.2009.04467.x
Given, D., Allen, R. M., Baltay, A. S., Bodin, P., Cochran, E. S., Creager, K., et al. (2018). Implementation Plan for the ShakeAlert System-An Earthquake Early Warning System for the West Coast of the United States. Reston, Virginia: US Geological Survey–1155. Available at: https://pubs.usgs.gov/of/2018/1155/ofr20181155.pdf.
Grigoli, F., Scarabello, L., Böse, M., Weber, B., Wiemer, S., and Clinton, J. F. (2018). Pick- and Waveform-Based Techniques for Real-Time Detection of Induced Seismicity. Geophys. J. Int. 213 (2), 868–884. doi:10.1093/gji/ggy019
Hanka, W., Saul, J., Weber, B., Becker, J., and Harjadi, P.Fauzi, & GITEWS Seismology Group (2010). Real-time Earthquake Monitoring for Tsunami Warning in the Indian Ocean and beyond. Nat. Hazards Earth Syst. Sci. 10 (12), 2611–2622. doi:10.5194/nhess-10-2611-2010
Helmholtz Centre Potsdam GFZ German Research Centre for Geosciences and gempa GmbH (2008). The SeisComP Seismological Software Package. GFZ Data Services. doi:10.5880/GFZ.2.4.2020.003
Hsiao, N.-C., Wu, Y.-M., Shin, T.-C., Zhao, L., and Teng, T.-L. (2009). Development of Earthquake Early Warning System in Taiwan. Geophys. Res. Lett. 36, L00B02. doi:10.1029/2008GL036596
Hunter, J. D. (2007). Matplotlib: A 2D Graphics Environment. Comput. Sci. Eng. 9 (3), 90–95. doi:10.1109/mcse.2007.55
Johnson, C. E., Bittenbinder, A., Bogaert, B., Dietz, L., and Kohler, W. (1995). Earthworm: A Flexible Approach to Seismic Network Processing, n.D. Earthworm: A Flexible Approach to Seismic Network Processing. IRIS Newsl. 14(2), 1–4.
Kohler, M. D., Smith, D. E., Andrews, J., Chung, A. I., Hartog, R., Henson, I., et al. (2020). Earthquake Early Warning ShakeAlert 2.0: Public Rollout. Seismological Res. Lett. 91 (3), 1763–1775. doi:10.1785/0220190245
Kradolfer, U., and Mayer-Rosa, D. (1988). Attenuation of Seismic Waves in Switzerland, Recent Seismological Investigations in Europe. Proceedings of the XIX General Assembly of the ESC. Moscow, 481–488.
Li, J., Böse, M., Feng, Y., and Yang, C. (2021). “Real-time Characterization of Finite Rupture and its Implication for Earthquake Early Warning: Application of FinDer to Existing and Planned Stations in Southwest China,”. subm. in The New Frontiers of Earthquake Early Warning Systems.
Li, J., Böse, M., Wyss, M., Wald, D. J., Hutchison, A., Clinton, J. F., et al. (2020). Estimating Rupture Dimensions of Three Major Earthquakes in Sichuan, China, for Early Warning and Rapid Loss Estimates. Bull. Seismol. Soc. Am. 110 (2), 920–936. doi:10.1785/0120190117
Massin, F., Clinton, J., Racine, R., Rossi, Y., Böse, M., Strauch, W., et al. (2020). 2020 Annual Meeting. Seismological Res. Lett. 91, 1095–1338. Number 2B. doi:10.1785/0220200043
Massin, F., Strauch, W., Clinton, J. F., Böse, M., and Ramirez, J. (2018). 2018 Seismology of the Americas Meeting Building Eew in Nicaragua: Performance and Perspectives. 2018 Seismology of the Americas Meeting. Seismological Res. Lett. 89, 717–966. Number 2B. doi:10.1785/0220180082
Meier, M.-A., Kodera, M., Böse, A., Chung, A., Hoshiba, M., Cochran, E., et al. (2020). How Often Can Earthquake Early Warning Systems Alert Sites with High‐Intensity Ground Motion? J. Geophys. Res. Solid Earth 125 (2), e2019JB017718. doi:10.1029/2019jb017718
Minson, S. E., Wu, S., Beck, J. L., and Heaton, T. H. (2017). Combining Multiple Earthquake Models in Real Time for Earthquake Early Warning. Bull. Seismological Soc. America 107(4), 1868–1882. doi:10.1785/0120160331
Porras, J., Massin, F., Arroyo-Solórzano, M., Arroyo, I., Linkimer, L., Böse, M., et al. (2021). “Preliminary Results of an Earthquake Early Warning System in Costa Rica,”. in The New Frontiers of Earthquake Early Warning Systems.
Racine, R., Cauzzi, C., Clinton, J., Fäh, D., Edwards, B., Diehl, T., et al. (2020). Updated Determination of Earthquake Magnitudes at the Swiss Seismological Service, Online. EGU Gen. Assembly 2020, EGU2020–8273. doi:10.5194/egusphere-egu2020-8273.2020
Scanloc Documentation (2021). Available at: https://docs.gempa.de/scanloc/current/(last accessed August, 2021).
Sheen, D. H., Park, J. H., Chi, H. C., Hwang, E. H., Lim, I. S., Seong, Y. J., et al. (2017). The First Stage of an Earthquake Early Warning System in South Korea. Seismological Res. Lett. 88 (6), 1491–1498. doi:10.1785/0220170062
Swiss Seismological Service (SED) At ETH Zurich (1983). National Seismic Networks of Switzerland. Other/Seismic Network. Zurich: ETH Zürich. doi:10.12686/sed/networks/ch
Swiss Seismological Service (SED) At ETH Zurich (2018). Stations Deployed for Risk Model Switzerland. Other/Seismic Network. Zurich: ETH Zurich. doi:10.12686/sed/networks/xy
Swiss Seismological Service (SED) At ETH Zurich (2005). Temporary Deployments in Switzerland Associated with Aftershocks and Other Seismic Sequences. Zurich: ETH Zurich. doi:10.12686/sed/networks/8d
Swiss Seismological Service (SED) At ETH Zurich (1985). Temporary Deployments in Switzerland Associated with Glacier Monitoring. Zurich: ETH Zurich. doi:10.12686/sed/networks/4d
Swiss Seismological Service (SED) At ETH Zurich (2012). Temporary Deployments in Switzerland Associated with Landslides. Other/Seismic Network. Zurich: ETH Zurich. doi:10.12686/2034sed/networks/xp
Keywords: Switzerland, Swiss Seismic Network, earthquake early warning, Virtual Seismologist, FinDer, finite-fault
Citation: Massin F, Clinton J and Böse M (2021) Status of Earthquake Early Warning in Switzerland. Front. Earth Sci. 9:707654. doi: 10.3389/feart.2021.707654
Received: 10 May 2021; Accepted: 16 August 2021;
Published: 09 September 2021.
Edited by:
Giovanni Martinelli, National Institute of Geophysics and Volcanology, ItalyReviewed by:
Ran Novitsky Nof, Geological Survey of Israel, IsraelAli Pinar, Boğaziçi University, Turkey
Copyright © 2021 Massin, Clinton and Böse. This is an open-access article distributed under the terms of the Creative Commons Attribution License (CC BY). The use, distribution or reproduction in other forums is permitted, provided the original author(s) and the copyright owner(s) are credited and that the original publication in this journal is cited, in accordance with accepted academic practice. No use, distribution or reproduction is permitted which does not comply with these terms.
*Correspondence: Frédérick Massin, Zm1hc3NpbkBldGh6LmNo