 Lanfeng Bo
 Zhanbin Li1,2*
 Guoche Xu
 Lie Xiao
95% of researchers rate our articles as excellent or good
Learn more about the work of our research integrity team to safeguard the quality of each article we publish.
Find out more
ORIGINAL RESEARCH article
Front. Earth Sci. , 14 July 2021
Sec. Hydrosphere
Volume 9 - 2021 | https://doi.org/10.3389/feart.2021.704901
This article is part of the Research Topic Surface Processes and Morphodynamics Related to Climate and Human Impacts View all 12 articles
In the arid and semi-arid regions of the Loess Plateau, seasonal freezing and thawing influence soil water movement, and water movement directly influences vegetation growth. However, currently, research with regard to freezing and thawing processes under various vegetation types and the mechanism of soil water movement is lacking. Therefore, the present study explored soil water migration characteristics of two typical vegetation types [arbor land (AL) and shrub land (SL)] on the Loess Plateau during seasonal freezing and thawing processes using bare land (BL) as a control. We used field measured data for hourly soil temperature (ST) and soil water content (SWC) at a depth of 100 cm below the soil surface from November 2017 to March 2018. Freezing and thawing process was divided into three stages based on ST change (initial freezing period, stable freezing period, and thawing period). Compared with previous studies in this area, ST is lower than expected, and SWC migration characteristics are also different. The results revealed that: 1) the maximum freezing depth of AL and SL was 60 cm, which was 30 cm less than that of BL. The freezing date of each soil layer in BL was the earliest and average ST value was the lowest. BL had the highest degree of freezing. The freezing of all soil layers in AL occurred at a later date than that of SL. ST and the minimum soil freezing temperatures were higher than those of SL, and the capacity of AL to resist freezing was higher; 2) the SWCs in AL and BL at depths of 0–10 cm and 10–30 cm decreased, whereas SWCs of AL and BL at a depth of 60 cm increased by 152 and 146%, respectively. The SWCs of SL at soil depths of 0–10 cm, 10–30 cm, and 30–60 cm increased by 46.3, 78.4 and 205%, respectively. The amount and distribution of soil moisture in SL were optimum when compared to those of AL and BL. The results of the present study could provide a scientific basis for vegetation restoration in arid and semi-arid areas of the Loess Plateau.
Soil moisture is a key variable in the hydrological cycle that links precipitation, runoff, and groundwater (Sun et al., 2015; Wang et al., 2018b), and a key ecological factor that determines ecosystem functions and vegetation restoration (Pan et al., 2015; Wang et al., 2019c). Seasonal freezing and thawing influence the movement and distribution of soil moisture (Hu et al., 2013; Fu et al., 2018). Numerous studies have revealed that soil temperature (ST) is a primary driving force, which influences soil water movement during soil freeze-thaw cycles (Li et al., 2012; Wang et al., 2018a; Wang et al., 2019b). Variations in soil water potential caused by freezing of soil drive soil moisture from unfrozen areas to the freezing front (Li et al., 2013; Zhang et al., 2014; Yang and Wang., 2019), resulting in variations in soil moisture distribution (Wu et al., 2017; Lai et al., 2018; Lu et al., 2019). However, soil moisture distribution has had a direct impact on vegetation growth activities in recent years (Xiao et al., 2019; Frost et al., 2020), especially in the arid and semi-arid areas of the Loess Plateau, where long-term rainfall is insufficient and irrigation cannot be practiced (Yang et al., 2012; Cheng and Liu, 2014; Xiao et al., 2020). Therefore, studying soil freezing and thawing processes will enhance our understanding of soil moisture migration dynamics, and could have a guiding significance for the hydrological management of the study area.
Over the last few years, several local and international researchers have investigated the transport mechanisms of soil moisture in different regions and environments during freezing and thawing periods (Mohammed et al., 2013; Chen et al., 2016; Sun et al., 2011). The study areas were mainly distributed in Russia, Canada, the United States, and China, accounting for 50% of the global land area (Kruk et al., 2012; Wang et al., 2019a). A study by Nagare et al. (2011) revealed that freezing time and ground temperature conditions were influenced by soil water content (SWC) and soil texture. Soils with high SWCs are more likely to freeze under similar temperature conditions. During the freezing and thawing process of slope land, heat transfer efficiency between soil and air is higher than that of dam land; however, the amount of soil moisture migration and increase in dam land are greater than those of slope land (Wang et al., 2019a). Forests exhibit higher STs under freezing and thawing conditions, and their buffering capacity to variations in ST is greater than that of grasslands (Hu et al., 2013). In China, most of the current research regarding the effects of freezing and thawing is concentrated in the northeast mountainous areas, Inner Mongolia, and Qinghai-Tibetan Plateau where the freezing degree is severe (Liu et al., 2017; Guo et al., 2018; Zhang et al., 2019a). The freezing and thawing characteristics of the areas in terms of soil freezing days, number of freezing and thawing cycles, freezing temperature, and freezing depth are quite distinct from the seasonal freezing and thawing characteristics in areas of the Loess Plateau. Similarly, several researchers currently use the 24-h average ST (daily average ST) as a statistical unit, and a daily average ST below 0°C as a basis for determining the occurrence of soil freezing (Guo et al., 2011; Guo et al., 2020). However, the statistical method is not suitable for determining seasonal freezing and thawing in areas of the Loess Plateau. The statistical method does not take into account the freezing and thawing events with daily average temperatures greater than 0°C because the day and night temperature variations in the Loess Plateau area are extremely high in autumn and spring. In addition, soil freezing and thawing processes determined by the method, including freezing dates, freezing days, thawing dates, and thawing days, may be delayed or shortened.
Soil erosion is a major environmental challenge threatening the sustainable development of seasonal freeze-thaw areas on the Loess Plateau (Zhang et al., 2019b). Over the last few years, numerous soil and water conservation measures have been implemented in the Loess Plateau area, including terracing, construction of silt dams, farming management, and vegetation restoration (Li et al., 2013; Yu et al., 2020). Among the measures, vegetation restoration has been considered one of the most effective soil and water conservation measures (Guo et al., 2018). However, soil moisture is a key ecological factor that restricts vegetation restoration and sustainable development of agriculture and forestry in the area (Huang et al., 2012; Liu et al., 2012). Presently, numerous studies have been carried out with regard to the influence of vegetation restoration and returning farmland to forests on soil moisture characteristics in the Loess Plateau area. The studies have focused on the impact and response of rainy seasons, various vegetation growth periods or varying growth cycles on SWC (Zhou et al., 2015). Research regarding ST, moisture, and vegetation in winter has received relatively little attention due to the lack of rainfall in winter, low soil moisture transpiration, and limited vegetation growth in the Loess Plateau area. Soil water and heat transfer characteristics of different vegetation types under seasonal freezing and thawing conditions remain indeterminate. According to previous studies, we guess that different vegetation types have a certain buffering effect on freezing and thawing, and at the same time, they will also have different effects on the movement of soil moisture. Therefore, the present study investigated ST, SWC, and air temperature (AT) in two vegetation types and bare land (BL) to comprehensively elucidate the impacts of soil water and heat conditions under various vegetation types on the hydrological processes in frozen soil. The objectives of the present study were: 1) to investigate the freezing and thawing characteristics of BL and two vegetation types, 2) to monitor and assess the water redistribution process caused by freezing and thawing in BL and frozen soil in two vegetation types, and 3) to compare variations in soil moisture migration between two vegetation types during freezing and thawing periods.
The study area is located in the Xindiangou Science and Technology Demonstration Park (E110°16′–E110°20′, N37°28′–N37°31′), a soil and water conservation scientific experimental research demonstration base in Suide County, Yulin City, Shaanxi Province, China. The research base is located in the Xindiangou Basin on the left bank of the middle reaches of the Wuding River, a tributary of the Yellow River, with an area of 1.44 km2 and an altitude of 840–1,040 m (Figure 1). The climate of the area is continental temperate and semi-arid monsoon climate. The annual average temperature of the area is 9.7°C, with minimum and maximum temperatures of −27 and 39°C, respectively, and no well-defined freeze-thaw cycles. The average annual precipitation in the basin is 475.1 mm, and summer precipitation accounts for 64.4% of the total annual precipitation. The predominant soil type in the area is silty sandy loam and the vegetation type is temperate forest grassland. Artificial vegetation primarily includes poplar, white elm, dry willow, Chinese arborvitae, and Chinese pine. The shrub vegetation is dominated by yellow rose, korshinsk peashrub, sea buckthorn, and wild jujube.
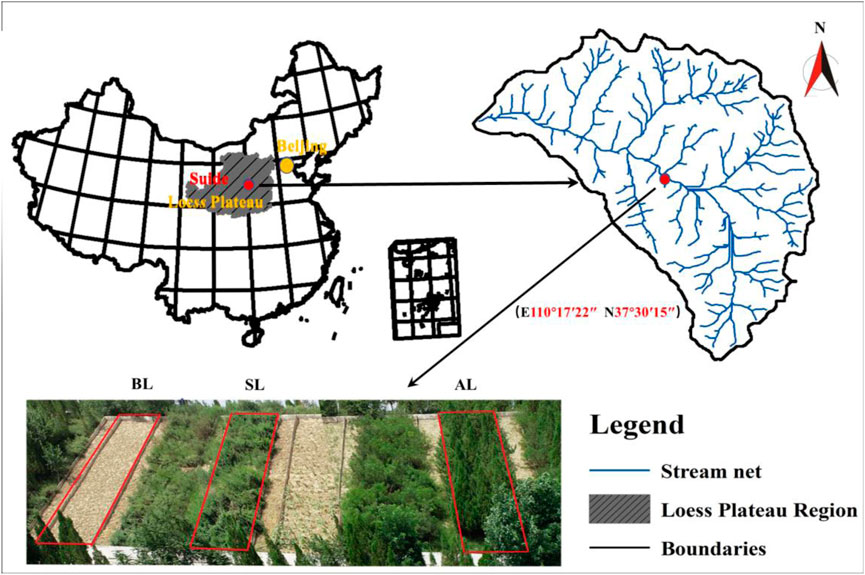
FIGURE 1. Location map of the study area.
Artificial vegetation was selected as the research object. The selected tree species was Platycladus orientalis (family Cupressaceae) and the shrub species was Caragana korshinskii (family Fabaceae), which are the most commonly used species for vegetation restoration and construction in the Loess Plateau area, and P. orientalis is the dominant tree species in the watershed. To reduce the influence of external conditions such as topography and climate on the results of the present study, three runoff communities with similar slope length and slope direction (namely C.korshinskii shrub community, P. orientalis community, and BL community) were selected for positioning monitoring (Figure 1). We monitored and assessed the effects of seasonal freeze-thaw processes under various vegetation types.
ST and soil moisture (0–100 cm depth) were selected for monitoring due to the following reasons: 1) the root systems of most plants are distributed within the top 90 cm of the soil profile (Wang et al., 2018b); 2) the maximum freezing depth of soil within the monitoring area is 90 cm.
The AT monitoring data were obtained from the weather station (RX3000, United States), and ST and SWC were monitored using ET-100 intelligent soil moisture and temperature monitor (Symorui Environmental Technology Co., Ltd., XiAn, China). Thirty probes were placed in the middle of the three runoff plots (shrubs, trees, and BL). The probes were placed at soil depths of 10, 20, 30, 40, 50, 60, 70, 80, 90, and 100 cm. The soil begins to freeze when ST is below 0°C (273.15 K) and begins to melt when ST is above 0°C. The monitoring period was from November 11, 2017 to March 25, 2018 because seasonal freezing and thawing occur between the end of November and the end of March, and there was no rainfall during the monitoring period. ST and SWC at various soil depths were recorded every 60 min.
The classification of soil freezing and thawing processes was based on hourly STs. Soil was considered frozen when the minimum ST was lower than 0°C. Similarly, soil was considered melted when the maximum ST was higher than 0°C. Freeze-thaw cycle refers to a phenomenon in which ST is above and below 0°C simultaneously in a day. Soil was considered to have entered a stable freezing period (a characteristic of the period is that the soil no longer undergoes freezing and thawing cycles) when ST was constantly lower than 0°C. The improved statistical method could effectively reduce errors and enhance statistical accuracy.
Based on the measured ST data, soil freezing and thawing processes during the entire monitoring period was divided into three periods: initial freezing, complete freezing, and thawing periods. Initial freezing period refers to the unstable freezing period in which the soil melts during the day and freezes at night. Complete freezing period refers to the period when ST is constantly lower than 0°C in a stable freezing state for 24 h a day. Thawing period refers to the period when ST begins to be greater than 0°C to a state when ST is completely greater than 0°C.
The freezing rate is defined as the total number of days from the start of soil freezing to the time soil completely freezes at a certain depth; that is, the actual number of days in the initial period of freezing (Wang et al., 2019b).
where Vifreeze is the freezing rate of soil at a depth of i (day), diinitial is the total number of days in the initial freezing period at a depth of i.
Melting rate is defined as the number of days from the time soil at a certain depth begins to melt to the time frozen soil completely melts; that is, the actual number of days during the melting period.
where vithaw is the melting rate of soil at depth i (day), dimelting is the total number of days during the melting period at a depth of i.
SPSS Statistics 16.0 (SPSS Inc, Chicago, IL, United States) was used to analyze the relationships among AT, ST, SWC, and soil depths in two vegetation types and BL. Levene’s test was used to evaluate dynamic variations between ST and SWC during the monitoring period by measuring the coefficient of variation (CV) of soil profile. Regression analyses and plotting of graphs were performed using Origin 8.5 (OriginLab Corporation, Northampton, MA, United States).
The freezing date of arbor land [AL] soil from the surface layer to the deep layer occurred later than that of the corresponding soil layers in shrub land [SL] and [BL] (Figures 2,3; Table 1). The surface soil layers (0–10 cm) of BL, SL, and AL began to freeze on November 14, November 15, and December 4, 2017, respectively. The freezing dates of SL and AL delayed by one and 21 days, respectively when compared with that of BL (Figure 2; Table 1). The freezing rates of the three types of land were not significantly different at soil depths below 30 cm and the soil was completely frozen in only 1–2 days. The overall freezing rate of soil in SL was the lowest, followed by BL, while the freezing rate of soil in AL was the highest within the 10–30 cm soil layer. The maximum number of days of soil freezing was observed in the 20–30 cm soil layer, and followed the order of 85 days for BL > 77 days for SL > 63 days for AL. The minimum freezing STs were observed in the 0–10 cm soil layer and were as follows: −13.5°C in SL, −13.45°C in BL, and −8.3°C in AL. During the entire freeze-thaw process, ST in AL at a similar soil depth was the highest, and the soil freezing date was delayed (Table 2). The freezing depth of soil in BL was 90 cm and that in AL and SL was 60 cm. The freezing depth of soil in BL was 30 cm greater than that of AL and SL (Figure 2).
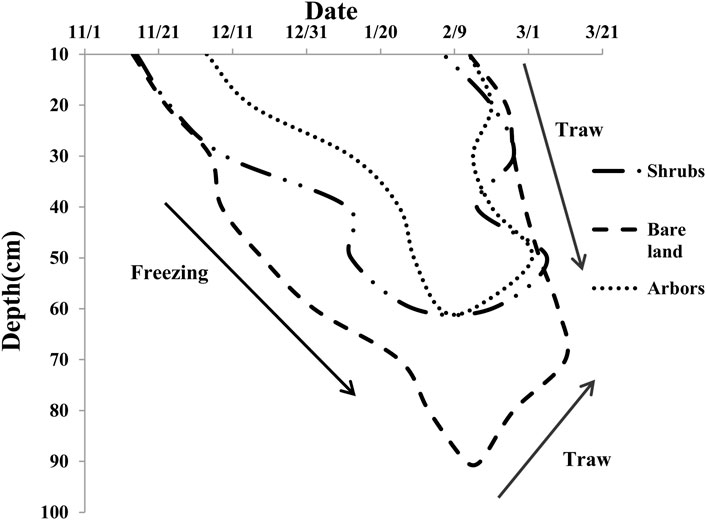
FIGURE 2. Dynamic diagram of freezing and thawing depth.
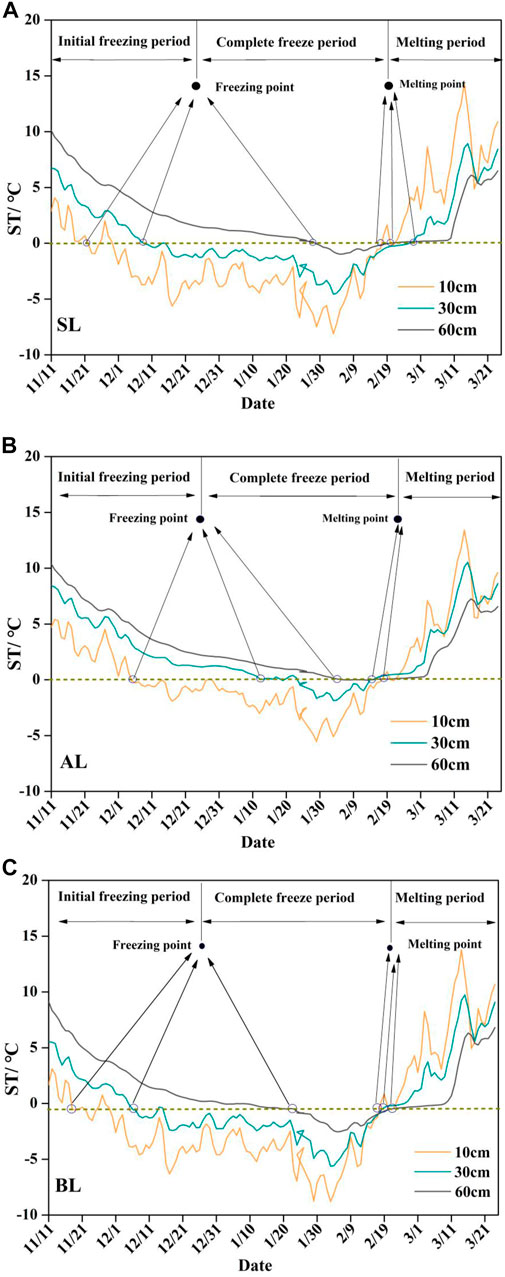
FIGURE 3. ST dynamics of different land types (A,B,C).
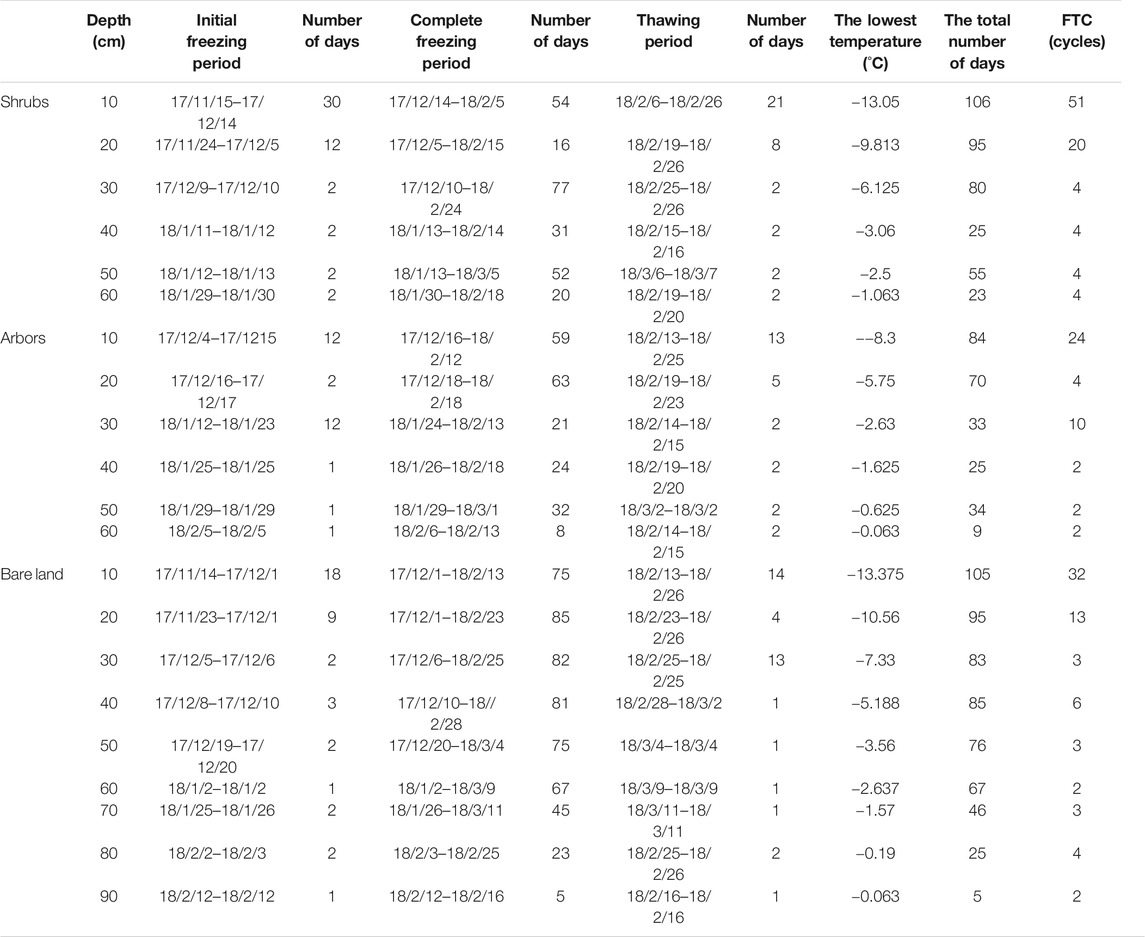
TABLE 1. Freeze-thaw characteristics of different land types.
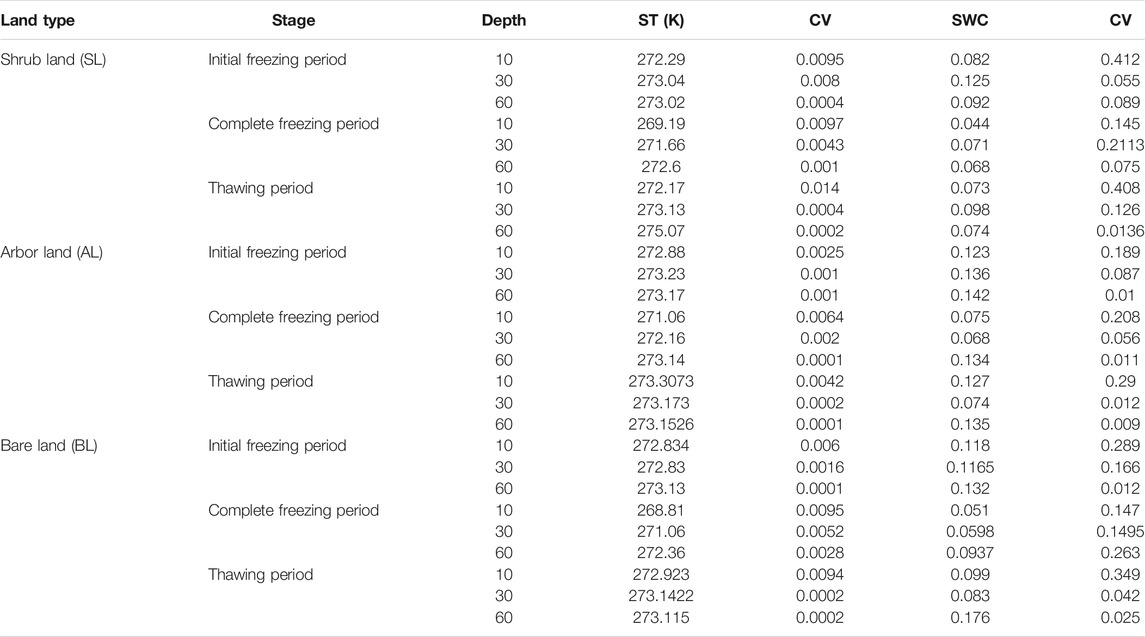
TABLE 2. Changes in ST and SWC at each stage of the monitoring period.
CV was used to describe the degree of ST change. The CV value of ST in AL at the same soil depth was the lowest. Temperature variations in AL soil layers were similar. CV value decreased with increase in depth of the soil layers, and the fluctuating trend gradually plateaued (Table 2; Figure 3). The enclosed area formed by the intersection of the ST curve and the 0°C line was used as an evaluation criterion for the degree of soil freezing. The degree of soil freezing in BL was the highest, followed by SL, and the lowest degree of freezing was observed in AL (Figure 3).
The soil freezing front moved downwards from the surface layer, in turn, resulting in a unidirectional soil freezing phenomenon. However, thawing of soil was two-way; that is, the top and deepest soil layers began to thaw first and they thawed in turn to the middle soil layers (Figure 2; Table 1). The thawing rate was similar to the freezing rate, and the thawing time of soil layers below 30 cm was 1–2 days. SL exhibited the lowest melting rate in soil layers with a surface depth of 10–20 cm, followed by BL, and AL, which exhibited the highest melting rate.
The maximum number of freeze-thaw days and the maximum number of freeze-thaw cycles were observed at a depth of 10 cm below the soil surface. The total number of freeze-thaw days observed in SL, BL, and AL were 105, 105, and 84 days, respectively, while the total number of freeze–thaw cycles observed in SL, BL, and AL were 51, 32, and 24 cycles, respectively.
Statistical analyses were performed using SWC data for two vegetation types and BL throughout the monitoring period. The analyses results revealed that the average SWCs of the initial freeze-thaw period, the complete freezing period, and the thawing period in AL were significantly higher than those observed in SL and BL. The CV values of ST in AL were the lowest at various freeze-thaw stages and soil depths (Table 2; Figure 4). To comprehensively understand the variations in soil moisture migration at different stages during the monitoring period, SWCs at depths of 0–10 cm, 10–30 cm, and 30–60 cm were divided into initial water content (pre-freezing period), freezing period water content (freezing period), melting period water content (melting period), and final water content (average SWC seven days after the melting period). We observed that soil moisture content varied considerably at various soil depths and stages of the freezing period (Figure 5).
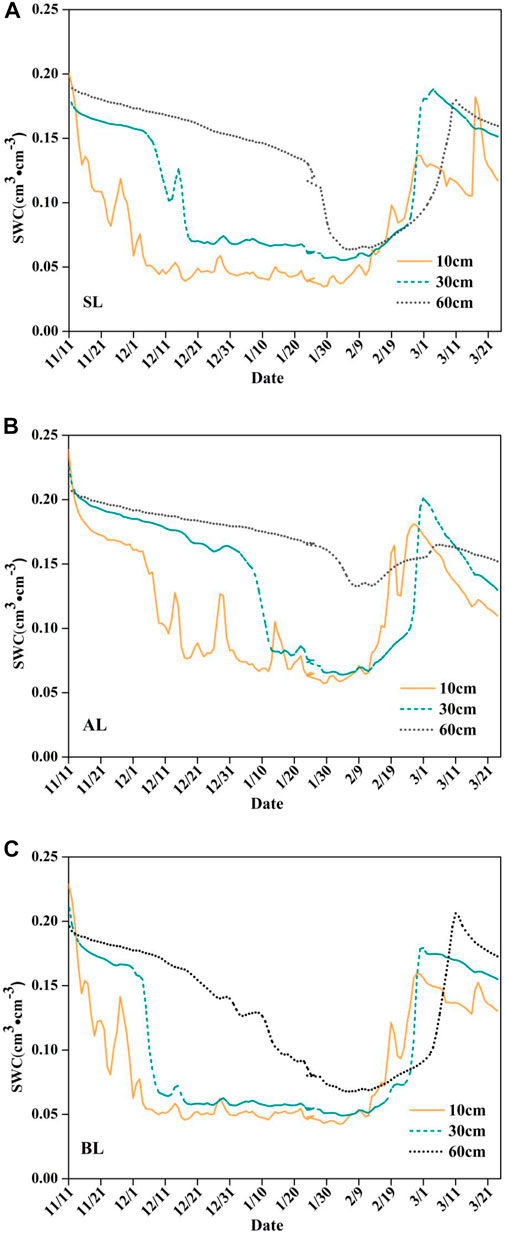
FIGURE 4. SWC dynamics of different land types (A,B,C).
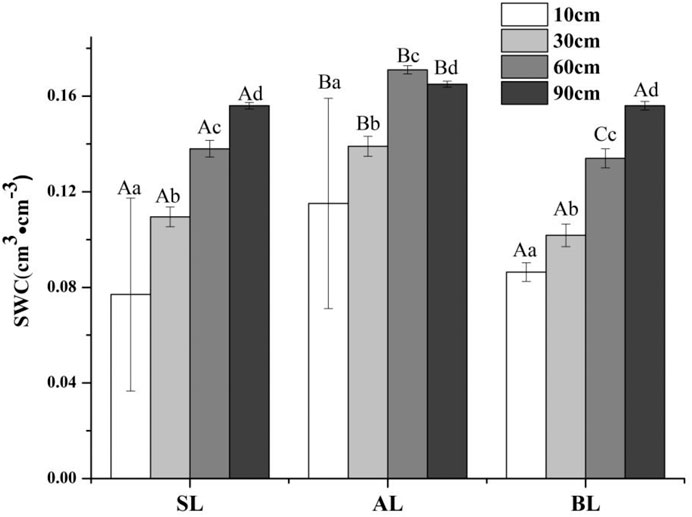
FIGURE 5. Average soil water content of different vegetation types and depths during the monitoring period.
SWC in SL at soil depths of 0–10 cm, 10–30 cm, and 30–60 cm decreased by 46.5, 43.4, and 25.6%, respectively. SWC in AL at soil depths of 0–10 cm, 10–30 cm, and 30–60 cm decreased by 39, 49, and 5.3% respectively, and SWC in BL decreased by 56.7, 48.6, and 28.8%, respectively. Overall, BL exhibited the highest decrease rates in SWC in each soil layer, followed by SL and AL, which exhibited the lowest decrease (Figure 6; Table 2). In addition, SWC from complete freezing to the end of thawing periods in SL exhibited the highest increase, followed by BL, and AL, which had the lowest SWC (Figure 6; Table 2).
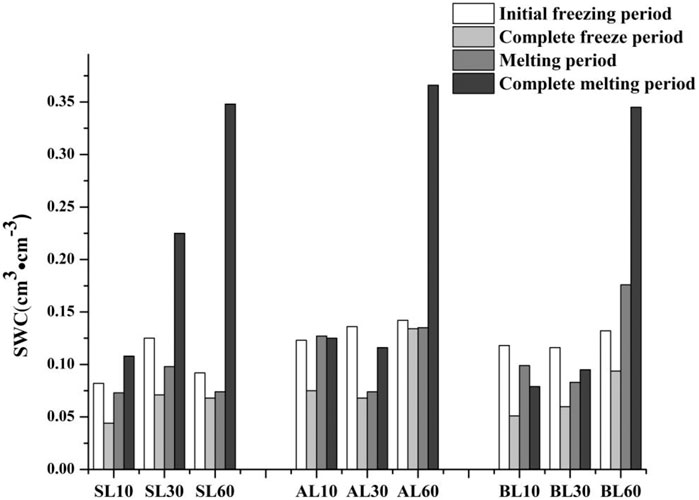
FIGURE 6. SWC changes in different freezing stage.
The difference between the initial water content and the final water content was regarded as the amount of soil water migration at each soil depth during the freezing period. The SWCs in SL at a depth of 0–10 cm increased from 0.082 to 0.12 cm3 cm−3 (an increase of 46.3%), increased from 0.125 to 0.223 cm3 cm−3 (an increase of 78.4%) at a depth of 10–30 cm, and increased from 0.092 to 0.348 cm3 cm−3 (an increase of 205%) at a depth of 30–60 cm. The SWCs in AL in the 0–10 cm soil layer increased from 0.123 to 0.126 cm3 cm−3 (an increase of 2.4%), decreased from 0.136 to 0.119 cm3 cm−3 (a decrease of 12.5%) at a depth of 10–30 cm, and increased from 0.142 to 0.358 cm3 cm−3 (an increase of 152%) at a depth of 30–60 cm. The SWCs in BL in the 0–10 cm soil layer decreased from 0.118 to 0.074 cm3 cm−3 (a decrease of 37%), decreased from 0.117 to 0.095 cm3 cm−3 (a decrease of 19%) at a depth of 10–30 cm, and increased from 0.132 to 0.325 cm3 cm−3 (an increase of 146%) at a depth of 30–60 cm. The maximum SWCs in AL and BL were observed at a depth of 30–60 cm, while SWC in SL increased at depths of 0–10 cm, 10–30 cm, and 30–60 cm (Figure 6).
Regression analyses results of ST and soil moisture in SL, AL, and BL revealed that the relationship between ST and soil moisture was linear. Based on soil depths of 0–10 cm, 10–30 cm, and 30–60 cm, SL R2 values were 0.65, 0.68, and 0.60, respectively; AL R2 values were 0.40, 0.44, and 0.45, respectively, and BL R2 values were 0.66, 0.70, and 0.69, respectively (Table 3). BL exhibited the highest R2 values at each soil depth, followed by SL and AL, which exhibited the lowest R2 values.
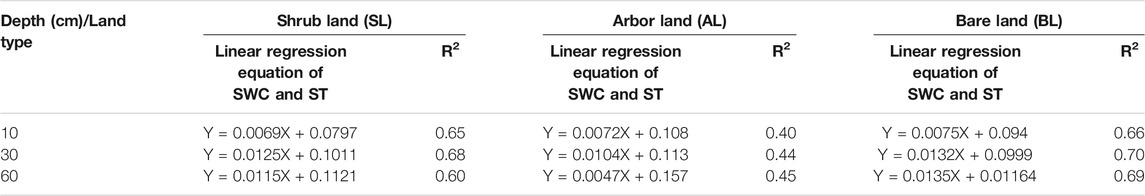
TABLE 3. Linear regression of soil moisture and temperature.
The parameter “a” in the linear relationship equation, Y = aX + b was defined as the transfer efficiency between ST and SWC. Based on the equation, parameter “a” of BL was the highest and the value of “a” in AL was the lowest (Table 3).
Seasonal soil freezing and thawing is not only influenced by climate, topography, soil texture and hydrology but also ground vegetation. Significant differences were observed in soil freezing and thawing processes and hydrothermal characteristics with regard to initial freezing time, freezing depth, ST and soil moisture content, and soil moisture migration due to the influence of vegetation types.
The freezing depth of BL soil was 30% greater those of SL and AL, while BL had the lowest ST. The degree of soil freezing in BL was significantly higher than those of AL and SL, which suggested that vegetation exerted a positive effect on soil resistance to freezing and thawing in winter. The ST of AL was greater than that of BL, and the freezing and thawing days were 22 days less than that of SL; the freezing time was delayed by 20 days when compared to BL and the maximum number of freeze-thaw cycles was 27-fold less than that of BL. In addition, the CV value of ST in AL was lower than that of SL during the entire monitoring period. Therefore, the degree of soil freezing in AL was significantly lower than that of SL, which suggested that AL exhibited superior freezing resistance capacity to SL, and the observation is consistent with the findings of Dulamsuren and Hauck. (2010). During seasonal freezing and thawing processes, AL soil maintains a higher temperature under similar conditions. The observation could be explained by the low shrub canopy, which considerably intercepts radiation from the Sun on the ground, in turn, decreasing ST. In addition, arbor forests can promote the growth of bryophytes, reduce wind speeds, and accumulate thick humus layers (Giraldo et al., 2009), which can enhance the maintenance of high STs in AL during winter. Numerous studies have revealed that the influence of vegetation on the thermal state of frozen soils is manifested in several ways. First, through shading in which the vegetation canopy reflects and absorbs most of the downward solar radiation, in turn, reducing its impact on the soil surface (Shur and Jorgenson, 2007; Chasmer et al., 2011). Second, the canopy structure and its physiological functions alter the meteorological conditions of the vegetation, which, in turn, influences heat and moisture exchange between the atmosphere and the soil. Finally, the vegetation canopy can also influence ST by intercepting snow and reducing wind speeds (Chang et al., 2014). Therefore, freezing and thawing processes can vary due to different vegetation types when other factors remain constant. Similarly, SWC was also a factor that should be taken into consideration. Studies have revealed that SWC has a significant impact on freezing and thawing processes (Cheng et al., 2018). The SWC in AL was significantly higher than that in SL and BL. The higher the SWC, the greater the specific heat capacity of the soil. When temperature increases or decreases, the amount of heat that is required to be absorbed and released is greater than that of soil with low water content (Wang et al., 2012), which also explains why the CV value of ST in AL during the entire monitoring period was relatively low.
Although the degree of soil freezing in BL was greater than that in SL, the numbers of freeze-thaw cycles in SL and BL soils were 51 and 32 cycles, respectively. The number of freeze-thaw cycles observed in SL was significantly greater than that in BL, which could be attributed to the variations in snow cover thickness. Several researchers have investigated the influence of snow cover on ST variations and established that snow as an insulator exerts a certain thermal insulation effect on the surface soils (Fu et al., 2018; Wang et al., 2020). The increase in snow cover thickness can reduce the freezing degree of the top soil (Hu et al., 2013). The shrub canopy partially intercepted snow; therefore, the thick bottom layer of snow on the SL surface was less than that on BL surface. The minimum frozen ST in the 0–10 cm soil layer of SL was lower than that in the 0–10 cm soil layer of BL (Table 1). The results indirectly demonstrate that increasing the depth of snow cover can reduce the freezing degree of surface soil.
Variations in soil water potential caused by soil freezing drive soil moisture from unfrozen areas to the freezing front (Li et al., 2012). ST is a key driving factor in the movement of soil water, causing water to move upwards from deep soil layers (Chen et al., 2013). We conducted regression analyses to determine the relationship between ST and soil moisture in SL, AL, and BL, and established that the relationship between ST and soil moisture was linear. R2 values at various soil depths varied in different soil types, and the values were influenced by the degree of soil freezing at corresponding depths. The degree of soil freezing at each depth in BL was the highest, with the highest R2 value, followed by SL. The degree of soil freezing in each soil layer in AL was the lowest and the R2 value was the lowest. Conversely, poor frost resistance or lack of vegetation cover results in an increase in the CV value of ST, which, in turn, increases the driving force of soil water transport and explains why the variations in ST and soil moisture in AL during the entire freezing period were the lowest.
We defined the equation parameter “a” in the linear relationship equation of ST and SWC (Y = aX + b) as the transfer efficiency between moisture and temperature. The value of the equation parameter “a” within the same soil layer in AL was the lowest, while “a” value within the same soil layer in BL was the highest (Table 3), which could be attributed to the variations in thermal conductivity of water at different phases. As a solid, thermal conductivity of ice is greater than that of liquid water. Therefore, the more the water freezes in frozen soil, the greater the thermal conductivity “a”. The finding confirmed that the degree of soil freezing in AL was the lowest during the entire monitoring period, and the amount of soil water transport was the least. The difference between the final and the initial soil moisture contents can be used to estimate the amount of soil water transport. Figure 5 illustrates the SWC variations in different soil layers in the two vegetation types and BL at various stages of the monitoring period. The amount of soil water transport in the 0–10 cm, 10–30 cm, and 30–60 cm soil layers in AL increased by 2.4%, decreased by 12.5%, and increased by 152%, respectively. The amount of soil water transport in the 0–10 cm, 10–30 cm, and 30–60 cm soil layers in BL decreased by 37%, decreased by 19%, and increased by 146%, respectively, while in SL, the amount of soil water transport increased by 46.3, 78.4, and 205%, respectively. Generally, the maximum SWCs in AL and BL were observed at a depth of 60 cm, while SWC in SL increased in the 0–10 cm, 10–30 cm, and 30–60 cm soil layers. The observations could be explained by the following factors. First, the moisture in the soil profile to migrate to the 50–70 cm, since the soil layer of AL and BL thawed at a relatively later date. Second, the capacity of SL to resist freezing was relatively poor and the degree of freezing was more severe than that of AL. The CV value of SL ST was relatively higher, which makes SL to exhibit a greater driving force. Although the degree of soil freezing in BL was more severe, SL had a high number of root channels within the 30–60 cm soil layer when compared with BL, which had no vegetation. Studies have revealed that root systems can form water transport channels between various soil layers, and the rate of water movement through such channels is much faster than the flow velocity of liquid or gaseous phases of soil water (Wang et al., 2020). Therefore, SL exhibits optimum conditions for soil moisture migration.
During freezing and thawing, BL soil froze to a depth of 90 cm, which was 30% greater than those of AL and SL. The maximum number of freeze-thaw cycles was observed at a depth of 10 cm in AL, SL, and BL, and the order of the number of freeze-thaw cycles was as follows: SL 51 cycles > BL 32 cycles > AL 24 cycles. The number of freeze-thaw days observed in AL was 84, which was 26% less than those of SL and BL. Average ST was greater in AL than in SL and BL. Overall, AL exhibited superior “insulation” and “buffering” effects. SWC in AL and BL was mainly concentrated near the 60 cm depth, and increased by 152 and 146%, respectively. SWC in SL increased by 46.3, 78.4, and 205% at depths of 0–10 cm, 10–30 cm, and 30–60 cm, respectively. Therefore, SL exhibited superior water transport characteristics. The results of the present study could provide a scientific basis for vegetation restoration in arid and semi-arid areas of the Loess Plateau.
The raw data supporting the conclusions of this article will be made available by the authors, without undue reservation.
LB and LX conceived the main idea of this manuscript. ZL, GX, BM, and PL designed and performed the experiment. LB wrote the manuscript and all authors contributed to improving the manuscript.
This research was supported by the Science and Technology Program of Yulin (Grant No. 2019-144), the Technology Project Funded by Clean Energy and Ecological Water Conservancy Engineering Research Center (QNZX-2019-03),The Science and Technology Project of Department of Transport of Shaanxi Province (Grant No. 2015-11K).
The authors declare that the research was conducted in the absence of any commercial or financial relationships that could be construed as a potential conflict of interest.
We thank the reviewers for their useful comments and suggestions.
AL, arbor land; SL, shrub land; BL, bare land; ST, soil temperature; SWC, soil water content; CV, coefficient of variance; R2, the determination coefficient.
Chang, J., Wang, G.-x., Gao, Y.-h., and Wang, Y.-b. (2014). The Influence of Seasonal Snow on Soil thermal and Water Dynamics under Different Vegetation Covers in a Permafrost Region. J. Mt. Sci. 11 (3), 727–745. doi:10.1007/s11629-013-2893-0
Chasmer, L., Quinton, W., Hopkinson, C., Petrone, R., and Whittington, P. (2011). Vegetation Canopy and Radiation Controls on Permafrost Plateau Evolution within the Discontinuous Permafrost Zone, Northwest Territories, Canada. Permafrost Periglac. Process. 22 (3), 780. doi:10.1002/ppp.724
Chen, D., Szostak, P., Wei, Z., and Xiao, R. (2016). Reduction of Orthophosphates Loss in Agricultural Soil by Nano Calcium Sulfate. Sci. Total Environ. 539, 381–387. doi:10.1016/j.scitotenv.2015.09.028
Chen, S., Ouyang, W., Hao, F., and Zhao, X. (2013). Combined Impacts of Freeze-Thaw Processes on Paddy Land and Dry Land in Northeast China. Sci. Total Environ. 456-457, 24–33. doi:10.1016/j.scitotenv.2013.03.059
Cheng, L.-p., and Liu, W.-z. (2014). Long Term Effects of Farming System on Soil Water Content and Dry Soil Layer in Deep Loess Profile of Loess Tableland in China. J. Integr. Agric. 13 (006), 1382–1392. doi:10.1016/S2095-3119(13)60292-0
Cheng, Y., Li, P., Xu, G., Li, Z., Wang, T., Cheng, S., et al. (2018). The Effect of Soil Water Content and Erodibility on Losses of Available Nitrogen and Phosphorus in Simulated Freeze-Thaw Conditions. Catena 166, 21–33. doi:10.1016/j.catena.2018.03.015
Dulamsuren, C., and Hauck, M. (2008). Spatial and Seasonal Variation of Climate on Steppe Slopes of the Northern Mongolian Mountain Taiga. Grassland ence 54 (4), 217–230. doi:10.1111/j.1744-697X.2008.00128.x
Frost, G. V., Loehman, R. A., Saperstein, L. B., Macander, M. J., Nelson, P. R., Paradis, D. P., et al. (2020). Multi-decadal Patterns of Vegetation Succession after Tundra Fire on the Yukon-Kuskokwim Delta, Alaska. Environ. Res. Lett. 15 (2), 025003. doi:10.1088/1748-9326/ab5f49
Fu, Q., Hou, R., Li, T., Jiang, R., Yan, P., Ma, Z., et al. (2018). Effects of Soil Water and Heat Relationship under Various Snow Cover during Freezing-Thawing Periods in Songnen Plain, China. Sci. Rep. 8 (1), 1325. doi:10.1038/s41598-018-19467-y
Giraldo, M. A., Madden, M., and Bosch, D. (2009). Land Use/land Cover and Soil Type Covariation in a Heterogeneous Landscape for Soil Moisture Studies Using point Data. GIScience & Remote Sensing 46 (1), 77–100. doi:10.2747/1548-1603.46.1.77
Guo, C. X., Zhang, W. J., Jiang, L. K., Wu, Y. P., Jiang, Y. L., and Zhou, Y. (2020). Thermal Stability Evaluation Method Based on Pile's Bearing Capacity in a Permafrost Region. IOP Conf. Ser. Earth Environ. Sci. 570 (2), 022001. doi:10.1088/1755-1315/570/2/022001
Guo, D., Yang, M., and Wang, H. (2011). Sensible and Latent Heat Flux Response to Diurnal Variation in Soil Surface Temperature and Moisture under Different Freeze/thaw Soil Conditions in the Seasonal Frozen Soil Region of the central Tibetan Plateau. Environ. Earth Sci. 63 (1), 97–107. doi:10.1007/s12665-010-0672-6
Guo, W., Liu, H., Anenkhonov, O. A., Shangguan, H., Sandanov, D. V., Korolyuk, A. Y., et al. (2018). Vegetation Can Strongly Regulate Permafrost Degradation at its Southern Edge through Changing Surface Freeze-Thaw Processes. Agric. For. Meteorology 252, 10–17. doi:10.1016/j.agrformet.2018.01.010
Hu, G., Liu, H., Anenkhonov, O. A., Korolyuk, A. Y., Sandanov, D. V., and Guo, D. (2013). Forest Buffers Soil Temperature and Postpones Soil Thaw as Indicated by a Three-Year Large-Scale Soil Temperature Monitoring in the forest-steppe Ecotone in Inner Asia. Glob. Planet. Change 104, 1–6. doi:10.1016/j.gloplacha.2013.02.002
Huang, Y., Chen, L., Fu, B., Huang, Z., Gong, J., and Lu, X. (2012). Effect of Land Use and Topography on Spatial Variability of Soil Moisture in a Gully Catchment of the Loess Plateau, China. Ecohydrol. 5, 826–833. doi:10.1002/eco.273
Kruk, J., Steelman, C., and Endres, A. L. (2012). Dispersion Inversion of GPR Data Recorded across Freezing and Thawing Induced Waveguides. Oceania 82 (1), 125–126. doi:10.1016/j.jappmathmech.2010.03.004
Lai, J., Wang, X., Qiu, J., Zhang, G., Chen, J., Xie, Y., et al. (2018). A State-Of-The-Art Review of Sustainable Energy Based Freeze Proof Technology for Cold-Region Tunnels in China. Renew. Sust. Energ. Rev. 82 (3), 3554–3569. doi:10.1016/j.rser.2017.10.104
Li, R., Shi, H., Flerchinger, G. N., Zou, C., and Li, Z. (2013). Modeling the Effect of Antecedent Soil Water Storage on Water and Heat Status in Seasonally Freezing and Thawing Agricultural Soils. Geoderma 206, 70–74. doi:10.1016/j.geoderma.2013.04.021
Li, X., Jin, R., Pan, X., Zhang, T., and Guo, J. (2012). Changes in the Near-Surface Soil Freeze-Thaw Cycle on the Qinghai-Tibetan Plateau. Int. J. Appl. Earth Observation Geoinformation 17 (1), 33–42. doi:10.1016/j.jag.2011.12.002
Liu, T., Xu, X., and Yang, J. (2017). Experimental Study on the Effect of Freezing-Thawing Cycles on Wind Erosion of Black Soil in Northeast China. Cold Regions Sci. Tech. 136, 1–8. doi:10.1016/j.coldregions.2017.01.002
Liu, Y., Fu, B., Lü, Y., Wang, Z., and Gao, G. (2012). Hydrological Responses and Soil Erosion Potential of Abandoned Cropland in the Loess Plateau, China. Geomorphology 138 (1), 404–414. doi:10.1016/j.geomorph.2011.10.009
Lu, J., Wang, T. H., Cheng, W. C., Yang, T., and Luo, Y. (2019). Permeability Anisotropy of Loess under the Influence of Dry Density and Freeze-Thaw Cycles. Int. J. Geomechanics 19 (9), 04019103. doi:10.1061/(ASCE)GM.1943-5622.0001485
Mohammed, G. A., Hayashi, M., Farrow, C. R., and Takano, Y. (2013). Improved Characterization of Frozen Soil Processes in the Versatile Soil Moisture Budget Model. Can. J. Soil Sci. 93 (4), 511–531. doi:10.4141/CJSS2012-005
Nagare, R. M., Schincariol, R. A., Quinton, W. L., and Hayashi, M. (2011). Effects of Freezing on Soil Temperature, Freezing Front Propagation and Moisture Redistribution in Peat: Laboratory Investigations. Hydrol. Earth Syst. Sci. 16 (8), 501–515. doi:10.5194/hess-16-501-2012
Pan, Y.-X., Wang, X.-P., Zhang, Y.-F., and Hu, R. (2015). Spatio-temporal Variability of Root Zone Soil Moisture in Artificially Revegetated and Natural Ecosystems at an Arid Desert Area, NW China. Ecol. Eng. 79, 100–112. doi:10.1016/j.ecoleng.2015.04.019
Shur, Y. L., and Jorgenson, M. T. (2007). Patterns of Permafrost Formation and Degradation in Relation to Climate and Ecosystems. Permafrost Periglac. Process. 18 (1), 7–19. doi:10.1002/ppp.582
Sun, F., Lü, Y., Wang, J., Hu, J., and Fu, B. (2015). Soil Moisture Dynamics of Typical Ecosystems in Response to Precipitation: a Monitoring-Based Analysis of Hydrological Service in the Qilian Mountains. Catena 129, 63–75. doi:10.1016/j.catena.2015.03.001
Sun, S. M., Dai, C. L., Liao, H. C., and Xiao, D. F. (2011). A Conceptual Model of Soil Moisture Movement in Seasonal Frozen Unsaturated Zone. Amm 90-93, 2612–2618. doi:10.4028/www.scientific.net/10.4028/www.scientific.net/amm.90-93.2612
Wang, G. X., Liu, G. S., Li, C. J., and Yang, Y. (2012). The Variability of Soil thermal and Hydrological Dynamics with Vegetation Cover in a Permafrost Region. Agric. For. Meteorology 162-163, 44–57. doi:10.1016/j.agrformet.2012.04.006
Wang, J., Zhao, W., Zhang, X., Liu, Y., Wang, S., and Liu, Y. (2019a). Effects of Reforestation on Plant Species Diversity on the Loess Plateau of China: a Case Study in Danangou Catchment. Sci. Total Environ. 651, 979–989. doi:10.1016/j.scitotenv.2018.09.266
Wang, Q., Yang, Q., Guo, H., Xiao, X., Jin, H., Li, L., et al. (2018a). Hydrothermal Variations in Soils Resulting from the Freezing and Thawing Processes in the Active Layer of an alpine Grassland in the Qilian Mountains, Northeastern Tibetan Plateau. Theor. Appl. Climatol 136, 929–941. doi:10.1007/s00704-018-2529-y
Wang, R., Dong, Z.-b., and Zhou, Z.-c. (2019c). Changes in the Depths of Seasonal Freezing and Thawing and Their Effects on Vegetation in the Three-River Headwater Region of the Tibetan Plateau. J. Mt. Sci. 16 (12), 2810–2827. doi:10.1007/s11629-019-5450-7
Wang, T., Li, P., Li, Z., Hou, J., Xiao, L., Ren, Z., et al. (2019b). The Effects of Freeze-Thaw Process on Soil Water Migration in Dam and Slope farmland on the Loess Plateau, China. Sci. Total Environ. 666, 721–730. doi:10.1016/j.scitotenv.2019.02.284
Wang, X., Wang, C., Wang, X., and Huo, Z. (2020). Response of Soil Compaction to the Seasonal Freezing-Thawing Process and the Key Controlling Factors. Catena 184, 104247. doi:10.1016/j.catena.2019.104247
Wang, Y., Yang, J., Chen, Y., Wang, A., and De Maeyer, P. (2018b). The Spatiotemporal Response of Soil Moisture to Precipitation and Temperature Changes in an Arid Region, China. Remote Sensing 10 (3), 468. doi:10.3390/rs10030468
Wu, D., Zhou, X., and Jiang, X. (2017). Water and Salt Migration with Phase Change in saline Soil during Freezing and Thawing Processes. Groundwater 56 (5), 742–752. doi:10.1111/gwat.12605
Xiao, L., Yao, K., Li, P., Liu, Y., and Zhang, Y. (2020). Effects of Freeze-Thaw Cycles and Initial Soil Moisture Content on Soil Aggregate Stability in Natural Grassland and Chinese pine forest on the Loess Plateau of China. J. Soils Sediments 20 (3), 1222–1230. doi:10.1007/s11368-019-02526-w
Xiao, L., Zhang, Y., Li, P., Xu, G., Shi, P., and Zhang, Y. (2019). Effects of Freeze-Thaw Cycles on Aggregate-Associated Organic Carbon and Glomalin-Related Soil Protein in Natural-Succession Grassland and Chinese pine forest on the Loess Plateau. Geoderma 334, 1–8. doi:10.1016/j.geoderma.2018.07.043
Yang, K., and Wang, C. (2019). Seasonal Persistence of Soil Moisture Anomalies Related to Freeze-Thaw over the Tibetan Plateau and Prediction Signal of Summer Precipitation in Eastern China. Clim. Dyn. 53, 2411–2424. doi:10.1007/s00382-019-04867-1
Yang, L., Wei, W., Chen, L., and Mo, B. (2012). Response of Deep Soil Moisture to Land Use and Afforestation in the Semi-arid Loess Plateau, China. J. Hydrol. 475, 111–122. doi:10.1016/j.jhydrol.2012.09.041
Yu, Y., Zhao, W., Martinez-Murillo, J. F., and Pereira, P. (2020). Loess Plateau: from Degradation to Restoration. Sci. Total Environ. 738 (2020), 140206. doi:10.1016/j.scitotenv.2020.140206
Zhang, L., Ma, W., Yang, C., and Yuan, C. (2014). Investigation of the Pore Water Pressures of Coarse-Grained sandy Soil during Open-System Step-Freezing and Thawing Tests. Eng. Geology. 181, 233–248. doi:10.1016/j.enggeo.2014.07.020
Zhang, M., Wang, J., and Lai, Y. (2019a). Hydro-thermal Boundary Conditions at Different Underlying Surfaces in a Permafrost Region of the Qinghai-Tibet Plateau. Sci. Total Environ. 670, 1190–1203. doi:10.1016/j.scitotenv.2019.03.090
Zhang, Y., Li, P., Liu, X., Xiao, L., Shi, P., and Zhao, B. (2019b). Effects of farmland Conversion on the Stoichiometry of Carbon, Nitrogen, and Phosphorus in Soil Aggregates on the Loess Plateau of China. Geoderma 351, 188–196. doi:10.1016/j.geoderma.2019.05.037
Keywords: soil temperature, soil water content, soil hydrothermal transport, natural freeze-thaw cycle, soil heat transfer
Citation: Bo L, Li Z, Li P, Xu G, Xiao L and Ma B (2021) Soil Freeze-Thaw and Water Transport Characteristics Under Different Vegetation Types in Seasonal Freeze-Thaw Areas of the Loess Plateau. Front. Earth Sci. 9:704901. doi: 10.3389/feart.2021.704901
Received: 12 May 2021; Accepted: 24 June 2021;
Published: 14 July 2021.
Edited by:
Yang Yu, Beijing Forestry University, ChinaReviewed by:
Ali Keshavarzi, University of Tehran, IranCopyright © 2021 Bo, Li, Li, Xu, Xiao and Ma. This is an open-access article distributed under the terms of the Creative Commons Attribution License (CC BY). The use, distribution or reproduction in other forums is permitted, provided the original author(s) and the copyright owner(s) are credited and that the original publication in this journal is cited, in accordance with accepted academic practice. No use, distribution or reproduction is permitted which does not comply with these terms.
*Correspondence: Zhanbin Li, emJsaUBtcy5pc3djLmFjLmNu
Disclaimer: All claims expressed in this article are solely those of the authors and do not necessarily represent those of their affiliated organizations, or those of the publisher, the editors and the reviewers. Any product that may be evaluated in this article or claim that may be made by its manufacturer is not guaranteed or endorsed by the publisher.
Research integrity at Frontiers
Learn more about the work of our research integrity team to safeguard the quality of each article we publish.