 Rilee E. Thomas1*
 Marianne Negrini1
 David J. Prior1
 Robert Mulvaney2
 Holly Still3
 M. Hamish Bowman1
 Lisa Craw4
 Sheng Fan1
 Bryn Hubbard5
 Christina Hulbe3
 Daeyeong Kim6
 Franz Lutz7
- 1Department of Geology, University of Otago, Dunedin, New Zealand
- 2British Antarctic Survey, Natural Environment Research Council, Cambridge, United Kingdom
- 3School of Surveying, University of Otago, Dunedin, New Zealand
- 4Institute for Marine and Antarctic Sciences, University of Tasmania, Hobart, TAS, Australia
- 5Department of Geography and Earth Sciences, Aberystwyth University, Aberystwyth, United Kingdom
- 6Division of Polar Earth System Sciences, Korea Polar Research Institute, Incheon, South Korea
- 7School of Environment, University of Auckland, Auckland, New Zealand
A 58 m long azimuthally oriented ice core has been collected from the floating lateral sinistral shear margin of the lower Priestley Glacier, Terra Nova Bay, Antarctica. The crystallographic preferred orientations (CPO) and microstructures are described in order to correlate the geometry of anisotropy with constrained large-scale kinematics. Cryogenic Electron Backscatter Diffraction analysis shows a very strong fabric (c-axis primary eigenvalue ∼0.9) with c-axes aligned horizontally sub-perpendicular to flow, rotating nearly 40° clockwise (looking down) to the pole to shear throughout the core. The c-axis maximum is sub-perpendicular to vertical layers, with the pole to layering always clockwise of the c-axes. Priestley ice microstructures are defined by largely sub-polygonal grains and constant mean grain sizes with depth. Grain long axis shape preferred orientations (SPO) are almost always 1–20° clockwise of the c-axis maximum. A minor proportion of “oddly” oriented grains that are distinct from the main c-axis maximum, are present in some samples. These have horizontal c-axes rotated clockwise from the primary c-axis maximum and may define a weaker secondary maximum up to 30° clockwise of the primary maximum. Intragranular misorientations are measured along the core, and although the statistics are weak, this could suggest recrystallization by subgrain rotation to occur. These microstructures suggest subgrain rotation (SGR) and recrystallization by grain boundary migration recrystallization (GBM) are active in the Priestley Glacier shear margin. Vorticity analysis based on intragranular distortion indicates a vertical axis of rotation in the shear margin. The variability in c-axis maximum orientation with depth indicates the structural heterogeneity of the Priestley Glacier shear margin occurs at the meter to tens of meters scale. We suggest that CPO rotations could relate to rigid rotation of blocks of ice within the glacial shear margin. Rotation either post-dates CPO and SPO development or is occurring faster than CPO evolution can respond to a change in kinematics.
1 Introduction
Ice sheet flow comprises a combination of internal deformation and basal sliding under the influence of external stresses such as gravity and tidal forces (Alley, 1992; Marshall, 2005; Aster and Winberry, 2017). The naturally occurring phase of ice under Earth conditions is ice 1 h (Pauling, 1935; Bamber et al., 2018). Single ice crystals behave anisotropically, deforming by slip on the basal (0001) plane more easily than along any other plane (Duval et al., 1983; Azuma, 1994). As ice flows, a larger scale anisotropy forms in the ice mass as a crystallographic preferred orientation (CPO), often referred to in glaciology as crystal orientation fabric or fabric (Goodman et al., 1981; Alley, 1992; Faria et al., 2014b) and as texture in materials science. The CPO is dependent on active deformation and recrystallization mechanisms, applied stress and temperature, strengthening with increased strain (Montagnat et al., 2014; Qi et al., 2017; Fan et al., 2020). Natural ice undergoing deformation during flow must then experience significant anisotropic development corresponding to deformation-induced microstructural changes, including CPO formation and evolution, grain size changes and a dynamically recrystallized microstructure (Hudleston, 1977; Duval et al., 2010; Montagnat et al., 2012). Mechanical and microstructural changes are likely to result from changes in kinematic regimes during transport from the central ice sheets through streams and glaciers to buttressing ice shelves (Alley, 1992; Hudleston, 2015; Craw et al., 2018).
Currently, the internal deformation component of flow is modeled using flow laws derived from synthetic polycrystalline ice experimentally deformed to relatively low strains (Durham et al., 1983; Glen, 1955; Goldsby and Kohlstedt, 2001; Gillet-Chaulet et al., 2005; Kuiper et al., 2020). This also assumes ice sheets, streams and glaciers are structurally homogeneous and free of impurities, which lead to inconsistencies between models and reality, and thus studies on naturally deformed ice can contribute significantly to our understanding. Direct observations of ice sheet microstructure and CPOs come largely from deep boreholes located at Antarctic and Greenland ice divides and domes (Gow and Williamson, 1976; Lipenkov et al., 1989; Thorsteinsson et al., 1997; Durand et al., 2009; Weikusat et al., 2009; Faria et al., 2014a; Montagnat et al., 2014). As a result, these locations have well constrained deformation kinematics. The kinematics at ice divides and domes cannot be extended across the whole of an ice sheet and it is becoming increasingly clear that there is a need for analysis of ice in more dynamic regions of ice sheets.
The stability of large polar ice sheets is strongly controlled by the flow of ice streams and glaciers (Alley, 1992; Bamber et al., 2000; Bennett, 2003; Rignot et al., 2011). Basal and lateral margins are considered to be critical regions in controlling the dynamics of such outlets (Echelmeyer et al., 1994; Raymond et al., 2001; Hruby et al., 2020). Flow velocity and mass transport is controlled by resistive drag at the margins, which deform intensely under a shear dominated kinematic regime (Raymond et al., 2001; Schoof, 2004). Ice in these areas is under comparatively high shear stress and becomes highly strain softened (Echelmeyer et al., 1994; Jackson and Kamb, 1997). As a result, there is growing interest in studying marginal regions to better predict how large ice sheets will respond to a warming climate.
Experiments on pure, polycrystalline ice deformed under shear illustrate the ideal CPOs and microstructures expected for ice flowing at glacier margins (Kamb, 1972a; Bouchez and Duval, 1982; Li et al., 2000; Journaux et al., 2019; Qi et al., 2019). In reality, shear margin fabric development is affected by temperature, impurity content and the presence of structural heterogeneities, which can vary spatially and with depth (Lawson et al., 1994; Harrison et al., 1998; Barnes and Wolff, 2004; Pettit et al., 2014). To date, few studies have directly observed CPOs from temperate or polar glacier and ice stream margins (Hudleston, 1977; Jackson and Kamb, 1997; Samyn et al., 2008; Gerbi et al., 2021; Monz et al., 2021); Sample collection in these areas is generally hindered by safety or logistical problems. Of these studies, even fewer describe CPOs fully oriented in a kinematic reference frame (Hudleston, 1977; Monz et al., 2021; Hellman et al., 2021). Interpreting geophysical and radio-echo sounding data to predict large scale CPOs within large polar ice streams (Bentley, 1972; Kohnen and Gow, 1979; Horgan et al., 2011; Harland et al., 2013; Smith et al., 2017; Jordan et al., 2020; Lutz et al., 2020; Hellmann et al., 2021b) requires an understanding of the structure and dynamics of shear margins, currently lacking due to this disparity in sample collection.
This study uses cryogenic Electron Backscatter Diffraction (cryo-EBSD) techniques to describe the microstructure and CPO of an azimuthally oriented near surface ice core collected from the floating lateral margin of the fast-shearing Priestley Glacier, Terra Nova Bay, Antarctica. To our knowledge, this core is the first from the margin of a polar outlet glacier which was collected with care to retain its azimuthal orientation. The results of this paper will be used to verify future geophysical and radar data collected from the same field site, in an attempt to better understand the large-scale dynamics of glacial lateral shear margins.
2 Field Site
The Priestley Glacier (Figure 1A) is a 96 km long, 7–9 km wide glacier that flows from Victoria Land Plateau into the Nansen Ice Shelf, Terra Nova Bay (Deponti et al., 2006). The drilling site (Figure 1B) is located on the eastern margin of the glacier, in an area with minor summer snow cover adjacent to Black Ridge, south of the glacier’s grounding line (Frezzotti et al., 1998). High-precision Global Navigation Satellite System (GNSS) and total station positioning observations from the 2019/2020 field season show the surface ice flows at 90 m/yr at the drilling site (Figure 1B), and this increases to ∼130 m/yr toward the center of the glacier and reduces to 45 m/yr closer to the margin (Frezzotti et al., 2000). The overall strain field in the area (Still et al., this volume) is transtensional (Fossen and Tikoff, 1998), defined by dominant simple shear with a small component of extension sub-normal (±10°) to the flow direction. The kinematics approximate to sinistral simple shear with a vertical shear plane containing the flow direction (Figures 1B, 2A) and shear direction parallel to the flow direction. At the drilling site, the simple shear strain rate (
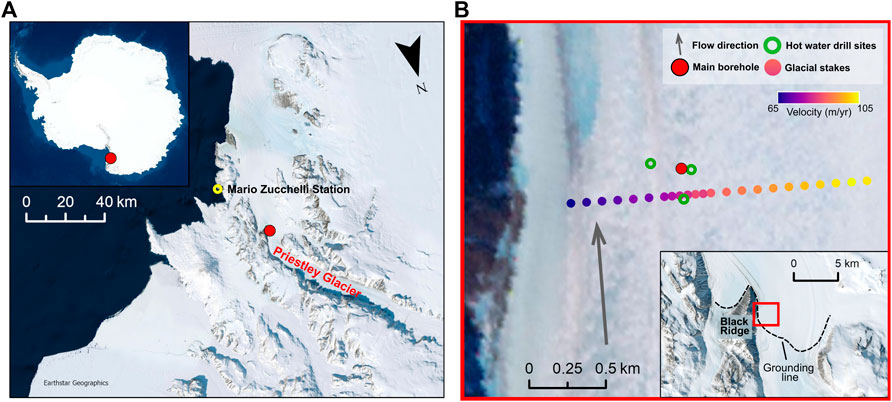
FIGURE 1. Location map of the field site. (A) Priestley Glacier, Terra Nova Bay area. (B) The locations of the main borehole, hot water drill sites signifying the locations of deep (∼40 m) seismic and temperature installations, and glacial stakes defining the surface velocity field. A linear color scale gives surface velocity across these glacial stakes.
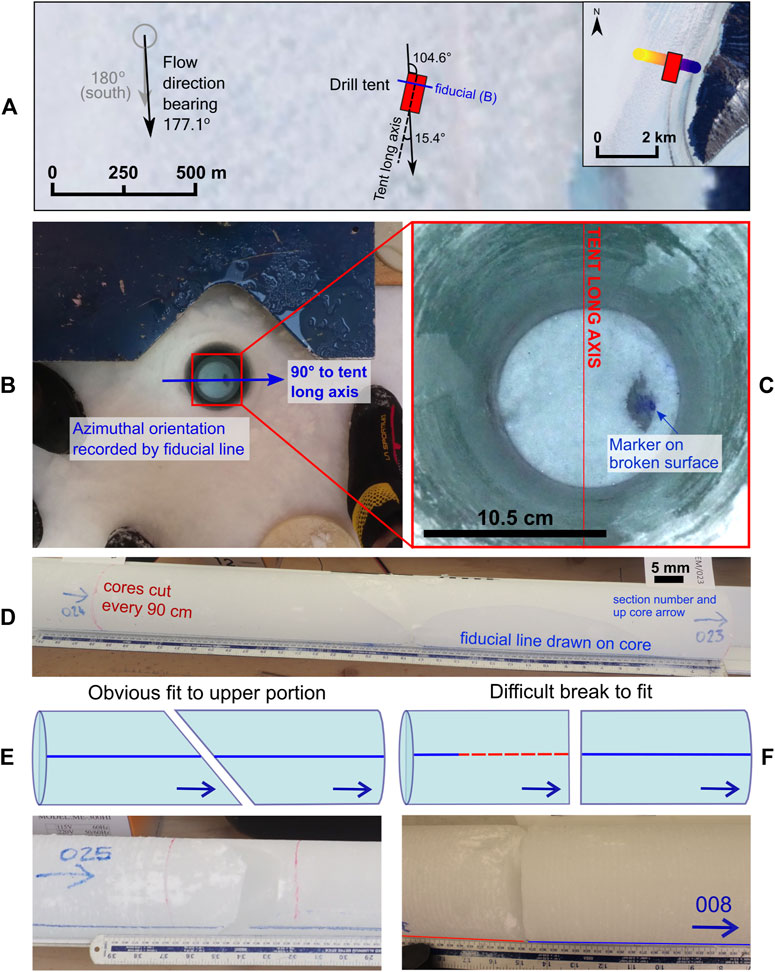
FIGURE 2. Core collection and processing with care to preserve azimuthal orientation. (A) GNSS data gives a flow direction azimuth of 177.1° flowing south. This gives an angle of 15.4° between the coring tent long axis and flow. (B) Initial fiducial mark drawn in top 1–2 m during core extraction. (C) Orientation of the fiducial mark relative to the core tent long axis. (D) Core processing before packaging and storage. Core sections either fit together obviously (E) or with difficulty (F) and are marked with the fiducial line.
3 Methods
3.1 Core Collection
3.1.1 Core Extraction and Storage
Drilling was undertaken using a medium depth (150–200 m) electromechanical drill system (Mulvaney et al., 2002). The core was drilled in increments of a meter or less, after which each increment was measured, photographed and any macroscopic physical features were recorded. Each core was fitted across the core break to the previous increment to maintain their orientation. The core section was then cut by circular saw to be packaged in 90 cm sections. In total, 58.75 m of core sections were extracted before the drill hit glacial debris. The top 2 m of the core was lost in the field. The core sections were either temporarily stored within sealed plastic bags in silos drilled 2 m into the surface ice or stored in wool insulated cardboard boxes for less than 24 h before being transported out of the field to be stored for 32 days in Mario Zucchelli Station external freezer container at −16 to −19°C (Figure 2). These core boxes were shipped back to New Zealand in the container, maintaining a temperature of −20°C over 9 days. A representative set of samples (Box 12) were transferred by plane to Scott Base, and transported back to New Zealand on a separate ship at a lower temperature of −25°C over 12 days. All boxes are stored permanently at −25 to −27°C. Temperature loggers in the core boxes show the highest temperature the ice cores experienced was immediately upon collection (see Supplementary Material).
An azimuthal mark was drawn using a permanent marker on the broken ice surface at the base of the borehole after drilling ∼1 m, to orient the core to the coring tent long axis reference frame (Figures 2A,B). This azimuthal mark was preserved on the top of the next core increment, so a fiducial line corresponding to a known azimuth was drawn along the side of the core after extraction (Figure 2C). Core breaks were generally irregular with minimal material loss, allowing each new core increment to be oriented to the core increment above by fitting the core break back together and resuming the fiducial line across the break (Figure 2D). The azimuthal fiducial line was projected down the core as each new increment was collected until an ambiguous core break was found and the cores could not be confidently joined (Figure 2E). The line orientation was visibly lost due to ambiguous breaks between core sections (Figure 2F) only three times in the upper 33 m, and a further eight times in the following 10 m (Figures 3A-C). A new arbitrary fiducial line was started from each of these breaks. The azimuthal orientation of the arbitrary fiducial lines was reconstructed later using the ice crystallographic preferred orientations as outlined in section 3.3.
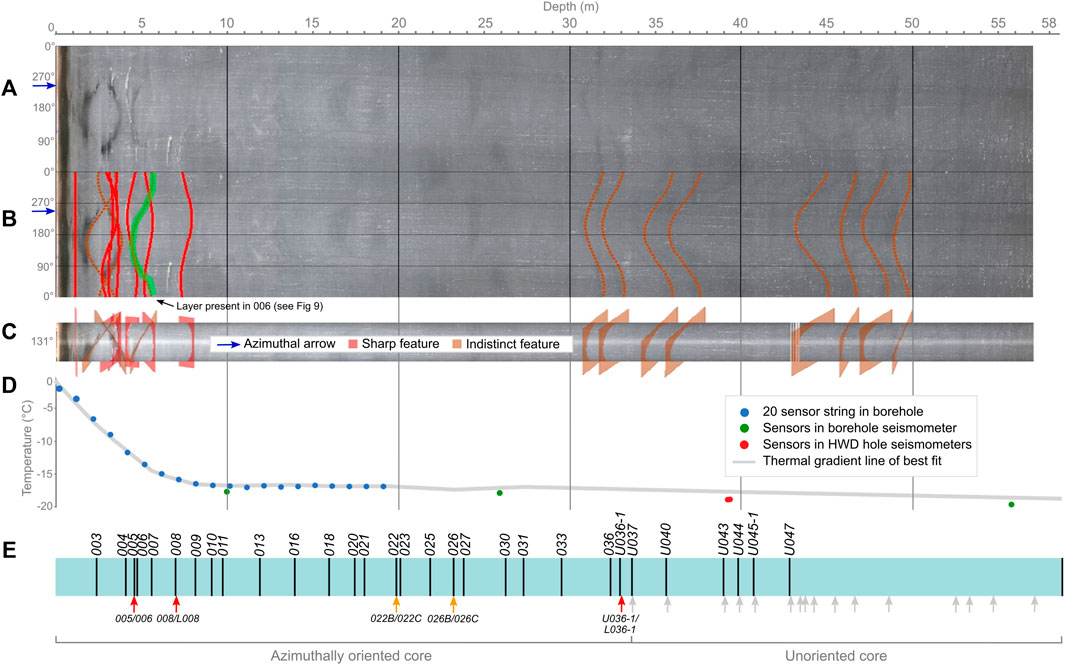
FIGURE 3. Record of the Priestley Glacier ice core and borehole. (A) Borehole televiewer image of the borehole walls with (B) identified features shown as sinusoidal waves. Note that the angles of these features are vertically flattened and not representative of actual dip angles. Blue azimuthal arrow denotes the location of the initial fiducial mark drawn in the borehole at the beginning of core collection. (C) Visualization of layer and fracture planes down the borehole. Oriented to the fiducial line. (D) In situ thermal profile (grey line of best fit) recorded from temperature sensors down the borehole and nearby hot water drilling (HWD) boreholes after core extraction. (E) Sample locations and names. Orientation breaks observed during core collection in the field and fixed using cryo-EBSD analysis are shown with a red arrow. Orientation breaks fixed on the polarized light stage are shown with an orange arrow. All unoriented breaks are shown with a grey arrow. Pairs of samples used to restore orientation breaks down the core are given below their corresponding arrows.
3.1.2 Optical Televiewer Analysis
The borehole was logged by an optical televiewer, a 360° high-resolution camera which continuously images the borehole walls (Hubbard et al., 2008; Hubbard and Malone, 2013). The images are used to constrain the orientation of planar features such as fractures and layers and, where these features are also visible in the core, can be used to constrain the azimuthal orientation of the core. The camera was attached to a 2 m long probe, stabilized at the center of the borehole with leaf springs. The televiewer imaged the borehole to ∼57 m (Figure 3A). Images were obtained moving the camera down and up the borehole twice. There is no notable difference between images taken in either direction. Both logs were oriented to the fiducial line drawn in the top 1 m of the borehole wall. At a logging speed of 1–2 m/min, a vertical resolution of 1 mm was maintained. A horizontal resolution for a borehole width of 143 mm was ∼0.5 mm. The magnetometer that records azimuthal orientation agrees closely with the azimuth of the fiducial line. This provides extra reassurance that the fiducial line, and therefore the core, is correctly oriented in the geographic and kinematic setting.
3.1.3 Temperature Record
After core extraction and televiewer imaging, a series of three seismometers with internal temperature sensors was installed down the borehole at depths of 10, 26 and 56 m. A string of 20 temperature sensors was also installed in 1 m increments down to 19.18 m. Deep sensors were also established in three 39.5–40 m deep hot water drill hole sites, all located within 100 m of the main borehole. The temperature profile of the top ∼60 m of the glacial margin is constructed by compiling measurements collected after more than 200 h deployment of temperature sensors down the boreholes. The line of best fit represents the in situ thermal profile of the glacial margin during summer months (Figure 3D).
3.2 Sample Preparation for Cryo-EBSD and SEM Analysis
Figure 3E illustrates locations of sample collection down the core. Twenty-one samples were chosen; one every 1 m (starting at core section 003, at 2.4 m depth) down to 10 m, then every 2 m down to 33 m. These included samples from either side of the four observed fiducial breaks at 4.75, 7, 19.9 and 23.2 m where orientation was lost (Figures 4A, B). An additional eight pairs of samples were collected between 33 and 43 m and the deepest sample, taken from the very bottom of the core at 58.75 m, are currently unoriented. The cores were cut by band saw into 5 mm slices perpendicular to the core axis in the Physics Antarctic Ice Lab at the University of Otago. Four oriented rectangular pieces approximately 30 mm × 35 mm were cut from each slice (Figure 4C). The samples have grain sizes ∼1 mm, so the rectangular pieces contain ample grains for robust statistical analysis. The cores were then returned to storage and the cut samples were placed in a nitrogen dry shipper at ∼−196°C, and transported to Otago Micro and Nano Imaging, University of Otago for cryo-EBSD analysis.
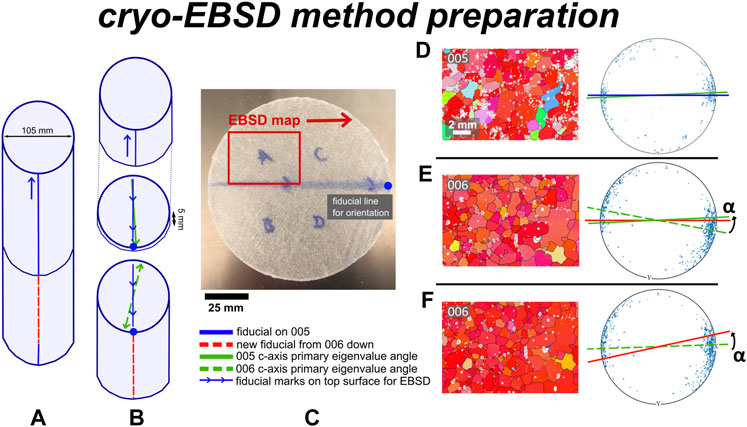
FIGURE 4. A method for reinstating orientation either side of a fiducial line break. (A) A difficult fit is recorded during processing. Core slices are cut either side of the break. (B) The top surfaces of each slice are marked to show the direction of the fiducial line. (C) A small section of the slice is used for cryo-EBSD analysis. (D) The difference between the c-axis alignment relative to the fiducial line reference for the sample above the break and (E) the sample below the break define the rotation angle α. (F) Cryo-EBSD data for the lower sample is rotated by angle α to restore azimuthal orientation.
The process for cryo-EBSD sample preparation and analysis are outlined in Prior et al. (2015). A full cross-sectional orientation map was collected for each sample with a 20 µm step size, and two to four high resolution maps of smaller areas of interest were collected with a 5 µm step size. Whole maps were montaged using AZtec software (from Oxford Instruments, 2021), and data was then exported to software package HKL Channel 5 (from Oxford Instruments, 2021), where small (<4 pixel) errors with 1° misorientations within grains were removed. Data were cleaned using EBSDInterp 1.0 (Pearce, 2015), a MATLAB based program using band contrast to remove wildspikes and reduce noise introduced by non-indexed pixels. To do this, the software assigns non-indexed pixels or wildspikes with an orientation the same as at least 6 (with each pixel being surrounded by eight pixels in total) neighboring pixels. By restricting the software to only allowing a high number of neighbors before assigning an orientation, the production of artefacts in the maps is reduced. The MTEX toolbox for MATLAB (Bachmann et al., 2011) was used to quantify microstructural parameters and perform misorientation analysis.
Whole map secondary electron images were collected during EBSD acquisition in order to analyze bubble characteristics for selected samples. Secondary electrons (SE) are ejected from the sample as the microscope’s electron beam interacts with the surface. The SE are detected and creates an image that highlights the topography of a sample surface. For some images, each bubble was counted and classified as being on a grain boundary or within a grain. The electron images were then run through the ImageJ based processing package Fiji to analyze bubble size and shape statistics. Bubble analysis was done by identifying and tracing bubble outlines directly from the secondary electron image using the automated “Analyze Particles” function. To prevent any cracks or surface impurities in the sample being misidentified as bubbles, only particles with circularities >0.2 (how closely a particle resembles a perfect circle; calculated as
3.3 Reconstructing Orientation
At 4.75 m, an ambiguous break in the core resulted in a potential loss in orientation in the field (Figure 4A). To reconstruct the orientation of the core below this break, two samples; one directly above and one directly below the break were analyzed (samples 005 and 006; Figure 4B). The c-axis orientations were plotted to compare the angles of the c-axis maxima in the sample reference frame (Figures 4D,E). The angle between samples 005 and 006 c-axis maxima is defined as the rotation angle α. Using MTEX, EBSD data were rotated by α to return sample 006 to the correct orientation as defined by sample 005, as we assume that the orientations of the c-axis maxima in both samples are the same across a depth range of 10 mm (Figure 4F). For other breaks at 7 m (between 008 and L008) and 18–20 m (between 021 and 023), the same reconstructive techniques were used. A caveat of this reconstruction method is that α could be any one of two values, 180° apart. For this analysis the smaller α value is taken. Since all samples have CPOs with ∼180° rotational symmetry around the core, this uncertainty is less significant.
Using this methodology of reorientation, we have been able to restore the fiducial line on two locations of the core (breaks at 19.9 and 23.3 m) without the use of cryo-EBSD analysis. These breaks were noted as being potential breaks when collected in the field. Two thin (5 mm) core slices cut perpendicular to the vertical core axis either side of the possible breaks were placed on a light table between two orthogonal polarized sheets at the same orientation (fiducial line E-W oriented). The proportions of grains in extinction were not matching across the break. Both samples were rotated in the same direction until the bulk of grains were under extinction. The angle between the two was found and the lower sample was rotated by that angle to restore orientation. Both sets of samples had fine layering observed in the slices—this strengthens our restoration as the layers could be aligned across both samples after rotation into bulk extinction. This method was also used to show any changes in c-axis orientations down a 2–3 m section of the core between 30 and 32 m depth, by taking samples every ∼20 cm and comparing the bulk extinction angles and layer orientations of consecutive slices.
3.4 Reference Frames
After core orientation, all core sections can be presented in one reference frame, relative to the fiducial line as oriented at the surface. Two reference frames are used to present data in this paper, outlined below and in Figure 5:
1. The “c-axis maxima” reference frame, where all samples are rotated by angle α so that the xC axis for that sample is aligned with the c-axis maximum (Figure 5A). The angle α depends on the sample CPO and varies from 2–58° either clockwise or anticlockwise. This reference frame allows for best comparison of microstructural characteristics. The CPO strength and most microstructural data for each sample can be presented without being azimuthally oriented, e.g., sample 063 is unoriented but its microstructure is analyzed in this reference frame.
2. The kinematic reference frame, where all samples that are already corrected to the surface fiducial are rotated clockwise by a further 15.4° (clockwise) so the flow direction is parallel with the yK axis (Figures 2A, 5B). This reference frame allows us to analyze the CPO of the shallow lateral shear margin and how it changes relative to flow direction. The geographic orientation of the flow direction is 177°. In the context of this site, where the dominant deformation is simple shear on a vertical shear plane with a horizontal direction shear parallel to ice flow, the shear plane is normal to xK.
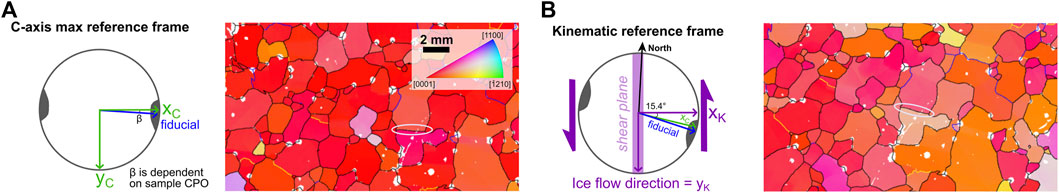
FIGURE 5. The two reference frames used in this paper. (A) The “c-axis maximum” reference frame, where the x axis is aligned with the sample c-axis maximum. (B) The “kinematic” reference frame, where the y axis is aligned with the glacier flow direction, parallel with the shear plane as indicated by the purple arrows. In all figures the pixels are colored with an inverse pole figure scheme (inset in A) that shows which crystal direction lies parallel to the x direction of the reference frame. Red is c-axis (=[0001]) parallel to x, green is a-axis parallel to x. White pixels are not indexed due to limitations of EBSD acquisition. Black lines are grain boundaries. White ellipse shows the same grain boundary segment in both EBSD maps highlighting rotations between the two reference frames.
4 Results
For each of the following sections displaying data from the core (sections 4.2–4.5) we present observations from six representative samples. Summaries of data trends with depth using the full dataset of 29 samples are presented in section 4.6. The full dataset can be found in the Supplementary Material.
4.1 Field Observations and Core Orientation
Vertical layering was observed in the surface blue ice during field reconnaissance in 2019 (Figure 6A). Layers were exposed over several meters, at two localities (Figures 6A,C). The strike of layers at the surface is rotated 30–60° clockwise of the flow direction with some variation (bend of layers visible in Figure 6A). One isoclinal fold with a vertical axial surface sub-parallel to mean layering was observed (Figure 6B). The most visible layers appear less cloudy than surrounding ice, and detailed observations show that these comprise multiple bands of cloudy and clearer ice with thicknesses of a few mm to cm (Figure 6D). Many near vertical fractures seen at the field site cross-cut these layers at a high angle (Figure 6C). Where fractures are ice filled, the ice is bubbly with distinct bubble trails radiating from a plane medial to the fracture (Figure 6E). Photo reconstruction of vertical layers documented during the 2018/2019 field season show the layers strike approximately 38° NE.
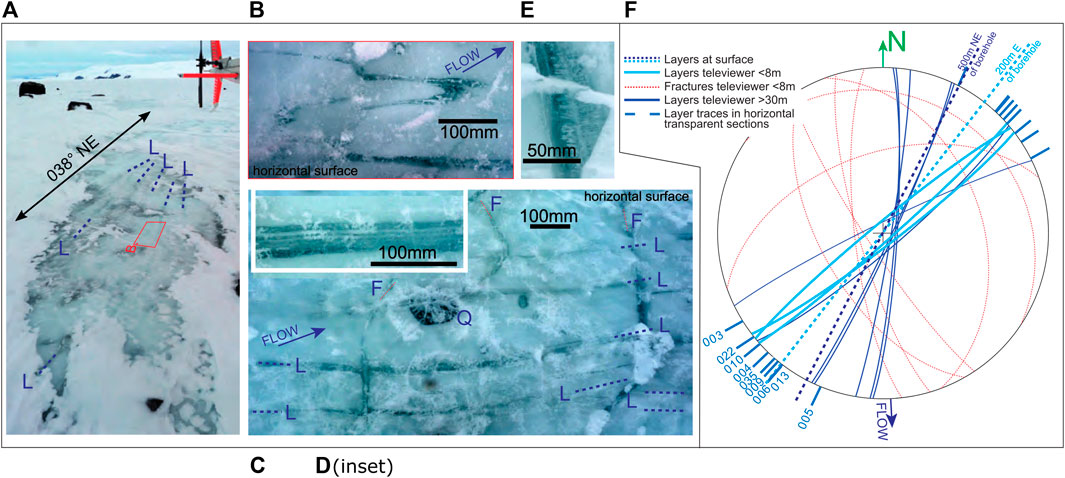
FIGURE 6. Layers and fractures in the Priestley Glacier ice, see Figure 1 for map of borehole location. (A) Sub-vertical (±10° from vertical, or looking down onto the surface) layers (blue dash lines: L) with strikes 20–30° clockwise of flow, exposed over several meters of a horizontal blue ice surface approximately 200 m east of the borehole. (B) Close up of folded layer (red box in a.). (C) Layers (blue dash lines: L) and fractures (Red dash lines: F) photographed in a horizontal blue ice surface approximately 500 m NE of the borehole. There are many finer, less obvious layers sub-parallel to those marked. Layer orientation varies across the picture. At the bottom right a set of finer layers (fine lines) are truncated by coarser layering oriented about 20° clockwise (coarser line). The surface also contains circular frozen melt ponds, or crystal quirks (Q). (D) Close up of layering from just outside of picture (C). In detail layers comprise multiple bands of a few mm to a few tens of mm in thickness. (E) Close up of a fracture (extension out of picture of the right hand fracture in C) showing bubble trails radiating from a medial line. (F) Lower hemisphere, equal-area stereonet with layers and fractures plotted as great circles. Dashed blue great circles show the average layer orientations from sites shown in A and C. Solid blue great circles are distinct planar features identified in the televiewer data: those shallower than 8 m (light blue) correspond to layers identified in core that are very similar to those seen in surface ice. Red-dashed lines are indistinct (or, dark, not clearly defined) planar features that occur only in the upper 8 m and correspond to distinct fractures in the core. Layers identified below 30 m are in dark blue. Traces of layering identified in cross polarized light imaging of ∼5 mm horizontal slices from the core are marked outside the primitive of the stereonet and are labeled by the core number (see Figure 3, Supplementary Table S1 for depths).
Televiewer analysis found seven sharp planar features and three indistinct planar features above 10 m depth, and eight indistinct planar features identified below 31 m, most of which are plotted on a stereonet relative to north and the kinematic reference frame (Figure 6F). All indistinct planes are near vertical, with strikes rotated 10–50° clockwise of the flow direction, at similar orientations to the layers oriented at the surface. The three shallow indistinct features in the televiewer record correspond to steep curviplanar clear ice layers in the core. The deepest of these corresponds to a clear layer seen in core section 006 (Figure 3A). Layers are more difficult to see in the core deeper than ∼8 m. Traces of layers are visible in some thin (∼5 mm) slices of the core. Layer traces observed in horizontal core slices under cross polarized light have similar orientations to the traces that would correspond to layers in the field and indistinct planar features in televiewer analysis. The layers as seen in thin slices are discussed further in section 4.3. Sharp planar features identified in televiewer analysis strike largely NW-SE and have shallower dip angles relative to layers. These sharp features correspond to planar fractures in the core.
Planar features (layers and fractures) can be correlated between the core and the televiewer down to core section 009, at a depth of ∼8 m. The correlation confirms the azimuthal orientations of the shallowest three azimuthal lines and validates restoration across the shallowest two ambiguous core breaks (see section 3.3, Figure 3). At greater depths, features cannot be seen in the core to fully validate azimuthal orientations unless in thin section. The traces of layering from horizontal core sections are, however, consistent with the orientations of indistinct planar features in the televiewer, suggesting that the calculated azimuthal orientation of the core is reasonable at all depths where this has been attempted.
4.2 Crystallographic Preferred Orientations
The CPOs for six representative samples collected at different depths are presented in both the c-axis maximum and kinematic reference frames (Figure 7). References to rotation directions in the following descriptions are looking down for rotations around a vertical axis. All samples have a strong CPO (Figure 7A). Where c-axis clusters are aligned horizontally at a high angle to the ice flow direction (Figure 7D). The c-axis (0001) maxima have orientations clockwise of the pole to shear plane. The c-axis orientation of sample 003 is smeared clockwise from the primary c-axis cluster. The a- <11-20> and m-axis (10-10) orientations define vertical girdles normal to the c-axis cluster. Where there is a preferred orientation of a- and m-axes in the girdle, the axes are vertically aligned and sub-perpendicular (rotated up to 40° clockwise) to the shear direction (Figures 7B,C). The c-axis cluster are aligned horizontally at a high angle to the flow direction (Figures 7D). The orientations of the horizontal trace of layers identified under cross polarized light are also presented for each sample. In all cases, the c-axis maxima are rotated anticlockwise from the pole to layering (Figure 7D).
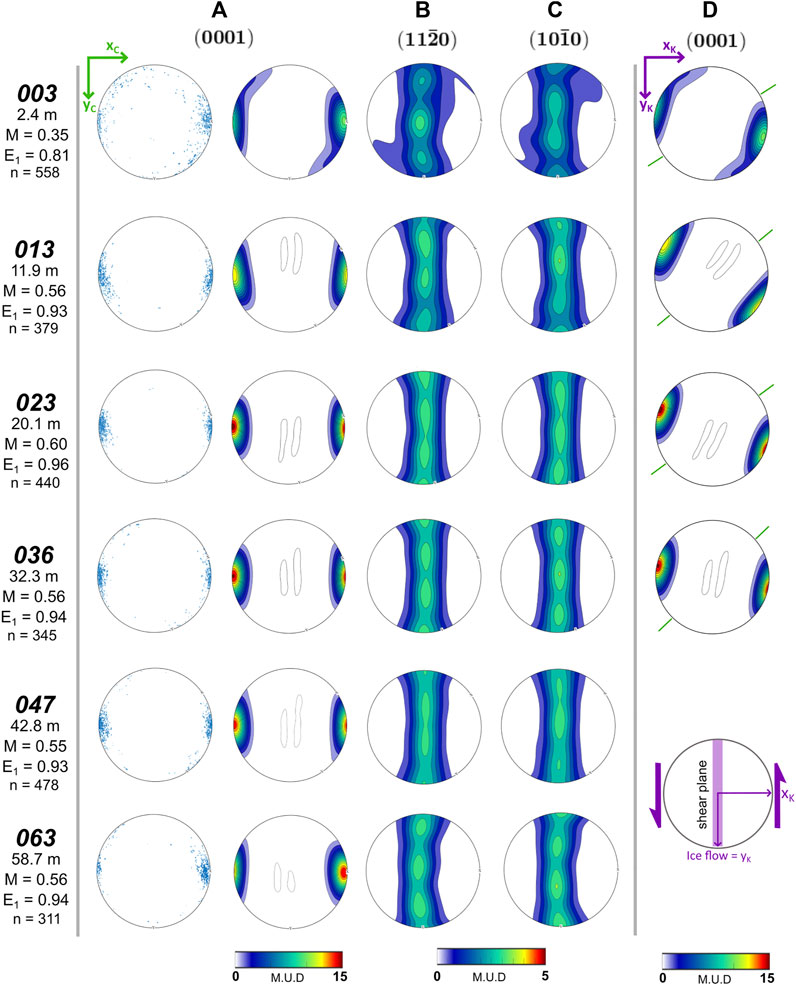
FIGURE 7. Crystallographic preferred orientations for six representative samples oriented in the “c-axis maximum” reference frame. CPOs for (A) c-, (B) a- and (C) m-axes, M index and c-axis eigenvalues (for definition see section 4.6) are calculated from orientation data. CPOs are also arranged in the “kinematic” reference frame (D), with the exception of samples 047 and 063, which are unoriented. Orientations of layer traces observed in sample thin sections are defined by green ticks on the pole figures. The intensity of a fabric is given as the multiple of uniform density (M.U.D), and is calculated from the maximum intensity of a contoured pole figure. M.U.D values of 1 would indicate a random fabric with no preferred orientation.
4.3 Microstructure
Figure 8 comprises orientation maps in the c-axis maximum reference frame, grain size and shape data for the six representative samples down the core. The maps have colors (inverse pole figure (IPF) legend in Figure 8A) that show for each pixel which crystal direction is parallel to the c-axis maximum (xC axis) of the sample. Grains with c-axes aligned with the sample c-axis maximum are red. A small fraction of ‘oddly’ oriented grains (oriented differently from the main cluster), defined as grains whose c-axes are oriented >20° from the xC axis, appear in the maps as isolated yellow, green, and blue grains (Figure 8A). A notable fraction (7.7%) of these grains are observed in the shallow sample 003.
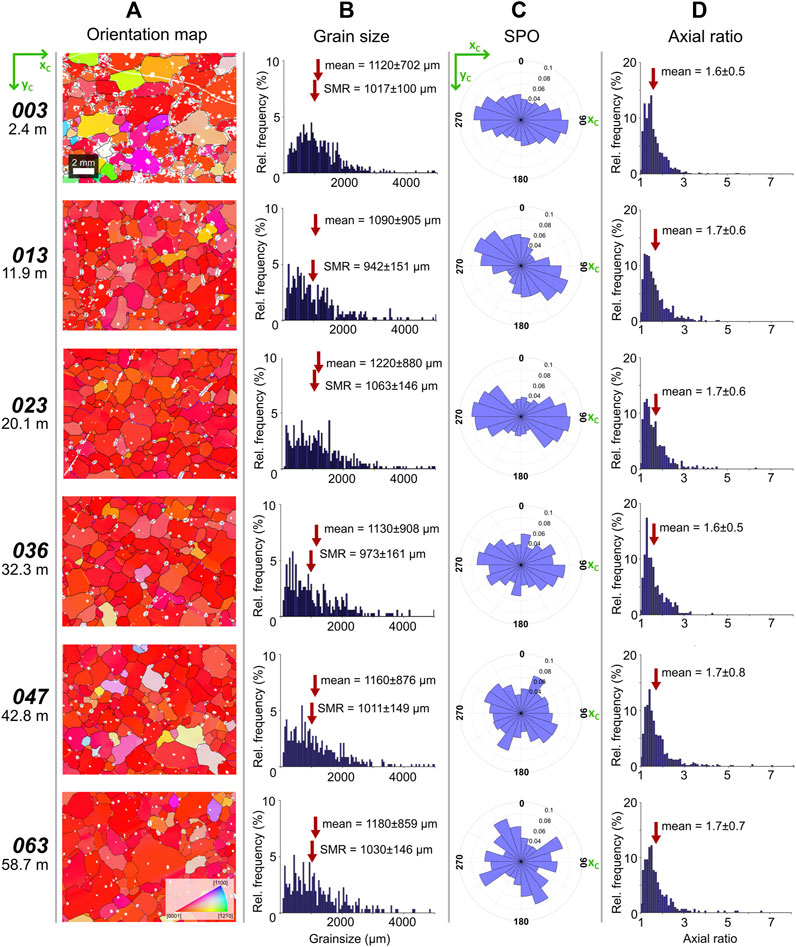
FIGURE 8. Microstructure of six representative samples along the Priestley Glacier ice core. (A) Orientation maps colored by crystallographic orientation parallel to the xC axis. Step size is 20 µm. Grain boundaries are black, characterized by a misorientation of 10°, while yellow and blue subgrain boundaries are characterized by a misorientation of 3 and 5°, respectively. (B) Grain size distributions. (C) Shape preferred orientations of grains in the “c-axis maximum” reference frame. The height of each bar is the relative number of orientations. (D) Grain axial ratio distributions.
Grain size frequency distributions are presented in Figure 8B. The mean grain diameter
Shape preferred orientations (SPOs), defined as the orientations of individual grain long axes, are compiled in Figure 8C. All samples have a relatively strong SPO at angles between 1 and 20° clockwise of the c-axis maximum (xC axis). Samples 036, 047 and 063 (Figure 8C), as well as some samples between 5 and 30 m, have increasingly bimodal distributions of grain long axis orientations, with the second maximum oriented ±10–20° of perpendicular to the c-axis maximum. Grain axial ratio
Layers of clearer ice were observed in full core sections taken above 8 m depth. Core section 006 contained one distinct layer dipping at a near vertical angle, and less obvious layers near parallel to this. This feature corresponds to an indistinct (or dark, not clearly defined) feature identified in televiewer logs (Figure 9A). The clear layer and near parallel layers are visible in the 5 mm horizontal slice cut to select cryo-EBSD samples (Figure 9B). The layer pattern is complex, and layer traces are rotated ∼40–60° clockwise from the flow direction. Layer traces in core slice 006 show variable thicknesses and slight bending on the centimetre scale. Isoclinal folding on the millimetre to centimetre scale has also been observed in a few slices down the core.
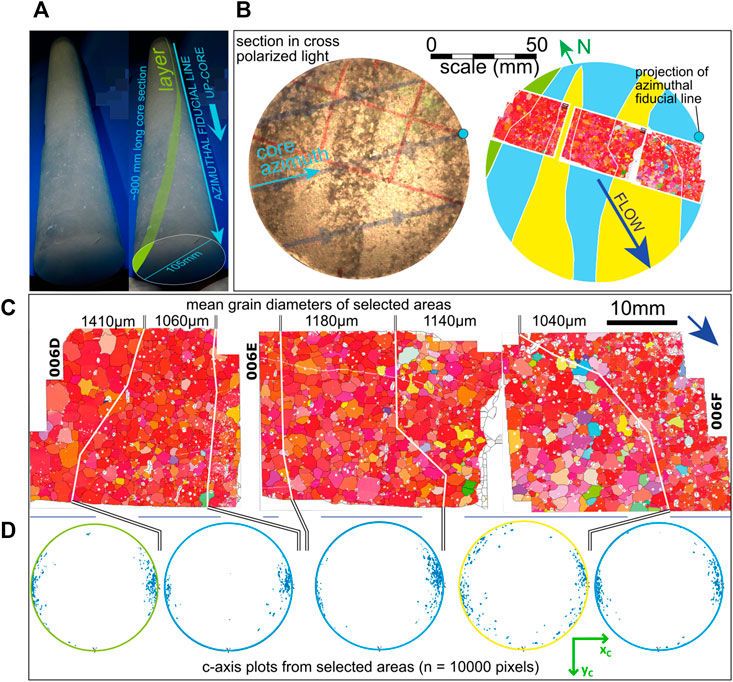
FIGURE 9. Microstructural variations related to different layers in core. (A) Photograph (marked of core section 6 (4.4–5.3 m depth) with a curviplanar, sub-vertical layer of clear ice, annotated in green on right hand layer. This layer corresponds to an indistinct trace in the televiewer image (Figure 3A). (B) Transmitted light image in cross polars and interpretive sketch through a 5 mm thick ice section taken from the core end shown in A. EBSD maps are superposed to show location relative to layers. The layer shaded green corresponds to the layer of clear ice shown in A. The other layers (shaded yellow and blue) are visible in core but much less distinct. They are sub-parallel to the clear ice layer. Sections are oriented in the c-axis maximum reference frame (explained below). Ice flow direction and geographic north are marked. (C) EBSD maps across the layers, rotated anti-clockwise from B. For ease of display: arrow shows ice flow direction. Mean grain diameters for selected areas corresponding to the layers are shown. Color scheme for all maps is IPF for the “c-axis maximum” reference frame (see Figure 6), angle of rotation determined from the left (006D) map. Grains with c-axis the same as the statistical maximum are red (see IPF key in Figures 6, 8). (D) Stereonets showing the c-axis orientations (n = 10,000 pixels) for ice grains in selected areas corresponding to the layers.
Cryo-EBSD analysis across these features show a subtle difference in microstructure between the layers (Figure 9C). The clear layer of ice had a significantly larger mean grain diameter of 1,410 µm. This layer has a lower bubble density relative to the rest of the ice. The c-axis maximum orientation varies slightly between adjacent layers by up to 14°. The layers illustrated as blue in Figure 9B have strong c-axis CPOs with few distinctly oriented grains, similar to the clear ice layer (Figure 9D). In contrast, the thicker layer illustrated as yellow in Figure 9B has a large number of oddly oriented grains, and a considerable resultant cluster of c-axes clockwise of the primary maximum (Figure 9D). The CPOs of the first three layers in Figure 9D show a small anticlockwise rotation left to right corresponding to anticlockwise rotation of the layers.
4.4 Misorientation and Vorticity Analysis
Intragranular lattice distortion occurs as a consequence of dislocation creep (Urai et al., 1986; Humphreys and Hatherley, 1996). It is possible to calculate the misorientation axis (rotation axis) and angle that maps the crystal orientation in one part of a grain onto the crystal orientation of another part of the grain (Wheeler et al., 2001). In typical EBSD maps, there are many pixels within a grain, and it is possible to calculate many misorientation axes between these pixels to investigate their orientation statistically and calculate an average dispersion axis for that grain (Reddy and Buchan, 2005; Michels et al., 2015). This approach is the basis of crystal vorticity axis (CVA) calculations (Michels et al., 2015; Kruckenberg et al., 2019) where the dispersion axes for multiple grains are calculated to give the aggregate dispersion axis, or vorticity axis, for a sample. This allows for evaluation of shear induced vorticity at the specimen scale, without having to rely on foliation or lineation as kinematic indicators (Michels et al., 2015). To contribute to a CVA using MTEX, grains require at least three indexed solutions (or pixels) and have a grain orientation spread (GOS) of >1°. For each Priestley sample, 50–130 grains met these conditions and were used to calculate CVA.
Intragranular distortion in the Priestley ice samples, much like other naturally deformed ice samples (Monz et al., 2021; Steinbach et al., 2017; Weikusat et al., 2017), comprises mostly discrete, sharp, low angle boundaries (Figures 10A,C) rather than continuous lattice bending. Grains oriented distinctly from the preferred crystallographic alignment direction have significantly less intragranular distortion with no apparent subgrains (Figures 8A, 10A). Some of these low angle boundaries may be subgrain boundaries, developed through recovery of dislocations within grains (Urai et al., 1986), but some may be there by chance, simply as a geometrical consequence of the very strong CPO (Wheeler et al., 2001). Distinguishing these requires comparison of the misorientations across neighboring pixels (neighbor-pair) with the misorientations from randomly picked pixels (random-pair) within the sample: the random-pair misorientations represent the geometrical consequence of the CPO (Wheeler et al., 2001).
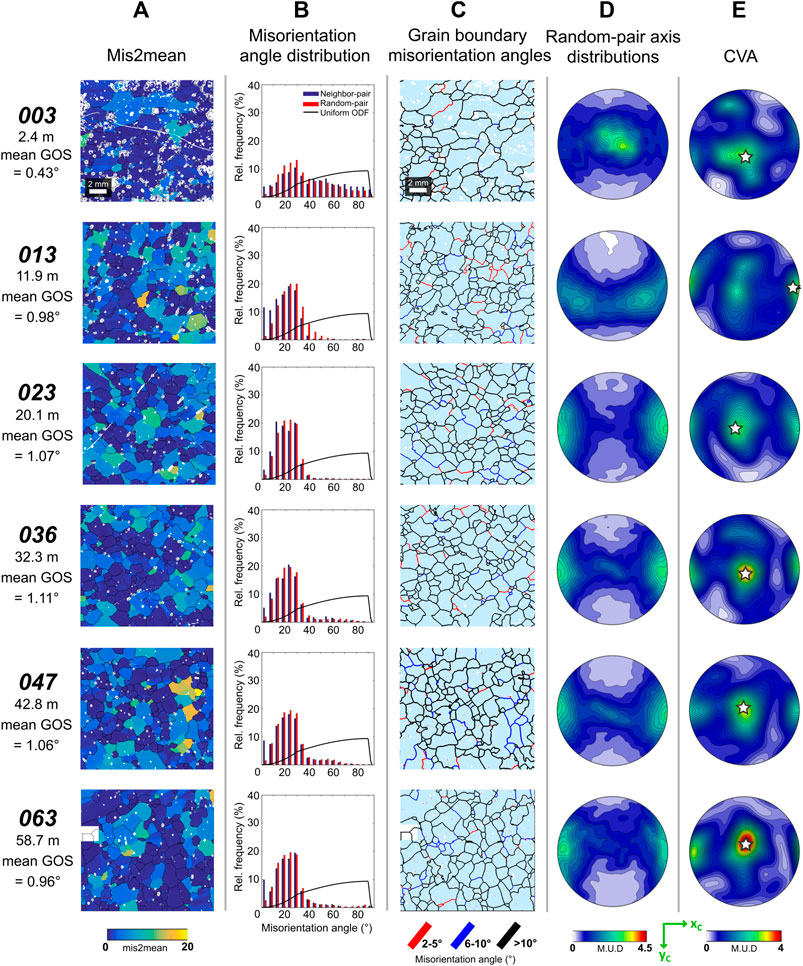
FIGURE 10. Misorientation distribution analysis for representative Priestley Glacier samples in the “c-axis maximum” reference frame. (A) Maps of intergranular misorientation relative to the mean orientation of a grain. Mean grain orientation spread (GOS), or misorientation to the mean orientation of a grain, is given for each sample. (B) Misorientation angle distribution for all neighbor-pair and random-pair grain boundaries plotted against a distribution for a uniform fabric. (C) Maps of grain boundary misorientation. (D) Random-pair misorientation axis distribution for all grain boundaries (>10°). Misorientation axes between pixels that are not necessarily neighboring. (E) Crystallographic vorticity analysis gives a dominant vorticity axis for a sample from the dispersion axes of individual deformed (GOS values >1°) grains (see section 4.4; Michels et al., 2015). The aggregate dispersion axis, or vorticity axis, is denoted by a white star.
Figure 10B shows the relative frequency of neighbor and random-pair misorientation angles. In all samples the neighbor and random-pair distributions for angles >10° are comparable, suggesting that these are geometrical consequences of the CPO. The tight peaks between 20 and 35° in all but the shallowest sample reflect the strong single c-axis maximum CPO. The wider range of misorientation angles in sample 003 relates to the population of differently oriented grains in this sample. In all samples, the neighbor-pair peak in the 5° bin is significantly larger than the random-pair peak, suggesting that there is a population of low angle boundaries that is not a geometrical consequence of the CPO. Mean grain orientation spread (GOS) values, which is the average misorientation between all pixels in a grain and the grain mean orientation, remain low in the representative samples with <1° for all samples. These values are low enough to be potentially affected by the limitations of the EBSD resolution (±0.5°).
The sample random-pair axis distribution and CVA are shown in Figures 10D, E. In the deepest four samples the CVA data show two maxima; one in the middle of the stereonets corresponding to the vertical direction and a second parallel to xC, the c-axis maxima. These maxima could be related to subgrains that represent intragranular distortion or to low angle boundaries that are a geometrical consequence of the CPO. To distinguish between these options, the CVA data need to be compared with the random-pair misorientation axes plotted in Figure 10D. For the four deepest samples the vertical maximum seen in the CVA is absent or much diminished in the random-pair misorientation axis plot. In contrast the maximum parallel to xC is well developed in both plots. These observations suggest that the CVA maximum parallel to xC is a geometrical consequence of the CPO whilst the vertical maximum represents the true vorticity axis for the deformation of the ice within the shear margin.
The two shallower samples are different. In sample 003 the vertical maximum is present in both CVA and random-pair plots and the maximum parallel to xC is absent from both. We cannot make any robust statements about vorticity in this sample. The CVA of sample 013 is similar to the deeper samples but the random pair misorientation axes subtly different. However, the vertical maximum is present in the CVA and absent in the random-pair plot, suggesting a vertical vorticity axis.
4.5 Bubble Analysis
Small bubbles with diameters 100–500 µm are present throughout the Priestley Glacier ice core. These bubbles were counted manually in three samples to determine proportions of bubbles on grain boundaries or within grains: 77–87% of bubbles were found along grain boundaries. Secondary electron images of the bubble structure of sample 020 are presented in Figure 11, showing relatively spherical bubbles in the horizontal plane, with a small proportion appearing elongated or connected (Figures 11A,B). Bubbles can also cluster in and around grain boundaries (Figure 11B). It is worth noting that these are 2D assumptions of bubble orientation and 3D analysis of bubble shapes is ongoing. The 3D nature of bubbles may introduce bias when calculating shape preferred orientations or when locating bubbles at grain boundaries or in grains, as we cannot say what the bubble shape is below the analyzed surface.
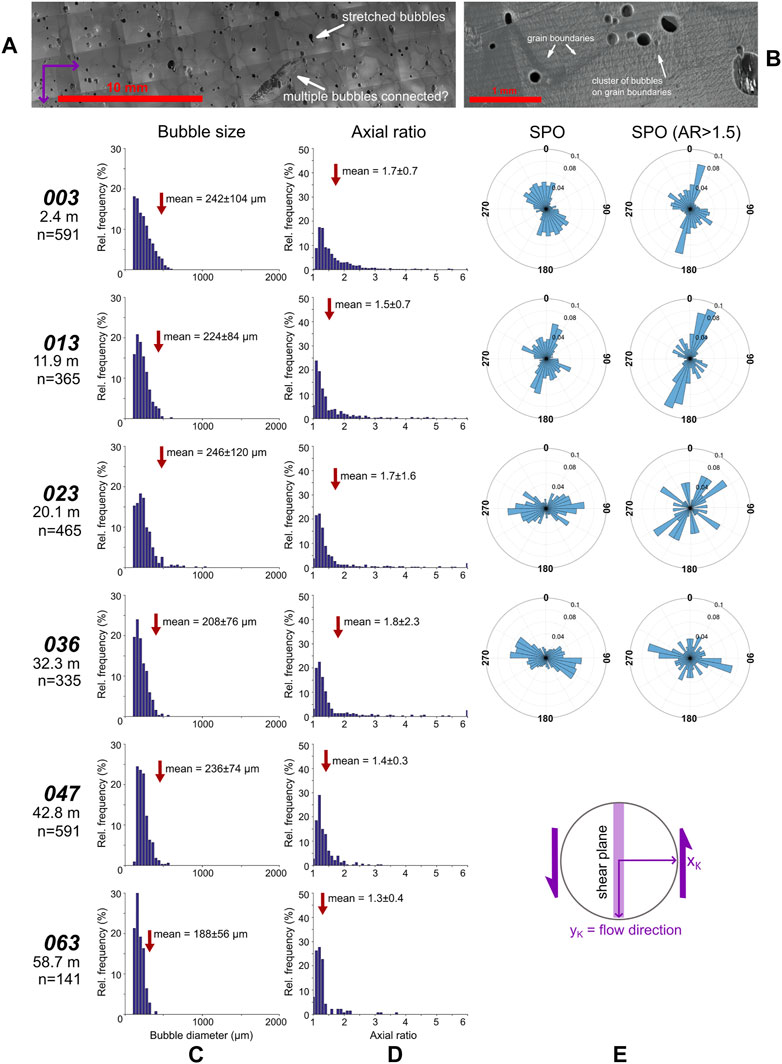
FIGURE 11. Bubble size and shape analysis for the Priestley Glacier ice core. (A) Full montaged secondary electron image showing bubble arrangement. (B) A close-up secondary electron image of bubbles at grain boundaries. (C) The bubble diameter, (D) axial ratio and (E) 2D shape preferred orientations calculated for bubbles automatically identified from the electron image during particle analysis.
Bubble diameter frequency diagrams are skewed toward lower bubble sizes, with all bubbles having diameters <1 mm (Figure 11C). The mean and square mean root diameter for bubbles remain constant throughout the majority of the core, between 200 and 240 µm. The deepest sample 063 displays decreased bubble diameters, with a significantly smaller dSMR of 126 ± 4 µm. Peak bubble diameters for all samples are constant, between 80 and 140 µm. Bubble mean and square mean root axial ratios decrease slightly with depth, from ∼1.7 to 1.3 (Figure 11D). The diagrams are again skewed to the left with peak axial ratios 1.1–1.2 and have a small percentage of bubbles with axial ratios >5, presumably identifying connected bubbles as very elongate single bubbles.
There is a strong bubble long axis SPO generally aligning parallel to sub-parallel (∼10°) to the flow direction in the shallow core. In samples below 20 m the bubble SPOs are rotated clockwise toward the pole to shear direction (Figure 11E). All samples display a second preferred orientation normal to the primary preferred orientation. SPOs for bubbles with axial ratios >1.5 show strong preferred alignments of elongated bubbles. The elongate bubble SPOs for shallowest samples 003 and 013 are generally aligned parallel to flow in similar orientations to SPOs for all bubbles. In the deeper samples, the SPO of elongated bubbles are similar to the SPO for all bubbles (Figure 11E). All samples have multiple minor maxima across a range of orientations with the exception of sample 023, which has a significant spread of orientations.
4.6 Trends with Depth
Trends of quantitative CPO strength and orientation, grain size and shape parameters have been plotted against depth in Figure 12. Grain long axes are consistently oriented similarly to the c-axis maximum and both are at a high angle anticlockwise to shear (or the flow direction, 180° in this reference frame). The plot of mean c-axis maxima and vector averages of SPO in Figure 12A shows an oscillatory pattern of orientations down core. From the surface to 16 m, the c-axis maxima and SPO average rotates from approximately parallel to the pole to shear (orthogonal to the flow direction), to ∼30° clockwise to the pole to shear at 9–10 m, then back to shear-parallel at 16 m. This pattern repeats from 16 to 33 m. The SPO average lies 1–20° clockwise of the c-axis maxima at all depths; maximum mismatch occurs when the c-axis maxima lie ∼30° clockwise to shear. Bubble SPO averages change with depth, rotating from ∼10° clockwise of the flow direction to 80° clockwise of the shear (flow) direction, near parallel to the pole to shear (Figure 12A). Layer orientations plot across a range of azimuths approximately perpendicular to the c-axis maximum. In all cases the pole to layer traces are clockwise of the c-axis maximum.
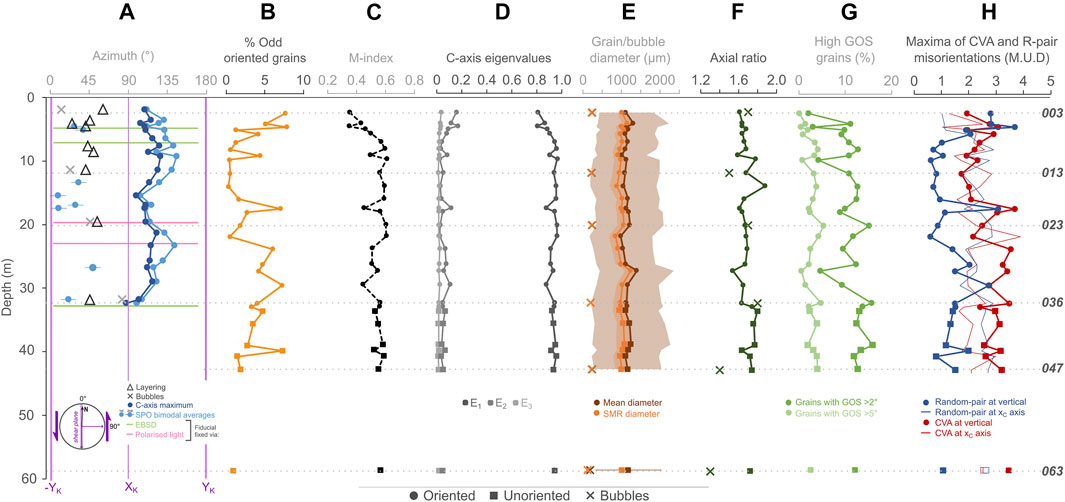
FIGURE 12. (A-D) Quantitative CPO strength and orientation, (E) grain size (shaded area representing 1 standard deviation), (F-H) shape and orientation parameters vs depth. ′Odd′ grains are those oriented differently to the main cluster (see Sections 4.3, 4.6). The plot of c-axis maximum (the angle of the principal eigenvalue E1 relative to the flow direction 0/180°, grain long axis, bubble long axis and layer orientations are presented in the kinematic reference frame, where the xK axis is perpendicular to flow.
Through the whole dataset, the percentage of oddly oriented grains decreases from 7% to <1% with a few jumps at ∼9 and 17 m, then increases from ∼22 m toward the deepest sample, with 4% odd grains (Figure 12B). The amount appears to decrease again to <1% below 40 m. The quantitative fabric strength, defined by the M-index (Skemer et al., 2005) and c-axis eigenvalues (Woodcock, 1977; Mainprice et al., 2015), are calculated for all samples and plotted against depth (Figures 12C,D). The M-index defines the difference between a theoretically uniform orientation distribution function (ODF, a quantitative description of the CPO; Bunge, 1982) and the sample random-pair misorientation distribution. Values range from 0 (random fabric) to 1 (single crystal fabric). M-index values in the Priestley samples increase from the near surface down to 10 m, then remains relatively constant as depth increases (Figure 12C). Eigenvalues are calculated from the second order orientation tensor of the c-axis distribution and can be used to quantitatively describe the strength of a samples c-axis distribution. In this study, the three eigenvalues have values E1>E2>E3, where E1+E2+E3 = 1. The primary eigenvalue E1 is also lowest in the top 10 m, increasing to a constant value of 0.9–0.95 below 10 m. Eigenvalue E3 has constant low values of ∼0.01–0.02 below 10 m with values that rise slightly in the upper 10 m. E2 has an inverse pattern to E1. With maximum values of ∼0.07, and minimum values ≥ E3. Samples with lower E1 and comparatively higher E2 and E3 values are those with a population or smear of grain lattice orientations outside of the primary c-axis maximum (Figure 12D). Sample 063 has similar M-index values and eigenvalues to samples from 40 m depth.
Graphs of and
The percentage of grains with GOS values >2° and grains with GOS values >5° gives a measure of how many grains contain subgrains (Figure 12G). Although there is some variability, the percentage of grains with increased misorientations are largely constant with depth. In the top ∼10 m, this plot has an inverse trend to the percentage of oddly oriented grains (Figure 12B). It is worth noting that the percentage of grains with higher degrees of misorientation are <10% throughout the core; across all samples, relatively few subgrains are observed.
The intensities of the CVA and random-pair misorientations need to be used together to infer vorticity related to intragranular deformation. The only significant maxima in both parameters, at all depths, are sub-vertical or close to parallel with the c-axis maximum (Figures 10D,E). The values of both CVA and random-pair misorientations parallel to the c-axes are similar in all samples and there is no consistency in whether CVA or random-pair misorientations have larger values in this direction (Figure 12H). It is thus likely that the apparent CVA parallel to c-axis maxima is a geometrical consequence of the strong CPO (see section 4.2). In contrast, the CVA in the vertical direction is significantly larger than the random-pair misorientations in nearly all samples below 10 m (Figure 12H), suggesting a vertical CVA relates to intragranular deformation. At depths shallower than 10 m, CVA and random-pair misorientations have similar vertical values.
5 Discussion
5.1 The Origins and Implications of Layering
The sub-parallel layers with isoclinal fold structures, anastomosing layer patterns and local low angle truncations are typical of planar structures in high strain zones in rocks (Berthe et al., 1979b; Lister and Snoke, 1984; Toy et al., 2012). High shear strain will cause planar features of a wide range of orientations to become sub-parallel (Ramsay, 1980) and in a high shear strain zone of a glacier; original sub-horizontal annual layering and ice filled fractures (veins) will all become sub-parallel (Hooke and Hudleston, 1978; Hudleston, 2015; Jennings and Hambrey, 2021) while non-planar original features may be strained to generate new sub-parallel planar layers (see Figure 14 in Hudleston, 2015). The sub-parallel vertical layers in the Priestley core are consistent with the location in the lateral shear margin, however the strike orientation of the layers is rotated clockwise of that expected. Parallelism of layers is achieved with shear strains of around 10 (Norris and Cooper, 2003; Hudleston, 2015). At shear strain rates of 6 × 10⁻¹⁰ s−1 (Still et al., this volume) and a site ice velocity of 90 m per year, a shear strain of 10 is achieved in approximately 50 km of downstream motion. Based on our observations and measurements it is highly likely that the ice at the Priestley Glacier has experienced this much finite strain. However, a homogenous shear strain of 10 would result in a finite extension direction, that would approximate the parallel layer strike orientation, <10° (Ramsay, 1980) from the shear direction (flow direction). Layer strikes are mostly 30–60° clockwise of flow and vary depending on location and depth. These variations are best explained by inhomogeneity in the shear leading to local rotations or by generations of new layer/foliation structures that represent less finite shear strain.
5.2 Kinematic Controls on the CPO of the Priestley Glacier Shear Margin
CPOs that develop as a result of deformation share the symmetry of the deformation kinematics (Wenk and Christie, 1991). The observed pattern of strong horizontal single maxima with a clockwise (looking down) smear of differently oriented grains has monoclinic symmetry, with a vertical 2-fold rotation axis and a horizontal mirror plane (applying these symmetry operators does not change the pattern). This is consistent with the vertical crystal vorticity axes (CVAs) constrained for all samples deeper than ∼10 m (Figure 12H). Deformations with a significant component of simple shear have monoclinic symmetry, with the vorticity axis in the shear plane and perpendicular to the shear direction (Michels et al., 2015). The observed CPOs are all consistent with shear deformation with a vertical shear plane and a horizontal shear direction (Figure 13).
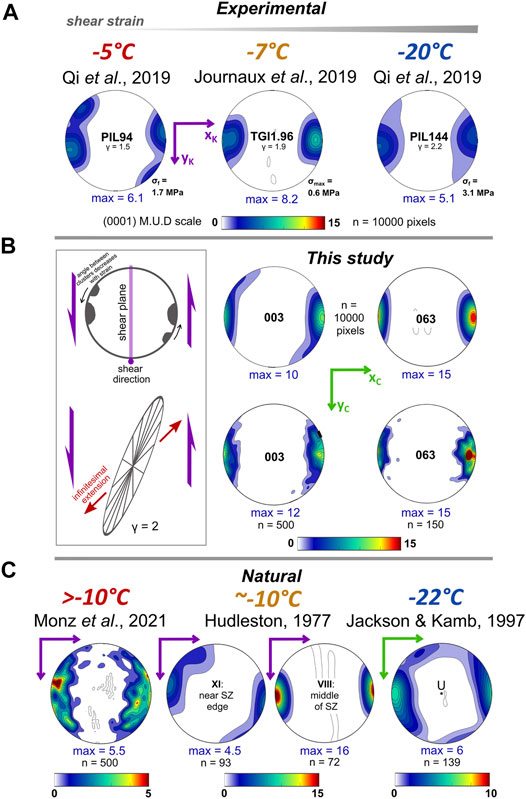
FIGURE 13. Comparison of Priestley Glacier c-axis CPOs with (A) CPOs from experiments (Journaux et al., 2019; Qi et al., 2019) and (C) from natural glacial shear margins (Hudleston, 1977; Jackson and Kamb, 1997; Monz et al., 2021). For comparison with natural datasets, Priestley samples are also presented as one point-per-grain CPOs (B). The inset schematic describes the geometry of a c-axis CPO for ice deformed under simple shear (see section 4.2 for details). A strain ellipse for a shear strain of 2 defines an angle of infinitesimal extension 45° clockwise of the c-axis maximum, normal to shear plane. Shear strain is represented as γ, final or maximum shear stress represented as σf or σmax, respectively.
All laboratory experiments where ice deformation is dominated by simple shear (Kamb, 1972b; Bouchez and Duval, 1982; Li et al., 2000; Wilson and Peternell, 2012; Journaux et al., 2019; Qi et al., 2019) result in a strong maximum (M1 max) of c-axes aligned normal to the shear plane. Some experiments also have a secondary maximum (M2 max) in the plane that contains the shear plane normal and the shear direction but rotated away from the primary (M1) maximum in the direction opposite to the sense of vorticity (Figure 13 schematic in middle section). The angle between the M1 and M2 maxima decreases with strain (Qi et al., 2019) and is also affected by deformation conditions, such as temperature and stress (Qi et al., 2019). The preferred a-axis orientations resulting from shear (Journaux et al., 2019; Qi et al., 2019) lie in the shear plane, perpendicular to the shear direction at low strain and parallel to the shear direction at high strain. The Priestley Glacier shear margin CPOs have characteristics very similar to CPOs from shear experiments. This is shown in Figure 13, where two representative CPOs from the Priestley data set are plotted for comparison with experimental data.
Single and double cluster fabrics are both observed in the Priestley Glacier ice core. A weak M2 maximum seen in sample 003 is geometrically similar to both the high stress, high strain experimental sample PIL144 and relatively low strain, low stress sample PIL94 deformed at a relatively warmer temperature (Qi et al., 2019). Deep sample 047 has a similar CPO geometry to experimental sample TGI1.96, deformed at a low stress at a higher temperature than that observed in the Priestley Glacier margin (−7°C, compared to ∼ −20°C; Figure 3B). Experimental samples were deformed to lower shear strains than those expected for the Priestley shear margin (Figure 13), and these strains were achieved at significantly higher strain rates (1 × 10⁻⁴ to 1 × 10⁻⁷ s−1, compared to 6 × 10⁻¹⁰ s−1 at the field site).
There are few measured ice CPOs from samples with well constrained deformation kinematics, very few from shear zones and even fewer from lateral shear margins. Natural shear zone CPO data that can be compared with our data are plotted in Figure 13. The best constrained data from natural ice shear zones are from basal shear of the Barnes ice cap (Hudleston, 1977; Hudleston, 1980). This is the only data set for natural ice deformation where the samples can be linked to both kinematics and a progression in strain. The data for ice deformed at −10°C match the results from up-strain laboratory experiments (Bouchez and Duval, 1982; Journaux et al., 2019; Qi et al., 2019) in having a primary (M1) maximum normal to the shear plane and a secondary maximum that rotates towards the M1 maximum with increasing shear strain. Data from very coarse-grained ice in a marginal shear zone of Storglaciären have two maxima with the M1 maximum close to normal to the shear plane and a weak M2 maximum (Monz et al., 2021). These data also show the a-axes to be aligned normal to the shear direction in the shear plane. Some samples from near the base of Talos Dome (Montagnat et al., 2012) have tight vertical maxima, related to a dominance of shear on a horizontal plane, with oddly oriented grains rotated 40°–50° from the maximum. Published CPO data from lateral shear margins are from boreholes with no azimuthal orientation information. CPOs from lateral shear zones in the margins of the Whillans ice stream have two horizontal maxima, one being more intense than the other (Jackson and Kamb, 1997; Jackson, 1999). Recent data from the margin of the Jarvis Glacier, Alaska show a preponderance of horizontal c-axes (Gerbi et al., 2021).
The kinematics of the Priestley shear margin, as measured by stakes spaced 50–100 m, is dominated by simple shear (Still et al., this volume). The measured c-axis maxima oscillate twice down depth between normal to the shear plane as defined by the velocity data (the vertical plane containing the velocity vector: Figure 1), and ∼30° clockwise to the pole to shear direction. The simplest explanation of this is that the individual CPOs have undergone rigid rotations that postdate their formation, or that rigid rotation processes operate faster than the CPO evolution can respond to changing kinematics. Such rotations are also needed to explain the orientation of layering as outlined in section 4.1. The range of clockwise rotations of layering, from shear plane parallel, is similar to the range of clockwise rotations of c-axis maxima, from shear plane normal. Moreover, the pattern of layer trace orientation with depth in the top 12 m is similar to the pattern of c-axis maximum orientations (Figures 6, 12). Where CPOs are measured across layers (Figure 9), the c-axis maxima rotate with layer orientation. These observations suggest that layer and c-axis maxima orientations are linked. Layer traces always lie anticlockwise of the c-axis maxima, by less than 90°, most commonly by about 70°; this relative orientation is consistent with sinistral shear with the shear plane normal to the c-axis maximum.
The structures that give rise to the rotations of CPOs and layers could include folding and bending of the layers as seen in the field (Figure 6) and in the core (Figure 9). Rotations of CPO with the relatively small orientation changes of layers has been documented in ice deformation experiments (Wilson, 1983; Wilson et al., 2003) and has been reported for natural quartz CPOs (Carreras et al., 1977) and is observed in layered sections of the Priestley ice core (Figure 9). Rotation could also be related to localization of deformation. The localized deformation could be ductile, and evidence for such structures is seen in the low angle truncations of layers (Figure 6) or brittle, such as the dominant set of NE to NNE fractures upstream of the borehole. Blocks of ice between the localized zones undergo rotation (Platt and Vissers, 1980; Lister and Snoke, 1984). The rotations required to explain the CPOs would be around a vertical axis, consistent with localization of horizontal motion on vertical planes.
The changes in CPO orientation with depth (Figure 14) would require heterogeneity in the shear kinematics on the meter to 10 m scale. Such heterogeneity should be expected; it is commonplace in highly anisotropic rocks from shear zones (Berthe et al., 1979a; Platt and Vissers, 1980; Lister and Snoke, 1984; Goscombe and Passchier, 2003; Toy et al., 2012) and such complexity of structure has been described in glaciers (Kamb, 1959; Hambrey, 1977; Hooke and Hudleston, 1978; Hudleston, 2015; Jennings and Hambrey, 2021). Such heterogeneity may integrate over the scale of many tens of meters to approximate the broad kinematics of the shear margin. GNSS positioning data from the Priestley Glacier shear margin (Still et al., this volume) show that the kinematic fields calculated from the measured velocities of neighboring triangles of marker stakes differ (e.g., the extension direction changes) in a manner more complicated than a simple increase in simple shear strain rate towards the margin. These data may reflect the short-range complexity within the shear margin kinematics we infer from the CPO and layer data.
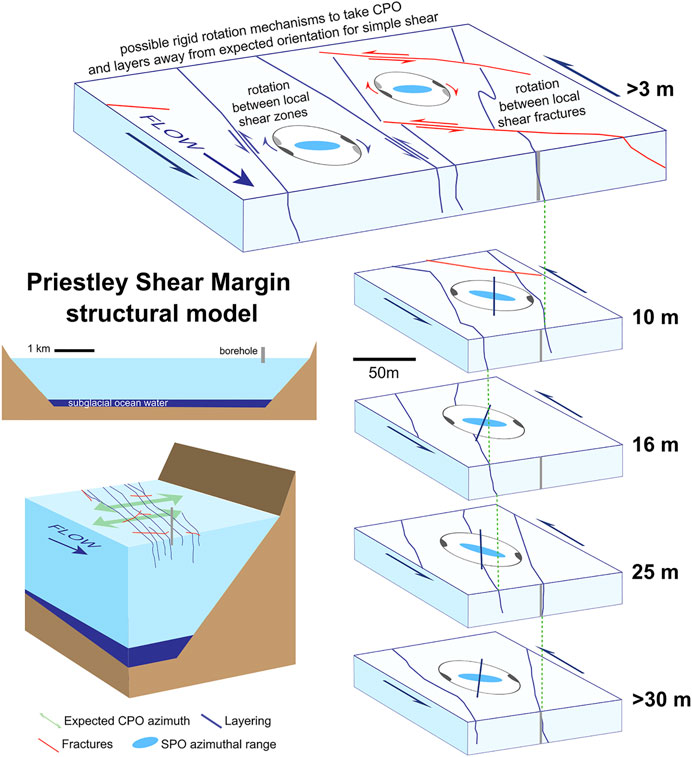
FIGURE 14. The kinematic setting of the floating Priestley Glacier lateral sinistral shear margin as determined by GNSS positioning data, field observations and core CPO and microstructure. Oscillatory CPO and grain long axis rotations occur twice within the top 30 m of the core, with low degree, small scale rotations imposed by layers intersecting the core. Green dashed lines define near vertical layering extending to depth.
Dominant grain long axis (SPO) orientations almost exclusively lie clockwise of the c-axis maximum (Figures 12, 14). The difference in azimuthal orientation between the c-axis maximum and SPO increases by up to 20° at depths where the c-axis maximum azimuth is at a large angle clockwise from the xK axis. The grain long axis orientations are not oriented ∼45° anticlockwise of the c-axis maximum as expected from experiments by Journaux et al. (2019). Secondary maxima of grain long axes, where they occur, lie 60–90° anticlockwise of the c-axis maximum and would be consistent with the finite extension direction expected for simple shear on the plane normal to the c-axis maximum, corresponding to a shear strain of ∼2. In the deepest three samples where bubble long axis orientations were measured, averages lie ∼80° anticlockwise of the c-axis maxima, corresponding to a finite shear strain of ∼4. Neither grain shapes nor bubble shapes are likely to record finite strain as both can be reset during deformation; grains by recrystallisation (Lister and Snoke, 1984) and bubbles by a drive to remain spherical (Hudleston, 2015; Dadic et al., 2019). Bubbles in the upper ∼10 m of the core could have complex histories (Dadic et al., 2019) related to seasonal temperature gradients (Figure 3D).
The dominant orientation of grain long axes 1–20° clockwise of the c-axis maxima (approximately normal to the shear plane) is unexpected. The relative proportion of shear normal extension to simple shear (Still et al., this volume) is unlikely sufficient to explain this (Fossen and Tikoff, 1998). It is possible that there are recrystallization processes that give unexpected long axis orientations. Another possibility here is that the long axes reflect the cyclic tidal flexural strains that occur in addition to continuous shear at this site (Still et al., this volume).
5.3 Deformation and Recrystallisation Mechanisms
Studies have shown that dislocation creep is the main deformation mechanism in polar ice sheets (Duval et al., 1983; Weertman, 1983; Shearwood and Whitworth, 1989; Duval et al., 2010). The CPO of polycrystalline ice is initiated by this process (Wilson et al., 2014). Microstructural analyses on deep Antarctic ice cores describe changes in recrystallisation mechanisms with depth (Gow and Williamson, 1976; Lipenkov et al., 1989; Azuma et al., 2000; Obbard and Baker, 2007; Durand et al., 2009; Weikusat et al., 2009). Typically, grain size increases linearly with depth in shallow ice (Alley et al., 1986; Thorsteinsson et al., 1997; Durand et al., 2006), interpreted as the result of grain growth. A transition is observed, below which grain sizes remain constant as depth increases, indicating grain growth is balanced by grain nucleation, that occurs by subgrain rotation (SGR) recrystallization. Corresponding CPOs are strong single maxima. Transitional depths vary in different deep ice cores (Duval and Castelnau, 1995; Faria et al., 2014a). A second transition occurs to a basal warm ice facies, at depths where temperature increases to ≥10°C. Basal ice is very coarse grained with irregular, often amoeboidal grain shapes and lobate grain boundaries, interpreted as the result of dynamic strain induced grain boundary migration (De La Chapelle et al., 1998). CPOs in the warm ice are typically multimaxima (Hellmann et al., 2021) but can be poorly defined due to poor grain statistics (Hudleston, 2015) and recent work (Monz et al., 2021) has suggested that these are, given a shear dominated kinematic regime, probably double maxima.
The Priestley ice microstructures, with relatively regular sub-polygonal grain shapes and strong single maximum CPOs, are most comparable to the constant grain size zones of deep boreholes. Low angle subgrains, though proportionally minor, attest to the operation of a recovery and SGR process. Irregular grain boundaries suggest that strain-induced GBM also operated. GBM operating alone will lead to grain growth and requires a nucleation mechanism to maintain grain sizes (Urai et al., 1986). There is no evidence of “core and mantle” grain structures in the Priestley Glacier samples, where small, recrystallized grains are arranged around large, strained parent grains during continuous rotation recrystallization (White, 1976). Such structures are seen readily in low temperature ice deformation experiments from Fan et al. (2020) but are not readily observed as higher strain microstructures (Qi et al., 2019; Fan et al., 2021) that may represent a steady state.
Clockwise smears of the c-axes and oddly oriented grains could represent nucleation during GBM (Halfpenny et al., 2006; Urai et al., 1986). Oddly oriented grains at Talos Dome (Montagnat et al., 2012) are related to localized GBM (discontinuous recrystallization) events. The oddly oriented grains represent a poorly developed M2 maximum; development of this maximum would be related to the operation of GBM (Qi et al., 2019). Samples with oddly oriented grains have lower relative frequencies (>10%) of low angle grain boundaries. This is seen in samples at a range of depths, and varies between different layers (Figure 9), but is most clear in the upper 10 m. While there appears to be a slight inverse relationship between the amount of oddly oriented grains and percentages of high GOS grains (>2° and >5°), this does not necessarily extend to greater depths; the percentage of grains with high GOS values remains largely constant with some variability as depth increases (Figure 12). This variability may come from less robust statistics, as samples do not contain abundant grains with high degrees of misorientation, or subgrain boundaries. A slight increase in grains with high intragranular misorientation at depth would suggest an increase in strain energy due to high dislocation density, that could drive fast rates of grain boundary mobility despite a decrease in temperature (De La Chapelle et al., 1998; Fan et al., 2021). The temperature nears 0°C in the topmost section of the core (Figure 3B) which may encourage GBM recrystallization and growth of oddly oriented grains in summer months.
The microstructures and CPOs of the Priestley samples contrast with those from the Whillans ice stream margin (Jackson and Kamb, 1997; Jackson, 1999), the only other samples collected from a cold polar lateral shear margin. The Whillans samples are coarser grained, with much more irregular grain boundaries and have clear double maxima CPOs, all suggesting a dominance of GBM processes. The in situ temperatures are slightly colder (−22°C vs. −19°C) and strain rates an order of magnitude faster (5 × 10⁻⁹ s−1 vs. ∼6 × 10⁻¹⁰ s−1) at Whillans. Given that lower temperatures and faster strain rates will correspond to higher stresses one would expect Whillans ice stream samples to be finer-grained (Jacka and Li, 1994) relative to Priestley and to have microstructures inferring a greater significance of SGR versus GBM (Qi et al., 2017; Qi et al., 2019; Fan et al., 2020). This disparity may be explained by the Priestley microstructure having been modified by higher stress cyclic deformation processes associated with tidal flexure as documented by diurnal strains in phase with tidal elevation at this site (Still et al., this volume).
6 Summary
1. A 58 m core was recovered from the floating lateral shear margin of the Priestley Glacier, Antarctica. The upper 30 m of the core is azimuthally oriented. The field site is dominated by simple shear with a component of extension sub-perpendicular to flow, as defined by surveying techniques. At this site, the glacier deforms at a shear strain rate of ∼6 × 10⁻¹⁰ s−1.
2. Sub-parallel vertical layering with isoclinal fold structures and low angle truncations observed on the surface of the field site and in the borehole are typical of high strain shear zones. These features are oriented 30–60° clockwise of flow.
3. The c-axis CPOs of samples define a strong single horizontal maximum, with some samples showing a weak secondary cluster or “smear” of c-axes clockwise of the primary maximum. CPOs are very strong (primary c-axis eigenvalue ∼0.9) and are consistent with shear deformation with a vertical shear plane normal to shear direction. This is further supported by a vertical crystal vorticity axis (CVA: shear induced rotation), calculated from intragranular distortion. A pattern of CPO rotations around a vertical axis repeats twice in the top 30 m of the core, with maximum rotation of ∼30° clockwise (looking down), opposite to the direction of vorticity as defined by CVA. Layer traces almost always lie 70–90° anticlockwise of the c-axis maxima throughout the core, consistent with sinistral shear.
4. Rigid rotations of blocks of ice may occur within the shear margin, rotating around a vertical axis to give these layer and c-axis maximum orientations. These rotations could be initiated through the folding and bending of layers during flow, or due to localized deformation (brittle or ductile) within the shear margin. This rotation either post-dates CPO development or is occurring faster than the CPO can evolve to accommodate this kinematic change. The changes in c-axis maximum orientation with depth indicates heterogeneity in shear kinematics on the meter to 10 m scale, as observed in GNSS positioning data at the field site.
5. Overall, the c-axes define a tight horizontal maximum approximately perpendicular to flow, a pattern consistent with all observations from laboratory shear experiments. Horizontal c-axis maxima perpendicular to flow is what should be expected in lateral shear margins of glaciers.
Data Availability Statement
The original contributions presented in the study are included in the article/Supplementary Material, further inquiries can be directed to the corresponding author.
Author Contributions
RET, DJP, RM, MHB, HS, LC, DK, and FL collected the core. RET and DJP designed the research. RET, MN, and DJP collected cryo-EBSD data. RET, DJP, HS, BH, SF, and CH analyzed EBSD, borehole televiewer and GNSS data. RET and DJP wrote the draft. All authors have edited the manuscript.
Funding
This work was supported by a Marsden Fund of the Royal Society of New Zealand (UOO052), funding from the Korean Polar Research Institute (KOPRI project 21430) and funding from a University of Otago Research Grant (2019). RET was supported by a University of Otago Master’s Research Scholarship and the NZ Post Antarctic Scholarship from Antarctica New Zealand.
Conflict of Interest
The authors declare that the research was conducted in the absence of any commercial or financial relationships that could be construed as a potential conflict of interest.
The reviewer JK declared a past co-authorship with one of the authors DP.
Publisher’s Note
All claims expressed in this article are solely those of the authors and do not necessarily represent those of their affiliated organizations, or those of the publisher, the editors and the reviewers. Any product that may be evaluated in this article, or claim that may be made by its manufacturer, is not guaranteed or endorsed by the publisher.
Acknowledgments
We are thankful to Inga Smith and Julie Clark for access to cold room facilities at the University of Otago. Field and logistics support from Antarctica New Zealand and staff at Scott Base, Mario Zucchelli Station and Jang Bogo Station were crucial. Bia Boucinhas co-ordinated on site logistics and operational safety planning. We are appreciative to Maurine Montagnat and Johanna Kerch for their helpful reviews and constructive comments.
Supplementary Material
The Supplementary Material for this article can be found online at: https://www.frontiersin.org/articles/10.3389/feart.2021.702213/full#supplementary-material
References
Alley, R. B. (1992). Flow-law Hypotheses for Ice-Sheet Modeling. J. Glaciol. 38 (129), 245–256. doi:10.3189/s0022143000003658
Alley, R. B., Perepezko, J. H., and Bentley, C. R. (1986). Grain Growth in Polar Ice: II. Application. J. Glaciol. 32 (112), 425–433. doi:10.3189/s0022143000012132
Aster, R. C., and Winberry, J. P. (2017). Glacial Seismology. Rep. Prog. Phys. 80 (12), 126801. doi:10.1088/1361-6633/aa8473
Azuma, N. (1994). A Flow Low for Anisotropic Polycrystalline Ice under Uniaxial Compressive Deformation. Cold Regions Sci. Technol. 23 (2), 137–147.
Azuma, N., Wang, Y., Yoshida, Y., Narita, H., Hondoh, T., Shoji, H., et al. (2000). “Crystallographic Analysis of the Dome Fuji Ice Core,” in Physics of Ice Core Records (Hokkaido: Hokkaido University Press), 45–61.
Bachmann, F., Hielscher, R., and Schaeben, H. (2011). Grain Detection from 2d and 3d EBSD Data-Specification of the MTEX Algorithm. Ultramicroscopy 111 (12), 1720–1733. doi:10.1016/j.ultramic.2011.08.002
Bamber, J. L., Vaughan, D. G., and Joughin, I. (2000). Widespread Complex Flow in the interior of the Antarctic Ice Sheet. Science 287 (5456), 1248–1250. doi:10.1126/science.287.5456.1248
Bamber, J. L., Westaway, R. M., Marzeion, B., and Wouters, B. (2018). The Land Ice Contribution to Sea Level during the Satellite Era. Environ. Res. Lett. 13 (6), 063008. doi:10.1088/1748-9326/aac2f0
Barnes, P. R. F., and Wolff, E. W. (2004). Distribution of Soluble Impurities in Cold Glacial Ice. J. Glaciol. 50 (170), 311–324. doi:10.3189/172756504781829918
Bennett, M. R. (2003). Ice Streams as the Arteries of an Ice Sheet: Their Mechanics, Stability and Significance. Earth-Science Rev. 61 (3-4), 309–339. doi:10.1016/s0012-8252(02)00130-7
Bentley, C. R. (1972). Seismic-wave Velocities in Anisotropic Ice: A Comparison of Measured and Calculated Values in and Around the Deep Drill Hole at Byrd Station, Antarctica. J. Geophys. Res. 77 (23), 4406–4420. doi:10.1029/jb077i023p04406
Berthe, D., Choukroune, P., and Gapais, D. (1979a). Quartz Fabrics and Progressive Gneissification of Granites by Simple Shear - Example of the South Armorican Shear Zone. Bull. De Mineralogie 102 (2-3), 265–272. doi:10.3406/bulmi.1979.7287
Berthé, D., Choukroune, P., and Jegouzo, P. (1979b). Orthogneiss, Mylonite and Non Coaxial Deformation of Granites: the Example of the South Armorican Shear Zone. J. Struct. Geology. 1 (1), 31–42. doi:10.1016/0191-8141(79)90019-1
Bouchez, J. L., and Duval, P. (1982). The Fabric of Polycrystalline Ice Deformed in Simple Shear: Experiments in Torsion, Natural Deformation and Geometrical Interpretation. Textures and Microstructures 5 (3), 171–190. doi:10.1155/tsm.5.171
Carreras, J., Estrada, A., and White, S. (1977). Effects of Folding on C-axis Fabrics of a Quartz Mylonite. Tectonophysics 39 (1-3), 3–24. doi:10.1016/0040-1951(77)90085-3
Craw, L., Qi, C., Prior, D. J., Goldsby, D. L., and Kim, D. (2018). Mechanics and Microstructure of Deformed Natural Anisotropic Ice. J. Struct. Geology 115, 152–166. doi:10.1016/j.jsg.2018.07.014
Dadic, R., Schneebeli, M., Wiese, M., Bertler, N. A. N., Salamatin, A. N., Theile, T. C., et al. (2019). Temperature-Driven Bubble Migration as Proxy for Internal Bubble Pressures and Bubble Trapping Function in Ice Cores. J. Geophys. Research-Atmospheres 124 (17-18), 10264–10282. doi:10.1029/2019jd030891
De La Chapelle, S., Castelnau, O., Lipenkov, V., and Duval, P. (1998). Dynamic Recrystallization and Texture Development in Ice as Revealed by the Study of Deep Ice Cores in Antarctica and Greenland. J. Geophys. Res. 103 (B3), 5091–5105. doi:10.1029/97jb02621
Deponti, A., Pennati, V., De Biase, L., Maggi, V., and Berta, F. (2006). A New Fully Three-Dimensional Numerical Model for Ice Dynamics. J. Glaciol. 52 (178), 365–376. doi:10.3189/172756506781828629
Drews, R., Wild, C. T., Marsh, O. J., Rack, W., Ehlers, T., Neckel, N., et al. (2021). Grounding-zone Flow Variability of Priestley Glacier, Antarctica, in a Diurnal Tidal Regime. Earth Space Sci. Open Archive 48, e2021GL093853. doi:10.1029/2021GL093853
Durand, G., Gagliardini, O., Thorsteinsson, T., Svensson, A., Kipfstuhl, S., and Dahl-Jensen, D. (2006). Ice Microstructure and Fabric: an Up-To-Date Approach for Measuring Textures. J. Glaciol. 52 (179), 619–630. doi:10.3189/172756506781828377
Durand, G., Svensson, A., Persson, A., Gagliardini, O., Gillet-Chaulet, F., Sjolte, J., et al. (2009). Evolution of the Texture along the EPICA Dome C Ice Core. Low Temp. Sci. 68, 91–105.
Durham, W. B., Heard, H. C., and Kirby, S. H. (1983). Experimental deformation of polycrystalline H2O ice at high pressure and low temperature: Preliminary results. Journal of Geophysical Research: Solid Earth, 88(S01), B377–B392.
Duval, P., Ashby, M. F., and Anderman, I. (1983). Rate-controlling Processes in the Creep of Polycrystalline Ice. J. Phys. Chem. 87 (21), 4066–4074. doi:10.1021/j100244a014
Duval, P., and Castelnau, O. (1995). Dynamic Recrystallization of Ice in Polar Ice Sheets. J. Phys. IV 05 (C3), C3–C197. doi:10.1051/jp4:1995317
Duval, P., Montagnat, M., Grennerat,Weiss, F. J., Weiss, J., Meyssonnier, J., and Philip, A. (2010). Creep and Plasticity of Glacier Ice: a Material Science Perspective. J. Glaciol. 56 (200), 1059–1068. doi:10.3189/002214311796406185
Echelmeyer, K. A., Harrison, W. D., Larsen, C., and Mitchell, J. E. (1994). The Role of the Margins in the Dynamics of an Active Ice Stream. J. Glaciol. 40 (136), 527–538. doi:10.1017/s0022143000012417
Fan, S., Hager, T. F., Prior, D. J., Cross, A. J., Goldsby, D. L., Qi, C., et al. (2020). Temperature and Strain Controls on Ice Deformation Mechanisms: Insights from the Microstructures of Samples Deformed to Progressively Higher Strains at −10, −20 and −30 °C. The Cryosphere 14 (11), 3875–3905. doi:10.5194/tc-14-3875-2020
Fan, S., Prior, D. J., Cross, A. J., Goldsby, D. L., Hager, T. F., Negrini, M., et al. (2021). Using Grain Boundary Irregularity to Quantify Dynamic Recrystallization in Ice. Acta Materialia 209, 116810. doi:10.1016/j.actamat.2021.116810
Faria, S. H., Weikusat, I., and Azuma, N. (2014a). The Microstructure of Polar Ice. Part I: Highlights from Ice Core Research. J. Struct. Geology. 61, 2–20. doi:10.1016/j.jsg.2013.09.010
Faria, S. H., Weikusat, I., Weikusat, I., and Azuma, N. (2014b). The Microstructure of Polar Ice. Part II: State of the Art. J. Struct. Geology. 61, 21–49. doi:10.1016/j.jsg.2013.11.003
Fossen, H., and Tikoff, B. (1998). Extended Models of Transpression and Transtension, and Application to Tectonic Settings. Geol. Soc. Lond. Spec. Publications 135 (1), 15–33. doi:10.1144/gsl.sp.1998.135.01.02
Frezzotti, M., Capra, A., and Vittuari, L. (1998). Comparison between Glacier Ice Velocities Inferred from GPS and Sequential Satellite Images. A. Glaciology. 27, 54–60. doi:10.3189/1998aog27-1-54-60
Frezzotti, M., Tabacco, I. E., and Zirizzotti, A. (2000). Ice Discharge of Eastern Dome C Drainage Area, Antarctica, Determined from Airborne Radar Survey and Satellite Image Analysis. J. Glaciol. 46 (153), 253–264. doi:10.3189/172756500781832855
Gerbi, C., Mills, S., Clavette, R., Campbell, S., Bernsen, S., Clemens-Sewall, D., et al. (2021). Microstructures in a Shear Margin: Jarvis Glacier, Alaska. J. Glaciol., 1–14. doi:10.1017/jog.2021.62
Gillet-Chaulet, F., Gagliardini, O., Meyssonnier, J., Montagnat, M., and Castelnau, O. (2005). A User-Friendly Anisotropic Flow Law for Ice-Sheet Modeling. J. Glaciol. 51 (172), 3–14. doi:10.3189/172756505781829584
Glen, J. W. (1955). “The Creep of Polycrystalline Ice,” in Proceedings of the Royal Society of London A: Mathematical, Physical and Engineering Sciences (London, United Kingdom: The Royal Society), 228, 519–538.
Goldsby, D. L., and Kohlstedt, D. L. (2001). Superplastic Deformation of Ice: Experimental Observations. J. Geophys. Res. 106 (B6), 11017–11030. doi:10.1029/2000jb900336
Goodman, D. J., Frost, H. J., and Ashby, M. F. (1981). The Plasticity of Polycrystalline Ice. Philosophical Mag. A 43 (3), 665–695. doi:10.1080/01418618108240401
Goscombe, B. D., and Passchier, C. W. (2003). Asymmetric Boudins as Shear Sense Indicators-An Assessment from Field Data. J. Struct. Geology 25 (4), 575–589. doi:10.1016/s0191-8141(02)00045-7
Gow, A. J., and Williamson, T. (1976). Rheological Implications of the Internal Structure and crystal Fabrics of the West Antarctic Ice Sheet as Revealed by Deep Core Drilling at Byrd Station. Geol. Soc. America Bull. 87 (12), 1665–1677. doi:10.1130/0016-7606(1976)87<1665:riotis>2.0.co;2
Halfpenny, A., Prior, D. J., and Wheeler, J. (2006). Analysis of Dynamic Recrystallization and Nucleation in a Quartzite Mylonite. Tectonophysics 427 (1-4), 3–14. doi:10.1016/j.tecto.2006.05.016
Hambrey, M. J. (1977). Foliation, Minor Folds and Strain in Glacier Ice. Tectonophysics 39 (1-3), 397–416. doi:10.1016/0040-1951(77)90106-8
Harland, S. R., Kendall, J.-M., Stuart, G. W., Lloyd, G. E., Baird, A. F., Smith, A. M., et al. (2013). Deformation in Rutford Ice Stream, West Antarctica: Measuring Shear-Wave Anisotropy from Icequakes. Ann. Glaciol. 54 (64), 105–114. doi:10.3189/2013aog64a033
Harrison, W. D., Echelmeyer, K. A., and Larsen, C. F. (1998). Measurement of Temperature in a Margin of Ice Stream B, Antarctica: Implications for Margin Migration and Lateral Drag. J. Glaciol. 44 (148), 615–624. doi:10.3189/s0022143000002112
Hellmann, S., Grab, M., Kerch, J., Löwe, H., Bauder, A., Weikusat, I., et al. (2021). Acoustic Velocity Measurements for Detecting the crystal Orientation Fabrics of a Temperate Ice Core. The Cryosphere 15 (7), 3507–3521. doi:10.5194/tc-15-3507-2021
Hellmann, S., Kerch, J., Weikusat, I., Bauder, A., Grab, M., Jouvet, G., et al. (2021). Crystallographic Analysis of Temperate Ice on Rhonegletscher, Swiss Alps. The Cryosphere 15 (2), 677–694. doi:10.5194/tc-15-677-2021
Hooke, R. L., and Hudleston, P. J. (1978). Origin of Foliation in Glaciers. J. Glaciol. 20 (83), 285–299. doi:10.3189/s0022143000013848
Horgan, H. J., Anandakrishnan, S., Alley, R. B., Burkett, P. G., and Peters, L. E. (2011). Englacial Seismic Reflectivity: Imaging crystal-orientation Fabric in West Antarctica. J. Glaciol. 57 (204), 639–650. doi:10.3189/002214311797409686
Hruby, K., Gerbi, C., Koons, P., Campbell, S., Martín, C., and Hawley, R. (2020). The Impact of Temperature and crystal Orientation Fabric on the Dynamics of Mountain Glaciers and Ice Streams. J. Glaciol. 66 (259), 755–765. doi:10.1017/jog.2020.44
Hubbard, B., and Malone, T. (2013). Optical-televiewer-based Logging of the Uppermost 630 M of the NEEM Deep Ice Borehole, Greenland. Ann. Glaciol. 54 (64), 83–89. doi:10.3189/2013aog64a201
Hubbard, B., Roberson, S., Samyn, D., and Merton-Lyn, D. (2008). Digital Optical Televiewing of Ice Boreholes. J. Glaciol. 54 (188), 823–830. doi:10.3189/002214308787779988
Hudleston, P. J. (1980). The Progressive Development of Inhomogeneous Shear and Crystallographic Fabric in Glacial Ice. J. Struct. Geology. 2 (1-2), 189. doi:10.1016/0191-8141(80)90049-8
Hudleston, P. J. (1977). “Progressive Deformation and Development of Fabric across Zones of Shear in Glacial Ice,” in Energetics of Geological Processes: Hans Ramberg on His 60th Birthday. Editors S. K. Saxena, S. Bhattacharji, H. Annersten, and O. Stephansson (Berlin, Heidelberg: Springer Berlin Heidelberg), 121–150. doi:10.1007/978-3-642-86574-9_7
Hudleston, P. J. (2015). Structures and Fabrics in Glacial Ice: A Review. J. Struct. Geology. 81, 1–27. doi:10.1016/j.jsg.2015.09.003
Humphreys, F. J., and Hatherley, M. (1996). Recrystallization and Related Annealing Phenomena. Amsterdam, Netherlands: Elsevier Science, 498.
Jacka, T. H., and Jun, L. (1994). The Steady-State crystal Size of Deforming Ice. Ann. Glaciol. 20, 13–18. doi:10.3189/1994aog20-1-13-18
Jackson, M. (1999). “Dynamics of the Shear Margin of Ice Stream B, West Antarctica,” (Pasadena, California: Caltech), 118 phD
Jackson, M., and Kamb, B. (1997). The Marginal Shear Stress of Ice Stream B, West Antarctica. J. Glaciol. 43 (145), 415–426. doi:10.3189/s0022143000035000
Jennings, S. J., and Hambrey, M. J. (2021). Structures and Deformation in Glaciers and Ice Sheets. Rev. Geophys. 59(3), e2021RG000743. doi:10.1029/2021rg000743
Jordan, T. M., Schroeder, D. M., Elsworth, C. W., and Siegfried, M. R. (2020). Estimation of Ice Fabric within Whillans Ice Stream Using Polarimetric Phase-Sensitive Radar Sounding. Ann. Glaciol. 61 (81), 74–83. doi:10.1017/aog.2020.6
Journaux, B., Chauve, T., Montagnat, M., Tommasi, A., Barou, F., Mainprice, D., et al. (2019). Recrystallization Processes, Microstructure and Crystallographic Preferred Orientation Evolution in Polycrystalline Ice during High-Temperature Simple Shear. The Cryosphere 13 (5), 1495–1511. doi:10.5194/tc-13-1495-2019
Kamb, W. B. (1972b). “Experimental Recrystallization of Ice under Stress,” in Flow and Fracture of Rocks. Editors H. C. Heard, I. Y. Borg, N. L. Carter, and C. B. Rayleigh (Washington, D.C., USA: American Geophysical Union), 211–242.
Kamb, W. B. (1959). Ice Petrofabric Observations from Blue Glacier, Washington, in Relation to Theory and experiment. J. Geophys. Res. 64 (11), 1891–1909. doi:10.1029/jz064i011p01891
Kohnen, H., and Gow, A. J. (1979). Ultrasonic Velocity Investigations of crystal Anisotropy in Deep Ice Cores from Antarctica. J. Geophys. Research-Oceans Atmospheres 84 (NC8), 4865–4874. doi:10.1029/jc084ic08p04865
Kruckenberg, S. C., Michels, Z. D., and Parsons, M. M. (2019). From Intracrystalline Distortion to Plate Motion: Unifying Structural, Kinematic, and Textural Analysis in Heterogeneous Shear Zones through Crystallographic Orientation-Dispersion Methods. Geosphere 15 (2), 357–381. doi:10.1130/ges01585.1
Kuiper, E.-J. N., de Bresser, J. H. P., Eichler, J., Pennock, G. M., Weikusat, I., and Weikusat, I. (2020). Using a Composite Flow Law to Model Deformation in the NEEM Deep Ice Core, Greenland - Part 2: The Role of Grain Size and Premelting on Ice Deformation at High Homologous Temperature. The Cryosphere 14 (7), 2449–2467. doi:10.5194/tc-14-2449-2020
Lawson, W. J., Sharp, M. J., and Hambrey, M. J. (1994). The Structural Geology of a Surge-type Glacier. J. Struct. Geology. 16 (10), 1447–1462. doi:10.1016/0191-8141(94)90008-6
Li, J., Jacka, T. H., and Budd, W. F. (2000). “Strong Single-Maximum crystal Fabrics Developed in Ice Undergoing Shear with Unconstrained normal Deformation,” in Annals of Glaciology. Editor K. Hutter, 30, 88–92.
Lipenkov, V. Y., Barkov, N. I., Duval, P., and Pimienta, P. (1989). Crystalline Texture of the 2083 M Ice Core at Vostok Station, Antarctica. J. Glaciol. 35 (121), 392–398. doi:10.1017/s0022143000009321
Lister, G. S., and Snoke, A. W. (1984). S-C Mylonites. J. Struct. Geology. 6, 617–638. doi:10.1016/0191-8141(84)90001-4
Lutz, F., Eccles, J., Prior, D. J., Craw, L., Fan, S., Hulbe, C., et al. (2020). Constraining Ice Shelf Anisotropy Using Shear Wave Splitting Measurements from Active-Source Borehole Seismics. J. Geophys. Res. Earth Surf. 125 (9), e2020JF005707. doi:10.1029/2020jf005707
Mainprice, D., Bachmann, F., Hielscher, R., and Schaeben, H. (2015). Descriptive Tools for the Analysis of Texture Projects with Large Datasets Using MTEX: Strength, Symmetry and Components. Geol. Soc. Lond. Spec. Publications 409 (1), 251–271. doi:10.1144/sp409.8
Marshall, S. (2005). Recent Advances in Understanding Ice Sheet Dynamics. Earth Planet. Sci. Lett. 240 (2), 191–204. doi:10.1016/j.epsl.2005.08.016
Michels, Z. D., Kruckenberg, S. C., Davis, J. R., and Tikoff, B. (2015). Determining Vorticity Axes from Grain-Scale Dispersion of Crystallographic Orientations. Geology 43 (9), 803–806. doi:10.1130/g36868.1
Montagnat, M., Azuma, N., Dahl-Jensen, D., Eichler, J., Fujita, S., Gillet-Chaulet, F., et al. (2014). Fabric Measurement along the NEEM Ice Core, Greenland, and Comparison with GRIP and NGRIP Ice Cores. Cryosphere Discuss. 8, 307–335. doi:10.5194/tc-8-1129-2014
Montagnat, M., Buiron, D., Arnaud, L., Broquet, A., Schlitz, P., Jacob, R., et al. (2012). Measurements and Numerical Simulation of Fabric Evolution along the Talos Dome Ice Core, Antarctica. Earth Planet. Sci. Lett. 357-358, 168–178. doi:10.1016/j.epsl.2012.09.025
Monz, M. E., Hudleston, P. J., Prior, D. J., Michels, Z., Fan, S., Negrini, M., et al. (2021). Full Crystallographic Orientation (C and a Axes) of Warm, Coarse-Grained Ice in a Shear-Dominated Setting: a Case Study, Storglaciären, Sweden. The Cryosphere 15 (1), 303–324. doi:10.5194/tc-15-303-2021
Mulvaney, R., Bremner, S., Tait, A., and Audley, N. (2002). A Medium-Depth Ice Core Drill. Mem. Natl. Inst. Polar Res. Spec. Issue. 56, 82–90.
Norris, R. J., and Cooper, A. F. (2003). Very High Strains Recorded in Mylonites along the Alpine Fault, New Zealand: Implications for the Deep Structure of Plate Boundary Faults. J. Struct. Geology. 25 (12), 2141–2157. doi:10.1016/s0191-8141(03)00045-2
Obbard, R., and Baker, I. (2007). The Microstructure of Meteoric Ice from Vostok, Antarctica. J. Glaciol. 53 (180), 41–62. doi:10.3189/172756507781833901
Oxford Instruments (2021). AZtecHKL. . https://nano.oxinst.com/products/aztec/aztechkl (Accessed September 19, 2021).
Pauling, L. (1935). The Structure and Entropy of Ice and of Other Crystals with Some Randomness of Atomic Arrangement. J. Am. Chem. Soc. 57 (12), 2680–2684. doi:10.1021/ja01315a102
Pearce, M. A. (2015). EBSDinterp 1.0: A MATLAB Program to Perform Microstructurally Constrained Interpolation of EBSD Data. Microsc. Microanal 21 (4), 985–993. doi:10.1017/s1431927615000781
Pettit, E. C., Whorton, E. N., Waddington, E. D., and Sletten, R. S. (2014). Influence of Debris-Rich Basal Ice on Flow of a Polar Glacier. J. Glaciol. 60 (223), 989–1006. doi:10.3189/2014jog13j161
Piazolo, S., Wilson, C. J. L., Luzin, V., Brouzet, C., and Peternell, M. (2013). Dynamics of Ice Mass Deformation: Linking Processes to Rheology, Texture, and Microstructure. Geochem. Geophys. Geosyst. 14 (10), 4185–4194. doi:10.1002/ggge.20246
Platt, J. P., and Vissers, R. L. M. (1980). Extensional Structures in Anisotropic Rocks. J. Struct. Geology. 2 (4), 397–410. doi:10.1016/0191-8141(80)90002-4
Prior, D. J., Lilly, K., Seidemann, M., Vaughan, M., Becroft, L., Easingwood, R., et al. (2015). Making EBSD on Water Ice Routine. J. Microsc. 259 (3), 237–256. doi:10.1111/jmi.12258
Qi, C., Goldsby, D. L., and Prior, D. J. (2017). The Down-Stress Transition from Cluster to Cone Fabrics in Experimentally Deformed Ice. Earth Planet. Sci. Lett. 471, 136–147. doi:10.1016/j.epsl.2017.05.008
Qi, C., Prior, D. J., Craw, L., Fan, S., Llorens, M.-G., Griera, A., et al. (2019). Crystallographic Preferred Orientations of Ice Deformed in Direct-Shear Experiments at Low Temperatures. The Cryosphere 13 (1), 351–371. doi:10.5194/tc-13-351-2019
Ramsay, J. G. (1980). Shear Zone Geometry - a Review. J. Struct. Geology. 2 (1-2), 83–99. doi:10.1016/0191-8141(80)90038-3
Raymond, C. F., Echelmeyer, K. A., Whillans, I. M., and Doake, C. S. M. (2001). Ice Stream Shear Margins. West Antarctic ice sheet: Behav. Environ. 77, 137–155.
Reddy, S. M., and Buchan, C. (2005). “Constraining Kinematic Rotation Axes in High-Strain Zones: a Potential Microstructural Method,” in Geological Society. Editors D. Gapais, J. P. Brun, and P. R. Cobbold (London: Special Publications), 243, 1–10. doi:10.1144/gsl.sp.2005.243.01.02
Rignot, E., Mouginot, J., and Scheuchl, B. (2011). Ice Flow of the Antarctic Ice Sheet. Science 333 (6048), 1427–1430. doi:10.1126/science.1208336
Samyn, D., Svensson, A., and Fitzsimons, S. J. (2008). Dynamic Implications of Discontinuous Recrystallization in Cold Basal Ice: Taylor Glacier, Antarctica. J. Geophys. Res. 113 (F3), F03S90. doi:10.1029/2006jf000600
Schoof, C. (2004). On the Mechanics of Ice-Stream Shear Margins. J. Glaciol. 50 (169), 208–218. doi:10.3189/172756504781830024
Shearwood, C., and Whitworth, R. W. (1989). X-ray Topographic Observations of Edge Dislocation glide on Non-basal Planes in Ice. J. Glaciol. 35 (120), 281–283. doi:10.3189/s0022143000004627
Skemer, P., Katayama, I., Jiang, Z., and Karato, S. I. (2005). The Misorientation index: Development of a New Method for Calculating the Strength of Lattice-Preferred Orientation. Tectonophysics 411 (1-4), 157–167. doi:10.1016/j.tecto.2005.08.023
Smith, E. C., Baird, A. F., Kendall, J. M., Martín, C., White, R. S., Brisbourne, A. M., et al. (2017). Ice Fabric in an Antarctic Ice Stream Interpreted from Seismic Anisotropy. Geophys. Res. Lett. 44 (8), 3710–3718. doi:10.1002/2016gl072093
Steinbach, F., Kuiper, E. J. N., Eichler, J., Bons, P. D., Drury, M. R., Griera, A., et al. (2017). The Relevance of Grain Dissection for Grain Size Reduction in Polar Ice: Insights from Numerical Models and Ice Core Microstructure Analysis. Front. Earth Sci. 5, 66. doi:10.3389/feart.2017.00066
Thorsteinsson, T., Kipfstuhl, J., and Miller, H. (1997). Textures and Fabrics in the GRIP Ice Core. J. Geophys. Res. 102 (C12), 26583–26599. doi:10.1029/97jc00161
Toy, V. G., Prior, D. J., Norris, R. J., Cooper, A. F., and Walrond, M. (2012). Relationships between Kinematic Indicators and Strain during Syn-Deformational Exhumation of an Oblique Slip, Transpressive, Plate Boundary Shear Zone: The Alpine Fault, New Zealand. Earth Planet. Sci. Lett. 333-334, 282–292. doi:10.1016/j.epsl.2012.04.037
Urai, J. L., Means, W. D., and Lister, G. S. (1986). “Dynamic Recrystallization of Minerals,” in Mineral and Rock Deformation (Laboratory Studies). Editors B. E. Hobbs, and H. C. Heard (New York, NY: American Geophysical Union), 36, 161–199. doi:10.1029/gm036p0161
Weertman, J. (1983). Creep Deformation of Ice. Annu. Rev. Earth Planet. Sci. 11 (1), 215–240. doi:10.1146/annurev.ea.11.050183.001243
Weikusat, I., Kipfstuhl, S., Azuma, N., Faria, S. H., and Miyamoto, A. (2009). Deformation Microstructures in an Antarctic Ice Core (EDML) and in Experimentally Deformed Artificial Ice. Low Temperature Sci. 68 (Suppl. ment), 115–123.
Weikusat, I., Kuiper, E.-J. N., Pennock, G. M., Kipfstuhl, S., and Drury, M. R. (2017). EBSD Analysis of Subgrain Boundaries and Dislocation Slip Systems in Antarctic and Greenland Ice. Solid Earth 8 (5), 883–898. doi:10.5194/se-8-883-2017
Wenk, H.-R., and Christie, J. M. (1991). Comments on the Interpretation of Deformation Textures in Rocks. J. Struct. Geology. 13 (10), 1091–1110. doi:10.1016/0191-8141(91)90071-p
Wheeler, J., Prior, D., Jiang, Z., Spiess, R., and Trimby, P. (2001). The Petrological Significance of Misorientations between Grains. Contrib. Mineral. Petrol. 141 (1), 109–124. doi:10.1007/s004100000225
White, S. (1976). A Discussion on Natural Strain and Geological Structure-The Effects of Strain on the Microstructures, Fabrics, and Deformation Mechanisms in Quartzites. Phil. Trans. R. Soc. Lond. A. 283 (1312), 69–86.
Wilson, C. J. L. (1983). Foliation and Strain Development in Ice Mica Models. Tectonophysics 92 (1-3), 93–122. doi:10.1016/0040-1951(83)90086-0
Wilson, C. J. L., and Peternell, M. (2012). Ice Deformed in Compression and Simple Shear: Control of Temperature and Initial Fabric. J. Glaciol. 58 (207), 11–22. doi:10.3189/2012jog11j065
Wilson, C. J. L., Peternell, M., Piazolo, S., and Luzin, V. (2014). Microstructure and Fabric Development in Ice: Lessons Learned from In Situ Experiments and Implications for Understanding Rock Evolution. J. Struct. Geology. 61, 50–77. doi:10.1016/j.jsg.2013.05.006
Wilson, C. J. L., Russell-Head, D. S., and Sim, H. M. (2003). “The Application of an Automated Fabric Analyzer System to the Textural Evolution of Folded Ice Layers in Shear Zones,” in Ann. Glaciol. Editor P. Duval, 37, 7–17. doi:10.3189/172756403781815401
Keywords: lateral glacial shear margin, crystallographic preferred orientations, ice microstructure, ice deformation and flow, electron backscatter diffraction, Priestley Glacier
Citation: Thomas RE, Negrini M, Prior DJ, Mulvaney R, Still H, Bowman MH, Craw L, Fan S, Hubbard B, Hulbe C, Kim D and Lutz F (2021) Microstructure and Crystallographic Preferred Orientations of an Azimuthally Oriented Ice Core from a Lateral Shear Margin: Priestley Glacier, Antarctica. Front. Earth Sci. 9:702213. doi: 10.3389/feart.2021.702213
Received: 29 April 2021; Accepted: 27 October 2021;
Published: 26 November 2021.
Edited by:
Martin Schneebeli, WSL Institute for Snow and Avalanche Research SLF, SwitzerlandReviewed by:
Maurine Montagnat, Centre National de la Recherche Scientifique (CNRS), FranceJohanna Kerch, University of Göttingen, Germany
Copyright © 2021 Thomas, Negrini, Prior, Mulvaney, Still, Bowman, Craw, Fan, Hubbard, Hulbe, Kim and Lutz. This is an open-access article distributed under the terms of the Creative Commons Attribution License (CC BY). The use, distribution or reproduction in other forums is permitted, provided the original author(s) and the copyright owner(s) are credited and that the original publication in this journal is cited, in accordance with accepted academic practice. No use, distribution or reproduction is permitted which does not comply with these terms.
*Correspondence: Rilee E. Thomas, cmlsZWUudGhvbWFzQG90YWdvLmFjLm56