 Cunqi Jia1
 Tao Huang
 Jun Yao
 Hongchuan Xing
- 1School of Petroleum Engineering, China University of Petroleum (East China), Qingdao, China
- 2School of Petrochemical Engineering and Environment, Zhejiang Ocean University, Zhoushan, China
- 3Petroleum Department, Khalifa University, Abu Dhabi, United Arab Emirates
Carbonate reservoirs are one of the most important fossil fuel sources, and the acidizing stimulation is a practical technique for improving the recovery of carbonate reservoirs. In this study, the improved two-scale continuum model, including the representative elementary volume (REV) scale model and the upscaling model, is used to study the acidizing process with an isolated fracture. Based on this model, a comprehensive discussion is presented to study the effect of the physical parameters of the isolated fracture on the acidizing results and dissolution images, including the isolated fracture geometry, location, and morphology. Results show that the isolated fracture system is still the target system for the acidizing stimulation. The isolated fracture provides a limited contribution to the core porosity. The permeability of the core sample with fracture can be obviously increased only when the fracture penetrates through the whole sample. The existence of the isolated fracture reduces the consumption of acid solution to achieve a breakthrough. The acidizing curve is sensitive to the change of the length, aperture, and position of the isolated fracture. The acidizing curve difference corresponding to different rotation angles has not changed significantly for clockwise rotation and anticlockwise rotation groups.
Introduction
Carbonate reservoirs are one of the significant parts of fossil fuel sources (Zhao et al., 2018; Liu et al., 2020). Compared with sandstone sedimentary rocks, carbonate reservoirs have strong heterogeneity due to complex geological processes, which result in more formation energy consumption in some carbonate reservoirs with low permeability (Zhao et al., 2020; Liu et al., 2021). Carbonate acidizing is a widely used stimulation technology to effectively improve the oil recovery of carbonate reservoirs using the acid solution to dissolve the low permeability matrix (Wei et al., 2019).
Large numbers of articles have been published to study the carbonate matrix acidizing process. Experimental studies are mainly conducted through core flooding experiments, in which constant concentration acid solution is pumped at the inlet boundary of the core sample (Fredd and Fogler, 1999; Dong, 2012). During the experimental process, the pressure at the inlet boundary of the core sample is always recorded as an indirect indicator variable for monitoring the acidizing implementation. As the pore structure inside the core sample is constantly dissolved by the acid solution, the migration resistance of the acid fluid inside the core sample also constantly changes, causing the pressure at the core entrance to vary from time to time. Usually, the core displacement test is stopped when the inlet boundary pressure of the core sample is observed to decrease significantly (Zakaria and Nasr-El-Din, 2016). The obvious decrease of pressure means that the fluid migration resistance inside the core sample has dropped significantly, which is usually defined as the breakthrough moment during the acidizing process. The amount of acid consumed at the breakthrough time has been widely determined as a quantitative indicator to study the effectiveness of the acidizing process and evaluate the impact of different influencing factors on the acidizing process, including the acid solution types, concentration, injection rate, and core sample geometry (Dong, 2012; Furui et al., 2012; Wadekar and Pandya, 2014; Sarmah et al., 2020). One of the most important findings of these experimental studies is that there exists an optimum value for the acid breakthrough consumption curve, at which the injected acid solution consumes the minimum amount of the acid solution to achieve a breakthrough (Fredd and Fogler, 1999; Furui et al., 2012). Another important finding is that when acid solution is injected into the core sample at different rates, the final dissolution structure inside the core sample is also different when achieving the breakthrough (Sarmah et al., 2020). The high acid injection rate makes the acid solution to be transported to most of the core sample, causing the solid matrix to be uniformly dissolved. When the acid injection rate is reduced at the optimum value, the migration of the acid solution is controlled by the convection, diffusion, and core heterogeneity together. Finally, a major dissolution channel is formed inside the core sample named as the wormhole. When the acid solution injection rate further decreases, the width of the main wormhole is enlarged because the acid solution obtains sufficient time to dissolve the solid matrix.
Several mathematical models have also been developed to capture and reproduce the important results observed in the experimental studies, including the pore network model, empirical model, and continuum model (Maheshwari et al., 2013). The pore network model is the most realistic model, in which the initial calculation domain uses the pore network obtained through the true target stimulated core sample. The acidizing process is simulated inside each pore and throat of the real core sample (Tansey, 2014). However, huge calculation expense decides that the pore network model can only be conducted within the limited domain (Tansey and Balhoff, 2016). The empirical model has the smallest calculation expense, but the model accuracy depends on the assumptions for deriving the empirical model and the benchmark data obtained through the experimental studies (Maheshwari et al., 2016; Palharini Schwalbert et al., 2019). Finally, the continuum model has been extensively developed recently due to the high model accuracy compared to the empirical model and less computational consumption compared to the pore network model. The continuum model was first proposed by Panga et al. (2005) including the Darcy-scale model and pore-scale model. Hence, the continuum model is also referred to as the two-scale continuum model (Panga et al., 2005; Maheshwari et al., 2013; Liu et al., 2017). Recently, the two-scale continuum model was further improved by Jia et al. (2021a) to more accurately simulate the stimulation process, in which the additional mass term is added in the fluid phase continuity equation to consider mass exchange term between the solid matrix and acid solution. Also, the Stoke–Darcy equation is used instead of the Darcy equation to describe acid solution flow (Jia et al., 2021b).
Apart from the solid matrix, fractures are also very common in carbonate reservoirs. And, the carbonate rocks with isolated fractures are also the target reservoirs for the acidizing stimulation (Li and Voskov, 2021). However, few studies are conducted to study the acidizing process in carbonate rocks with isolated fractures. One of the reasons is that the efficient and accurate characterization of fractures is still a challenge in numerical simulation. Usually, the fracture models can be divided into the discrete fracture model and the duel-medium model according to the fractures’ descriptions. The discrete fracture model explicitly distinguishes the location of each fracture, and the fluid flow in each single fracture can be simulated (Neuzil and Tracy, 1981; Tsang and Witherspoon, 1981). The simplest discrete fracture model uses two parallel, infinite planes to represent single fracture (Snow, 1969). The cubic law is used to determine the fracture permeability used in the Darcy equation (Muralidhar, 1990). In actual application, the fracture aperture is generated through a random function to consider the effect of the roughness of the fracture surface (Zimmerman et al., 1991; Zimmerman et al., 1992). Different from the discrete fracture model, the duel-medium model assumes that the simulated domain contains both the solid matrix and the fracture (Moreno et al., 1988; Tsang and Tsang, 1989). The governing equations are developed both for the solid matrix region and the fracture region (Meyer and Bazan, 2011). The flow exchange between the solid matrix region and the fracture region is a function of the fluid pressure difference in the solid matrix region and the fracture region (Wu, 2015). It is worth noting that the fluid flow in the above fracture models is all described by the Darcy equation. However, the matrix acidizing results have proven that the applicability of the Darcy equation is only validated when the acid injection rate is relatively high, and the solid matrix is uniformly dissolved. When wormholes appear, the Darcy equation is not able to accurately describe the fluid flow because it only considers the effect of the structure of porous media (Jia et al., 2021b). However, in the wormhole region, the complex porous structure is dissolved into free-flow region. And, for the fracture region, it can also be seen as a special wormhole region, in which the applicability of the Darcy equation is still challenged and needs to be further validated. Hence, a more general mathematical model is still needed to simulate the acidizing process with fractures.
In this study, the improved two-scale continuum model is used to study the acidizing process with an isolated fracture. The detailed model descriptions are given in the next section. In the discussions and results section, both the classical and the improved two-scale models are used to simulate the acidizing process with an isolated fracture. Several cases are designed to investigate the effect of the fracture physical parameters on the stimulation results and compare the differences between the classical and the improved two-scale models. The main conclusions are summarized in the last section.
Model Descriptions
The mathematical models used in the acidizing process simulation with an isolated fracture is referred as the improved two-scale continuum model (Panga et al., 2005), which contains the representative elementary volume scale model and the upscaling model.
Representative Elementary Volume Scale Model
The representative elementary volume scale model is developed based on the mass and momentum conservation principles. The chemical reaction between the solid matrix and the acid solution proceeds according to the following equation:
The specific reaction rate is expressed by the concentration of hydrochloric acid in the acid solution system:
where
where
where
In this work, both the Darcy equation and the Stokes–Darcy equation are used to simulate the acidizing process with an isolated fracture to further compare the effect of differences between the classical and the improved two-scale models on the acidizing results.
Upscaling Model
The upscaling model is developed to link the actual acidizing process with the REV scale model. In the actual stimulation process, the chemical reaction between the acid solution and the solid matrix occurs on the pore surface inside the solid matrix. However, the reaction terms involved in the model established on the REV scale are based on the control volume. The connection between the actual chemical reaction rate at the pore scale and the equivalent, chemical reaction term on the REV scale is achieved through the mass transfer equation:
where
where
where
where
Initial and Boundary Conditions
The application of the initial and boundary conditions is consistent with the core displacement experiment (Fredd and Fogler, 1999; Dong, 2012). The core sample is saturated with water at the beginning. When the acidizing stimulation begins, the acid solution is continuously injected from the core inlet boundary at a constant injection rate and concentration, and the right boundary of the core sample maintains a constant pressure. The surrounding of the core sample is kept closed (Dong et al., 2014).
Results and Discussion
The study domain is selected as a common core sample size adopted in the experimental study with a dimension of 4 cm width and 10 cm length. The initial porosity and permeability of the core sample are measured as 0.15 and 5 m D (Dong et al., 2014). The isolated fracture is located in the center of the core sample with a length of 5 cm and an aperture of 0.15 mm. The acid system is selected as a hydrochloric acid solution with an injection concentration of 15% (4.42 mol/L). The molecular diffusion coefficient of the acid solution is determined as

TABLE 1. Values of physical parameters used in numerical models.
Model Comparison with the Existence of an Isolated Fracture
This section mainly investigates the influence of the isolated fracture on the acidizing process. We first study the influence of the single fracture on the core porosity and permeability. Figure 1 shows two typical single fracture patterns inside the core sample, separately named as the connected fracture and the isolated fracture. The porosity values are determined as 0.1815 and 0.1657, respectively, for the connected fracture and isolated fracture core samples. The permeability of the isolated fracture core sample is numerically measured at 7.94 mD, while the permeability of the connected fracture core sample is at 50 mD. The matrix porosity and permeability is 0.15 and 5 mD. It can be observed that both the isolated fracture and the connected fracture have a limited influence on porosity. The isolated fracture also has limited contribution for the core permeability. Only the connected fracture obviously increases the core permeability. Hence, the core sample with an isolated fracture is still the target core sample for the acidizing stimulation.
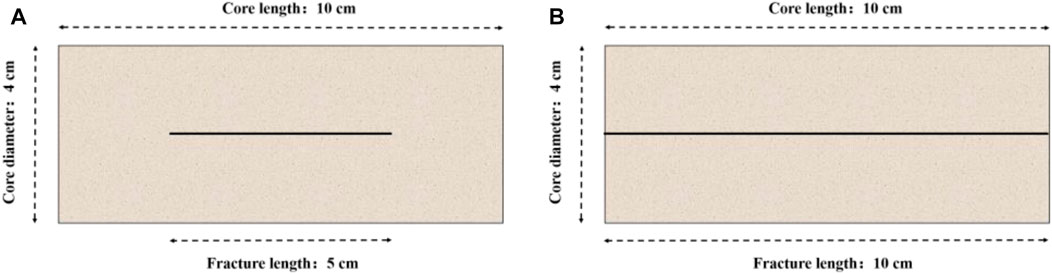
FIGURE 1. Typical fracture patterns inside the core sample: (A) isolated fracture; (B) connected fracture.
In the classical two-scale continuum model (Panga et al., 2005), the Darcy equation is used to describe the fluid flow during the acidizing process. In our recent work (Jia et al., 2021b), the Stokes–Darcy equation is suggested to determine the fluid phase velocity instead of the Darcy equation. Because the applicability of the Darcy equation is questioned within the wormhole regions, in the wormhole regions, the porosity value is very high, even up to 1. The effect of the porous structure on the fluid flow becomes less and less obvious. The viscous dispersion between the fluid phase becomes more important and should be considered. Figure 2 shows the carbonate matrix acidizing curves separately determined by the Darcy equation and the Stokes–Darcy equation. The results support the application of the Stokes–Darcy equation. When the acid solution is injected at high rates, the difference between the two acidizing curves is not very obvious. Because most of the solid matrix is not totally dissolved into wormholes with high acid injection rates. The effect of porous structure on the fluid flow is still dominated in this case compared to fluid phase viscous dispersion. The acidizing curve difference becomes apparent with low acid injection rates. When the acid injection rate is very low, the acid solution has sufficient time to react with the solid matrix, causing most of the solid matrix to completely dissolve into wormholes. Because the Darcy equation cannot consider the effect of fluid viscosity dissipation, the acid breakthrough volume calculated by the Darcy equation is obviously less than that determined by the Stokes–Darcy equation. The acidizing efficiency of the acid solution is artificially enhanced by using the Darcy equation. Figure 3 further compares the acidizing curves separately determined by the Darcy equation and the Stokes–Darcy equation with an isolated fracture. With contrast to Figure 2, the difference between the acidizing curves with an isolated fracture becomes obvious within the whole injection rate interval, even though the acid injection rate is at high values. The results show that the existence of an isolated fracture also challenges the applicability of the Darcy equation at high injection rates.
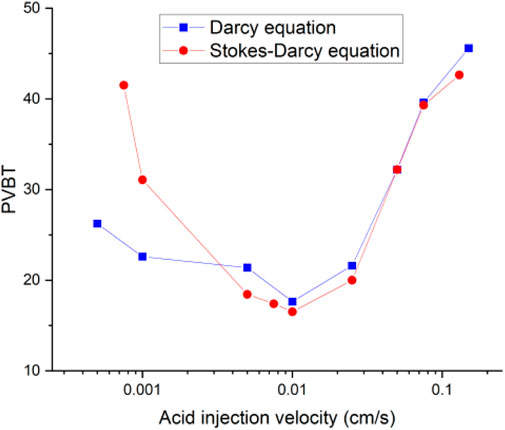
FIGURE 2. Matrix acidizing curves of pore volume to breakthrough.
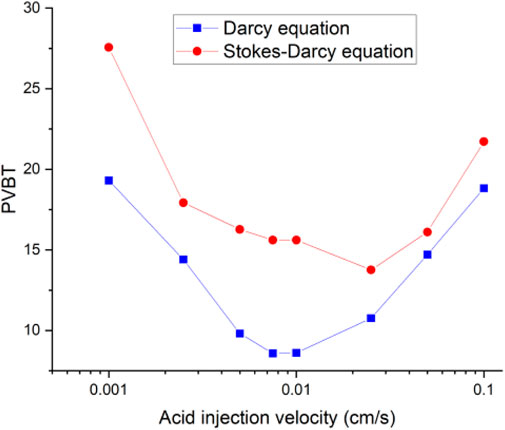
FIGURE 3. Isolated fracture acidizing curves of pore volume to breakthrough.
Figure 4 continues to compare the acidizing curves with an isolated fracture and without an isolated fracture. The results show that the acid breakthrough volume with an isolated fracture is smaller than that of the matrix acidizing result within in both acidizing curves determined by the Darcy equation and the Stokes–Darcy equation. The acid breakthrough volume difference between the acidizing curves with and without an isolated fracture is quite obvious when the acid injection rate is at a high value for both the Darcy equation and the Stokes equation. The acid breakthrough volume difference between the acidizing curves with and without an isolated fracture starts to differ at lower injection rates. The acid breakthrough volume difference determined by the Stokes–Darcy equation gradually becomes less apparent at low injection rates. The acid breakthrough volume difference determined by the Darcy equation is still significant when the injection rate is low. Figure 5 compares the dissolution images of the core sample with and without an isolated fracture. The isolated fracture greatly influences the final dissolution patterns especially when the acid solution is injected into the core sample with high and intermediate rates. The isolated fracture provides an advantageous passage for acid migration in porous media, in which isolated fracture prevents more acid from being ineffectively consumed to dissolve the solid matrix. Table 2 further studies the effect of mass exchange term between solid matrix and acid fluid solution on the stimulation results with an isolated fractured, which is neglected by most previous numerical studies (Panga et al., 2005). The results show that ignoring the mass exchange term still leads to an overestimated acid breakthrough volume, which is consistent with the conclusions obtained from the matrix acidification process (Jia et al., 2021a).
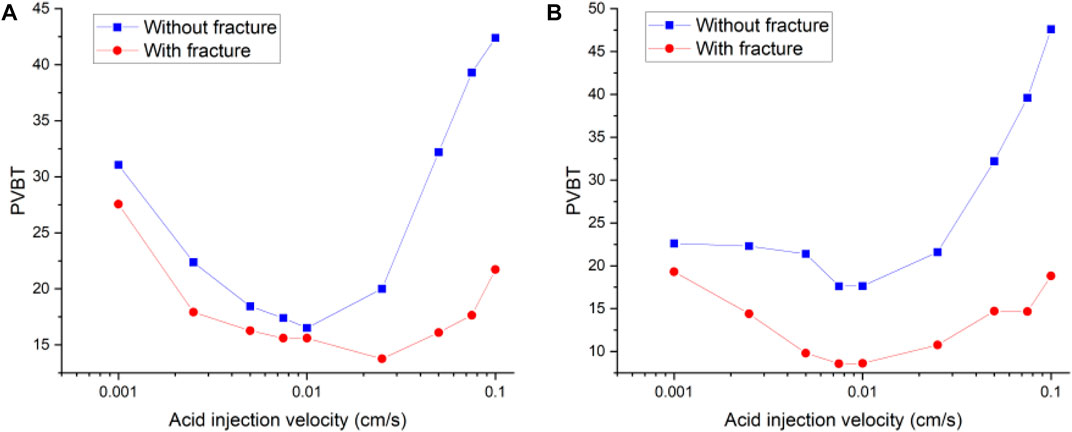
FIGURE 4. Comparison of acidizing curves of pore volume to breakthrough between matrix and isolated fracture: (A) Stokes–Darcy equation; (B) Darcy equation.
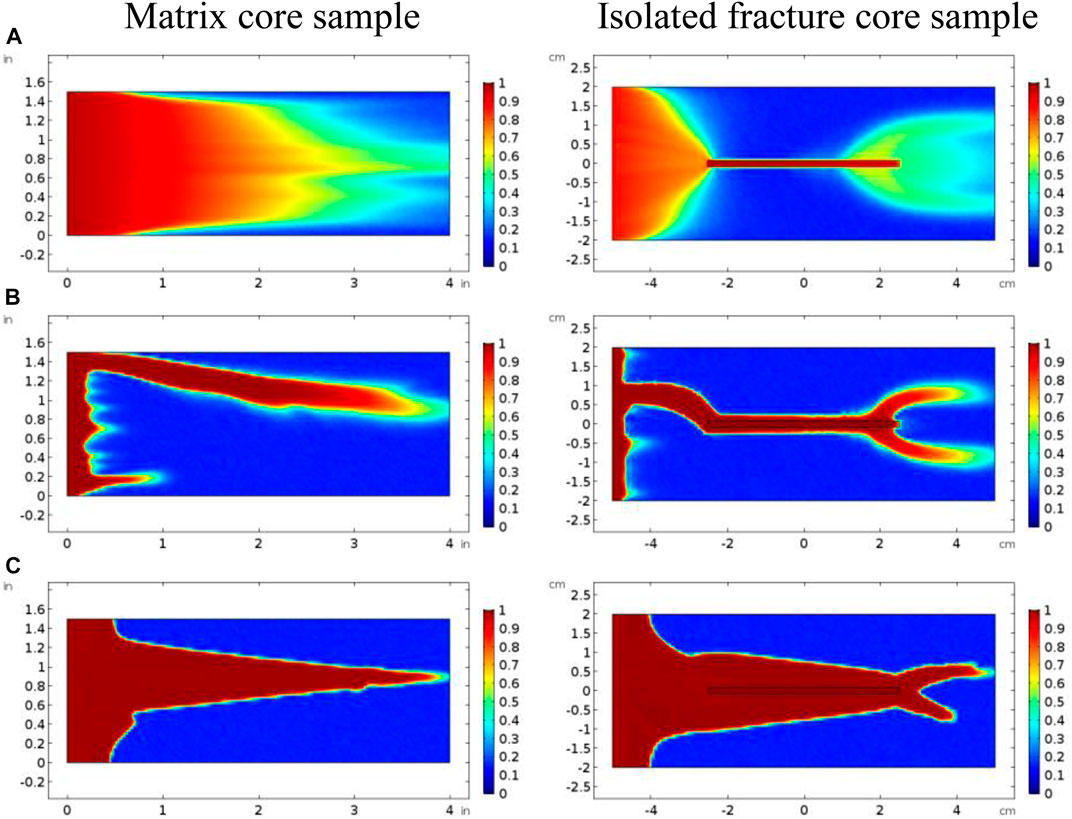
FIGURE 5. Comparison of dissolution images of matrix and isolated fracture core samples: (A) 0.1 cm/s; (B) 0.01 cm/s; (C) 0.001 cm/s.
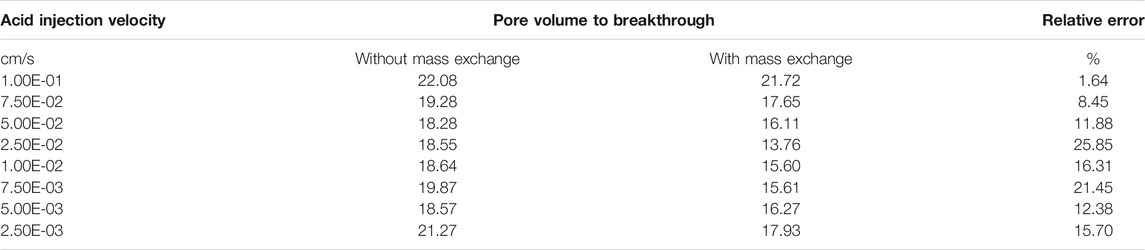
TABLE 2. Effect of mass transfer term on acidizing results of isolated fracture core sample.
Effect of Isolated Fracture Geometry
This section mainly studies the influence of fracture geometry on the stimulation process, including fracture length and fracture aperture. The fracture length is selected to vary from 3 to 8 cm, in which the fracture remains in the middle of the core sample with an aperture of 1.5 mm. The results show that the porosity of the core increases from 0.16 for a 3 cm fracture length to 0.18 for an 8 cm fracture length. The core permeability increases from 6.1 mD for a 3 cm fracture length to 15.1 mD for an 8 cm fracture length. The permeability and porosity of the matrix core sample correspond to 0.15 and 5 mD, separately. As for the influence of the aperture, the porosity increases from the matrix porosity of 0.15–0.18, corresponding to the fracture aperture of 3 cm. The permeability increases from the matrix permeability of 5 to 8.2 mD. Hence, different fracture lengths and apertures have a very limited effect on the growth of core porosity and permeability.
Figure 6 shows the acidizing curves corresponding to different fracture lengths. The results show that the acid breakthrough volume increases with the increase of the isolated fracture length. And, the existence of isolated fracture can obviously affect the distribution of pressure and velocity inside the core sample, as shown in Figure 7. Inside the matrix core sample, the acid fluid injection rate is parallel to the length direction of the core sample, and the pressure gradient also decreases uniformly along the core length. When an isolated fracture exists, the uniformly changing pressure gradient inside the matrix core sample is intuitively broken. The pressure within an isolated fracture is generally lower than the pressure of the matrix core sample. A pressure convergence zone and a pressure divergence zone separately forms at the inlet and the outlet boundaries of the isolated fracture. Hence, the fluid tends to flow into the convergence zone and the divergence zone and also leads to the formation of wormhole branches at the outlet boundary of the isolated fracture. Figure 8 continues to study the influence of fracture aperture on the acidizing results. The results show that the increase of the fracture opening can reduce the amount of acid consumed at breakthrough. High fracture apertures increase the affected domain generated by the isolated fracture and causes the acid solution migration within the core sample affected more obviously. More acid solution is induced by the high fracture aperture, resulting in less acid solution consumed.
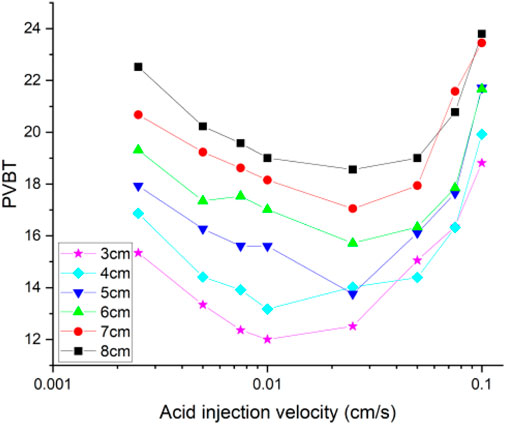
FIGURE 6. Isolated fracture acidizing curves of pore volume to breakthrough with different lengths.
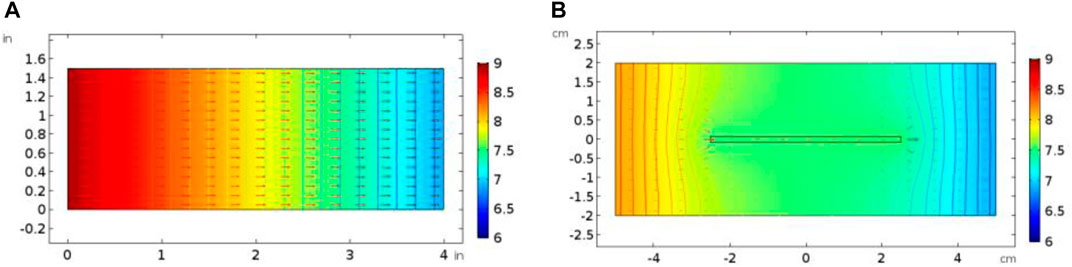
FIGURE 7. Comparison of velocity and pressure profiles with acid injection rate at 0.01 cm/s: (A) matrix core sample; (B) isolated fracture core sample.
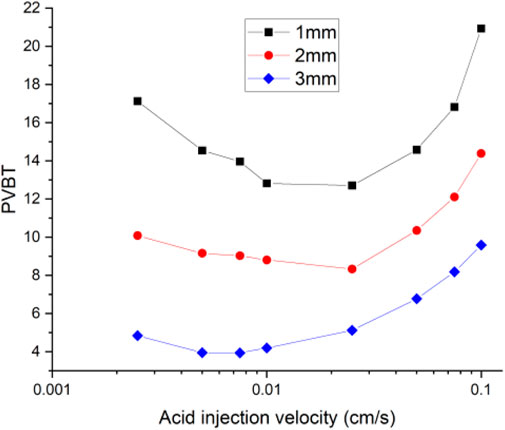
FIGURE 8. Isolated fracture acidizing curves of pore volume to breakthrough with different apertures.
Effect of Isolated Fracture Location
In this section, several cases are designed to study the isolated fracture locations on the acidizing results. The isolated fracture developed in the center of the core sample is selected as the reference comparison case. Here, nine different isolated fracture locations are assumed, covering the top, middle, bottom, left, and right positions. For the simplicity, these nine positions can be divided into three categories: left group (left-up, left-center, and left-down), center group (center-up, center-center, and center-down), and right group (right-up, right-center, and right-down). These nine types of core samples at different isolated fracture locations have the same porosity of 0.17.
Figure 9 compares the acidizing curves corresponding to different groups of fracture positions. It can be found that there is no obvious difference between the acidizing curves with the same group of isolated fractures in the up, center, and down positions. The difference in the acidizing curves becomes obvious between the different groups of left, center, and right positions. The acid consumption volume with the fracture position at the left boundary of the core sample is larger than the breakthrough volume of the acid corresponding to the fracture position at the right boundary of the core sample. When the fracture is located at the entrance boundary, the existence of fracture provides an advantageous channel for the migration of acid solution. During the acidizing process, the acid solution tends to migrate along the main direction of the fracture. Until the acid moves to the right end of the fracture, the acid begins to come into contact with the core sample with low permeability, which causes the acid solution not to be transported as efficiently as it moves in the fracture. The acid solution is forced to accumulate in the fracture and ineffectively consumed. More acid solution is used to increase the width of the fracture, as shown in Figure 10. When the fracture is at the outlet boundary, the acid tends to contact the fracture. Moreover, once the wormhole formed inside the matrix begins to contact the fracture, the core breakthrough can be easily realized. Because the fracture directly communicates with the right boundary, the negative acid accumulation no longer exists. Less acid is needed to break through the core.
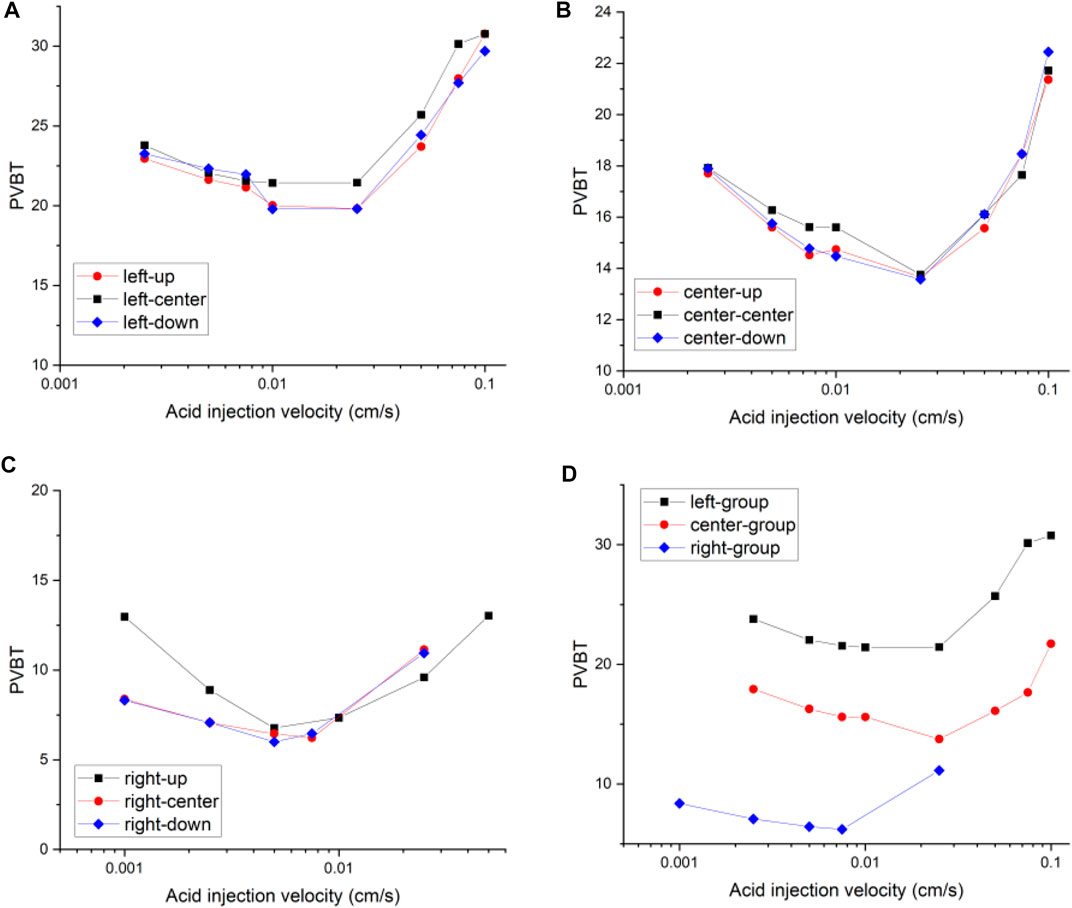
FIGURE 9. Isolated fracture acidizing curves of pore volume to breakthrough with different locations: (A) left group; (B) center group; (C) right group; (D) group comparison.
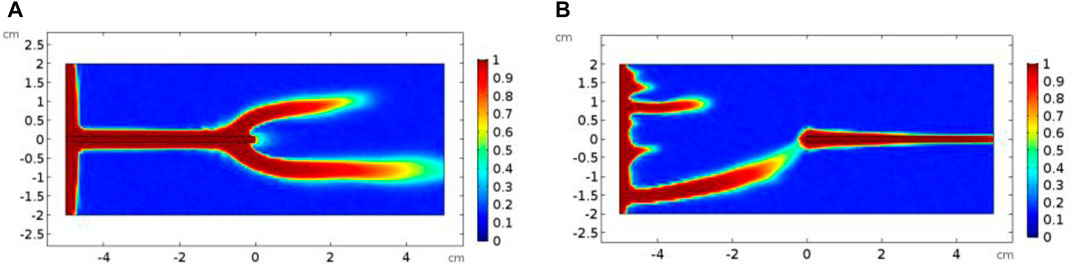
FIGURE 10. Comparison of dissolution images of isolated fracture core samples with different positions: (A) left-center; (B) right-center.
Effect of Isolated Fracture Morphology
This section studies the influence of fracture morphology on acidizing process by rotating the isolated fracture at a certain angle. Two rotation directions, clockwise and anticlockwise rotation, are adopted. Each type is rotated by 10, 20, and 30°, respectively. Finally, six different fracture morphologies are obtained. The isolated fracture results with 0° rotation is selected for reference comparison. Although the isolated fracture has different rotation angles inside the core sample, the change of permeability is not obvious. The permeability values are estimated around 7 mD, and the permeability of the matrix core corresponds to 5 mD. Figure 11 studies the acidizing curves corresponding to different rotation angles. The acidizing curves corresponding to different rotation angles are divided into the clockwise rotation and anticlockwise rotation groups. The results show that the change of the acidizing curve corresponding to different rotation angles of the same rotation sequence is very similar. The difference between them has not changed significantly both for clockwise rotation and anticlockwise rotation groups.
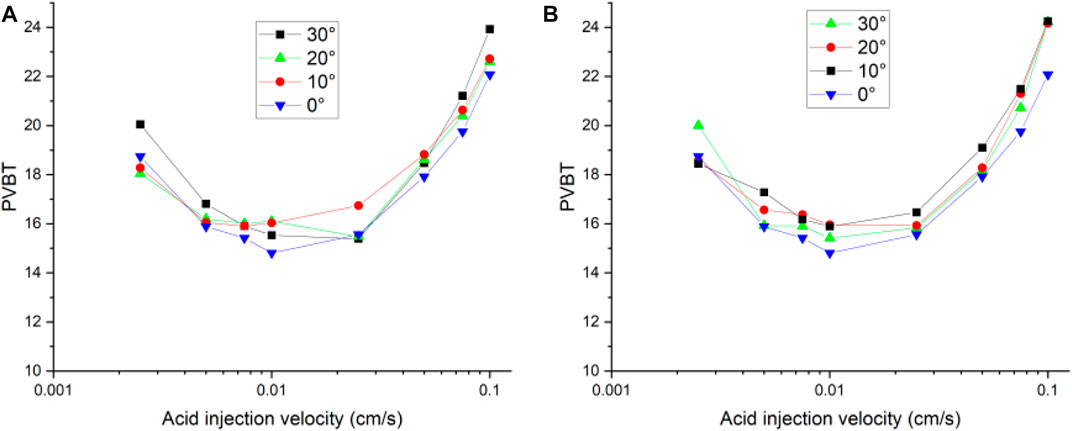
FIGURE 11. Isolated fracture acidizing curves of pore volume to breakthrough with different angles: (A) clockwise; (B) anticlockwise.
Then, we continue to consider an extreme case, in which the rotation angle of the isolated fracture reaches 90°, and the fracture is vertically distributed inside the core sample. Both the vertically distributed and the horizontally distributed isolated fractured cores have a porosity of 0.16. The permeability of vertical and horizontal isolated fracture cores is measured as 5.2 mD and 6.1 mD, respectively. The increase in porosity and permeability is still not obvious. However, the difference between the acidizing curves corresponding to the horizontally and the vertically distributed fracture begins to become obvious, as shown in Figure 12. Compared with the horizontal distribution of fracture, the vertical distribution of fracture simultaneously reduces the breakthrough volume of acid solution and the optimal injection rate. When the fracture is distributed horizontally, the horizontal tips of the fracture form a convergence zone and a divergence zone to attract the acid solution. The acid solution tends to penetrate the fracture through the inlet boundary and form a branch structure at the outlet boundary of the fracture, as shown in Figure 13. When the fracture becomes vertically distributed inside the core sample, the convergence zone and divergence zone are also formed around the fracture. Nevertheless, unlike the divergence zone formed by horizontal fracture, the divergence direction of the velocity corresponding to the vertical fracture divergence zone is consistent with the direction of core breakthrough flow. In contrast, the divergence zone formed by horizontal fracture maintains a certain angle with the direction of core breakthrough. Hence, the formation of the horizontal fracture divergence zone shows an impediment to the breakthrough of acid solution in contrast to vertically developed fracture.
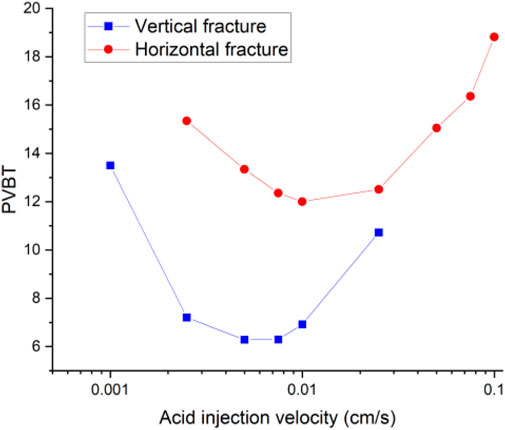
FIGURE 12. Isolated fracture acidizing curves of pore volume to breakthrough.
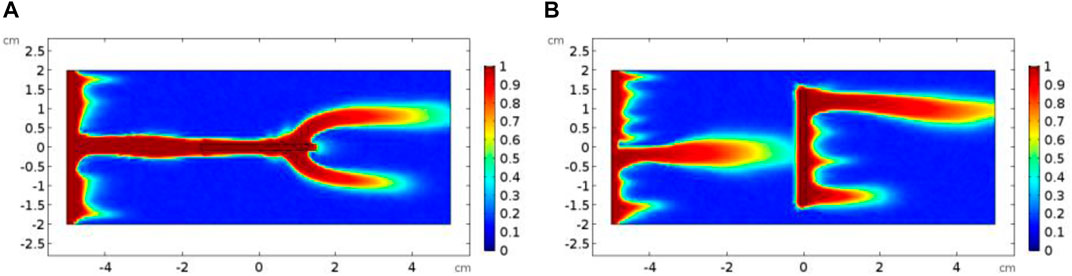
FIGURE 13. Comparison of dissolution images of isolated fracture core samples: (A) horizontal fracture; (B) vertical fracture.
Conclusion
Apart from the low-permeability matrix, carbonate rocks with isolated fractures are also the target reservoirs for the acidizing stimulation. In this study, the improved two-scale continuum model is used to study the acidizing process with an isolated fracture. Several cases are designed to present a comprehensive discussion on the isolated fracture parameters, including the isolated fracture geometry, location, and morphology. The main conclusions are summarized below:
1) Both the isolated fracture and the connected fracture have a limited influence on the core sample porosity. Only the connected fracture obviously increases the core permeability. The core sample with an isolated fracture is still the target core sample for the acidizing stimulation.
2) The isolated fracture provides an advantageous passage for the acid migration, in which the isolated fracture prevents more acid from being ineffectively consumed to dissolve the solid matrix reducing the amount of acid breakthrough.
3) Ignoring the mass exchange term still leads to an overestimated acid breakthrough volume, which is consistent with the conclusions obtained from the matrix acidizing process.
4) The existence of an isolated fracture also challenges the applicability of the Darcy equation at high injection rates.
5) The isolated fracture length, aperture, and position have an obvious influence on the acidizing process. The difference of the acidizing curve corresponding to different rotation angles has not changed significantly both for clockwise rotation and anticlockwise rotation groups.
Data Availability Statement
The original contributions presented in the study are included in the article/Supplementary Material; further inquiries can be directed to the corresponding author.
Author Contributions
CJ conceptualized the study, developed the methodology, and wrote the original draft; JY supervised and reviewed and edited the study; HX and HZ helped with software support; TH: supervised the study and carried out funding acquisition.
Funding
The authors are grateful for the financial support from the following sources: Zhejiang Provincial Universities and Research Institutes (Grant no. 2020J00009), National Major Science and Technology Projects of China (Grant no. 52034010), National Natural Science Foundation of China (Grant no. 52004246), Natural Science Foundation of Zhejiang Province (Grant no. LQ20E040003), and Science and Technology Project of Zhoushan Bureau (Grant No. 2021C21016), China scholarship council (201906450038).
Conflict of Interest
The authors declare that the research was conducted in the absence of any commercial or financial relationships that could be construed as a potential conflict of interest.
References
Balakotaiah, V., and West, D. H. (2002). Shape Normalization and Analysis of the Mass Transfer Controlled Regime in Catalytic Monoliths. Chem. Eng. Sci. 57, 1269–1286. doi:10.1016/s0009-2509(02)00059-3
Dong, K. (2012). Experimental Investigation for the Effect of the Core Length on the Optimum Acid Flux in Carbonate Acidizing. College Station: Texas A & M University.
Dong, K., Jin, X., Zhu, D., and Hill, A. D. (2014). The Effect of Core Dimensions on the Optimal Acid Flux in Carbonate AcidizingSPE International Symposium and Exhibition on Formation Damage Control. Lafayette, Louisiana, USA: Society of Petroleum Engineers, 10.
Fredd, C. N., and Fogler, H. S. (1999). Optimum Conditions for Wormhole Formation in Carbonate Porous Media: Influence of Transport and Reaction. SPE-56995-PA. 4, 196–205. doi:10.2118/56995-pa
Furui, K., Burton, R. C. C., Burkhead, D. W. W., Abdelmalek, N. A. A., Hill, A. D. D., Zhu, D., et al. (2012). A Comprehensive Model of High-Rate Matrix-Acid Stimulation for Long Horizontal Wells in Carbonate Reservoirs: Part I-Scaling up Core-Level Acid Wormholing to Field Treatments. SPE-56995-PA. 17, 271–279. doi:10.2118/134265-pa
Jia, C., Huang, Z., Sepehrnoori, K., and Yao, J. (2021). Modification of Two-Scale Continuum Model and Numerical Studies for Carbonate Matrix Acidizing. J. Pet. Sci. Eng. 197, 107972. doi:10.1016/j.petrol.2020.107972
Jia, C., Sepehrnoori, K., Huang, Z., and Yao, J. (2021). Modeling and Analysis of Carbonate Matrix Acidizing Using a New Two-Scale Continuum Model. SPE J., 1–30. doi:10.2118/205012-PA
Li, L., and Voskov, D. (2021). A Novel Hybrid Model for Multiphase Flow in Complex Multi-Scale Fractured Systems. J. Pet. Sci. Eng. 203, 108657. doi:10.1016/j.petrol.2021.108657
Liu, L., Huang, Z., Yao, J., Di, Y., and Wu, Y.-S. (2020). An Efficient Hybrid Model for 3D Complex Fractured Vuggy Reservoir Simulation. SPE J. 25, 907–924. doi:10.2118/199899-pa
Liu, P., Li, J., Sun, S., Yao, J., and Zhang, K. (2021). Numerical Investigation of Carbonate Acidizing with Gelled Acid Using a Coupled thermal-hydrologic-chemical Model. Int. J. Therm. Sci. 160, 106700. doi:10.1016/j.ijthermalsci.2020.106700
Liu, P., Yao, J., Couples, G. D., Huang, Z., Sun, H., and Ma, J. (2017). Numerical Modelling and Analysis of Reactive Flow and Wormhole Formation in Fractured Carbonate Rocks. Chem. Eng. Sci. 172, 143–157. doi:10.1016/j.ces.2017.06.027
Maheshwari, P., Maxey, J., and Balakotaiah, V. (2016). Reactive-Dissolution Modeling and Experimental Comparison of Wormhole Formation in Carbonates with Gelled and Emulsified Acids. SPE-191148-PA. 31, 103–119. doi:10.2118/171731-pa
Maheshwari, P., Ratnakar, R. R., Kalia, N., and Balakotaiah, V. (2013). 3-D Simulation and Analysis of Reactive Dissolution and Wormhole Formation in Carbonate Rocks. Chem. Eng. Sci. 90, 258–274. doi:10.1016/j.ces.2012.12.032
Meyer, B. R., and Bazan, L. W. (2011). A Discrete Fracture Network Model for Hydraulically Induced Fractures—Theory, Parametric and Case Studies. SPE Hydraulic Fracturing Technology Conference. The Woodlands: The Society of Petroleum Engineers (SPE). doi:10.2118/140514-ms
Moreno, L., Tsang, Y. W., Tsang, C. F., Hale, F. V., and Neretnieks, I. (1988). Flow and Tracer Transport in a Single Fracture: A Stochastic Model and its Relation to Some Field Observations. Water Resour. Res. 24, 2033–2048. doi:10.1029/wr024i012p02033
Muralidhar, K. (1990). Flow and Transport in Single Rock Fractures. J. Fluid Mech. 215, 481–502. doi:10.1017/s0022112090002725
Neuzil, C. E., and Tracy, J. V. (1981). Flow through Fractures. Water Resour. Res. 17, 191–199. doi:10.1029/wr017i001p00191
Palharini Schwalbert, M., Hill, A. D., and Zhu, D. (2019). A New Up-Scaled Wormhole Model Grounded on Experimental Results and in 2-Scale Continuum SimulationsSPE International Conference on Oilfield Chemistry. Galveston, Texas, USA: Society of Petroleum Engineers, 30.
Panga, M. K. R., Ziauddin, M., and Balakotaiah, V. (2005). Two-scale Continuum Model for Simulation of Wormholes in Carbonate Acidization. Aiche J. 51, 3231–3248. doi:10.1002/aic.10574
Sarmah, A., Farid Ibrahim, A., Nasr-El-Din, H., and Jackson, J. (2020). A New Cationic Polymer System that Improves Acid Diversion in Heterogeneous Carbonate Reservoirs. PE J. 25 (05), 2281–2295. doi:10.2118/194647-pa
Snow, D. T. (1969). Anisotropie Permeability of Fractured media. Water Resour. Res. 5, 1273–1289. doi:10.1029/wr005i006p01273
Tansey, J., and Balhoff, M. T. (2016). Pore Network Modeling of Reactive Transport and Dissolution in Porous media. Transp Porous Med. 113, 303–327. doi:10.1007/s11242-016-0695-x
Tansey, J. (2014). Pore-Network Modeling of Carbonate Acidization, SPE Annual Technical Conference and Exhibition. Amsterdam, Netherlands: Society of Petroleum Engineers, 10.
Tsang, Y. W., and Tsang, C. F. (1989). Flow Channeling in a Single Fracture as a Two-Dimensional Strongly Heterogeneous Permeable Medium. Water Resour. Res. 25, 2076–2080. doi:10.1029/wr025i009p02076
Tsang, Y. W., and Witherspoon, P. A. (1981). Hydromechanical Behavior of a Deformable Rock Fracture Subject to normal Stress. J. Geophys. Res. 86, 9287–9298. doi:10.1029/jb086ib10p09287
Wadekar, S., and Pandya, N. (2014). Use of Emulsified Acid System with Corrosion Protection up to 350°F, SPE Saudi Arabia Section Technical Symposium and Exhibition. Al-KhobarSaudi Arabia: Society of Petroleum Engineers, 6.
Wei, W., Varavei, A., Sanaei, A., and Sepehrnoori, K. (2019). Geochemical Modeling of Wormhole Propagation in Carbonate Acidizing Considering Mineralogy Heterogeneity. SPE-65400-PA. 24, 2163–2181. doi:10.2118/195593-pa
Wu, Y.-S. (2015). Multiphase Fluid Flow in Porous and Fractured Reservoirs. Houston: Gulf Professional Publishing.
Zakaria, A. S., and Nasr-El-Din, H. A. (2016). A Novel Polymer-Assisted Emulsified-Acid System Improves the Efficiency of Carbonate Matrix Acidizing. SPE-56995-PA 21, 1061–1074. doi:10.2118/173711-pa
Zhao, J., Kang, Q., Yao, J., Viswanathan, H., Pawar, R., Zhang, L., et al. (2018). The Effect of Wettability Heterogeneity on Relative Permeability of Two‐Phase Flow in Porous Media: A Lattice Boltzmann Study. Water Resour. Res. 54, 1295–1311. doi:10.1002/2017wr021443
Zhao, J., Qin, F., Derome, D., and Carmeliet, J. (2020). Simulation of Quasi-Static Drainage Displacement in Porous media on Pore-Scale: Coupling Lattice Boltzmann Method and Pore Network Model. J. Hydrol. 588, 125080. doi:10.1016/j.jhydrol.2020.125080
Zimmerman, R. W., Chen, D.-W., and Cook, N. G. W. (1992). The Effect of Contact Area on the Permeability of Fractures. J. Hydrol. 139, 79–96. doi:10.1016/0022-1694(92)90196-3
Keywords: fracture acidizing, two-scale continuum model, carbonate reservoirs, reactive flow, carbonate acidizing
Citation: Jia C, Huang T, Yao J, Xing H and Zhang H (2021) Effect of Isolated Fracture on the Carbonate Acidizing Process. Front. Earth Sci. 9:698086. doi: 10.3389/feart.2021.698086
Received: 20 April 2021; Accepted: 14 June 2021;
Published: 08 July 2021.
Edited by:
Weiqi Fu, China University of Mining and Technology, ChinaReviewed by:
Jiazheng Qin, Southwest Petroleum University, ChinaBo Ren, University of Texas at Austin, United States
Copyright © 2021 Jia, Huang, Yao, Xing and Zhang. This is an open-access article distributed under the terms of the Creative Commons Attribution License (CC BY). The use, distribution or reproduction in other forums is permitted, provided the original author(s) and the copyright owner(s) are credited and that the original publication in this journal is cited, in accordance with accepted academic practice. No use, distribution or reproduction is permitted which does not comply with these terms.
*Correspondence: Tao Huang, aHVhbmd0YW96am91QDEyNi5jb20=