 Timur Berdimbetov
- 1Key Laboratory of Regional Climate-Environment for Temperate East Asia, Institute of Atmospheric Physics, Chinese Academy of Sciences, Beijing, China
- 2University of Chinese Academy of Sciences, Beijing, China
- 3International Centre for Climate and Environment Sciences, Institute of Atmospheric Physics, Chinese Academy of Sciences, Beijing, China
- 4Ecology and Water Resources Management, Tashkent Institute of Irrigation and Agricultural Mechanization Engineers, Tashkent, Uzbekistan
- 5Nukus branch of Tashkent University of Information Technologies named after Muhammad-al Khorezmi, Nukus, Uzbekistan
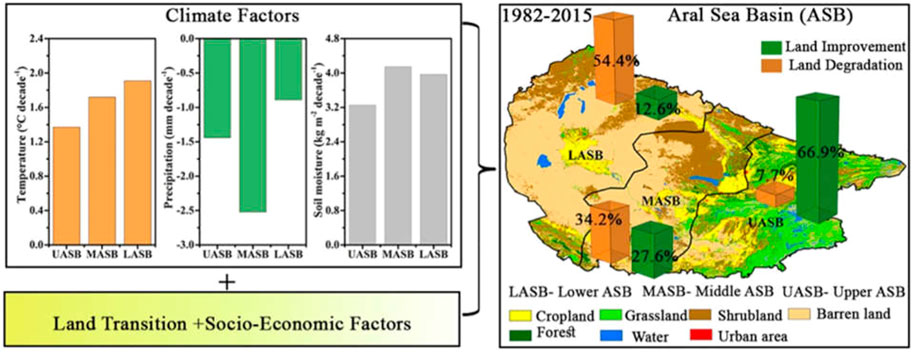
Land degradation is one of the critical ecological issue in the Aral Sea Basin (ASB). This study investigates land degradation in ASB during 1982–2015 using the Normalized Difference Vegetation Index (NDVI) as a proxy. The residual trend (RESTREND) for temperature, precipitation, soil moisture adjusted NDVI has been applied to identify the land degradation in ASB and quantify the contribution of climate factors such as temperature and rainfall. In addition, a binary logistic regression model is adopted to assess the contributions of land transition, socio-economic, and topographical conditions on land degradation. Based on RESTREND, the relative contribution of precipitation (30.2%), soil moisture (23%), and temperature (11.4%) indicates that precipitation is one of the main driving factors of land degradation. The results further revealed that 36.5% of ASB is degraded, which is mostly concentrated in the lower part of the ASB. In contrast, 33.2% of ASB depicts land improvement, especially in the upper part of the basin. According to the land transition assessment, 66.6% of the water area and 11.68% of forest converted to barren land and shrubland during the study period, respectively. The binary logistic regression model demonstrated water and forest area transitions into shrubland and barren land as the major contributors of contemporary land degradation in ASB. Cropland recorded a net increment by 2.69% of its initial area, and the abandoned cropland converted to shrubland and barren lands that negatively impacted land cover change. This in-depth analysis of land degradation can assist in designing pragmatic policy interventions for implementing land restoration plans in the area.
Introduction
Land degradation is a continuous process, presenting the loss of ecosystem function and decreasing productivity of agriculture and livelihoods (Reeves and Baggett, 2014; Chappell et al., 2016), negatively impacting the economies in developing countries (Nkonya et al., 2016). Pacheco et al. (2018) found 3–6% losses in the global agricultural gross domestic product (US $ 490 billion/year) resulting from land degradation. For national efforts to prevent and defeat land degradation and aid the land rehabilitation processes, identification of the primary drivers of land degradation such as climatic variations and anthropogenic disturbances (UNCCD, 1994) is essential (Reeves and Baggett, 2014; Willemen et al., 2018; Sun et al., 2019); however, it is a challenging task for the research community.
GRAPHICAL ABSTRACT
In Central Asia (CA), disrupting hydrological balance, land degradation (Jiang et al., 2019b), soil salinization (Saiko and Zonn, 2000), and frequent occurrence of dust storms (Micklin, 2007) are the most significant environmental issues. In recent years, land degradation has become one of the critical issues in the region (Asarin et al., 2010; Dubovyk et al., 2013; Jiang et al., 2019a; Jiang et al., 2019b). As a result of irrigated land expansion, water extraction from the largest river basin (Amu-Darya and the Syr-Darya) in CA has gradually increased (Lioubimtseva, 2014). It further enhances the water deficiency (Asarin et al., 2010) and leads to continuous land degradation, especially in Aral Sea Basin (ASB). For instance, 75% of the agricultural areas in the ASB have degraded over the last few decades (Lioubimtseva, 2014). It is further demonstrated by Jiang et al. (2019b), that water withdrawal for 1990–2000 was the most influential factor explaining the land degradation of croplands in the Amu-Darya River basin. Furthermore, Micklin (2007) reported that excessive water extraction from these two rivers led to the declining water level in the Aral Sea (Micklin, 2007) causing negative influences on marine ecosystems and the hydrological balance of the region (Khamzina et al., 2008).
Besides to anthropogenic influence, climate variables such as temperature, precipitation (Ibrahim et al., 2015), and soil moisture (Li et al., 2015a) are also considered as the key drivers of land degradation. Compared with other regions in CA, the air temperature has continuously risen over the ASB (Hu et al., 2014) where the mean temperature trend in the basin area increased by 0.46°C/decade between 1960 and 2015 (Berdimbetov et al., 2020), while the southern part of the ASB showed a prominent increasing trend. Consequently, the evapotranspiration over the region increased (Berdimbetov et al., 2020), which in turn has led to land degradation in the ASB (Small et al., 2001; Shibuo et al., 2007). On the other hand, Zmijewski and Becker (2014) revealed that precipitation over most parts of the ASB has not remarkably changed during the 1980–2010 period. In addition, the total water storage in ASB showed a declining trend with a rate of 2–4 cm/year for the 2002–2015 period (Berdimbetov et al., 2020), similar deductions were made by Zavialov et al. (2003) and Micklin (2007). These findings strongly suggest that land degradation over the region in past few decades attributes to observed climatic changes.
Several studies examined the effects of climatic variations on land degradation over CA (Dubovyk et al., 2013; Jiang et al., 2019a; Jiang et al., 2019b). However, few studies focused on identifying socio-economic and demographical changes in vegetation productivity in CA (Jiang et al., 2017). It is found that fewer studies have analyzed the land degradation process and associated mechanisms over ASB. Among them, Dubovyk et al. (2013) studied the effect of soil salinization, canal density, water use, and groundwater on land degradation in the northern part of ASB during 2000–2010. In addition, Jiang et al. (2019b), revealed that lower reaches of the Amu-Darya River basin have pronounced land degradation from 1990 to 2015 with increasing soil salinity. To the date, the impact of climate change and human activities on land degradation in the ASB is not yet fully understood due to limited interpretation of interconnected processes (Zhou et al., 2019).
Land degradation occurs due to temporal and spatial long-term decline of vegetation cover and primary productivity; therefore, the temporal decline of primary productivity in drylands is strong indication of land degradation (Ibrahim et al., 2015). The reduction of vegetation density is the most useful indicator for assessing land degradation process (Kundu and Dutta, 2011). Ibrahim et al. (2015), have used Normalized Difference Vegetation Index (NDVI) data to detect land degradation and its response to climate factors over Sub-Saharan West Africa from 1982 to 2015. Kang et al. (2017) used Moderate Resolution Imaging Spectroradiometer (MODIS) NDVI to analyze land degradation in the Tumen River Basin between 2000 and 2015. Singh et al. (2006) analyzed soil degradation based on a methodology of erosion area determination to calculate soil color from National Oceanic and Atmospheric Administration/Advanced Very High-Resolution Radiometer (NOAA/AVHRR) data in the upper Taquari River Basin.
Monitoring and analyzing the land cover and vegetation cover changes over the region immensely contributes to adopting effective policy measures for future decision-makers for the beneficial use of natural resources for land management practitioners. Therefor, this study aims to investigate the spatial patterns and temporal variations of land degradation based on vegetation productivity in the ASB and to examine the impacts of natural and socio-economic driving factors leading to land degradation.
The paper is organized as follows, Materials and Methods describes the study area, datasets, and methodology; Results contains the main findings; Discussion is dedicated to the discussion; Conclusion concludes the research.
Materials and Methods
Study Area
The Aral Sea is located in CA with a watershed basin comprising of 1.78 × 10⁶ km2 and is divided mainly between Kazakhstan (36.4%), Turkmenistan (20.2%), and Uzbekistan (18.5%); the rest of the area belongs to Kyrgyzstan (8.2%), Afghanistan (7.5%), Tajikistan (5.9%), and Iran (Figure 1A). The ASB is formed by two rivers, Amu-Darya and Syr-Darya taking their source in the glaciers of Tian-Shan, Pamir, and Tibetan Plateau (Gafforov et al., 2020). These two rivers are considered as the primary water source for the territory of CA (Unger-Shayesteh et al., 2013). The ASB can be divided into Amu-Darya (5.34 × 10⁵ km2) and Syr-Darya (4.02 × 10⁵ km2) river basins (Micklin, 2007; Zmijewski and Becker, 2014; Berdimbetov et al., 2021). Nearly 90% of the annual river runoff is consumed for agricultural purposes (Unger-Shayesteh et al., 2013) through, a net of irrigation channels constructed primarily in the upper and middle reaches of the basin (Figure 1B).
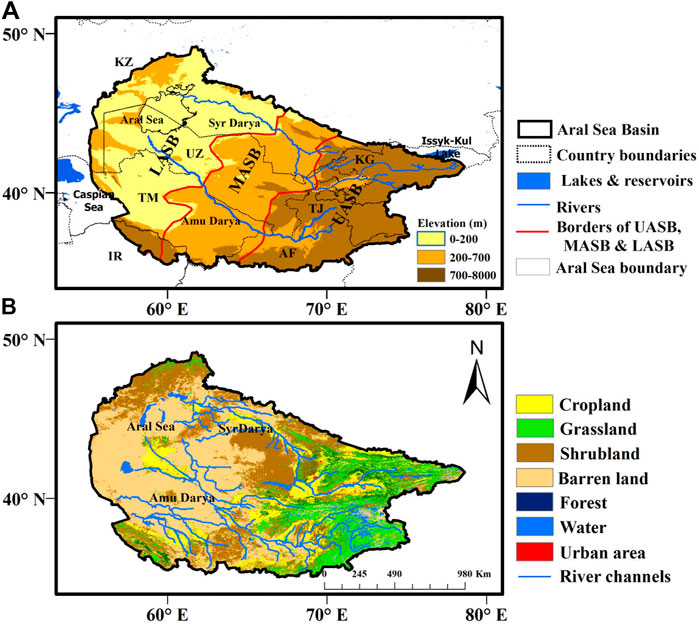
FIGURE 1. The general characteristics of Aral Sea basin (A) elevation map with main river channels, lakes, and reservoirs and (B) Land cover map for the year 2015 (Data sources: European Space Agency Climate Change Initiative). Red boundary lines demarcate the upper (UASB), middle (MASB) and lower (LASB) Aral Sea basin.
ASB frequently experiences extreme drought, summer heat, cloudlessness, and low precipitation (Micklin, 1998; Micklin, 2014; Guo et al., 2019; Berdimbetov et al., 2020). The annual total precipitation in ASB is about 100–400 mm (Gessner et al., 2013), while the annual precipitation over lower reaches of the basin is less than 50 mm (Lioubimtseva, 2014). The lowest (−30–−35°C) and highest 40–45°C temperature over the ASB is observed during the winter (December to January) and summer (June to August) seasons, respectively (Abdurahimov and Kurbanov, 2015; Berdimbetov et al., 2020).
Datasets
In this study, we acquired the Normalized Difference Vegetation Index (NDVI) dataset from Global Inventory Modelling and Mapping Studies (GIMMS) derived from the daily data record of the NOAA’s Advanced Very High-Resolution Radiometer (AVHRR). The data set has been improved by taking into account the image geometry, volcanic aerosols, and other effects not related to the change of vegetation itself (Tucker et al., 1985; Beck and Goetz, 2011). The 0.08° spatial resolution of GIMMS is available for the 1982 to 2015 period at a monthly timescale. In previous studies, the GIMSS NDVI data was successfully used for the analysis of vegetation change and land degradation (Ding et al., 2015; Ibrahim et al., 2015; Miao et al., 2015; He et al., 2017).
To determine LULC change, annual land cover maps from the European Space Agency Climate Change Initiative (ESA-CCI, 2017) with a resolution of 300 m are widely used (Liu et al., 2018; Georgievski and Hagemann, 2019; Aitekeyeva et al., 2020). This dataset is updated every year since 1992 and is considered to be a very useful data source for determining the long-term land cover change in large areas, especially over arid and semi-arid regions (Aitekeyeva et al., 2020; Pan et al., 2020). We also used this dataset to analyze the annual land cover conversion among the water, forest, cropland, grassland, barren land and urban areas, etc.
The climate data (air temperature, precipitation, and potential evapotranspiration) was downloaded from the University of East Anglia (https://crudata.uea.ac.uk/cru/data), Climatic Research Unit (CRU TS 4.0). This data product is based on monthly observational data from land meteorological stations worldwide (Harris et al., 2014) and is subjected to high-quality control (Mitchell and Jones, 2005; Jiang et al., 2019b). The CRU dataset covers climate data records from 1901 to 2015 (0.5° × 0.5° resolution). CRU data has been used to detect climate change in the CA region previously (Feng et al., 2018; Guo et al., 2019; Zhang et al., 2019). In previous studies, Huang et al. (2013) analyzed climate change in CA between 1971 and 2000 years using the CRU data. CRU data has been successfully used to detect annual precipitation changes in the CA region from 1901 to 2013 (Hu et al., 2017).
In addition, the monthly soil moisture data were obtained from the Global Land Data Assimilation System (GLDAS, https://disc.gsfc.nasa.gov) with a resolution of 0.25°, having a layer depth of 0–200 cm (Rodell et al., 2004). The GLDAS dataset was tested in the territory of CA. Li et al. (2015a) evaluated the effect of soil moisture (GLDAS) on climate and vegetation change in CA. Digital Elevation Model data (DEM) from Space Shuttle Radar Topography Mission (SRTM) is used for deriving the sub-regions, channel density, etc. In previous studies, SRTM DEM data has been widely used in hydrologic studies in the CA region, i.e., in the detection of river channels in the Arys and Keles (Kazakhstan, CA) river watershed area (Bissenbayeva et al., 2019), as well as in the identification of water networks in the lower part of Amu-Darya river (Liu et al., 2020).
The yearly population density, Gross Domestic Product (GDP) growth, and crop yield data were obtained from the Food and Agriculture Organization of the United Nations (FAOSTAT https://fao.org/faostat/) and the World Bank database (https://data.worldbank.org/).
Methods
ASB is divided into Lower (LASB; 0–200 m), Middle (MASB, 200–700 m), and Upper (UASB; 700–8,000 m) sub-regions based on the elevation range (Figure 1A). The LASB (0.75 × 10⁶ km2, MASB (0.51 × 10⁶ km2) and UASB (0.54 × 10⁶ km2) sub-regions covered 30.2, 28.1, and 41.7%, of the total ASB, respectively. The study described the general climate variation and vegetation features in ASB and further demonstrated land degradation and improvement between 1982 and 2015 year in the aforementioned three sub-regions. In this study, we mainly focus on the growing season lasting from April to September.
In this study, we use two methods: 1) residual trend (RESTREND) method and 2) binary logistics regression model. Based on the RESTREND method and using the NDVI and climate variables, we determine the spatial and time series of land degradation/improvement processes in the basin from 1982 to 2015. Based on the binary logistic regression model, we analyze the time series of the factors that may affect the land degradation/improvement processes in the basin. In the binary logistic regression model, the main factor is NDVI, and predicting the land degradation/improvement process based on the negative/positive role of other factors in its change. Here, we defined the period 1995–2015 as the study period due to the lack of long-term socio-economic and land cover change data. Accordingly, the time-series NDVI variation between 1995 and 2015 was applied separately to run the binary regression model. In previous studies, these two methods have not been used together, and these methods supplemented each other. We also analyzed the land transition process using the transfer matrix method in the basin during the 1995–2015 period. The following is a detailed description of the methods used in this study.
Residual Trend Analysis
Prior to analysis, we re-gridded original GIMSS NDVI, and CRU datasets into 0.25° and calculated long-term trends of temperature, precipitation, and potential evapotranspiration for each grid cells using a linear regression method (Tong et al., 2018; Liu et al., 2019). Furthermore, we applied the same techniques to calculate soil moisture using the GLDAS dataset. The widely used residual trend (RESTREND) method (Higginbottom and Symeonakis, 2014; Ibrahim et al., 2015; Luo et al., 2018; Zhou et al., 2019) is adopted to assess the changes in land degradation/improvement processes in ASB during the growing season. In order to use RESTREND, we calculated each pixel of NDVI and climate factors (temperature, precipitation, and soil moisture).
In the next step, the residual difference between the historical NDVI and expected NDVI is calculated using the linear regression model with either temperature, precipitation, and soil moisture as the explanatory variable (Ibrahim et al., 2015) as evident from Eq. 1 which was previously used by (Evans and Geerken, 2004; Roland and Mohammad, 2004; Luo et al., 2018).
Where:
Analysis of the Land Use Land Cover Change
This analysis of LULC change was performed to understand and assess the range and rate of changes over different periods. The range is presented as the area variation over the different LULC categories. Velocity change refers to dynamic trends in LULC change over different periods and signifies by comparing the spatio-temporal changes of different LULC categories. Areas and percentages of different LULC categories were calculated from the LULC classification results in the ASB.
Using the reclassify method for separating the land covers based on the Intergovernmental Panel on Climate Change (IPCC) land use categories (ESA-CCI, 2017), we divided the study area into seven main land cover types: cropland, shrubland, grassland, forest area, barren land, urban area, and water for the period of 1995–2015 (Anon, 2017). All processing of satellite images and GIS analysis for evaluation of LULC was performed using ArcGIS 10.3 and RStudio software.
Land Transition Change
A transfer matrix is a beneficial tool to analyze LULC that can quantify the trajectory of each LULC type (Hernández et al., 2016; Sang et al., 2019; Akodéwou et al., 2020). For quantitative analysis of change in different land-use classes, total area change
Where:
Binary Logistic Regression Model
With the binary logistic regression model, it is possible to examine the complex factors leading to land degradation (Dubovyk et al., 2013; Li et al., 2015b). Hence, we use a binary logistic regression model to assess the causes of land degradation and land improvement in the ASB with respect to land transition, socio-economic, and geographical factors (Eq.4).
Where
In estimating the process of land degradation or land improvement, we relied on the binary variable
Results
Spatial Distribution of Climate Variables and Normalized Difference Vegetation Index over Aral Sea Basin
According to Lennart and Humberto (2019), climate change intensifies the land degradation processes and introduces new degradation patterns. Therefore, we first investigate the general characteristics of climate variables and associated trends in the ASB region during 1982–2015. Figure 2 illustrates the spatial distribution of long-term climatology for temperature (TMP, °C), precipitation (PRE, mm), potential evapotranspiration (PET, mm/day), soil moisture (SM, kg/m2), and NDVI (this index defines values from −1.0 to 1.0) during the growing seasons. In ASB, the area-averaged mean temperature during the growing season is 20.2°C, while the lowest and highest temperatures recorded in the UASB and LASB are 6–14°C, and 22–26°C, respectively (Figure 2A). As shown in Figure 2B precipitation is mostly concentrated in UASB, while precipitation gradient (high to low) from UASB to LASB is identified. Results highlighted that the upper catchments of the Amu-Darya and the Syr-Darya received more than 35 mm/month precipitation during the growing season. Furthermore, we observed the lowest rainfall in the desert areas around the Aral Sea and north of Turkmenistan, as well as northeast of Uzbekistan (10–15 mm).
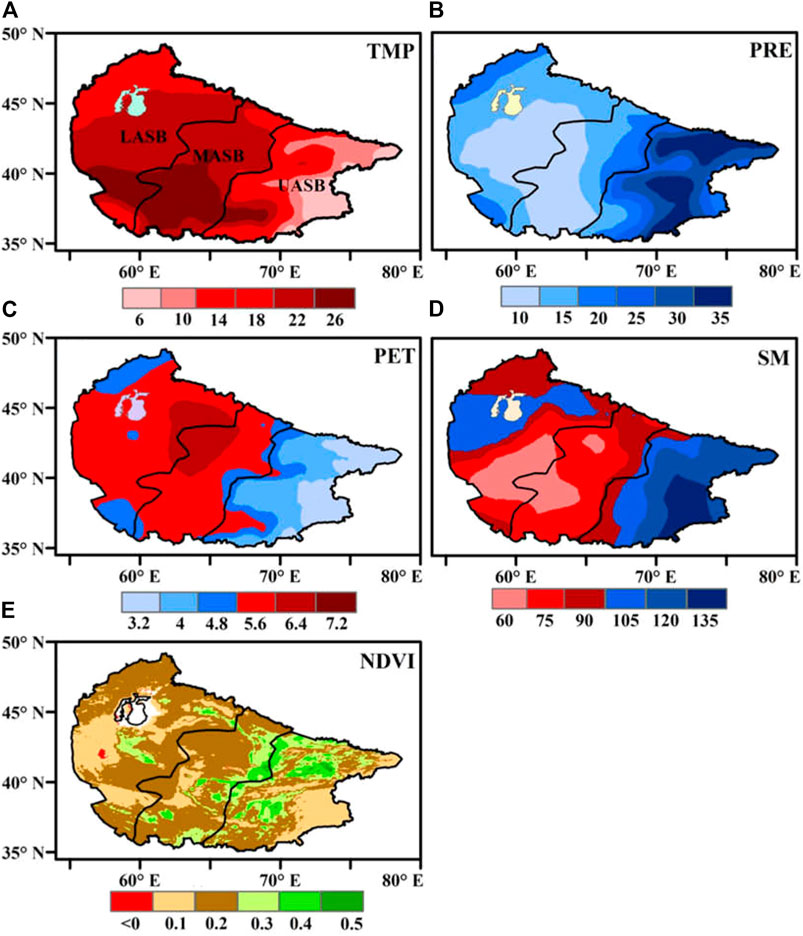
FIGURE 2. Spatial distribution of long-term climatology (1985–2015) for (A) temperature (TMP; °C), (B) precipitation (PRE, mm), (C) potential evapotranspiration (PET; mm day−1), (D) soil moisture (SM; kg m−2) and (E) NDVI during the growing season (from April to September). The UASB, MASB and LASB denote the upper, middle, and lower Aral Sea basin (black boundary), respectively.
The distribution of PET indicates low and high PET zones as shown in Figure 2C, where the lowest PET (3.2–4 mm/day) is recorded over UASB, which is ascribed to high precipitation and low temperature over the region. In contrast, the lowest precipitation and highest temperature enhance PET (5.6–7.2 mm/day) over the lower and middle parts of ASB. The spatial distribution of soil moisture (0–200 cm depth) during the growing season is shown in Figure 2D. The highest soil moisture (120–130 (kg/m2) is detected over the UASB, where the higher precipitation and lower PET are recorded. (Figure 2B). Furthermore, the results revealed that most of the LASB and MASB depicts relatively lower soil moisture content (60–75 kg/m2) except the nearby area of the Aral Sea.
The spatial distribution of NDVI for the growing season is shown in Figure 2E, where the high vegetation density is always associated with upper catchments of the Amu-Darya and Syr-Darya rivers. However, we observed lower NDVI over the extreme east of UASB, which is characterized by high elevation. In general, LASB, and MASB depicts low/moderate vegetation density, where deserts and shrubland are dominant (Figure 2E). Considering the area of extent, 39.81% of ASB is covered with the lowest vegetation density. Meanwhile, 36.1 and 19.6% of ASB recorded a low (0.13–0.20) and, moderate (0.21–0.3) NDVI value, respectively. The high and very high vegetation density (NDVI > 0.4) shows scarce distribution and accounts for a total of 8.33% area.
Long-Term Trend for the Selected Climate Variables over Aral Sea Basin
In this section, we investigate the long-term trend for temperature (TMP), precipitation (PRE), potential evapotranspiration (PET), and soil moisture (SM) over the ASB during the growing season (Figure 3). The results demonstrate a statistically significant
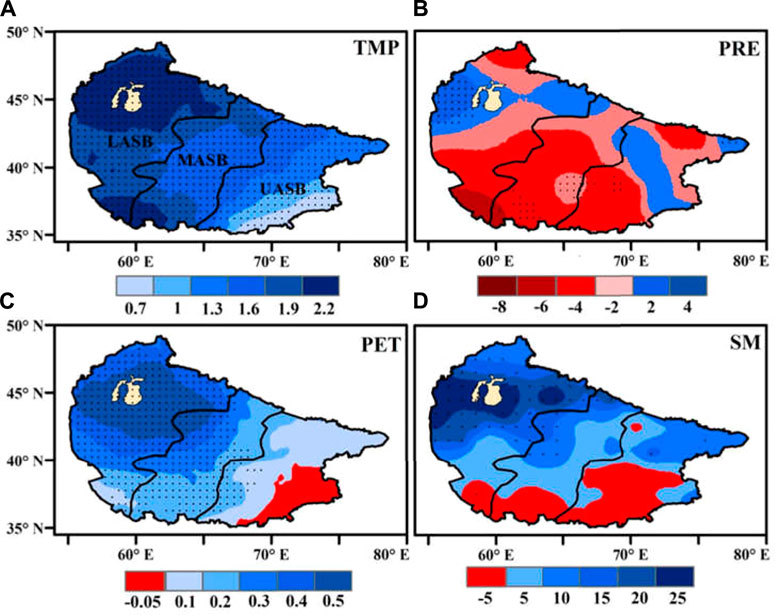
FIGURE 3. Spatial distribution of long-term trend for (A) temperature (TMP; °C decade−1), (B) precipitation (PRE, mm decade−1), (C) potential evapotranspiration (PET; mm day−1 decade−1), and (D) soil moisture (SM; kg m−2 decade−1) during the growing season (from April to September). The dots indicate a statistically significant trend at a 90% confidence level. The UASB, MASB and LASB denote the upper, middle, and lower Aral Sea basin (black boundary), respectively.
The long-term precipitation analysis revealed an insignificant negative trend over larger part of the basin (76%) during the 1982–2015 period. In this period, precipitation change shows an insignificant positive trend of 24% in the basin. The results further demonstrate that a large part of the ASB showed decreasing precipitation trend (–4.00 mm decade−1) during 1982–2015. The results show that rainfall is decreasing over the LASB and MASB except for the western and eastern parts of the Aral Sea (Figure 3B). In the UASB, we find decreasing precipitation over southern and northern parts, while precipitation over the central part of UASB is increasing at the rate of 2 mm decade−1. However, the precipitation trend is not statistically significant at a 90% confidence level except over small areas (in the northwestern and southeastern parts of the basin).
As shown in Figure 3C, lower and middle ASB depict the statistically significant increasing trend of PET during the growing season. In the UASB, we found a statistically non-significant increasing trend except for the southeastern part, where a weak negative trend in PET is dominant. In terms of area, 91.7% of the region shows an increasing trend in PET during the growing season, where the largest increasing trend (0.5 mm day−1decade−1) is observed over the Aral Sea (Figure 3C). We found that most of the LASB and MASB attributed to increasing soil moisture content during the 1982–2015 period except the small region located in the far south (Figure 3D). In UASB, the northern part depicts a non-significant increasing trend, while the southern parts show a decreasing trend of soil moisture during the study period.
Spatial and Temporal Relationship between Normalized Difference Vegetation Index and Climate Factors
Climate change has a considerable impact on vegetation (Piao et al., 2006; Peng et al., 2013; Hu et al., 2015). To understand the relationship between NDVI changes and climate variables in ASB from 1982 to 2015, the Pearson correlation was applied. During the growing season, the NDVI negatively correlated with temperature in 65% of the total area, of which a significant correlation was observed in 25% of the total area. The spatial distribution of significant correlations mainly belongs to the LASB. In opposition, 29.5% of the area is attributed to the positive correlation, where the significant correlation is recorded in the middle and upper reaches of the Amu-Darya River (Figure 4A). Interestingly, the relationship between PET and NDVI demonstrates an almost similar spatial distribution of temperature/NDVI correlation (Figure 4C). That is, NDVI showing a significant negative correlation with both climate variables (PET and TMP) in the lower parts of the basin and a positive correlation in the upper parts.
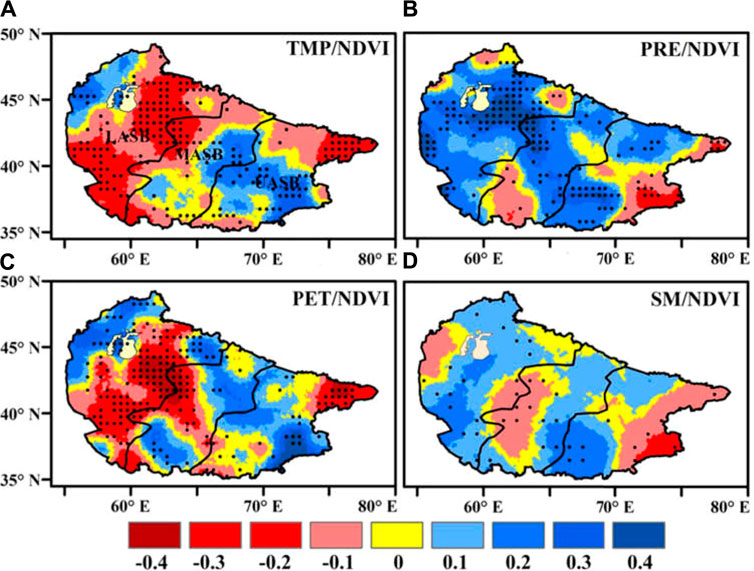
FIGURE 4. Spatial distribution of correlation between NDVI and (A) Temperature, (TMP; °C), (B) precipitation, (PRE; mm), (C) potential evapotranspiration, (PET; mm/day), and (D) Soil moisture, (SM; kg/m2) during the growing season (from April to September) for 1985–2015. The dots indicate a statistically significant correlation at a 90% confidence level. The UASB, MASB and LASB denote the upper, middle, and lower Aral Sea basin (black boundary), respectively.
In particular, a total of 68.2% of the ASB shows a positive correlation between NDVI and precipitation while 23.8% of the area showed a significant relationship in LASB and MASB (Figure 4B). However, the upper reaches of the Amu-Darya River and the southern parts of the basin recorded a negative relationship between NDVI and precipitation (Figure 4B). As shown in Figure 3D, 28.4 and 65.6% of the ASB presented a negative and positive correlation between soil moisture and NDVI, respectively.
Initially, we analyzed the spatial distribution of correlation among NDVI, temperature, precipitation, and soil moisture in ASB without specifying the vegetation types such as cropland, shrubland, etc. In this section, we discuss the relationship between climate factors and the NDVI of different land cover types in detail (Figure 5). Previous studies suggest that temperature has a positive correlation with all the land cover types during the growing season (Chu et al., 2019). However, NDVI of the desert (r = −0.49) and shrubland (r = −0.67) show a statistically significant negative correlation with temperature during the growing season from 1982 to 2015 (Figures 5A,B). It is obvious that continuous increase in temperature over barren and shrubland negatively affect the vegetation growth in the ASB. On the contrary, the increasing temperature further enhances vegetation development of grassland and croplands located in the low-temperature zone, because of activated photosynthesis, especially during the growing season. As a result, a statistically significant positive correlation between temperature and these two land types is observed (Figures 5C,D).
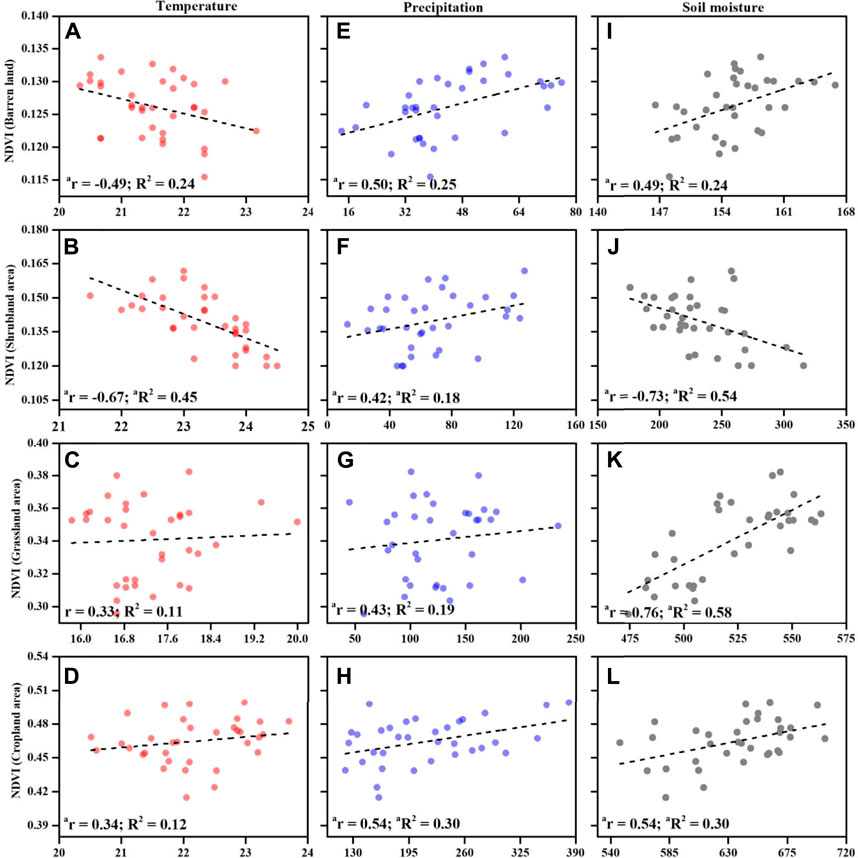
FIGURE 5. Correlation between Temperature and the NDVI on different land cover types (A) barren lands, (B) shrubland, (C) grassland, and (D) cropland in the ASB. The middle panels (E–H) and right panels (I–L) are the same as the left panels but for the precipitation and soil moisture, respectively. The dashed line represents linear fits, and R2 denotes the strength of the fits. The letter “a” indicates a statistically significant relationship at 90% confidence levels.
Conspicuously, we observed a positive correlation between all selected land cover types and precipitation (Figures 5E–H), where the comparatively higher correlation values are recorded for desert (r = 0.50) followed by shrubland (r = 0.42). This result demonstrated that precipitation was the major limiting climatic variable for vegetation development in these two regions and are also in line with Chu et al. (2019), who revealed that shrubland has slight positive coefficients with precipitation in the growing season. According to Chen et al. (2014), soil moisture acts as the main factor to the vegetation growth in dry regions. Our results are consistent with the aforementioned study, as shown in Figures 5I–L. It is revealed that NDVI in barren land and grassland areas produced a positive correlation with soil moisture. An obvious dependency of dryland vegetation on soil moisture can be explained through plant phenology sensitive to reduced moisture (Chen et al., 2014).
Furthermore, we performed linear regression to identify the climatic variables mainly influencing the NDVI of selected land cover types (Figures 5A–L). It is noticeable that the NDVI of the barren land is positively affected by precipitation (R2 = 0.25), and soil moisture (R2 = 0.24) and negatively by temperature (R2 = 0.24). The shrubland NDVI has a strong negative dependence on temperature (R2 = 0.45) and soil moisture (R2 = 0.54). Compared to the temperature (R2 = 0.11) and precipitation (R2 = 0.19), the grassland NDVI relies positively on soil moisture (R2 = 0.58) during the growing season. The cropland NDVI is mainly affected by the availability of precipitation (R2 = 0.30) and soil moisture (R2 = 0.30) and shows less weaker association with the temperature (R2 = 0.12). Our results show that the shrubland vegetation is more responsive to temperature variables while grassland and cropland showed stronger dependency on soil moisture. These findings revealed that soil moisture and precipitation greatly affect the vegetation (NDVI) of grassland and croplands, and these results are found to concur with previous studies (Su et al., 2020).
Spatial Distribution of the Residual Trends for Temperature, Precipitation, and Soil Moisture
It is well known that temperature, precipitation, and soil moisture substantially impact vegetation growth, with varying effects (Ibrahim et al., 2015). Hence, we also investigate the influence of climate factors on land degradation in ASB. Figures 6A,C,E represent the spatial distribution of RESTREND for the temperature/NDVI, precipitation/NDVI, and soil moisture/NDVI. Figures 6B,D,F show the spatial distribution of the significant residuals, which assist in identifying land degradation and land improvement.
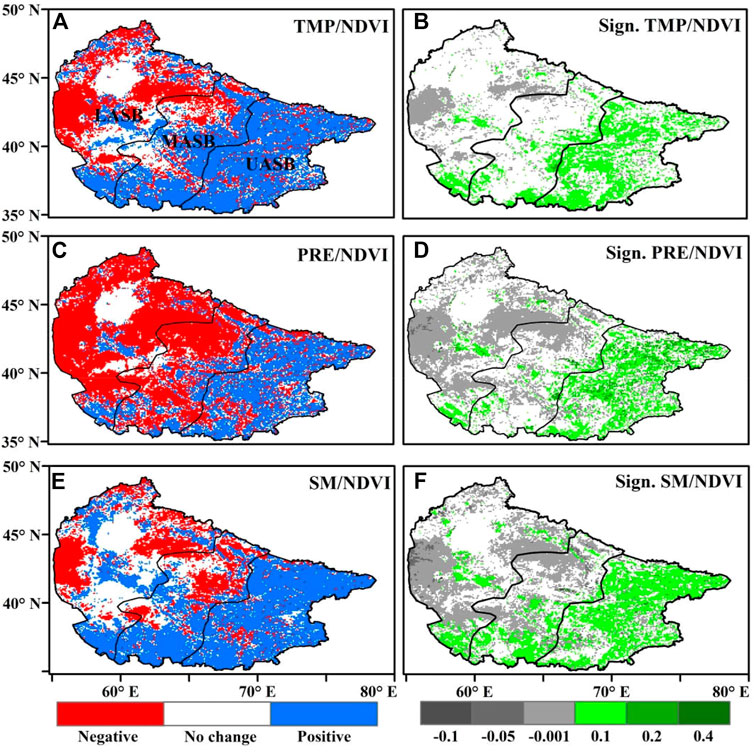
FIGURE 6. Spatial distribution of residuals trend (RESTREND) for NDVI against time (A) residual trend with temperature and (B) areas with significant trends. The middle (C, D) and lower (E, F) panels are the same as the top panels but for the precipitation (PRE) and soil moisture (SM), respectively. The UASB, MASB and LASB denote the upper, middle, and lower Aral Sea basin (black boundary), respectively.
The RESTREND for temperature depicts negative trends in most of the areas of LASB, while the statistically significant negative trend is mainly observed near the Aral Sea (Figure 6A). These negative RESTREND represent the temperature-induced land degradation. The contrasting pattern is detected in MASB where the few isolated patches indicate a significant trend suggesting that most of the MASB has a stable land cover change during the 1982–2015 period. Temperature-adjusted RESTREND shows an increasing trend over UASB, where 95% of the area depicts a statistically significant trend (Figures 6A,B).
In Figure 6C, Precipitation-controlled RESTREND depicts a decreasing trend, especially over the LASB, and MASB, while we found a statistically significant decreasing trend in most parts of LASB. In contrast, almost all parts of UASB shows land improvement with significant positive trends at a 95% confidence level. Compared to the precipitation, temperature-controlled RESTREND depicts degradation in the LASB but is less significant. According to the residual trends analysis, precipitation has considerable influences on land degradation over MASB than temperature (Figure 6D).
Similar to the temperature trend, soil moisture-adjusted RESTREND remains positive and concentrated over UASB, the south part of MASB and LASB, while negative trends are observed in west and northeast parts of the Aral Sea (Figure 6E). Notably, Figure 6F indicates that land degradation correlates significantly with soil moisture over LASB and MASB; whilst, the same Figure 6F provides a much more robust and consistent identification of areas showing land improvement, especially in UASB. Comparing Figures 6B,D,F, it is obvious that temperature, precipitation, and soil moisture equally contributed to land improvement in UASB.
We further identify the percentage distribution of land degradation/improvement area from RESTREND adjusted by temperature (TMP), precipitation (PRE), and soil moisture (SM) separately (Figure 7). The precipitation adjusted NDVI (NDVI/precipitation) recorded a negative change in 55.4% of ASB, while 30.2% of the area attributes a statistically significant negative change explaining the land degradation. Moreover, 31.5% ASB depicts a negative RESTREND for NDVI/temperature, while 11.4% of the total landmass recorded a statistically significant decreasing trend. According to the soil moisture adjusted RESTREND, 23.4% of the basin inherent negative trend, while 23% of the area recorded a significant negative trend during the study period (Figure 7A).
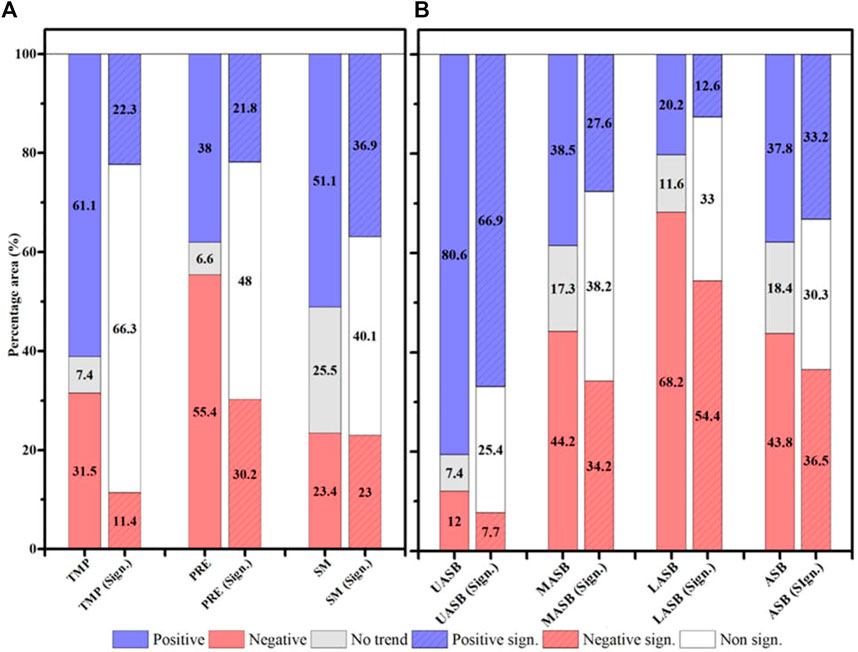
FIGURE 7. Percentage distribution of (A) land degradation/improvement area in whole ASB from typical samples residual trend adjusted by temperature (TMP), precipitation (PRE), and soil moisture (SM) separately. (B) is the same as (A) but for the sub-regions with considering three climate variables concurrently. The hatched bars showed a statistically significant residual trend at a 95% confidence level. The UASB, MASB and LASB denote the upper, middle, and lower ASB, respectively.
Considering the temperature control RESTREND, 61.1% of the ASB shows positive changes, but 22.3% of the area responds to temperature significantly marking land improvement. Figure 7A, further demonstrates that 21.8 and 36.9% of the ASB positively responds to precipitation and soil moisture, respectively. Results suggest that soil moisture plays a dominant role in the, land improvement process, followed by temperature and precipitation over ASB. In contrast, precipitation largely determines land degradation in ASB, while the temperature influence for land degradation is relatively weak.
We further calculate the percentage of the area that belongs to land degradation/improvement in the three sub-regions of ASB. For this purpose, temperature, precipitation, and soil moisture-controlled RESTREND are applied simultaneously. In the UASB, land improvement is dominant (66.9%) compared to land improvement in MASB and LASB. Relatively, land degradation (7.7%) is less pronounced over the UASB during the 1982–2015 period. It is evident that more than half of the land in LASB (55.4%) is degraded with time, while less prominent land improvement (12.6%) is recorded, which is mostly concentrated in the southern parts of the LASB. As shown in Figure 7B, the percentage area of land improvement and land degradation over MASB is 27.6 and 34.2%, respectively. Considering the whole ASB, it is highlighted that land degradation is marginally larger (36.5%) than land improvement (33.2%), while 30.3% of the area is remains unchanged.
Comparing the Normalized Difference Vegetation Index with Temperature, Precipitation, and Soil Moisture
It is common scientific understanding that decreasing NDVI is indicative of land degradation and strongly link with climate factors (Emmanuel, 2017; Lennart and Humberto, 2019). Hence, the impact of temperature, precipitation, and soil moisture on vegetation density (NDVI) in ASB was analyzed for the 1982–2015 period. In the temporal analysis, we first separated the negative and positive significant residual trends, ascribing land degradation (Figures 8A–C) and land improvement (Figures 8D–F), respectively. In the land degradation region, the residual trend for NDVI with temperature (0.295 × 10⁻³) is much smaller in magnitude compared to land improvement region (4.190 × 10⁻³) (Figures 8A,B). The results strongly suggests that temperature has positively affected land improvement in comparison to land degradation. Interestingly, we found that rainfall negatively affects land degradation (–1.426 × 10⁻³), while contrasting effects are observed for land improvement (0.562 × 10⁻³), suggesting less rainfall adversely affected land degradation over ASB (Figures 8C,D). In consistence with our findings, Huang and Kong (2016) have revealed precipitation as a major climate factor for vegetation development in arid or semi-arid regions.
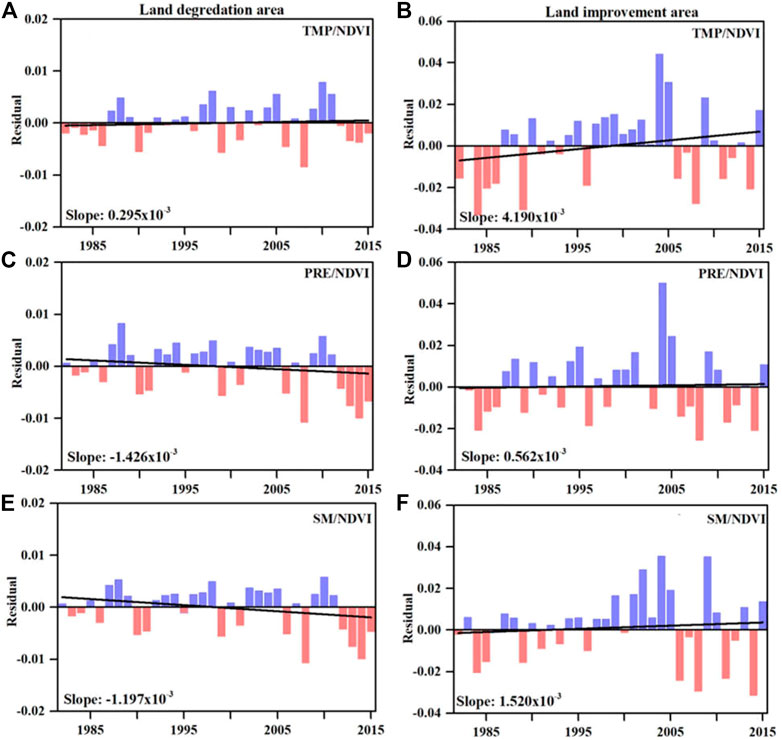
FIGURE 8. Time evolution of RESTREND for temperature adjusted NDVI (TMP/NDVI) in the (A) land degradation pixels and (B) land improvement pixels during the 1982–2015 period. The middle (C, D) and lower (E, F) panels are the same as the top panels but for the precipitation adjusted NDVI (PRE/NDVI) and soil moisture adjusted NDVI (SM/NDVI), respectively. The black line represents the linear fits, and the associated slope is shown on the bottom left side of each figure. The light blue and pink bars denote negative and positive residuals.
Previous studies explaining the combined impact of temperature, precipitation and soil moisture on the vegetation greenness in CA are limited so far. Zhou et al. (2015) analyzed the contribution of climatic influences to dryland vegetation changes of CA during the period 1982–2011 and reported a warming trend in CA which initially intensified greening of vegetation before 1991, but the continued warming trend subsequently became an overwhelming factor in further greening. Precipitation majorly influenced larger areas of vegetation in 1992–2011 compared to 1982–1991. Li et al. (2015a), also confirmed that the hydrothermal conditions of vegetation in arid regions of CA mainly depends on temperature and precipitation changes. The relationship between modeled root-zone soil moisture and vegetation activity for the Mongolian steppe during the period 1982–2005 reported a stronger correlation with soil moisture than with precipitation and supported that the vegetation activity is primarily controlled by the respective year’s soil moisture in the root system (Nandintsetseg et al., 2010). Contrary to our study, the previous research on vegetation dynamics of dryland regions of Xinjiang (China) showed a weaker influence of vegetation on soil moisture variability as compared to precipitation and temperature (Wang et al., 2019).
The negative residual trend for NDVI with soil moisture (–1.197 × 10⁻³) suggested that soil moisture has negative effects on land degradation (Figure 8E). It is further proved by (Figure 8F) where the soil moisture has a positive influence (1.520 × 10⁻³) on land improvement. Based on these facts, the precipitation/NDVI residual trend is more prominent than the soil moisture/NDVI residual trend in land degraded areas. The NDVI residual trend combined with precipitation and soil moisture shows high negative values for the land degraded area, especially in 1990, 2006, and 2008 (Figures 8C,E). Remarkably, all climate variables inherited negative RESTREND during 2011–2015. In the land improvement areas, the residual trend has been positive for many years, especially between 2000 and 2005.
Spatial and Temporal Characteristics of LULC Change
Figures 9, 10 show the LULC changes observed in the ASB from 1995 to 2015. According to the spatial land cover distribution (Figure 9), the area is mainly dominated by barren land and shrubland. These two land cover types mainly occupied the middle and lower reaches of the basin. The area of the barren land in 1995 (Figure 9A) was 762.3 × 10³ km2 (42.39% of the total area), while in 2015 (Figure 9E) it expanded by 0.35%–768.4 × 10³ km2 (42.74% of the total area) (Figure 10E). The barren land change also shows a sharp rise of 5.7 × 10³ km2 (0.3%) and 3.8 × 10³ km2 (0.21%) in 2003 and 2009, respectively, compared to previous years (Figure 10E). The shrubland area was 395.7 × 10³ km2 (22% of the total area) in 1995 (Figure 9A). Year 2004 shows an obvious increase in the area of shrubland, with an increasing rate of 0.38% and a continuous expansion over the following year (Figure 10B).
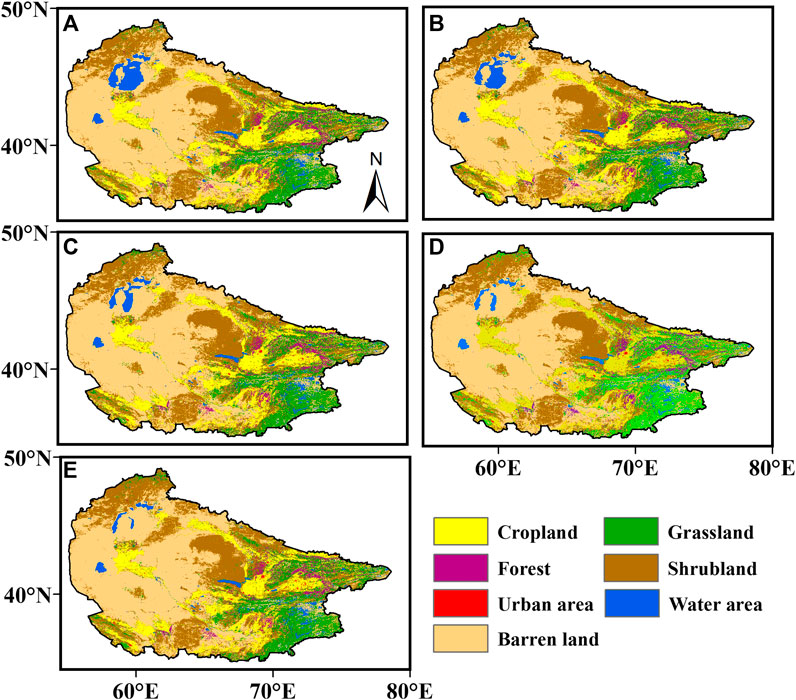
FIGURE 9. Land use and land cover (LULC) changes in the Aral Sea Basin for (A) 1995, (B) 2000, (C) 2005, (D) 2010 and (E) 2015.
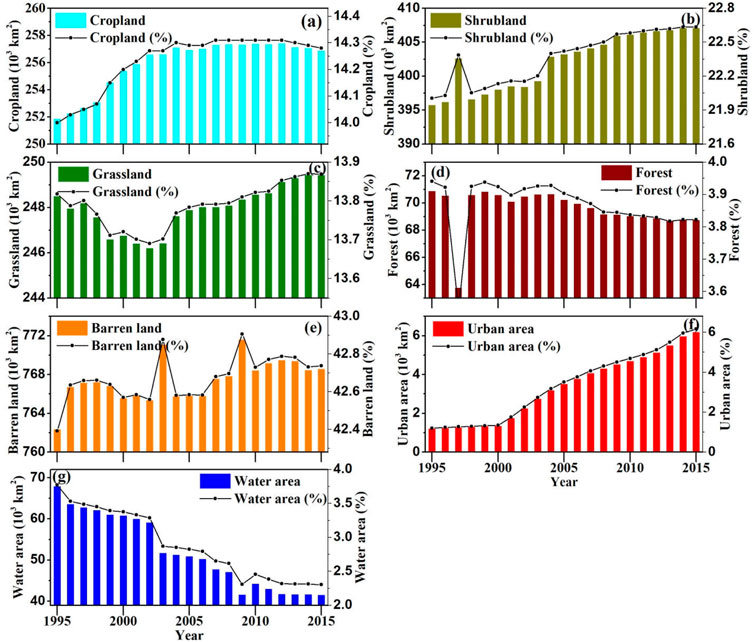
FIGURE 10. Temporal changes of (A) cropland, (B) shrubland, (C) grassland, (D) forest, (E) barren land, (F) urban area, and (G) water area in ASB for the period of 1995–2015. The black line denotes annual changes in percentages (%) of land cover categories.
The third-largest land cover type is the cropland, which accounted for approximately 14.23% between 1995 and 2015 and increased by 0.28% over the study period (Figure 10A). Cropland is mainly distributed along river tributaries and occupies large areas in the upper parts of the basin, as well as in the southwest and southeast parts of the basin. The fourth-largest land cover type is grassland, which in 1995 accounted for 248.5 × 10³ km2 (Figure 9A), approximately 13.82% of the total area. Although no distinct long-term trend of the grassland was found during the study period, there was an obvious trend shift in 2004; significant declining and increasing trend were found before and after 2004, respectively. In 2015, the grassland accounted for 13.87% of the total area (Figure 10C).
The distribution of the forest only can be clearly seen in the small areas at the upper most reaches of the basin. In 1995 and 2015, the forest area was 70.9 × 10³ km2 and 68.8 × 10³ km2, respectively, and its area decreased by 0.12% during this period (Figure 10D). The area of water decreased significantly from 1995 to 2015; it was 67.9 × 10³ km2 (3.77%) in 1995, and 41.4 × 10³ km2 (2.3%) in 2010 (Figure 10G).
Although the urban land makes up for a very small part of the total area, it showed a continuous expansion during the study period, from 1.2 × 10³ km2 (0.07%) in 1995 to 6.17 × 10³ km2 (0.34%) in 2015 (Figure 10F), approximately four times larger as compared to the initial year of the study.
Land Transition in Aral Sea Basin
In the previous section, RESTREND demonstrates how temperature, precipitation, and soil moisture affect land degradation/improvement in ASB. However, it is also associated with the natural and human-induced land transition. For instance, the conversion of forest to pasturelands can provoke soil erosion and modify soil structure (Li et al., 2015b; Hernández et al., 2016), ultimately leading to land degradation. Therefore, we also inspected the quantitative aspect of the land transition among major land cover types such as cropland, barren land, etc., during 1995–2015.
According to the quantitative analysis of land transition during the 1995–2015 period, the highest reducing rate is inherited for the water area (–66.6%), which can be ascribed with water area conversion mainly into barren land (65.67%) during 1995–2015. The observed decline in the water area in the region is coherent with the reduction of Aral Sea water volume (Micklin, 2007). During this period, forest cover reduced at the rate of 11.68% due to the transition of the forest to shrubland (3.53%), grassland (3.19%), urban areas (2.33%), and barren lands (1.33%).
During the study period, cropland is converted mainly into shrubland, urban and barren land; meanwhile, some forest and grassland is converted into the cropland. In general, cropland is increasing with the rate of 2.69% between 1995 and 2015 year because the gain area (5.5%) is larger than losses (2.81%). An urban area is also expanded (3.56%), by gaining area from the forest (2.33%), followed by grassland (0.67%), and croplands (0.41%). We further observed the expansion of barren land and shrubland by 65.83 and 5.88%, respectively, by converting water, forest, and cropland (Table 1).
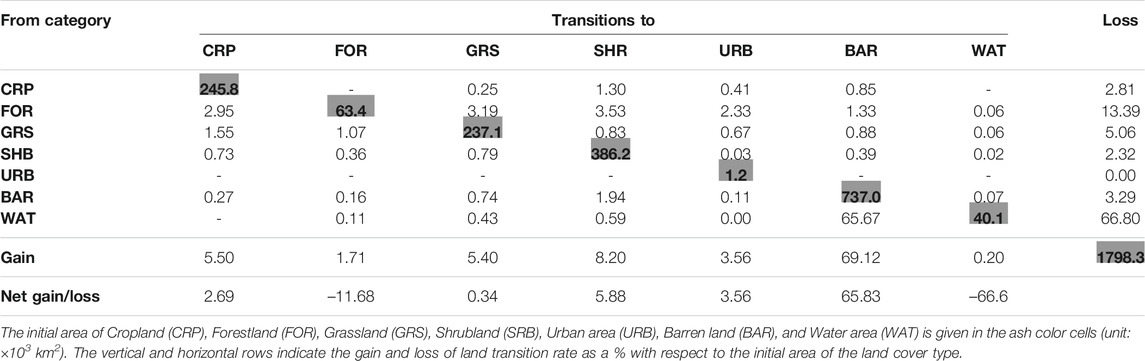
TABLE 1. Area transition matrix of the ASB from 1995 to 2015.
Evaluate the Driving Factors for Land Degradation
In addition to land transition, demographical, and geographical factors also contribute to land degradation (D’Odorico et al., 2013). In this study, we investigate the effect of these three factors on land degradation using the binary regression method. The positive and negative coefficients for the driving factors with NDVI imply land improvement and degradation, respectively. In this section, based on available data (social-economic, land cover transition and other data), we have defined the period 1995–2015 as the study period. Correspondingly, the mean annual NDVI value (Figure 11A) observed in the basin was used in this period. The negative coefficient for the conversion of water area to barren land (−26.90) and shrubland (−38.18) revealed land degradation over the region. The conversion of cropland to shrubland shows a significant negative coefficient, which also suggested land degradation in the ASB (Table 2).
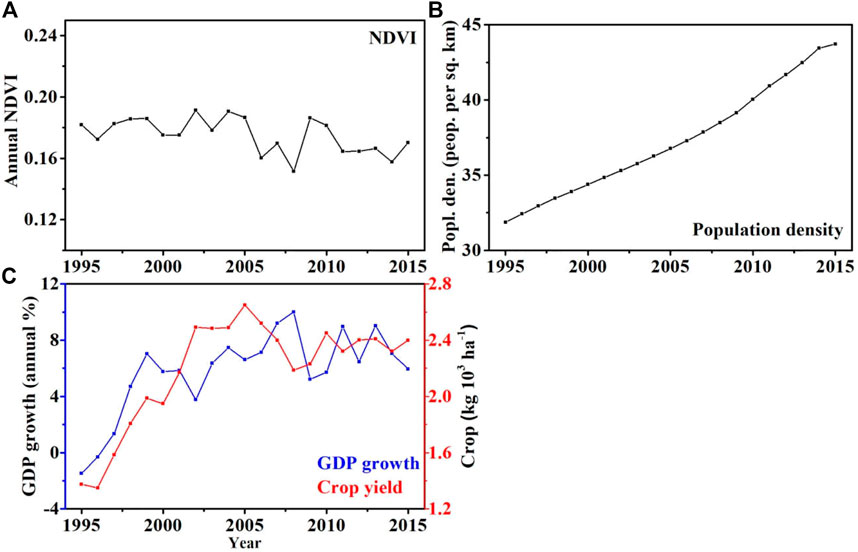
FIGURE 11. Changes of the (A) NDVI in the ASB during the 1995–2015, (B) Population density (unit) and (C) GDP growth (blue line, unit: annual %) and crop yield (red line, unit: kg 103 ha−1) in Central Asian counties (Uzbekistan, Turkmenistan, Kyrgyzstan, and Tajikistan) from 1995 to 2015.
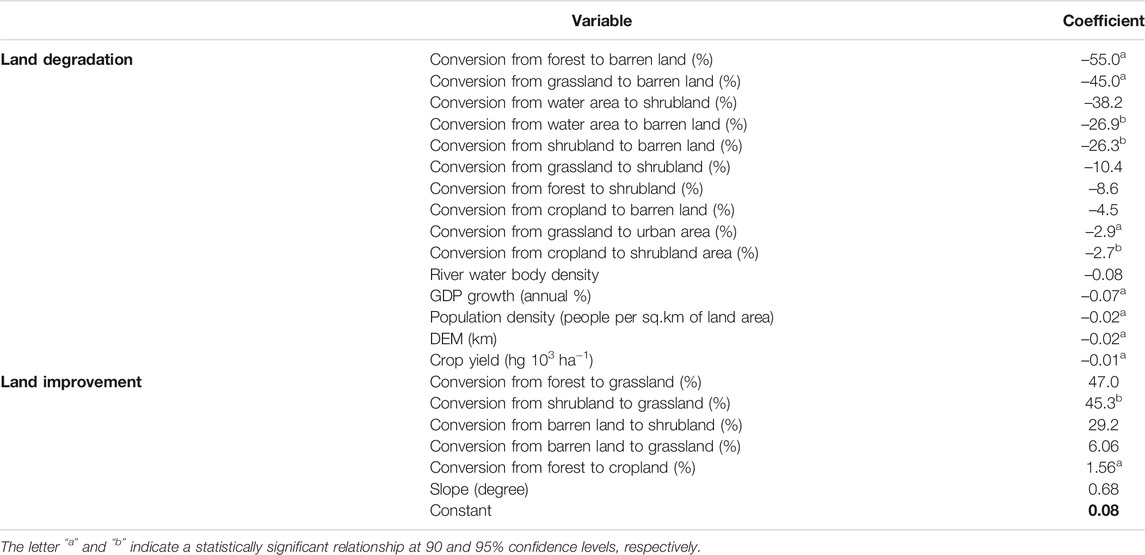
TABLE 2. Results from binary logistic regression analyses for the land transition, demographical and geographical forces of land degradation.
We found a significant inverse relationship between the demographic processes and NDVI fluctuations within the region. Population growth in the region (Figure 11B), increased demand for housing and other facilities leads to reduction of forests and hence exacerbating land degradation in the region. Moreover, annual GDP growth and changes in crop yields (Figure 11C) also exhibits a negative relationship with NDVI, which revealed that socio-economic processes have a negative impact on the observed land change.
The average GDP of Uzbekistan, Tajikistan, Turkmenistan, and Kyrgyzstan in the basin area increased by 59.8% between 1995 and 2015 and mean crop yields by 60.39%. However, these factors did not contribute to the increase in land quality. The economic causes leading to land degradation can be connected to the post-1990’s marking as a turning point for CA, with the GDP of the new republics declining sharply and making food security a priority for these nations (Robinson et al., 2012). Although the policy of state-financed agriculture in Turkmenistan and Uzbekistan continued, yet the level of support was much lower than before (Babu and Sengupta, 2006). In other republics of CA, subsidies and wages have disappeared, leading to livestock as currency (Robinson, 2016). Furthermore, the community structures collapsed in some places, land reforms started, which ultimately leads to the declining individual land-use rights. Former workers were suddenly transformed into farmers with the right to use local land (Robinson, 2016). The trend of changing livestock mobility in the region has also declined sharply (Robinson et al., 2012). To overcome the food insecurity in the region, promoted the production of fodder crops, wheat, and rice (Suleimenov et al., 2006; Sedik, 2012) caused the declining of cotton production. The negative correlation between economic performance and land cover change may be due to poor land use in the region and water shortages in agricultural production.
Dubovyk et al. (2013) found that cropland degradation in the northern part of Uzbekistan, as well as the lower reaches of the Amu-Darya River, occurred due to lower canal density and high demand for water use. Similarly, our results demonstrate a negative relationship between NDVI and river body density which suggested that less river water body density (Figure 1B) causes land degradation. Based on the binary regression, we detected that elevation also affects land cover change negatively. The land conversion from forest and shrubland to grasslands is a strong evidence of land improvement over the ASB region. In addition, the conversion of barren land into shrubland and grassland further supports land improvement in the region (Table 2).
Discussion
According to the results, the temperature over ASB is increasing significantly; this is consistent with the findings of (Berdimbetov et al., 2020), who identify the positive trend in temperature for the 1960–2015 period. This study found that most of the ASB experience decreasing precipitation. Jiang et al. (2019b) also found decreasing precipitation over the Amu-Darya river basin occupied in the bottom part of the ASB. As a result of irrigation practices during the growing season and the rise of the shallow groundwater in the basin, the soil moisture increases except for the southern part of the three sub-regions (Li et al., 2015a).
It is well known that the amount of precipitation could explain the variations of NDVI in arid environments (Martiny et al., 2006). Peng et al. (2011) found the increase of growing season NDVI attributed to the warming trend and more precipitation, while less precipitation with warming trends lead to the decrease of growing season NDVI in northern China. Similarly, during the growing season, NDVI in LASB, and MASB decreased due to the weakening precipitation over the two regions; however, increasing temperature showed less influence on land degradation. Ibrahim et al. (2015) also reported declining precipitation as the leading cause of less vegetation growth in Sub Saharan and eastern Africa. In contrast to our findings, Kalisa et al. (2019) suggested that the temperature significantly and more strongly influences the NDVI in the shrubland areas rather than precipitation.
Li et al. (2015a) revealed that the amount of soil moisture and shallow groundwater has been on the rise in CA and caused increase in soil salinization in the root zone. As a result, it does not assist in developing the land cover status of the barren and shrubland in ASB. Similar to our finding, Jiang et al. (2019b) revealed that the rise in the groundwater table inevitably impacted the soil salinization in this lower parts of ASB. At the same time, an increase in evapotranspiration under the influence of high temperature leads to decrease in water content in the soil, consequentially damaging the shallow roots of desert plants (Li et al., 2015a). This study found that increasing evapotranspiration has a negative influence on vegetation development, especially over barren and shrubland in LASB.
In contrast to LASB, land improvement is dominant in UASB with increasing soil moisture, precipitation, and temperature. Among these factors, temperature largely contributes to land improvement in the region. Because increasing temperature supports plant growth and development in high-elevation in comparison to low elevation areas. In addition, soil moisture has stronger influence than precipitation on land improvement. Ibrahim et al. (2015) also showed that vegetation development has a stronger relationship with soil moisture than rainfall. Based on these facts, the NDVI demonstrates differential responses to the climate factors according to the land cover types and sub-regions in ASB.
The findings suggest that 54.5% of land area in LASB is degrading during the 1982–2015 period due to less precipitation and increasing temperature. Moreover, increasing soil salinization with shrinking Aral Sea water volume (Micklin, 2007; Jiang et al., 2019b) also promotes land degradation in grasslands and sparse vegetation areas. In particular, most of the degraded area in LASB is located in the nearby Aral Sea, identified as a highly sensitive area for desertification (Jiang et al., 2019b).
In the UASB, croplands are gradually expanding due to the extensive irrigation and water regulation (Schettler et al., 2013), is the reason for, the land improvement by 66.9% of the basin. The results of the present study confirms that the proportion of land degradation (36.5%) is higher than the amount of land improvement (33.2%) during this period. In line with our findings, land degradation in the Amu-Darya river basin (bottom part of ASB) is comparatively larger than land improvement (Jiang et al., 2019b).
Land degradation is the result of a combination of drivers (D’Odorico et al., 2013) such as land transition, population growth, agricultural practices, climate factors, and irrigation. Therefore, we also investigate land transition over ASB. Previous studies found that most of the grasslands and water areas in CA disappear or convert to sparse vegetation (Saiko and Zonn, 2000; Dubovyk et al., 2013). Inconsistent with previous findings, we also observed 65.67% of the water area in ASB converted to barren lands. Zewdie and Csaplovics (2016) pointed out that forest loss is an indicator of ecosystem degradation. It is found that forests in ASB shrink (11.68%) during 1995–2015 due to the gradual expansion of barren land and shrubland.
Land degradation can be triggered by anthropogenic disturbances (UNCCD, 1994), especially urbanization. According to our results, 2.33% of the forest land is converted into urban areas during the last 20 years. It is further evidenced by Berdimbetov et al. (2020), who reported urbanization as one of the leading causes of vegetation degradation in the area.
According to (FAOSTAT, 2018), average GDP and mean crop yields increased by 59.8 and 60.39% in most of the countries located inside the ASB for 1995–2015. However, our results bring forward that economic indicators, such as annual GDP and crop yields, negatively impact land quality due to poor land-use practices in the region and excessive water extraction for agricultural practices (Sedik, 2012). As a result of excessive irrigation in the upper parts of the ASB, much of the irrigation water with high salinity levels from the upstream regions of the river flows into the lower part of the basin (Severskiy, 2004), which ultimately ends up with increased soil salinity that lead to the abandonment of cropland to grassland and shrubland.
The Amu-Darya and the Syr-Darya, the largest two rivers in the region, are the primary source of water (Micklin, 2000; Lioubimtseva, 2014), and river channels are mainly distributed in densely populated and agriculture intensive areas; in general, channel density across the region is very weak. Previous studies have shown that less canal density and water use in the lower reaches of the Amu-Darya River are some of the reasons for cropland degradation (Dubovyk et al., 2013). Our study also found that less channel density has negatively affected the vegetation development in ASB.
Conclusion
This study mainly focuses on understanding the spatial-temporal changes in land degradation and improvement in the ASB and its driving factors for the 1985–2015 period. In this study, we used the RESTREND method to identify the areas that attribute negative/positive trends of climate variable-controlled NDVI. Furthermore, the binary regression method is applied to quantify the contribution of land transition, demographical, and geographical factors to land degradation or improvement over the three sub-regions of the ASB.
The results revealed that land degradation is dominant as compared to land improvement in the ASB during this period. In particular, land degradation was mainly concentrated in the lower part, while the upper part of the ASB exhibited land improvements. The contribution of precipitation to land degradation is pronounced than soil moisture and temperature over the basin. Contrariwise, soil moisture and temperature contribute immensely to land improvement compared to precipitation.
By sub-regions, 54.4% of the LASB showed land degradation accounted for high temperature and less precipitation, while soil moisture was mainly responsible for 34.2% of degradation in the MASB. Land improvement is observed in a large part of the UASB (80.6%) due to high precipitation and soil moisture.
The relationship between land cover change and climate variables shows different responses; for instance, NDVI in barren lands and shrubland decrease with increasing temperature, while NDVI in cropland attributed a strong positive relationship. Moreover, soil moisture contributes to developing NDVI in grassland and cropland in ASB. However, all the land cover categories NDVI positively related to precipitation, suggesting that decreasing rainfall destruct the NDVI development in the region.
The result of the analysis shows that the change in LULC in the region mainly occurred due to the influence of the human factor. Land cover types, directly affected by human activities, are changing more dramatically than the ones developing under the influence of natural factors. For example, cropland and urban areas are constantly expanding, while water areas are constantly shrinking. According to the land transition assessment, 66.6% of the water area and 11.68% of the forest transformed into the barren land and shrubland during the study period, which is a dominant signal of land degradation. In addition, converting abandoned cropland to shrubland and barren land also signifies a negative impact on land cover change. Except for land transition, river waterbody density, socio-economic factors (population density, GDP growth crop yields), and topography negatively affect land degradation in ASB.
In this study, we mainly analyzed the impact of meteorological variables, land transition, and partly human factors affecting land degradation. However, this may still not be adequate to explain the exhaustive land degradation in ASB. In future research, an attempt to analyze the impact of more factors on land degradation is crucial.
Data Availability Statement
The original contributions presented in the study are included in the article/supplementary material, further inquiries can be directed to the corresponding author.
Author Contributions
All authors conceived the presented research; TB, and MZ, developed the theory and performed the computations: TB, SS, and SI, verified the analytical methods. MZ, has supervised the findings of this work: TB, SS, and SI wrote the research findings: MZ, TB, SI, and SN, reviewed and edited and finalised the manuscript. All authors have read and agreed to the published version of the manuscript.
Funding
This study is jointly supported by the Strategic Priority Research Program of the Chinese Academy of Sciences (Grant XDA20020201).
Conflict of Interest
The authors declare that the research was conducted in the absence of any commercial or financial relationships that could be construed as a potential conflict of interest.
Publisher’s Note
All claims expressed in this article are solely those of the authors and do not necessarily represent those of their affiliated organizations, or those of the publisher, the editors and the reviewers. Any product that may be evaluated in this article, or claim that may be made by its manufacturer, is not guaranteed or endorsed by the publisher.
Acknowledgments
We are thankful to the Nukus branch of Tashkent University of Information Technologies named after Muhammad Al-Khorezmi and SDGnexus Network Project of the DAAD’s “Higher Education Excellence in Development Cooperation—exceed” program for providing the opportunity to work on this study. First author acknowledged to the Chinese Academy of Sciences and the World Academy of Sciences (CAS-TWAS) and also the Institute of Atmospheric Physics, Beijing for providing academic facilities for this study.
References
Abdurahimov, B. F., and Kurbanov, U. H. (2015). The Response of the Climate System to Small Temperature Perturbations in the Aral Sea Region. Bull. Nov. Comp. Center, Num. Model. Atmosph., Etc. 15, 1–6. Available at: https://elibrary.ru/contents.asp?id=34222658
Aitekeyeva, N., Li, X., Guo, H., Wu, W., Shirazi, Z., Ilyas, S., et al. (2020). Drought Risk Assessment in Cultivated Areas of Central Asia Using MODIS Time-Series Data. Water 12, 1738. doi:10.3390/w12061738
Akodéwou, A., Oszwald, J., Saïdi, S., Gazull, L., Akpavi, S., Akpagana, K., et al. (2020). Land Use and Land Cover Dynamics Analysis of the Togodo Protected Area and its Surroundings in Southeastern Togo, West Africa. Sustainability 12, 5439. doi:10.3390/su12135439
Asarin, A. E., Kravtsova, V. I., and Mikhailov, V. N. (2010). “Amudarya and Syrdarya Rivers and Their Deltas,” in The Aral Sea Environment. Editors A.G. Kostianoy, and A.N. Kosarev (Berlin, Heidelberg: Springer Berlin Heidelberg), 101–121. doi:10.1007/698_2009_8
Babu, C., and Sengupta, D. (2006). “Policy Reforms and Agriculture Development in Central Asia: An Overview of Issues and Challanges,” in Policy Reforms and Agriculture Development in Central Asia. Editors C. Babu, and S. Djalalov (Berlin: Springer).
Beck, P. S. A., and Goetz, S. J. (2011). Satellite Observations of High Northern Latitude Vegetation Productivity Changes between 1982 and 2008: Ecological Variability and Regional Differences. Environ. Res. Lett. 6 (4)–045501. doi:10.1088/1748-9326/6/4/045501
Berdimbetov, T., Ilyas, S., Ma, Z., Bilal, M., and Nietullaeva, S. (2021). Climatic Change and Human Activities Link to Vegetation Dynamics in the Aral Sea Basin Using NDVI. Earth Systems and Environment (Springer Nature Switzerland), 5, 303–318. doi:10.1007/s41748-021-00224-7
Berdimbetov, T. T., Zhu-Guo, M., Chen, L., and Sana, I. (2020). Impact of Climate Factors and Human Activities on Water Resources in the Aral Sea Basin. Hydrol. MDPI 7, 14. doi:10.3390/hydrology7020030
Bissenbayeva, S., Abuduwaili, J., Shokparova, D., and Saparova, A. (2019). Variation in Runoff of the Arys River and Keles River Watersheds (Kazakhstan), as Influenced by Climate Variation and Human Activity. Sustainability 11, 4788. doi:10.3390/su11174788
Chappell, A., Baldock, J., and Sanderman, J. (2016). The Global Significance of Omitting Soil Erosion from Soil Organic Carbon Cycling Schemes. Nat. Clim Change 6, 187–191. doi:10.1038/nclimate2829
Chen, T., de Jeu, R. A. M., Liu, Y. Y., van der Werf, G. R., and Dolman, A. J. (2014). Using Satellite Based Soil Moisture to Quantify the Water Driven Variability in NDVI: A Case Study over mainland Australia. Remote sensing Environ. 140, 330–338. doi:10.1016/j.rse.2013.08.022
Chu, H., Venevsky, S., Wu, C., and Wang, M. (2019). NDVI-based Vegetation Dynamics and its Response to Climate Changes at Amur-Heilongjiang River Basin from 1982 to 2015. Sci. Total Environ. 650, 2051–2062. doi:10.1016/j.scitotenv.2018.09.115
Ding, M., Li, L., Zhang, Y., Sun, X., Liu, L., Gao, J., et al. (2015). Start of Vegetation Growing Season on the Tibetan Plateau Inferred from Multiple Methods Based on GIMMS and SPOT NDVI Data. J. Geogr. Sci. 25, 131–148. doi:10.1007/s11442-015-1158-y
D’Odorico, P., Bhattachan, A., Davis, K. F., Ravi, S., and Runyan, C. W. (2013). Global Desertification: Drivers and Feedbacks. Adv. Water Resour. 51, 326–344. doi:10.1016/j.advwatres.2012.01.013
Dubovyk, O., Menz, G., Conrad, C., Kan, E., Machwitz, M., and Khamzina, A. (2013). Spatio-temporal Analyses of Cropland Degradation in the Irrigated Lowlands of Uzbekistan Using Remote-Sensing and Logistic Regression Modeling. Environ. Monit. Assess. 185, 4775–4790. doi:10.1007/s10661-012-2904-6
Emmanuel, O. (2017). Effects of Deforestation on Land Degradation. Ado Ekiti: Researchgate, Ekiti State University.
ESA-CCI, 2017. Land Cover CCI Climate Research Data Package. Available online: (accessed on 20 July 2017).
Evans, J., and Geerken, R. (2004). Discrimination between Climate and Human-Induced Dryland Degradation. J. Arid Environments 57, 535–554. doi:10.1016/s0140-1963(03)00121-6
FAOSTAT, (2018). FAO Statistical Databases (Food and Agriculture Organization of the United Nations). Updated in 2019 year. Available at: https://fao.org/statistics/en/
Feng, R., Yu, R., Zheng, H., and Gan, M. (2018). Spatial and Temporal Variations in Extreme Temperature in Central Asia. Int. J. Climatol 38, e388–e400. doi:10.1002/joc.5379
Gafforov, K. S., Bao, A., Rakhimov, S., Liu, T., Abdullaev, F., Jiang, L., et al. (2020). The Assessment of Climate Change on Rainfall-Runoff Erosivity in the Chirchik–Akhangaran Basin. Uzbekistan. Sustainability 12, 3369. doi:10.3390/su12083369
Georgievski, G., and Hagemann, S. (2019). Characterizing Uncertainties in the ESA-CCI Land Cover Map of the Epoch 2010 and Their Impacts on MPI-ESM Climate Simulations. Theor. Appl. Climatol 137, 1587–1603. doi:10.1007/s00704-018-2675-2
Gessner, U., Naeimi, V., Klein, I., Kuenzer, C., Klein, D., and Dech, S. (2013). The Relationship between Precipitation Anomalies and Satellite-Derived Vegetation Activity in Central Asia. Glob. Planet. Change 110, 74–87. doi:10.1016/j.gloplacha.2012.09.007
Guo, H., Bao, A., Liu, T., Jiapaer, G., Ndayisaba, F., Jiang, L., et al. (2019). Spatial and Temporal Characteristics of Droughts in Central Asia during 1966-2015. Sci. Total Environ. 624, 1523–1538. doi:10.1016/j.scitotenv.2017.12.120
Harris, I., Jones, P. D., Osborn, T. J., and Lister, D. H. (2014). Updated High-Resolution Grids of Monthly Climatic Observations - the CRU TS3.10 Dataset. Int. J. Climatol. 34, 623–642. doi:10.1002/joc.3711
He, B., Chen, A., Jiang, W., and Chen, Z. (2017). The Response of Vegetation Growth to Shifts in Trend of Temperature in China. J. Geogr. Sci. 27, 801–816. doi:10.1007/s11442-017-1407-3
Hernández, A., Miranda, M. D., Arellano, E. C., and Dobbs, C. (2016). Landscape Trajectories and Their Effect on Fragmentation for a Mediterranean Semi-arid Ecosystem in Central Chile. J. Arid Environments 127, 74–81. doi:10.1016/j.jaridenv.2015.10.004
Higginbottom, T., and Symeonakis, E. (2014). Assessing Land Degradation and Desertification Using Vegetation Index Data: Current Frameworks and Future Directions. Remote Sensing 6, 9552–9575. doi:10.3390/rs6109552
Hu, Z., Li, Q., Chen, X., Teng, Z., Chen, C., Yin, G., et al. (2015). Climate Changes in Temperature and Precipitation Extremes in an alpine Grassland of Central Asia. Theor. Appl. Climatol 126, 519–531. doi:10.1007/s00704-015-1568-x
Hu, Z., Zhang, C., Hu, Q., and Tian, H. (2014). Temperature Changes in Central Asia from 1979 to 2011 Based on Multiple Datasets*. J. Clim. 27, 1143–1167. doi:10.1175/jcli-d-13-00064.1
Hu, Z., Zhou, Q., Chen, X., Qian, C., Wang, S., and Li, J. (2017). Variations and Changes of Annual Precipitation in Central Asia over the Last century. Int. J. Climatol 37, 157–170. doi:10.1002/joc.4988
Huang, Q.-X., Zhao, Y., and Qing, H. (2013). Climatic Characteristics in Central Asia Based on CRU Data. Arid Zone Res. 30, 396–403.
Huang, S., and Kong, J. (2016). Assessing Land Degradation Dynamics and Distinguishing Human-Induced Changes from Climate Factors in the Three-North Shelter Forest Region of China. ISPRS Int. J. Geo-Information 5, 158. doi:10.3390/ijgi5090158
Ibrahim, Y., Balzter, H., Kaduk, J., and Tucker, C. (2015). Land Degradation Assessment Using Residual Trend Analysis of GIMMS NDVI3g, Soil Moisture and Rainfall in Sub-saharan West Africa from 1982 to 2012. Remote Sensing 7, 5471–5494. doi:10.3390/rs70505471
Jiang, L., Bao, A., Jiapaer, G., Guo, H., Zheng, G., Gafforov, K., et al. (2019a). Monitoring Land Sensitivity to Desertification in Central Asia: Convergence or Divergence? Sci. Total Environ. 658, 669–683. doi:10.1016/j.scitotenv.2018.12.152
Jiang, L., Guli·Jiapaer, J., Bao, A., Guo, H., and Ndayisaba, F. (2017). Vegetation Dynamics and Responses to Climate Change and Human Activities in Central Asia. Sci. Total Environ. 599-600, 967–980. 2017 v.2599-2600. doi:10.1016/j.scitotenv.2017.05.012
Jiang, L., Jiapaer, G., Bao, A., Li, Y., Guo, H., Zheng, G., et al. (2019b). Assessing Land Degradation and Quantifying its Drivers in the Amudarya River delta. Ecol. Indicators 107. doi:10.1016/j.ecolind.2019.105595
Kalisa, W., Igbawua, T., Henchiri, M., Ali, S., Zhang, S., Bai, Y., et al. (2019). Assessment of Climate Impact on Vegetation Dynamics over East Africa from 1982 to 2015. Sci. Rep. 9, 16865. doi:10.1038/s41598-019-53150-0
Kang, C., Zhang, Y., Wang, Z., Liu, L., Zhang, H., and Jo, Y. (2017). The Driving Force Analysis of NDVI Dynamics in the Trans-boundary Tumen River Basin between 2000 and 2015. Sustainability 9, 2350. doi:10.3390/su9122350
Khamzina, A., Lamers, J. P. A., and Vlek, P. L. G. (2008). Tree Establishment under Deficit Irrigation on Degraded Agricultural Land in the Lower Amu Darya River Region, Aral Sea Basin. For. Ecol. Manage. 255, 168–178. doi:10.1016/j.foreco.2007.09.005
Kundu, A., and Dutta, D. (2011). Monitoring Desertifcation Risk through Climate Change and Human Interference Using Remote Sensing and GIS Techniques. Int. J. Geomat. Geosci. 2, 21–33.
Lennart, O., and Humberto, B. (2019). “Land Degradation,” in Climate Change and Land: An IPCC Special Report on Climate Change, Desertification, Land Degradation, Sustainable Land Management, Food Security, and Greenhouse Gas Fluxes in Terrestrial Ecosystems. Editor C.V. A.S. B. José Manuel Moreno (Sweden: Land Degradation).
Li, Z., Chen, Y., Li, W., Deng, H., and Fang, G. (2015a). Potential Impacts of Climate Change on Vegetation Dynamics in Central Asia. J. Geophys. Res. Atmos. 120, 12345–12356. doi:10.1002/2015jd023618
Li, Z., Deng, X., Yin, F., and Yang, C. (2015b). Analysis of Climate and Land Use Changes Impacts on Land Degradation in the North China Plain. Adv. Meteorology 2015, 1–11. doi:10.1155/2015/976370
Lioubimtseva, E. (2014). in Impact of Climate Change on the Aral Sea and its Basin. Editor P. P. Micklin (Berlin, Germany: Springer-Verlag), 405–427. doi:10.1007/978-3-642-02356-9_17
Liu, X., Tian, Z., Zhang, A., Zhao, A., and Liu, H. (2019). Impacts of Climate on Spatiotemporal Variations in Vegetation NDVI from 1982–2015 in Inner Mongolia, China. Sustainability 11. doi:10.3390/su11030768
Liu, X., Yu, L., Si, Y., Zhang, C., Lu, H., Yu, C., et al. (2018). Identifying Patterns and Hotspots of Global Land Cover Transitions Using the ESA CCI Land Cover Dataset. Remote Sensing Lett. 9, 972–981. doi:10.1080/2150704x.2018.1500070
Liu, Z., Huang, Y., Liu, T., Li, J., Xing, W., Akmalov, S., et al. (2020). Water Balance Analysis Based on a Quantitative Evapotranspiration Inversion in the Nukus Irrigation Area, Lower Amu River Basin. Remote Sensing 12, 2317. doi:10.3390/rs12142317
Luo, H., Dai, S., Xie, Z., and Fang, J. (2018). NDVI-based Analysis on the Influence of Human Activities on Vegetation Variation on Hainan Island. IOP Conf. Ser. Earth Environ. Sci. 121, 032045. doi:10.1088/1755-1315/121/3/032045
Martiny, N., Camberlin, P., Richard, Y., and Philippon, N. (2006). Compared Regimes of NDVI and Rainfall in Semi‐arid Regions of Africa. Int. J. Remote Sensing 27, 5201–5223. doi:10.1080/01431160600567787
Miao, L., Ye, P., He, B., Chen, L., and Cui, X. (2015). Future Climate Impact on the Desertification in the Dry Land Asia Using AVHRR GIMMS NDVI3g Data. Remote Sensing 7, 3863–3877. doi:10.3390/rs70403863
Micklin, P. (2014). Efforts to Revive the Aral Sea. Berlin, Germany: The Aral Sea, 361–380. doi:10.1007/978-3-642-02356-9_15Efforts to Revive the Aral Sea
Micklin, P. (1998). International and Regional Responses to the Aral Crisis: An Overview of Efforts and Accomplishments. Post-Soviet Geogr. Econ. 39, 399–416. doi:10.1080/10889388.1998.10641085
Micklin, P. (2000). Managing Water in Central Asia (Central Asian and Caucasian Prospect). London, United Kingdom: Royal Inst of Intl Affairs.
Micklin, P. (2007). The Aral Sea Disaster. Annu. Rev. Earth Planet. Sci. 35, 47–72. doi:10.1146/annurev.earth.35.031306.140120
Mitchell, T. D., and Jones, P. D. (2005). An Improved Method of Constructing a Database of Monthly Climate Observations and Associated High-Resolution Grids. Int. J. Climatol. 25, 693–712. doi:10.1002/joc.1181
Nandintsetseg, B., Shinoda, M., Kimura, R., and Ibaraki, Y. (2010). Relationship between Soil Moisture and Vegetation Activity in the Mongolian Steppe. Scientific Online Lett. atmosphere: SOLA 6, 029–032. doi:10.2151/sola.2010-008
Nkonya, E., Mirzabaev, A., and Braun, J. (2016). Economics of Land Degradation and Improvement – A Global Assessment for Sustainable Development. Bonn: Springer International Publishing.
Pacheco, F. A. L., Sanches Fernandes, L. F., Valle Junior, R. F., Valera, C. A., and Pissarra, T. C. T. (2018). Land Degradation: Multiple Environmental Consequences and Routes to Neutrality. Curr. Opin. Environ. Sci. Health 5, 79–86. doi:10.1016/j.coesh.2018.07.002
Pan, X., Wang, W., Liu, T., Huang, Y., Maeyer, P. D., Guo, C., et al. (2020). Quantitative Detection and Attribution of Groundwater Level Variations in the Amu Darya Delta. Water 12, 2869. doi:10.3390/w12102869
Peng, S., Chen, A., Xu, L., Cao, C., Fang, J., Myneni, R. B., et al. (2011). Recent Change of Vegetation Growth Trend in China. Environ. Res. Lett. 6, 044027. doi:10.1088/1748-9326/6/4/044027
Peng, S., Piao, S., Ciais, P., Myneni, R. B., Chen, A., Chevallier, F., et al. (2013). Asymmetric Effects of Daytime and Night-Time Warming on Northern Hemisphere Vegetation. Nature 501, 88–92. doi:10.1038/nature12434
Piao, S., Mohammat, A., Fang, J., Cai, Q., and Feng, J. (2006). NDVI-based Increase in Growth of Temperate Grasslands and its Responses to Climate Changes in China. Glob. Environ. Change 16, 340–348. doi:10.1016/j.gloenvcha.2006.02.002
Reeves, M. C., and Baggett, L. S. (2014). A Remote Sensing Protocol for Identifying Rangelands with Degraded Productive Capacity. Ecol. Indicators 43, 172–182. doi:10.1016/j.ecolind.2014.02.009
Robinson, S. (2016). “Land Degradation in Central Asia: Evidence, Perception and Policy,” in The End of Desertification? (London, UK: Springer Earth System Sciences). doi:10.1007/978-3-642-16014-1_17
Robinson, S., Wiedemann, C., Michel, S., Zhumabayev, Y., and Singh, N. (2012). “Pastoral Tenure in Central Asia: Theme and Variation in the Five Former Soviet Republics,” in Rangeland Stewardship in Central Asia. Balancing Improved Livelihoods, Biodiversity Conservation and Land protection. Editor I. V. Squires (Berlin: Springer). doi:10.1007/978-94-007-5367-9_11
Rodell, M., Houser, P. R., Jambor, U., Gottschalck, J., Mitchell, K., Meng, C.-J., et al. (2004). The Global Land Data Assimilation System. Bull. Amer. Meteorol. Soc. 85, 381–394. doi:10.1175/bams-85-3-381
Roland, G., and Mohammad, I. (2004). Assessment of Rangeland Degradation and Development of a Strategy for Rehabilitation. Remote sensing Environ. 90, 490–504. doi:10.1016/s0034-4257(04)00029-x
Saiko, T. A., and Zonn, I. S. (2000). Irrigation Expansion and Dynamics of Desertification in the Circum-Aral Region of Central Asia. Appl. Geogr. 20, 349–367. doi:10.1016/s0143-6228(00)00014-x
Sang, X., Guo, Q., Wu, X., Fu, Y., Xie, T., He, C., et al. (2019). Intensity and Stationarity Analysis of Land Use Change Based on CART Algorithm. Sci. Rep. 9, 12279. doi:10.1038/s41598-019-48586-3
Schettler, G., Oberhänsli, H., Stulina, G., Mavlonov, A. A., and Naumann, R. (2013). Hydrochemical Water Evolution in the Aral Sea Basin. Part I: Unconfined Groundwater of the Amu Darya Delta - Interactions with Surface Waters. J. Hydrol. 495, 267–284. doi:10.1016/j.jhydrol.2013.03.044
Sedik, D. (2012). “The Feed-Livestock Nexus: Livestock Development Policy in Tajikistan,” in Rangeland Stewardship in Central Asia. Editor V. Squires (Dordrecht: Springer). doi:10.1007/978-94-007-5367-9_9
Severskiy, I. V. (2004). Water-related Problems of Central Asia: Some Results of the (GIWA) International Water Assessment Program. AMBIO: A J. Hum. Environ. 33, 52–62. doi:10.1579/0044-7447-33.1.52
Shibuo, Y., Jarsjö, J., and Destouni, G. (2007). Hydrological Responses to Climate Change and Irrigation in the Aral Sea Drainage basin. Geophys. Res. Lett. 34. doi:10.1029/2007gl031465
Singh, D., Meirelles, M. S. P., Costa, G. A., Herlin, I., Berroir, J. P., and Silva, E. F. (2006). Environmental Degradation Analysis Using NOAA/AVHRR Data. Adv. Space Res. 37, 720–727. doi:10.1016/j.asr.2004.12.052
Small, E. E., Sloan, L. C., and Nychka, D. (2001). Changes in Surface Air Temperature Caused by Desiccation of the Aral Sea. J. Clim. 14, 284–299. doi:10.1175/1520-0442(2001)014<0284:cisatc>2.0.co;2
Su, F., Wang, F., Li, Z., Wei, Y., Li, S., Bai, T., et al. (2020). Predominant Role of Soil Moisture in Regulating the Response of Ecosystem Carbon Fluxes to Global Change Factors in a Semi-arid Grassland on the Loess Plateau. Sci. Total Environ. 738, 139746. doi:10.1016/j.scitotenv.2020.139746
Suleimenov, M., Iniguez, L., and Musayeva, M. (2006). “Policy Reforms and Livestock Development in Central Asia,” in Policy Reforms and Agriculture Development in Central Asia. Editors C. Babu, and S. Djalalov (Boston, MA, Berlin: Springer).
Sun, B., Li, Z., Gao, W., Zhang, Y., Gao, Z., Song, Z., et al. (2019). Identification and Assessment of the Factors Driving Vegetation Degradation/regeneration in Drylands Using Synthetic High Spatiotemporal Remote Sensing Data-A Case Study in Zhenglanqi, Inner Mongolia, China. Ecol. Indicators 107, 105614. doi:10.1016/j.ecolind.2019.105614
Tong, S., Zhang, J., Bao, Y., Lai, Q., Lian, X., Li, N., et al. (2018). Analyzing Vegetation Dynamic Trend on the Mongolian Plateau Based on the Hurst Exponent and Influencing Factors from 1982-2013. J. Geogr. Sci. 28, 595–610. doi:10.1007/s11442-018-1493-x
Tucker, C. J., Vanpraet, C. L., Sharman, M. J., and Van Ittersum, G. (1985). Satellite Remote Sensing of Total Herbaceous Biomass Production in the Senegalese Sahel: 1980-1984. Remote sensing Environ. 17, 233–249. doi:10.1016/0034-4257(85)90097-5
Unger-Shayesteh, K., Vorogushyn, S., Merz, B., and Frede, H.-G. (2013). Introduction to "Water in Central Asia - Perspectives under Global Change". Glob. Planet. Change 110, 1–3. doi:10.1016/j.gloplacha.2013.09.016
Wang, Y., Yang, J., Chen, Y., Fang, G., Duan, W., Li, Y., et al. (2019). Quantifying the Effects of Climate and Vegetation on Soil Moisture in an Arid Area. China. Water 11.
Willemen, L., Crossman, N. D., Quatrini, S., Egoh, B., Kalaba, F. K., Mbilinyi, B., et al. (2018). Identifying Ecosystem Service Hotspots for Targeting Land Degradation Neutrality Investments in South-Eastern Africa. J. Arid Environments 159, 75–86. doi:10.1016/j.jaridenv.2017.05.009
Zavialov, P. O., Kostianoy, A. G., Emelianov, S. V., Ni, A. A., Ishniyazov, D., Khan, V. M., et al. (2003). Hydrographic Survey in the Dying Aral Sea. Geophys. Res. Lett. 30. doi:10.1029/2003gl017427
Zewdie, W., and Csaplovics, E. (2016). Identifying Categorical Land Use Transition and Land Degradation in Northwestern Drylands of Ethiopia. Remote Sensing 8, 408. doi:10.3390/rs8050408
Zhang, M., Chen, Y., Shen, Y., and Li, B. (2019). Tracking Climate Change in Central Asia through Temperature and Precipitation Extremes. J. Geogr. Sci. 29, 3–28. doi:10.1007/s11442-019-1581-6
Zhou, Y., Zhang, L., Fensholt, R., Wang, K., Vitkovskaya, I., and Tian, F. (2015). Climate Contributions to Vegetation Variations in Central Asian Drylands: Pre- and Post-USSR Collapse. Remote Sensing 7, 2449–2470. doi:10.3390/rs70302449
Zhou, Y., Zhang, L., Xiao, J., Williams, C. A., Vitkovskaya, I., and Bao, A. (2019). Spatiotemporal Transition of Institutional and Socioeconomic Impacts on Vegetation Productivity in Central Asia over Last Three Decades. Sci. Total Environ. 658, 922–935. doi:10.1016/j.scitotenv.2018.12.155
Keywords: land degradation, NDVI, climate variables, land transition, Aral Sea basin
Citation: Berdimbetov T, Ma Z-G, Shelton S, Ilyas S and Nietullaeva S (2021) Identifying Land Degradation and its Driving Factors in the Aral Sea Basin From 1982 to 2015. Front. Earth Sci. 9:690000. doi: 10.3389/feart.2021.690000
Received: 01 April 2021; Accepted: 31 August 2021;
Published: 24 September 2021.
Edited by:
Irfan Rashid, University of Kashmir, IndiaCopyright © 2021 Berdimbetov, Ma, Shelton, Ilyas and Nietullaeva. This is an open-access article distributed under the terms of the Creative Commons Attribution License (CC BY). The use, distribution or reproduction in other forums is permitted, provided the original author(s) and the copyright owner(s) are credited and that the original publication in this journal is cited, in accordance with accepted academic practice. No use, distribution or reproduction is permitted which does not comply with these terms.
*Correspondence: Zhu-Guo Ma, mazg@tea.ac.cn