
94% of researchers rate our articles as excellent or good
Learn more about the work of our research integrity team to safeguard the quality of each article we publish.
Find out more
ORIGINAL RESEARCH article
Front. Earth Sci., 26 August 2021
Sec. Atmospheric Science
Volume 9 - 2021 | https://doi.org/10.3389/feart.2021.689127
This article is part of the Research TopicAtmospheric ElectricityView all 12 articles
 Tamás Bozóki1,2*
 Gabriella Sátori1
 Earle Williams3
 Irina Mironova4
 Péter Steinbach5,6Emma C. Bland7
 Alexander Koloskov8,9
 Yuri M. Yampolski8Oleg V. Budanov8Mariusz Neska10
 Ashwini K. Sinha11Rahul Rawat11
 Mitsuteru Sato12
 Ciaran D. Beggan13Sergio Toledo-Redondo14Yakun Liu3Robert Boldi15
The Earth–ionosphere cavity resonator is occupied primarily by the electromagnetic radiation of lightning below 100 Hz. The phenomenon is known as Schumann resonances (SR). SR intensity is an excellent indicator of lightning activity and its distribution on global scales. However, long-term measurements from high latitude SR stations revealed a pronounced in-phase solar cycle modulation of SR intensity seemingly contradicting optical observations of lightning from satellite, which do not show any significant solar cycle variation in the intensity and spatial distribution of lightning activity on the global scale. The solar cycle-modulated local deformation of the Earth–ionosphere cavity by the ionization of energetic electron precipitation (EEP) has been suggested as a possible phenomenon that may account for the observed long-term modulation of SR intensity. Precipitating electrons in the energy range of 1–300 keV can affect the Earth–ionosphere cavity resonator in the altitude range of about 70–110 km and modify the SR intensities. However, until now there was no direct evidence documented in the literature supporting this suggestion. In this paper we present long-term SR intensity records from eight stations, each equipped with a pair of induction coil magnetometers: five high latitude (|lat| > 60°), two mid-high latitude (50° < |lat| < 60°) and one low latitude (|lat| < 30°). These long-term, ground-based SR intensity records are compared on the annual and interannual timescales with the fluxes of precipitating 30–300 keV medium energy electrons provided by the POES NOAA-15 satellite and on the daily timescale with electron precipitation events identified using a SuperDARN radar in Antarctica. The long-term variation of the Earth–ionosphere waveguide’s effective height, as inferred from its cutoff frequency, is independently analyzed based on spectra recorded by the DEMETER satellite. It is shown that to account for all our observations one needs to consider both the effect of solar X-rays and EEP which modify the quality factor of the cavity and deform it dominantly over low- and high latitudes, respectively. Our results suggest that SR measurements should be considered as an alternative tool for collecting information about and thus monitoring changes in the ionization state of the lower ionosphere associated with EEP.
The Earth’s surface and the lower ionosphere together form an electromagnetic cavity resonator with resonance frequencies in the extremely low frequency (ELF, 3 Hz–3 kHz) band at ∼8, ∼14, ∼20, ∼26 Hz etc.. These resonances are named after Schumann (1952) who described them theoretically in 1952, 8 years before full frequency spectra were actually observed by Balser and Wagner (1960). Schumann resonances (SR) are excited primarily by lightning-radiated electromagnetic waves and the approximate number of 30–100 lightning strokes per second worldwide (Christian et al., 2003) maintains the resonance field quasi-continuously. It follows that SR are excellent indicators of lightning activity and distribution on global scales (see e.g., Williams et al., 2021). The possible connection between atmospheric electricity (including SR) and biological systems is another topic with substantial scientific interest (e.g., Elhalel et al., 2019; Fdez-Arroyabe et al., 2020; Price et al., 2021; Savoska et al., 2021; Sukhov et al., 2021). Until the end of the 1980’s SR measurements were sparse and due to the restricted computational and data storage capacities long-term continuous recording was not really feasible at that time. In the early 90s’ owing to the rapid development of large computational capacities and motivated by a fundamental Science article (Williams, 1992) many SR stations started to operate on a continuous basis worldwide (e.g., Sátori et al., 1996; Price and Melnikov, 2004; Neska et al., 2007; Ondrášková et al., 2007; Bór et al., 2020) which gave a new impetus for SR-related research.
Much published material has appeared describing the standard (recurrent) daily and seasonal variations of SR spectral parameters (modal frequency, intensity and sharpness of maxima) at different stations (e.g., Sátori, 1996; Nickolaenko and Hayakawa, 2002; Price and Melnikov, 2004; Roldugin et al., 2004a; Ondrášková et al., 2007; Yatsevich et al., 2008; Toledo-Redondo et al., 2010; Zhou et al., 2013; Nickolaenko and Hayakawa, 2014; Fornieles‐Callejón et al., 2015; Manu et al., 2015; Musur and Beggan, 2019; Tatsis et al., 2020). These standard variations in SR are mainly the consequence of the daily and seasonal variations of global lightning activity which fundamentally affect the observed SR spectral parameters (Sátori, 1996). On the other hand, standard variations in SR are also connected to the effect of the day-night terminator, i.e., to changes in the shape of the Earth–ionosphere cavity (Melnikov et al., 2004; Sátori et al., 2007; Prácser et al., 2021). SR measurements demonstrated that the characteristic variations of global lightning activity are highly recurrent on a day-to-day and year-to-year basis (see e.g., Sátori, 1996). The latter was confirmed by optical observations of lightning from space as well (Williams et al., 2000; Christian et al., 2003).
Occasional variations in SR have also been documented, which are partly connected to transient extra-terrestrial phenomena that can modify the shape of the Earth–ionosphere cavity and thereby to “untune” its resonance frequencies. It is important to note that as a consequence of any change in the shape of the Earth–ionosphere cavity all the resonance frequencies shift in the same direction at all stations on Earth, but whether they increase or decrease depends on the actual modification of the conductivity profile in the upper atmosphere (Zhou and Qiao, 2015; Sátori et al., 2016; Kudintseva et al., 2018). Solar X-ray bursts (Roldugin et al., 2004b; Sátori et al., 2005; Dyrda et al., 2015; Sátori et al., 2016; Shvets et al., 2017) and solar proton events (Schlegel and Füllekrug, 1999; Roldugin et al., 2003; Singh et al., 2014) are known to cause such changes in frequencies (of both signs). In contrast, occasional variations in SR intensity with extra-terrestrial origin have been associated only with solar proton events so far (Schlegel and Füllekrug, 1999; Roldugin et al., 2003), and recently, indication for periods with increased SR intensity during geomagnetic storms was demonstrated as well (Salinas et al., 2016; Pazos et al., 2019). We note that variations in SR were also reported connected to seismic activity (e.g., Christofilakis et al., 2019; Galuk et al., 2019; Florios et al., 2020; Hayakawa et al., 2020).
SR measurements have also revealed the long-term solar cycle modulation of SR frequencies (e.g., Kulak et al., 2003a; Kulak et al., 2003b; Sátori et al., 2005; Ondrášková et al., 2011; Nickolaenko et al., 2015; Musur and Beggan, 2019; Koloskov et al., 2020) which has been attributed to the more than two orders of magnitude difference in solar X-ray flux between the minimum and maximum of solar activity (Sátori et al., 2005; Williams and Sátori, 2007). This effect is inherently non-uniform as only the sunlit portion of the lower ionosphere is affected by X-rays (and EUV radiation). It is to be noted that the long-term modulation of SR frequencies can be observed at all SR stations around the globe just as in the case of transient extra-terrestrial phenomena (X-ray bursts, solar proton events) discussed above.
In 2015 long-term SR intensity records from the Ukrainian Antarctic station “Akademik Vernadsky” were published which clearly showed a pronounced solar cycle modulation (up to 60%) of SR intensity (Nickolaenko et al., 2015), just as in an earlier paper by Füllekrug et al. (2002) using data from the Antarctic station Arrival Heights. Recently, Koloskov et al. (2020) reported that SR intensity records at the Vernadsky station are still in phase with the solar cycle and that a new SR station began operation at Svalbard in the Arctic in 2013 that also shows the solar cycle modulation of SR intensity. The origin of this effect is a challenging question as satellite observations do not show a solar cycle variation in the intensity and distribution of lightning activity (which is recognized as the primary origin of SR intensity variations) (Christian et al., 2003; Williams et al., 2014; Williams, 2016). Furthermore, as highlighted above, there is little clear evidence reported in the literature so far regarding the direct influence of extra-terrestrial processes on SR intensity over shorter timescales which could form the basis of the longer-term modulation from the solar cycle. In studies by Williams et al. (2014) and Sátori et al. (2016) the authors argued that energetic electron precipitation (EEP) may account for the observed interannual SR intensity modulation by affecting the ionospheric height locally over the observer. As for the physical basis the authors suggested (following Sentman and Fraser, 1991) that the energy flux through the waveguide, parallel with the Earth’s surface, must be conserved and when the local height is reduced by EEP, the magnetic field and attendant intensity must increase locally (a scenario illustrated in Figure 9). However, until now no direct evidence has been presented in the literature supporting the suggested EEP-effect on SR either on the solar-cycle or on shorter timescales.
Energetic particles are trapped in the magnetosphere in radiation belts (RBs). They are heated to relativistic energies (from several tens of keV up to the order of MeV) by various wave particle interactions (WPI), field line reconnection processes and large-scale electric fields (see e.g., Baker et al., 2018). Particle acceleration, as well as losses from pitch angle scattering into the atmosphere, can be intensified during geomagnetic storm periods in space weather events (Reeves et al., 2003). The characteristic timescale of single precipitation loss events reflects the duration of the causative source mechanism, and generally falls in the sub-second to hours range.
The expected effect of electron precipitation on SR depends in part on the characteristic penetration depth of the electrons into the atmosphere (Sátori et al., 2016) and the main factor determining the penetration depth of precipitating electrons is their energy (Rees, 1989), as illustrated in Figure 1. Model calculations (Artamonov et al., 2017; Mironova et al., 2019a) show that the upper (“magnetic”) boundary of the Earth–ionosphere cavity resonator (near 90–110 km) (Sátori et al., 2005; 2016) is strongly affected by precipitating electrons in the 1–30 keV energy range. However, EISCAT incoherent scatter radar measurements show that the electron density can increase dramatically down to ∼70 km during strongly ionizing EEP events (Belova et al., 2005; Miyoshi et al., 2015). This observation suggests that electrons in the energy range of 30–300 keV can influence the upper (“magnetic”) boundary of the Earth–ionosphere cavity resonator as well (Figure 1). It is important to note that Figure 1 illustrates only necessary conditions that energetic electrons will lower the local ionospheric height. Sufficient conditions involve the orders-of-magnitude increase in ionizing flux of energetic electrons, as discussed earlier for X-radiation (Williams and Satori, 2007).
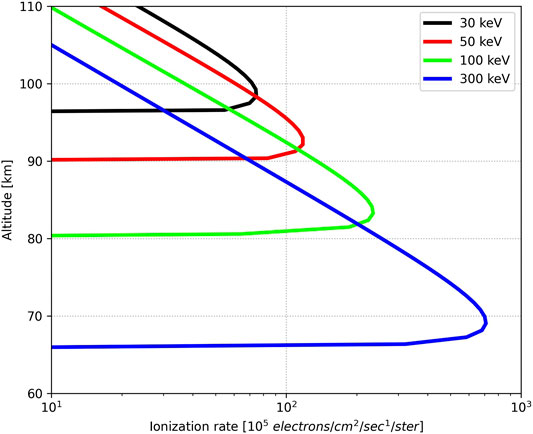
FIGURE 1. Ionization rates versus altitude for monoenergetic electron flux based on the models described in Artamonov et al., 2017 and Mironova et al., 2019a.
The paper by Toledo-Redondo et al. (2012) is a pioneering work on long-term quasi-global variations in the night-time height of the Earth–ionosphere cavity. Based on the extraction of the waveguide cutoff frequency in DEMETER satellite observations, the authors showed that the effective height of the waveguide was anti-correlated with the solar activity between 2006 and 2009.
A collection of simultaneously recording ELF stations is needed to characterize the deformation of the Earth–ionosphere cavity. In this paper our first objective is to extend the published set of long-term SR intensity records by presenting new results from the high latitude (|lat| > 60°) stations: Hornsund (Svalbard), Syowa (Antarctica) and Maitri (Antarctica), from the mid-high latitude (50° < |lat| < 60°) stations: Eskdalemuir (United Kingdom) and Belsk (Poland), and from the low latitude (|lat| < 30°) station: Shillong (India), as well as an extended set of measurements from the high latitude Ukranian stations in the Arctic (Sousy) and Antarctic (Vernadsky). SR observations are compared with long-term fluxes of precipitating 30–300 keV electrons provided by the National Oceanic and Atmospheric Administration (NOAA) Polar Operational Environmental Satellites (POES) and with electron precipitation events identified in Super Dual Auroral Radar Network (SuperDARN) measurements in Antarctica (Bland et al., 2019). An extended set of the global waveguide’s effective height, as observed in the survey electric field ELF-VLF spectra recorded by the French DEMETER satellite (Toledo-Redondo et al., 2012), is also presented and analyzed.
In this paper we present long-term induction coil measurements from eight different SR stations which observe the variation of the horizontal magnetic field in the lowest part of the ELF band and analyze monthly average magnetic intensities of the first SR mode. Figure 2 shows the location of the SR stations as well as the great circle paths (GCPs) of the wave propagation directions in which the coils are most sensitive. A common map is shown for the Hornsund and Sousy stations in Figure 2 as these two stations are in close proximity (within 150 km, both at Svalbard) compared to the wavelength of ELF waves (of the order of 10 Mm). Induction coils are usually aligned with the local geographical meridian and perpendicular to it, except at the Syowa station where they are oriented along the geomagnetic north-south and east-west directions (Figure 2F).
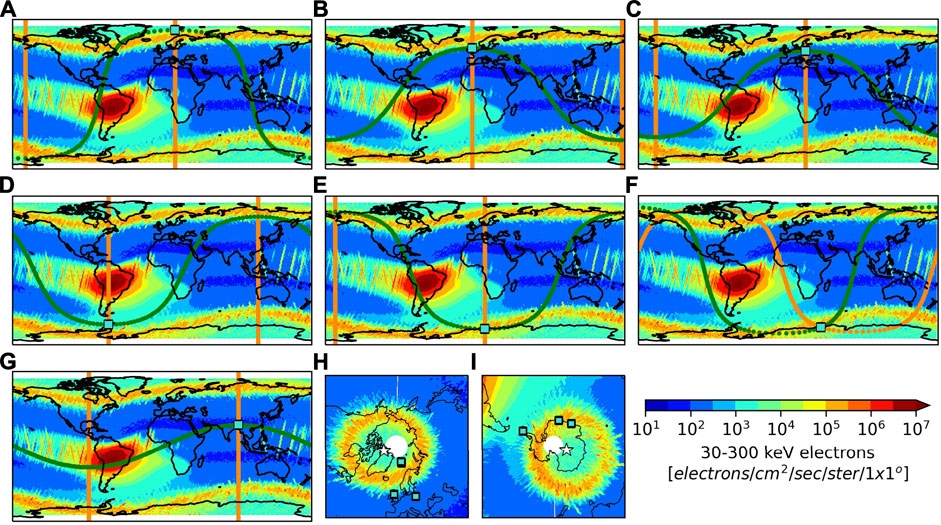
FIGURE 2. The location of the (A) Hornsund (HRN)/Sousy (SOU), (B) Eskdalemuir (ESK), (C) Belsk (BEL), (D) Vernadsky (VRN), (E) Maitri (MAI), (F) Syowa (SYO) and (G) Shillong (SHI) SR stations (turquoise squares) and the wave propagation directions (great circle paths) for which the coils are the most sensitive (HNS = green, HEW = orange). Note that at the SYO station the coils are oriented along the geomagnetic north-south and east-west directions. The background world maps show the distribution of precipitated 30–300 keV electrons in 1 × 1 degree spatial resolution in 2005 (yielding the highest precipitation fluxes in the time interval investigated in this study) provided by the NOAA-15 satellite. The polar views (|lat| > 40°) of the Northern (H) and Southern (I) Hemispheres together with the location of the high- and mid-high latitude SR stations and the geomagnetic poles (white stars).
The Institute of Geophysics of the Polish Academy of Sciences established SR measurements at the Polish Polar Station Hornsund at Svalbard (HRN; 77.0°N, 15.6°E; L = 14.0; Figure 2A) and at the Central Geophysical Observatory in Belsk, Poland (BEL; 51.8°N, 20.8°E; L = 2.2; Figure 2C) in 2004 and 2005, respectively (Neska et al., 2007; Neska et al., 2019). From the HRN station measured data were processed from September 2004 to October 2020. The main data gaps within this time period are: 06/2006-11/2007, 07-11/2008, 03/2009, 09/2009, 07-08/2011, 09/2015-03/2016 and 01-09/2017 (HEW). From the BEL station the fully processed April 2005–December 2012 time period contains the following data gaps: 06/2005, 08/2005, 04-05/2006 and 01-02/2007. Since the entire dataset had been reprocessed for the present study we describe the applied data processing technique in detail.
Raw time series measurements were bandpass-filtered and 10-min estimates of average power spectral density (PSD) with a frequency resolution of ∼0.2 Hz were generated by applying Welch’s method (Welch, 1967). Welch’s method estimates the PSD by dividing the data into overlapping segments, determining the PSD of each segment and averaging them. In order to minimize the aliasing effect of regional lightning activity and exceptionally intense lightning strokes generating Q-bursts (Guha et al., 2017) the PSD of data segments containing spikes greater than 40 pT in absolute value were omitted before averaging. From the obtained 10-min average PSD the intensity of the first SR mode was determined by means of the weighted average method (Nickolaenko et al., 2015). The peak frequency of the first mode (f1) was calculated from the discrete PSD as:
and the PSD of the nearest frequency value to this peak frequency was assigned as the intensity of the first SR mode.
SR measurements can easily be affected (contaminated) by different local noise processes (with natural and artificial origin), such as local lightning, wind, human activity, etc. (see e.g., Tatsis et al., 2021; Tritakis et al., 2021). In order to further improve the quality of the results a manual data sanitization step has been carried out before calculating the monthly averaged intensities. Our method relies on the evidence that the daily variation of SR intensity is usually highly similar within a month (Sátori, 1996). Therefore the intensity of the first SR mode was plotted as a function of UT time for all the days within the processed month and days with unusual daily intensity variation were excluded when calculating the monthly average.
SR measurements are carried out by the British Geological Survey at Eskdalemuir Observatory (ESK; 55.3°N, 3.2°W; L = 2.7; Figure 2B) near the Scottish Borders of the United Kingdom since September 2012 (Beggan and Musur, 2018; Musur and Beggan, 2019). For the present study processed data are available from June 2012 to December 2020 with a few gaps in the record. Details about the station and data processing can be found in Musur and Beggan (2019).
The Institute of Radio Astronomy (IRA) of the National Academy of Sciences of Ukraine established observations at two high latitude SR stations in the Arctic and in the Antarctic, respectively. The Arctic station is located at the Sousy facility of the Tromso Geophysical Observatory (the Arctic University of Norway, UiT) at Svalbard (SOU; 78.1°N, 16.0°E; L = 16.1; Figure 2A) and began operation in September 2013 while the Antarctic station is located in the Western Antarctic at the Ukrainian station “Akademik Vernadsky” (VRN; 65.25°S, 64.25°W; L = 2.6; Figure 2D) and began operation in March 2002. From the SOU station data are available from September 2013 to August 2020 with data gaps in 04/2014, 05/2014, 07/2016 while from the VRN station data are available from March 2002 to April 2020 with one long gap between 09/2009 and 03/2010. For more information about the stations and data processing we refer to the paper of Koloskov et al. (2020). Here we note only that data segments with distorted SR spectra were removed from the VRN and SOU databases before averaging. From the VRN station an extended dataset of the spectral intensity at 11 Hz (between the first and second resonance peaks) is also presented (Koloskov et al., 2020). Later in this study we show that a substantial portion of long-term SR intensity variations are related to changes in the quality factor (Q-factor) of the Earth–ionosphere cavity, which characterizes the rate of energy dissipation at a given resonance mode (Madden and Thompson, 1965; Kulak et al., 2003a). The investigation of spectral intensity between the first and second resonance peaks (near 11 Hz) is motivated by this observation as it is expected to have only a minor dependence on the Q-factor of the cavity. We note that recording at the frequency of about 11 Hz was originally proposed and implemented by Fraser-Smith et al. (1991a), Fraser-Smith et al. (1991b).
The Indian Antarctic station Maitri (MAI; 70.8°S, 11.7°E; L = 5.0; Figure 2E) is located in the Eastern Antarctic and SR data from the station are available from March 2010 to December 2019 with data gaps in 04/2018, 11-12/2018 (HEW) and 11/2019. It is important to note that at the Maitri station the magnetic coils were oriented initially along the geomagnetic north-south and east-west directions. However, by the end of 2012 they were reoriented along the geographic main directions. In order to work with a homogeneous dataset and to be consistent with the other SR stations, SR intensity values from Maitri are shown only from January 2013 in the present study. For more information about the station we refer to the paper by Manu et al. (2015). Low latitude SR measurements are available from the Shillong station (SHI; 25.92°N, 91.88°E; L = 1.15; Figure 2G) in India (Rawat et al., 2012) from January 2008 to December 2016 with data gaps in 07/2008, 05/2014 and 01-04/2015. Raw SR measurements from SHI were processed with the same technique as described for the HRN and BEL stations.
The induction coil magnetometers at the Japanese permanent research station Syowa (SYO; 69.0°S, 39.6°E; L = 6.3; Figure 2F) were set up in February 2000 and processed data are available for the present study from January 2006 to December 2015 with data gaps in 03/2008, 07/2008, 06-07/2014 and 06-08/2015. At the SYO station the coils are aligned with the geomagnetic north-south and east-west directions (D = −48.5° in the year of installation). For more information about the station we refer to the paper by Sato and Fukunishi (2005). For the SYO data the same manual data sanitization process as for the HRN and BEL data has been applied.
The flux of precipitating E > 30 keV, >100 keV, >300 keV electrons is provided by the T0 telescope of the Medium Energy Proton and Electron Detector (MEPED) instrument (as part of the Space Environment Monitor 2 instrument package) onboard the NOAA-15 satellite (Rodger et al., 2010). Electrons that are detected by the T0 telescope (pointing outward along the local zenith) on the quasi-polar (98.70°), Sun-synchronous, low earth orbit (LEO) (∼807 km) of the NOAA-15 satellite are in the atmospheric loss cone and will enter the atmosphere (Rodger et al., 2010). However, it is to be noted that the T0 telescope detects particles only near the center of the atmospheric loss cone and therefore underestimates the total flux of precipitating electrons (Rodger et al., 2010; van de Kamp et al., 2016; Mironova et al., 2019b).
To demonstrate the typical geographical configuration of the propagation paths (great circle paths) corresponding to the different SR stations and the electron precipitation-affected areas the distribution of precipitated 30–300 keV electrons (as a sum of the measured flux in the three corresponding channels of the T0 telescope) in 1 × 1 degree spatial resolution in 2005 (yielding the highest precipitation fluxes in the time interval investigated in this study) are displayed in the background in the subplots of Figure 2. As can be seen on the maps three main areas are affected primarily by electron precipitation: two high latitude, zonally continuous stripes in the Northern and Southern Hemispheres which we will refer to hereafter as precipitation belts, and the South Atlantic Magnetic Anomaly in South America. Five of the investigated SR stations (HRN, SOU, VRN, MAI, SYO) lie very close (within 1 Mm and << the wavelength of the ELF waves) to at least one of these areas. Furthermore, some propagation paths cross the South Atlantic Magnetic Anomaly. The great circle path corresponding to the HNS component at the SHI station needs to be highlighted as well which does not cross the precipitation belts at all. Furthermore, the South Atlantic Magnetic Anomaly is also very far from this measuring site. Therefore, we do not expect EEP-related local SR intensity changes in this HNS component.
A list of EEP events derived from the Syowa East SuperDARN radar was used to identify individual EEP-related anomalies in our SR records in June 2011. Although SuperDARN radars are designed primarily for detecting plasma structures in the E and F region ionospheres (Greenwald et al., 1995; Chisham et al., 2007), they can also be used to estimate HF radio wave attenuation in the ionospheric D region using an approach similar to riometry (Bland et al., 2018). In this study we use the EEP event list for the Syowa East SuperDARN radar described in Bland et al. (2019). This radar is located in Antarctica at 69.00°S, 39.58°E (geographic), so all of the June 2011 events were observed under night-time/twilight conditions.
The traditional sunspot number is used to characterize the magnitude and length of the solar cycles and to identify the year(s) of the maximum and minimum solar activities. The auroral electrojet (AE) index is a measure of geomagnetic activity in the auroral zone (Davis and Sugiura, 1966) and is often applied as an indicator for EEP activity (e.g., Lam et al., 2010). These datasets are available from the OMNIWeb database (https://omniweb.gsfc.nasa.gov/form/dx1.html).
The 0.1–0.8 nm X-ray measurements of the Space Environment Monitor (SEM) instrument onboard the GOES 10 and 15 satellites is used to characterize solar radiation-related changes in the Earth–ionosphere cavity (Sátori et al., 2005; Sátori et al., 2016). Monthly average flux values were determined from the 1-min and 5-min resolution datafiles available from NOAA’s corresponding database (https://satdat.ngdc.noaa.gov/sem/goes/data/avg/).
Long-term variation of the upper boundary region of the Earth–ionosphere cavity resonator is also investigated in this study by using satellite-based wave recordings. The lower ionosphere forms the highly variable reflecting upper surface of the Earth–ionosphere waveguide (EIWG). Since far from the source, lightning impulses propagate in a guided manner, the effective height of the EIWG (reflecting altitudes) can be observed as suppressions in wave field strength at higher ELF, lower VLF frequencies around the cutoffs of distinct wave modes (see modeling details in Cummer, 2000; Ferencz et al., 2007). This effect is best recognized in case of the 1st guided mode at approximately 1.6 kHz, exhibiting often a lower intensity band in the spectrum of single impulses as well as in time averaged dynamic power spectra of the cavity background field (Toledo-Redondo et al., 2012).
Due to the excitation of the lower ionosphere by waves in the EIWG with the above described character, the wide-band ELF-VLF wave records of LEO satellites also exhibit this specific spectral pattern. The electric field data of the French DEMETER satellite (Berthelier et al., 2006) with a polar LEO orbit has been utilized here to determine guided cutoffs, and thus to follow the change of the cavity’s shape during approximately a quarter solar cycle period. Six years of night-time ELF-VLF spectra (whole years of 2005–2010) recorded at topside altitudes (660–710 km) between 65° geomagnetic latitudes have been analyzed. This uniquely rich, continuous ELF-VLF wave database is composed of power spectrum values under 20 kHz with 19.53 Hz resolution in frequencies and 2.048 s resolution in time (survey mode). Occurrences of wave power minima around the supposed cutoffs and their parameters (minimum frequency, sharpness, reliability factor) has been determined in consecutive spectrum vectors by applying a quadratic fit in the 1.4–1.95 kHz frequency range. The settings of the identifying algorithm have been fine-tuned by using a training set of several hundred of half orbits selected randomly from the whole recording base. In order to suppress noise and still maintain good spatial and temporal resolution, an averaged spectrum of eleven consecutive measurements was found optimal as input data. This step reliably finds the minima (if present) and yields approximately 1.5° spatial resolution in latitude. The effective height corresponding to the cutoff frequency is then determined by applying the condition for the transverse resonance (see e.g., Bliokh et al., 1977) of the waveguide (Toledo-Redondo et al., 2012):
We present annual averages of the effective height for different latitudinal domains. Raw data consisting of satellite coordinates, times at the mid positions of the averaged recording set and the parameters of the identified effect were stored for later analysis. The investigated domains consist of various geomagnetic latitudes: low- (|mlat| < 20°), mid- (20° ≤ |mlat| < 50°) and mid-high (50° ≤ |mlat| ≤ 65°). Data points corresponding to the South Atlantic Magnetic Anomaly (defined as −50° ≤ |lat| ≤ 0° and −90° ≤ lon ≤ 40°) were excluded when calculating the yearly averages.
Multi-station Schumann resonance observations are used in this study to investigate long-term variations in SR intensity, selected year-to-year variations, and short-term variations attributable to single EEP events that affect both magnetic hemispheres. These topics are addressed in three separate sections below.
Figure 3 displays the collection of SR intensity records available for the present study in the time window spanning about one and a half solar cycles between 2002 and 2020 (solar cycles 23 and 24) together with selected indicators of the solar and geomagnetic activity and of EEP. Subplot Figure 3A shows the monthly average values of the sunspot number, the AE index and the X-ray flux. The EEP flux of 30–300 keV electrons in daily (black) and monthly (red) time resolution are shown in Figure 3B. The EEP flux in daily time resolution is included to demonstrate its highly variable nature. The precipitation fluxes can vary by 3 orders of magnitude within a few days during geomagnetic storms (Clilverd et al., 2010). The long-term records of the first SR mode’s intensity in the HEW and HNS magnetic field components are shown in monthly time resolution from the Sousy (SOU), Hornsund (HRN), Eskdalemuir (ESK), Belsk (BEL), Shillong (SHI), Vernadsky (VRN), Maitri (MAI) and Syowa (SYO) stations in Figures 3C–J. From the different stations SR data are available in the time windows described earlier in Section Data and Methods.
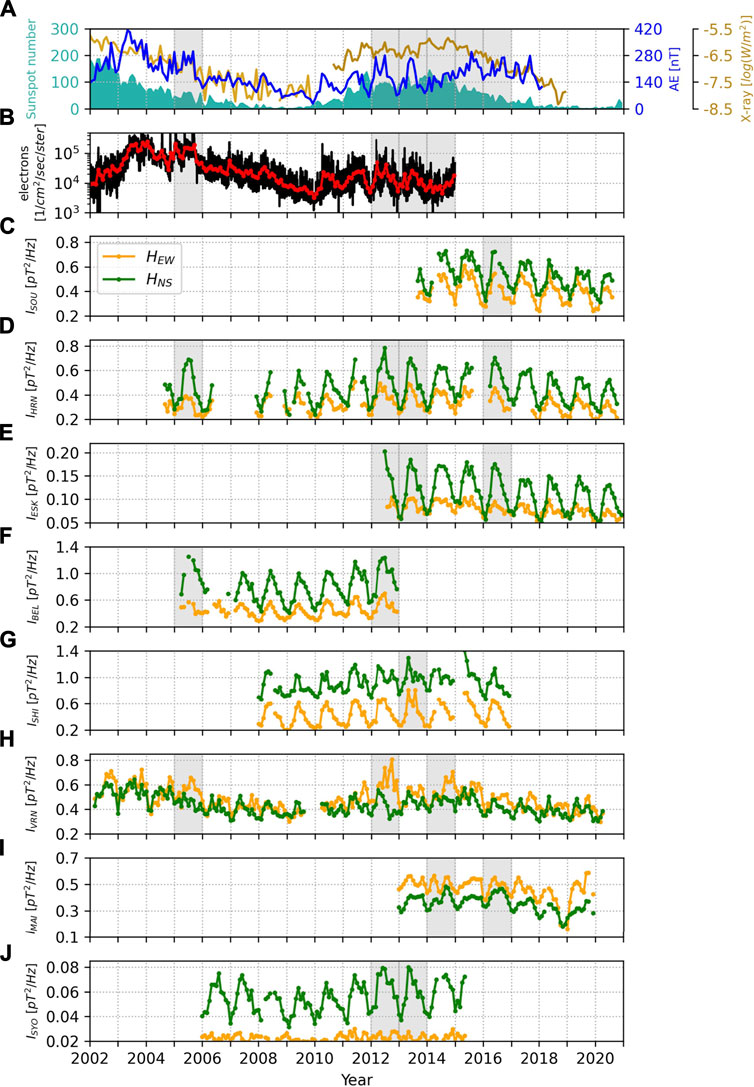
FIGURE 3. (A) Monthly average values of the sunspot number (turquoise), the AE index (blue) and the X-ray flux (GOES-10: gold, GOES-15: dark gold), (B) 30–300 keV electron precipitation fluxes in daily (black) and monthly (red) time resolution as well as the long-term records of the first SR mode’s intensity in monthly time resolution at the (C) Sousy (SOU), (D) Hornsund (HRN), (E) Eskdalemuir (ESK), (F) Belsk (BEL), (G) Shillong (SHI), (H) Vernadsky (VRN), (I) Maitri (MAI) and (J) Syowa (SYO) SR stations. Gray background highlights years with exceptional SR intensities.
As can be seen in Figure 3A, the X-ray flux follows the time variation of the sunspot number in contrast to the AE index which has a distinct phase delay with respect to the solar maxima after 2002 and 2014/2015, and also shows extraordinary behavior in 2012 and in 2013 preceding the last solar cycle maximum in 2014. A good correlation is evident between the time series of the AE index and the 30–300 keV EEP fluxes as shown in Figures 3A,B. We note that a moderate annual variation is present in both parameters with Northern Hemisphere (NH) summer maxima as noted in earlier works (e.g., Suvorova, 2017; Lockwood et al., 2020).
The SR intensity records in Figures 3C–J show a complex behavior. On one hand a seasonal variation is present in the data with the highest intensity values usually observed in NH summer months. This general behavior is in accordance with the NH summer annual maxima in the magnitude of global lightning activity (Sátori, 1996; Christian et al., 2003). We also note the presence of semi-annual variations (with spring and autumn peaks) at some SR stations (Sátori and Zieger, 1996). The absolute level of SR intensity may show up to an order of magnitude difference station-by-station. We attribute this observation primarily to the different source-observer geometries but it could also hint to problems with the absolute calibration of the stations. Calibration issues are the most likely explanation for the eye-catching differences between the SR intensity records of the SOU and HRN stations which should be almost the same based on the close proximity of the stations.
On the other hand, the solar cycle modulation is evident at all SR stations and is in phase with the solar cycle (as indicated by the sunspot number). The solar cycle modulation of SR intensity is usually more pronounced in one of the magnetic field components: in the HEW component at the VRN and SHI stations and in the HNS component at the SOU, HRN, ESK, BEL, MAI and SYO stations. Years with exceptionally high SR intensities in these field components (in comparison with neighboring years) are highlighted with grey background in Figures 3C–J: 2016 at the SOU; 2005, 2012, 2013 and 2016 at the HRN; 2012, 2013 and 2016 at the ESK; 2005 and 2012 at the BEL; 2013 at the SHI; 2005, 2012 and 2014 at the VRN; 2014 and 2016 at the MAI and 2012 and 2013 at the SYO stations. These exceptional years in SR intensity, which can be found in the declining phase of the solar cycles (2005, 2015, 2016) or in the vicinity of the solar cycle maxima (2012, 2013, 2014), are in agreement with enhanced levels of EEP as indicated by the AE index and the 30–300 keV EEP fluxes. As the solar cycle modulation of SR intensity is clearly present at the two mid-high latitude stations (ESK and BEL) and at the one low latitude (SHI) station as well, the effect is not confined to high latitudes.
The magnitude of the annual variation in SR intensity tends to follow the solar cycle as well. This behavior is in keeping with the suggestion of the solar cycle modification of cavity height. Higher magnitudes can be identified in the years near the solar maxima and smaller ones near the solar minimum (see Figures 3C–J). This observation had been noted earlier for the total horizontal magnetic field by Koloskov et al. (2020). To take a closer look at this phenomenon we have removed the yearly averages from the VRN records for each (HNS, HEW) field component and plotted the residuals (ΔI) in Figure 4. The solar cycle modulation of the annual SR intensity variation is different for the two field components at the VRN station. It is clearly more pronounced in the HEW component for the one and a half solar cycle between 2002 and 2020. At the VRN station the HEW component also shows the stronger modulation in its overall level (as compared to the HNS component) (see Figure 3H). The magnitude of the annual variation in the HEW component is the largest in 2012, second largest in 2014 and third largest in 2002. The smallest magnitude appears near the solar minimum in 2008. The solar cycle modulation of the HNS component is considerably smaller. Nevertheless, the minimum in the magnitude of the annual variation near the solar minimum in 2008/2009 and the maximum near 2012 is clearly visible in the HNS component as well.
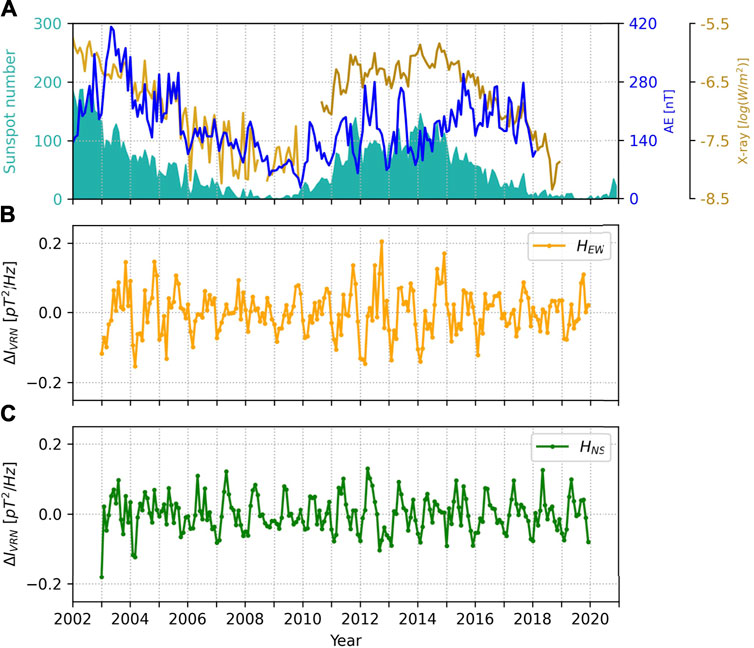
FIGURE 4. (A) Monthly average values of the sunspot number (turquoise), the AE index (blue) and the X-ray flux (GOES-10: gold, GOES-15: dark gold) as well as the residual monthly average SR intensities for the (B) HEW and (C) HNS components at the Vernadsky (VRN) station (see the main text for more details).
In order to quantify the solar cycle modulation of SR intensity we derived yearly averages and normalized them with the intensity values corresponding to the solar minimum year 2009 (δI) for the four SR stations exhibiting the longest records: HRN, SHI, VRN and SYO (Figure 5). It follows that the 100% corresponds to the year 2009 for each component of each station in the figure. When calculating the yearly averages some missing values were determined with interpolation using the SR intensity values of the neighboring months (in case of 1 missing month) or based on the same months measured in the neighboring years (in case of >1 adjacent missing months). If neither of these two approaches was feasible for any year, that year was omitted. The long-term records of spectral intensity at 11 Hz are also displayed for each (HNS, HEW) field component from the VRN station in the same format.
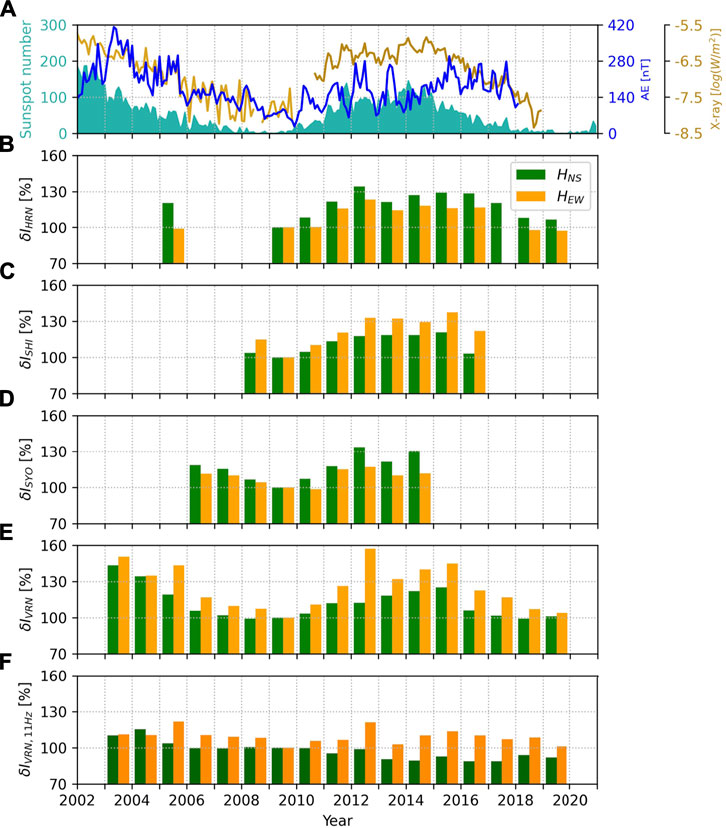
FIGURE 5. (A) Monthly average values of the sunspot number (turquoise), the AE index (blue) and the X-ray flux (GOES-10: gold, GOES-15: dark gold) as well as the normalized yearly averages of the first SR mode’s intensity at the (B) HRN, (C) SHI, (D) SYO and (E) VRN stations and (F) of the intensity at 11 Hz at the VRN station.
As we stated earlier in this section, solar radiation-related changes in the Earth–ionosphere cavity are expected to follow the solar cycle (as indicated by the sunspot number) while EEP-related changes are expected to deviate from that cycle and to show a common behavior with the AE index. Next we investigate the normalized yearly average intensities displayed in Figure 5 in this aspect. The relative SR intensity values corresponding to the first resonance mode generally follow the different phases of the solar cycle. However, this statement is rather true for the field component exhibiting smaller long-term variability (HEW at HRN and SYO, HNS at SHI and VRN) while in the more variable field component (HNS at HRN and SYO, HEW at SHI and VRN) the largest intensity enhancements are present in years of AE extremities like in 2005, 2012 and 2015. In these years, intensity enhancements of ∼20–35% can be observed at the HRN, SHI and SYO stations while at the VRN station (showing the largest variation in intensity) the enhancements are as high as 40–60% (Table 1). We also note that the long-term record of the VRN station mirrors the magnitude difference between solar cycle 23 and 24, i.e. higher intensity values correspond to previous one. The year of 2012 yields the highest relative SR intensity values at all four SR stations. Regarding the relative SR intensity values corresponding to 11 Hz at VRN the HEW component shows enhanced values (∼20%) in the years of AE extremities (2005 and 2012) (Table 2) while the HNS component exhibits a general decreasing trend throughout the investigated time period. The origin of this decreasing trend in the data is not clear at the moment.
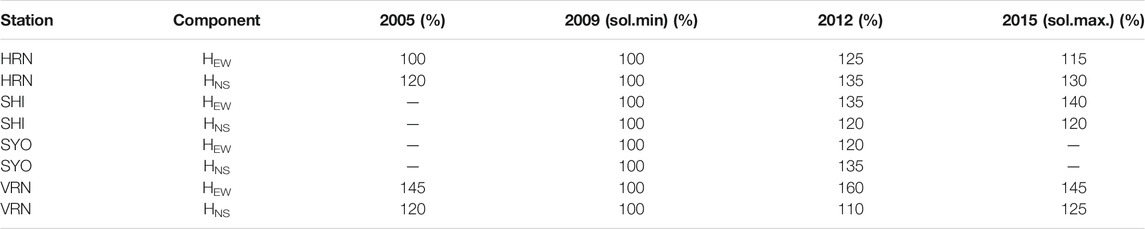
TABLE 1. Normalized yearly averages of the first SR mode’s intensity for the years 2005, 2009, 2012 and 2015.

TABLE 2. Normalized yearly averages of ELF intensity of 11 Hz at VRN for the years 2005, 2009, 2012, 2015.
As confirmed by Figure 5, it is not always the solar cycle maximum that yields the highest SR intensity values. This observation is in accordance with electron precipitation fluxes presented in Figure 3B. In Figure 6 we present the electron precipitation conditions for the Northern and Southern polar regions in the solar minimum year 2009, the solar maxima years 2002 and 2014 as well as in selected years with exceptionally high SR intensity values: 2005 and 2012, based on NOAA-15 electron precipitation fluxes. In general, the yearly averaged flux values go up and down together in all regions affected by EEP in the selected years. The year 2005 is in the declining phase of the 23rd solar cycle while 2012 is close to the last solar maximum year of 2014. Electron precipitation is clearly the weakest in the solar minimum year of 2009 as expected. However, only a small (less than one order of magnitude) increase is noticeable from 2009 to the solar maximum year of 2014. The solar maximum year of 2002 yields larger fluxes than the solar maximum year of 2014 (around one order of magnitude larger compared to the solar minimum year of 2009). On the other hand, a remarkable increase of electron precipitation flux is identifiable in the selected years 2005 and 2012 yielding exceptionally high SR intensity values as well. The enhancement is around two orders of magnitude in 2005 as compared to the solar minimum year of 2009. This robust change in EEP flux is of the same order of magnitude as the variation of solar X-rays on the solar cycle timescale (Figure 5A) (Sátori et al., 2005; Williams and Sátori, 2007).
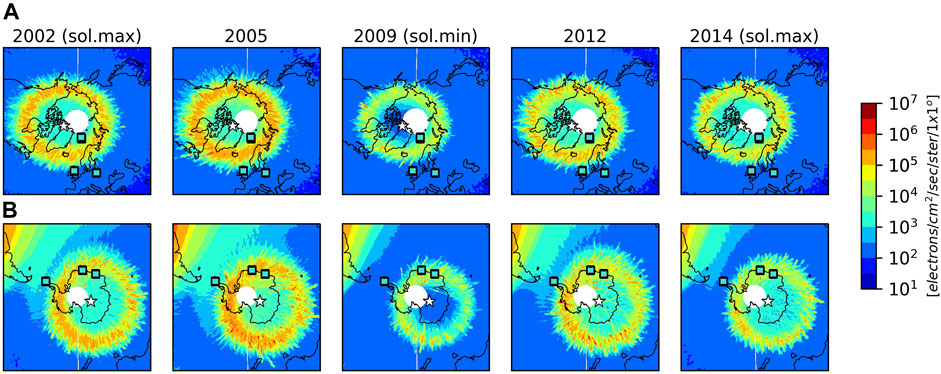
FIGURE 6. The distribution of precipitated 30–300 keV electrons for the Northern (A) and Southern (B) polar regions for the years 2002, 2005, 2009, 2012 and 2014, together with the location of the high and mid-high latitude SR stations and the geomagnetic poles (white stars).
The well-organized motions of energetic electrons along the magnetic field lines suggest that EEP events and their associated cavity deformation may often be quasi-synchronous in the Northern and Southern Hemispheres. Figure 7 shows SR intensity records for two selected days from June 2011 (14 June and 23 June) together with independently identified EEP events based on Syowa East SuperDARN radar measurements from the event collection of Bland et al. (2019). To identify non-standard (not lightning-related) variations in the diurnal SR intensity records, quiet day diurnal SR intensity curves were determined for each field component of each station for June 2011. Quiet days were selected based on the AE index as days with AE values smaller than 400 nT. Figure 7 contains the average diurnal variation of these quiet days and in addition the corresponding standard deviations. In order to investigate whether EEP events are able to modify the global Q-factor of the Earth–ionosphere cavity resonator we applied the Lorentzian fitting technique (see e.g., Mushtak and Williams, 2002) on SR spectra from the Hornsund station. In Figure 7 the extracted Q-factors are displayed in the same format as the SR intensity records.
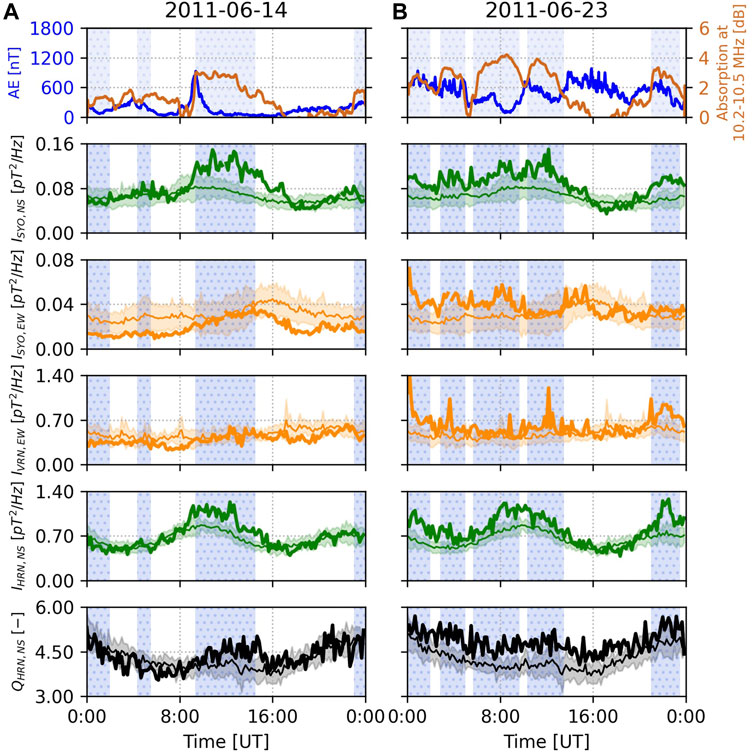
FIGURE 7. Comparison of EEP events (with respective time intervals shaded and dotted) identified in Syowa East SuperDARN radar measurements by Bland et al. (2019) and SR intensity records (HEW: orange, HNS: green) for June 14, 2011 (A) and June 23, 2011 (B). The top row shows the time variation of the AE index (blue) and the radio wave absorption values in the D-region (red) at 10.2–10.5 MHz as inferred from the radar measurements. SR intensity records from the SYO, VRN and HRN stations for the selected days (thick curves) are displayed together with the average diurnal variation of quiet days (thin curves in same color) and the corresponding standard deviations (same color shaded area) (see the main text for more details). The last row of the figure shows Q-factor records from the HRN station that tend to be enhanced during EEP events.
On June 14, 2011 the strongest EEP event within the day can be observed between 09:20 and 14:30 UT at Syowa with radio wave absorption values greater than 2 dB (Figure 7A). The event starts with a substantial increase of the AE index. SR intensity clearly increases during the event not only in the HNS component at Syowa (so near the radar) but in the Northern Hemisphere under daytime conditions at the Hornsund (HRN) station as well where increased Q-factor values (by ∼10–30%) can be observed during the event. The relative increase of SR intensity is as large as 50–100% at Syowa during this event. On June 23, 2011 several strong (absorption >3 dB) EEP events occured between 00:00 and 13:00 UT and one other event can be observed between 21:00 and 23:30 UT. The imprint of these events can be identified in both field components at SYO, in the HNS component at HRN (with increased Q-factor values by ∼10–30%) as well as in the HEW component at Vernadsky (VRN), even though the VRN station lies in a considerably different longitudinal sector than Syowa. This documented synchronous behavior provides evidence for the large spatial extents of the EEP events (∼4 h magnetic local time extent).
The effective height of the Earth–ionosphere waveguide as inferred from DEMETER satellite measurements of the waveguide cutoff frequency at night-time (see Section Satellite-Based Observations of Waveguide Cutoff for details) can be regarded as a quantity providing an independent view on the deformation of the Earth–ionosphere waveguide. Figure 8 shows the yearly average values of the effective height from 2005 to 2010 corresponding to low-, mid- and mid-high geomagnetic latitudes.
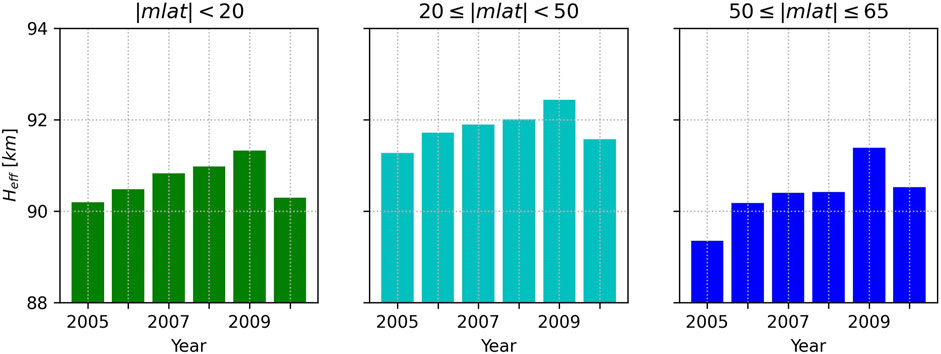
FIGURE 8. Yearly averages of the Earth–ionosphere waveguide’s effective height based on DEMETER observations. A similar solar cycle modulation is evident in each of three latitude ranges.
In general, the Earth–ionosphere waveguide height seems to be the lowest at mid-high latitudes while it is the highest at midlatitudes with average height values of 90.4 and 91.8 km, respectively. The effective height is also smaller at low latitudes (90.7 km) as compared to midlatitudes (91.8 km). Regarding the long-term trend in the data, the solar cycle variation is evident in all the investigated domains. Table 3 summarizes the relative height differences between 2005 and the solar minimum year of 2009 for low-, mid- and mid-high geomagnetic latitudes. The relative height difference is the greatest at mid-high latitudes (which represent the highest observed latitudes in this case) (2.2%) and the smallest at low latitudes (1.2%).
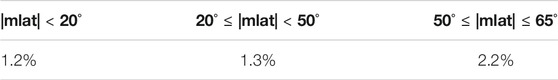
TABLE 3. Relative differences in the waveguide’s effective height between 2005 and the solar minimum year of 2009 for low-, mid- and mid-high geomagnetic latitudes.
In this section, we suggest a general interpretation for the results obtained, before attempting to estimate the height changes of the Earth–ionosphere cavity associated with EEP. Finally, we describe the most important characteristics of our SR- and DEMETER-based results.
In order to interpret correctly the obtained results it is first important to state that although SR intensity variations are generally connected with changes in the distribution and/or intensity of global lightning activity, satellite observations of lightning activity do not show any significant solar cycle variation on the global scale (Christian et al., 2003; Williams et al., 2014). This is in line with the observation that the total energy output from the Sun varies on the order of 0.1% throughout the solar cycle (Fröhlich and Lean, 1998). Therefore, the solar cycle modulation of SR intensity needs to be accounted for by long-term changes in the Earth–ionosphere cavity, i.e., by changes in the propagation conditions of ELF waves. As the solar cycle variations in Galactic Cosmic Rays (GCR) is considered to have only a negligible effect (<1%) on the intensity SR (Sátori et al., 2005) hereafter we discuss the possible effects related to the Sun.
Two fundamental mechanisms can be distinguished for the Sun-related impact on the near-Earth environment: one based on photons and the other on charged particles. The majority of solar photons arrive in the Earth’s equatorial zone while charged particles precipitate in the upper atmosphere in the high latitude precipitation belts and in the South Atlantic Magnetic Anomaly (Figure 2). The long-term behavior of these two effects is markedly different on the solar cycle timescale. While the flux of solar photons generally follows the solar cycle, the precipitation of charged particles does not (Asikainen and Ruopsa, 2016) (Figure 3). We documented both of these behaviors in long-term SR intensity records of different field components at different stations (Figure 5). Therefore, we suggest that a combined effect of photons and charged particles needs to be considered to account for all our SR-based observations (as illustrated in Figure 9).
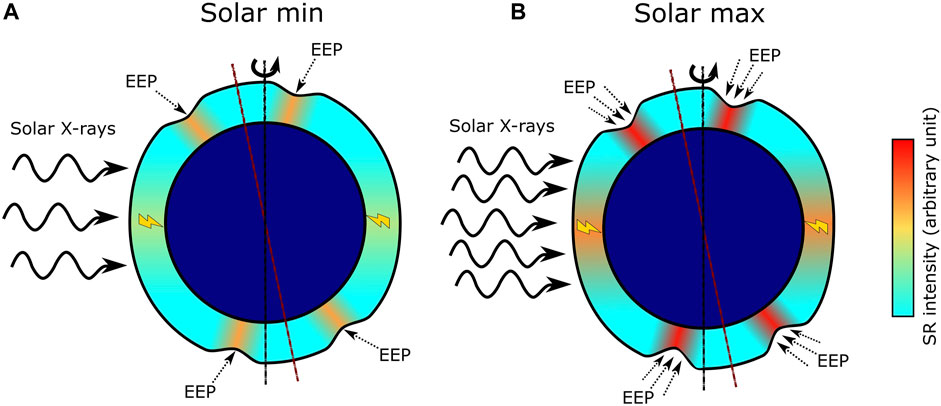
FIGURE 9. Illustration of the deformation of the Earth–ionosphere cavity at solar minimum (A) and solar maximum (B). At solar maximum X-rays and EEP reduce the cavity height more significantly (dominantly over low- and high latitudes, respectively) which results in enhanced SR intensity values beneath the deformed regions.
The long-term solar cycle modulation of the Earth–ionosphere cavity by solar X-rays had been first documented by Sátori et al. (2005) based on long-term SR frequency records. Both SR frequencies and Q-factors observed at different stations exhibited maxima during the two solar maxima in 1992 and 2002 and minima in 1996. The observed variations were interpreted on the basis of a uniform cavity and the presence of two characteristic ionospheric layers (Greifinger and Greifinger, 1978; Mushtak and Williams, 2002). The height and scale height of the lower (electric) layer were considered to be invariant over the solar cycle while for the upper (magnetic) layer the authors inferred a height decrease of 4.7 km and a scale height decrease from 6.9 to 4.2 km for the first SR mode from solar maximum to solar minimum. These changes result in an increase of the resonator’s Q-factor by 12–15% (Sátori et al., 2005). The intensity of a damped simple harmonic oscillator is known to be proportional to the square of its Q-factor (Feynman et al., 1963), in agreement with the theoretical description of SR (Nelson, 1967, Eqs 2–24; Williams et al., 2006). It follows that a 12–15% change in the Q-factor of the Earth–ionosphere cavity can result in a 25–30% increase of the first SR mode’s intensity. This estimate is in agreement with the relative SR intensity values corresponding to the HNS component at the SHI and VRN stations (Figure 5). As the Q-factor is a general property of the Earth–ionosphere cavity this effect should contribute to the long-term SR intensity variation at all SR stations around the globe.
The phenomenon involving charged particles deposited into the atmosphere through various heliophysical and geomagnetic processes is called energetic particle precipitation (EPP). EPP covers a wide variety of charged particles but protons and electrons are the two main constituents to be considered with significantly high fluxes (Mironova et al., 2015). As it has been stated in earlier works (Williams et al., 2014; Sátori et al., 2016) proton events are too sporadic in time to yield the observed persistent long-term modulation of SR intensity. Therefore, we consider the precipitation of electrons hereafter which is usually referred to as energetic electron precipitation (EEP).
The expected effect of EEP on SR strongly depends on the characteristic penetration depth of the electrons into the atmosphere. SR are primarily responsive to two specific altitude regions where the ionospheric dissipation is predominant (Sátori et al., 2016). These are usually referred to as the electric (capacitive) and magnetic (inductive) heights (Madden and Thompson, 1965; Greifinger and Greifinger, 1978) to be found at around 50–60 km and 90–110 km altitudes, respectively (Mushtak and Williams, 2002; Greifinger et al., 2007; Kulak and Mlynarczyk, 2013). The main factor determining the penetration depth of precipitating electrons is their energy (Figure 1). Model calculations show that the magnetic height can be affected by electrons in the 1–30 keV energy range while the electric height only by electrons with energy above 300 keV (Rees, 1989; Sátori et al., 2016; Artamonov et al., 2017; Mironova et al., 2019a). However, EISCAT incoherent scatter radar measurements show that in connection with EEP the isopycnic surfaces of electron density can occasionally descend by some tens of kilometers in the high latitude D- and E-region (Belova et al., 2005; Miyoshi et al., 2015). To account for such a large decrease in the SR magnetic height the effect of 30–300 keV electrons needs to be considered as well. Generally, it is true that the lower the energy of electrons the higher the precipitated flux and the more continuous the precipitation in time (Lam et al., 2010). Therefore, to account for the long-term modulation of SR intensity, electrons in the 1–300 keV energy range (affecting the magnetic height of SR) are the best candidates. This energy range covers both auroral and radiation belt electrons (Mironova et al., 2015). EEP is expected to affect the height of the Earth–ionosphere cavity and the measured magnetic field locally where precipitation occurs consistent with the conservation of energy flux (Sentman and Fraser, 1991; Williams et al., 2014; Sátori et al., 2016). A permanent local decrease in the magnetic height is expected to modulate the amplitudes of all natural variations in SR intensity on all timescales as shown for the magnitudes of the annual variation in Figure 4.
We also showed that EEP events are able to modify the Q-factor of the Earth–ionosphere cavity (Figure 7) which is in line with our observation that they can affect both hemispheres as well as large longitudinal regions. This effect may result in globally observable changes in SR intensity but this aspect needs to be investigated further in the future. It is possible that the long-term 12–15% change in the Q-factor of the Earth–ionosphere cavity documented by Sátori et al. (2005) may involve EEP-related changes as well.
Two important pieces of evidence were shown in this paper for an EEP-related deformation of the Earth–ionosphere cavity. First, exceptional increases of SR intensities were documented in certain years, as in 2005 and 2012 (Figure 5), which are not solar maximum years, but are characterized by enhanced electron fluxes (Figure 6). Based on satellite observations Asikainen and Ruopsa (2016) reported on enhanced electron precipitation at >30 and >100 keV fluxes related to Coronal Mass Ejections (CMEs) in 2005 and 2012 which is in agreement with our findings. Second, direct observation of EEP-related SR intensity enhancements were presented at widely separated SR stations on two selected days in June 2011 (Figure 7).
In this section we estimate the long-term average ionospheric height changes associated with EEP for the HEW component at the VRN station yielding the highest intensity variation on the solar cycle timescale (40–60%) (Table 4). If we accept that 25–30% of the observed SR intensity enhancement is attributable to a global change of the cavity’s Q-factor (independently of whether this change is related solely to X-rays or to EEP as well) the remaining 15–30% in years with the largest enhancement can be considered to be related to the local waveguide deformation caused by EEP.
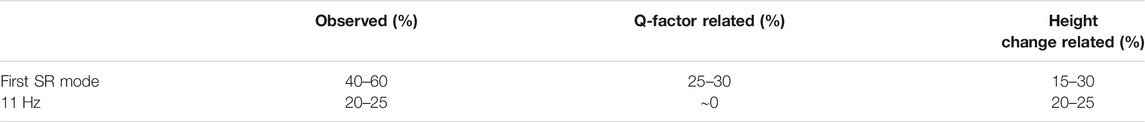
TABLE 4. Observed SR intensity variations at the VRN station in the HEW field component and the predicted contributions of global Q-factor- and local ionospheric height changes.
We estimate the EEP-related height changes of the waveguide from the intensity at 11 Hz (the first minimum between the first and second resonance peaks) which can be considered to be mostly unaffected by the Q-factor of the cavity. Greifinger et al. (2005) have made predictions for changes in the SR amplitude as a function of the ionospheric height above the source and above the observer in the form of symbolic equations. According to these equations the measured magnetic intensity at a given frequency is proportional to the reciprocal value of the squared local magnetic height. It follows that the 20–25% intensity enhancements documented at 11 Hz in 2005 and 2012 (which are in a good agreement with the resonance mode-based estimation of 15–30%) correspond to an average magnetic height decrease of ∼10% at VRN.
This average decrease in the magnetic height is considerably smaller than the decrease of isopycnic surfaces during an EEP event as observed by the EISCAT radar, with enhanced ionization down to ∼70 km (e.g., Miyoshi et al., 2015). Although EEP events are very common especially near solar maximum and can result in SR intensity enhancements in order of 50–100% (as shown in Figure 7), they are not permanent and each event is often confined to a limited longitudinal range (Clilverd et al., 2007; Bland et al., 2021). Therefore, the smaller percentage average increase of SR intensity and the inferred decrease in the magnetic height is reasonable on the interannual timescale.
As can be seen in Figure 5 and Table 1 the solar cycle modulation of SR intensity can be different station-to-station depending on the station location and on the wave propagation path corresponding to the measured field component. A deformation in the Earth–ionosphere cavity is expected to affect SR intensity locally where the deformation occurs, whereas a change in its Q-factor is expected to affect SR intensity (I) globally, for all propagation paths that cross the affected area(s). As we stated earlier, we aimed to describe these effects by two simple formulas:
and
where Q and Hm denote the Q-factor of the cavity and its local magnetic height, respectively. The solar cycle modulation of the HNS field component at the SHI and VRN stations can be well described by the X-ray-related global variation of the cavity’s Q-factor and the HEW field component at the VRN station by the combined effect of the Q-factor variation and an EEP-related height decrease of ∼10%.
At different SR stations the wave propagation directions corresponding to the perpendicular magnetic coils are differently affected by EEP. It seems to be generally true that the longer the propagation path crosses the precipitation-affected area(s) the larger the solar cycle modulation of SR intensity. It is usually the HNS coil, sensitive to the east-west propagation direction, which yields propagation paths with greater extents beneath the precipitation belt. This is the case for the high latitude SOU, HRN, MAI and SYO stations (see Figures 2A,E,F) where the solar cycle modulation is indeed larger in the HNS component as compared to the HEW component (Figures 3, 5). The HNS coil is also more responsive at the two mid-high latitude SR stations ESK and BEL in spite the fact that the GCPs corresponding to the HNS component at these two stations do not cross the northern precipitation belt according to Figures 2B,C. This result may indicate that the precipitation belts are more extended towards lower latitudes as shown by the POES data. Towards lower latitudes the flux of precipitating 30–300 keV electrons decreases and POES is known to underestimate flux values below ∼104–105 electrons/cm2/sec/ster (van de Kamp et al., 2016; van de Kamp et al., 2018).
The magnetic height of SR is affected by electrons with energies lower than 30 keV (the lowest channel of POES satellites) and these electrons may form wider precipitation belts. At the VRN and SHI stations the SR response is more pronounced in the HEW coil, sensitive to the north-south propagation direction. At SHI the HEW is the one field component with a GCP crossing the precipitation belts (Figure 2G) while at VRN the propagation path corresponding to the HEW component meets not only the southern precipitation belt but the South Atlantic Magnetic Anomaly as well (Figure 2B). Besides the dominant response of the HEW component as compared to the HNS component this fact may account for the observation that the HEW component at the VRN station yields the highest response among all the investigated records. Another factor that should be important for this observation is that the longitudinal sector including America is shown to be affected by harder electron precipitation spectrum than the other parts of the globe which can be attributed to the tilted-offset dipole magnetic field of Earth (Clilverd et al., 2007). We note that 2012 shows the highest relative SR intensity values at the HRN and VRN stations (Figure 5; Table 1) despite the observation that POES measurements show larger EEP fluxes in 2005 as compared to 2012 (Figure 6). We can explain this observation by the fact that in 2012 both X-rays and EEP show enhanced values while 2005 is in the declining phase of the solar cycle characterized by a lower X-ray flux (Figures 3A,B).
As we noted earlier in Section Results EEP is known to have seasonal dependence (Clilverd et al., 2007; Suvorova, 2017; Bland et al., 2019), i.e., June/July maxima in its occurrence rate can be identified in both hemispheres. We note that rocket measurements at polar stations also showed maximum electron density in June/July at the 80 km height of the ionospheric D-region in both hemispheres (Danilov and Vanina, 1999). We suggest that this seasonal dependence may contribute to the observed modulation of the magnitude of the annual SR intensity variation (Figure 4).
DEMETER observations showed that the effective height of the Earth–ionosphere waveguide is generally the highest at mid geomagnetic latitudes, lower at low geomagnetic latitudes and the very lowest at the highest observed geomagnetic latitudes (in proximity to the precipitation belts) (Table 3) which is in a general agreement with our SR-based findings that the Earth–ionosphere cavity is deformed by solar X-rays (dominantly over lower latitudes) and by EEP (dominantly over higher latitudes) (as illustrated in Figure 9). The deformation effect of EEP has a larger variability on the solar cycle timescale which results in a larger height reduction at higher latitudes as shown by the effective heights. This finding is in keeping with the high latitude location of the precipitation belts. Although the documented 2.2% height decrease between 2005 and 2009 corresponding to mid-high latitudes is considerably smaller than the ∼10% value inferred for the VRN station, one needs to keep in mind that 1) DEMETER data are restricted to geomagnetic latitudes lower than 65°, 2) the South Atlantic Magnetic Anomaly (which is in close vicinity to VRN) is excluded from the dataset, 3) electromagnetic waves with higher ELF, lower VLF frequencies are responsive at different altitude regions than the magnetic height of SR and 4) this is an integrated value for all longitudes while the longitudinal sector including America is shown to be affected by harder electron precipitation.
It is to be noted as well that the inferred effective height values were measured exclusively on the nightside by DEMETER at 22:30 LT where solar X-rays are absent. We can explain this seeming contradiction by assuming that lightning impulses may propagate in the dayside hemisphere of the EIWG before escaping the waveguide on the nightside (but close to the local sunset).
In the present study long-term records of the first SR magnetic mode intensity from eight different stations were compared with the fluxes of precipitating medium energy electrons and with independently identified EEP events to confirm that the long-term solar cycle modulation of SR intensity (documented originally at high latitude stations) is caused by the EEP-related local deformation of the Earth–ionosphere cavity. Although our results generally confirmed the presence of EEP-related deformations in the Earth–ionosphere cavity, we also found that the EEP-effect alone cannot account for all our SR-based observations and that the combined effect of solar X-rays and EEP needs to be considered. We have identified four distinct factors that can play important role in shaping long-term SR intensity records: 1) X-ray related deformations of the cavity, 2) X-ray related changes in the Q-factor of the cavity, 3) EEP-related deformations of the cavity and 4) EEP-related changes in the Q-factor of the cavity. The exact interplay of these factors depends on the location of the SR station and the orientation of the magnetic coils, i.e., on the wave propagation path corresponding to the actual measurement. The deformation of the cavity is expected to affect SR intensity locally beneath the deformed area(s) whereas Q-factor variations are expected to introduce globally observable changes in SR intensity.
In connection to EEP we showed that there is a very good phase agreement between certain SR intensity records and the long-term variation of 30–300 keV EEP fluxes as provided by the POES NOAA-15 satellite which is most conspicuous in years not exactly coincident with the solar maximum, as in for example 2005 and 2012 when both the EEP flux and SR intensity showed exceptional values. We documented SR intensity and Q-factor enhancements connected to individual EEP events on the daily timescale in June 2011 by comparing the corresponding records with EEP events independently identified by Bland et al. (2019) in the measurements of the Syowa East SuperDARN radar. We showed that the effect of certain EEP events can be identified in SR intensity records from both the Southern and Northern Hemispheres (under different sunlit conditions), from different longitudinal sectors and the EEP-related relative enhancement of SR intensity can attain values as high as 50–100%. The solar cycle modulation of the magnitude of the annual SR intensity variation was demonstrated and efforts were made to quantify the ionospheric height changes associated with EEP. It has been shown that near the Antarctic station Vernadsky (yielding the largest long-term SR intensity variation) the upper (magnetic) characteristic height of the Earth–ionosphere cavity resonator decreased by ∼10% in the most conspicuous years of EEP activity.
This paper is the first one to show that the solar cycle variation of SR intensity is consistently observable all around the globe and gives a qualitative explanation for this observation. Quantitative conclusions were made as well based on simple SR intensity—cavity height, SR intensity—Q-factor relations, which describe the identified effects reasonably well. To achieve a more detailed interpretation of our observation-based results it is necessary to apply a full model of the SR. We hope that our work will motivate and assist such works in the future.
The effective height of the Earth–ionosphere waveguide as inferred from DEMETER measurements provided an independent view on the long-term deformation of the Earth–ionosphere cavity. We showed that the largest height of the cavity can be found at mid (geomagnetic) latitudes while the waveguide is depressed at low and high (geomagnetic) latitudes which is in a general agreement with our general conclusion that the Earth–ionosphere cavity is deformed by solar X-rays dominantly over lower latitudes and by EEP dominantly over higher latitudes. It has also been demonstrated that effective height of the waveguide varies on the solar cycle timescale at all (geomagnetic) latitudes and this effect is stronger at high (geomagnetic) latitudes where energetic electrons can enter along magnetic field lines.
We suggest that SR measurements may be suitable to collect information and thus to monitor changes in the lower ionosphere associated with EEP which would be highly valuable for investigating space weather processes and their impact on atmospheric chemistry (see e.g., Mironova et al., 2015; Duderstadt et al., 2021). Such measurements could yield quasi-continuous information on EEP in a global sense in contrast to the space and time limitations of satellite and radar observations.
Finally, the value of high latitude stations for SR-based research should be emphasized. Due to their remote locations, these SR stations have usually much lower cultural noise contamination than stations at low- and mid-latitudes. And because they are also remote from thunderstorm activity they are not subjected to the interference caused by nearby lightning. These two properties make high latitude stations highly valuable for SR-connected research aims, such as the reconstruction of global lightning activity (see e.g., Bozóki et al., 2019; Prácser et al., 2019) by inversion methods. However, because of the extra-terrestrial effects on the SR cavity at higher latitude as documented in this work, it is of vital importance to realize all possible masking effects when analyzing these data-sets in connection with lightning-related climate research.
The raw data supporting the conclusion of this article will be made available by the authors, without undue reservation.
TB, GS, and EW led the interpretation of results and the writing of the manuscript. TB processed the SR data and prepared the figures. IM processed the POES data and contributed to the interpretation of EEP-related results. PS and ST-R processed the DEMETER data and contributed to the interpretation of DEMETER-based results. EB provided information on individual EEP events and contributed to the interpretation of the EEP-related results. AK, YY, and OB provided SR data from the Vernadsky and Sousy stations and contributed to the interpretation of SR-related results. MN provided SR data from the Hornsund and Belsk stations. AS and RR provided SR data from the Maitri and Shillong stations. MS provided SR data from the Syowa station. CB provided SR data from the Eskdalemuir station. YL collected and organized long-term SR records in the MIT SuperCloud database. RB applied the Lorentzian fitting technique on SR data.
The work of TB and GS was supported by the COST Action CA15211 and by the National Research, Development, and Innovation Office, Hungary-NKFIH, K115836. The contribution to this work by EW and YL has been supported by both the Grainger Foundation and by the US National Science Foundation (Grant # 6942679). The work of the Ukrainian team (AK, YY, and OB) was partially supported by MES of Ukraine projects 0121U112293 and NAS of Ukraine projects 0121U108110 and 0121U108635. EB is supported by the Research Council of Norway (grant #287427). IM work on processing, interpreting results of EEP data was supported by a grant from the Russian Science Foundation (Project RSF No. 20-67-46016). The database of POES data was prepared by IM in the frame of the SPBU “Ozone Layer and Upper Atmosphere Research Laboratory” supported by the Ministry of Science and Higher Education of the Russian Federation under agreement 075-15- 2021-583.
The authors declare that the research was conducted in the absence of any commercial or financial relationships that could be construed as a potential conflict of interest.
The handling editor is currently organizing a Research Topic with one of the authors IM.
All claims expressed in this article are solely those of the authors and do not necessarily represent those of their affiliated organizations, or those of the publisher, the editors and the reviewers. Any product that may be evaluated in this article, or claim that may be made by its manufacturer, is not guaranteed or endorsed by the publisher.
We are very grateful to Chris Hall, scientific leader of Tromso Geophysical Observatory, and to the staff of TGO for the support of the Ukrainian ELF magnetometer-unit operating at Svalbard as well as to the National Antarctic Scientific Center of Ukraine providing SR measurements at the Ukrainian Antarctic station “Akademik Vernadsky.” Kornél Kapás’ kind assistance is acknowledged in revisiting theoretical considerations in P. H. Nelson’s thesis.
Artamonov, A., Mironova, I., Kovaltsov, G., Mishev, A., Plotnikov, E., and Konstantinova, N. (2017). Calculation of Atmospheric Ionization Induced by Electrons with Non-Vertical Precipitation: Updated Model CRAC-EPII. Adv. Space Res. 59 (9), 2295–2300. doi:10.1016/j.asr.2017.02.019
Asikainen, T., and Ruopsa, M. (2016). Solar Wind Drivers of Energetic Electron Precipitation. J. Geophys. Res. Space Phys. 121 (3), 2209–2225. doi:10.1002/2015JA022215
Baker, D. N., Erickson, P. J., Fennell, J. F., Foster, J. C., Jaynes, A. N., and Verronen, P. T. (2018). Space Weather Effects in the Earth's Radiation Belts. Space Sci. Rev. 214, 17. doi:10.1007/s11214-017-0452-7
Balser, M., and Wagner, C. A. (1960). Observations of Earth-Ionosphere Cavity Resonances. Nature 188, 638–641. doi:10.1038/188638a0
Beggan, C. D., and Musur, M. (2018). Observation of Ionospheric Alfvén Resonances at 1-30 Hz and Their Superposition with the Schumann Resonances. J. Geophys. Res. Space Phys. 123 (5), 4202–4214. doi:10.1029/2018JA025264
Belova, E., Kirkwood, S., Ekeberg, J., Osepian, A., Häggström, I., Nilsson, H., et al. (2005). The Dynamical Background of Polar Mesosphere Winter Echoes from Simultaneous EISCAT and ESRAD Observations. Ann. Geophys. 23 (4), 1239–1247. doi:10.5194/angeo-23-1239-2005
Berthelier, J. J., Godefroy, M., Leblanc, F., Malingre, M., Menvielle, M., Lagoutte, D., et al. (2006). ICE, the Electric Field Experiment on DEMETER. Planet. Space Sci. 54 (5), 456–471. doi:10.1016/j.pss.2005.10.016
Bland, E. C., Heino, E., Kosch, M. J., and Partamies, N. (2018). SuperDARN Radar-Derived HF Radio Attenuation During the September 2017 Solar Proton Events. Space Weather 16 (10), 1455–1469. doi:10.1029/2018SW001916
Bland, E. C., Partamies, N., Heino, E., Yukimatu, A. S., and Miyaoka, H. (2019). Energetic Electron Precipitation Occurrence Rates Determined Using the Syowa East SuperDARN Radar. J. Geophys. Res. Space Phys. 124, 6253–6265. doi:10.1029/2018JA026437
Bland, E., Tesema, F., and Partamies, N. (2021). D-region Impact Area of Energetic Electron Precipitation During Pulsating Aurora. Ann. Geophys. 39, 135–149. doi:10.5194/angeo-39-135-2021
Bliokh, P. V., Galyuk, Y. P., Hünninen, E. M., Nikolaenko, A. P., and Rabinovich, L. M. (1977). Resonance Effects in the Earth-Ionosphere Cavity. Radiophys Quan. Electron 20, 339–345. doi:10.1007/BF01033918
Bór, J., Sátori, G., Barta, V., Szabóné-André, K., Szendrői, J., Wesztergom, V., et al. (2020). Measurements of Atmospheric Electricity in the Széchenyi István Geophysical Observatory, Hungary. Hist. Geo Space Sci. 11 (1), 53–70. doi:10.5194/hgss-11-53-2020
Bozóki, T., Prácser, E., Sátori, G., Dálya, G., Kapás, K., and Takátsy, J. (2019). Modeling Schumann Resonances with Schupy. J. Atmos. Solar-Terrestrial Phys. 196, 105144. doi:10.1016/j.jastp.2019.105144
Chisham, G., Lester, M., Milan, S. E., Freeman, M. P., Bristow, W. A., Grocott, A., et al. (2007). A Decade of the Super Dual Auroral Radar Network (SuperDARN): Scientific Achievements, New Techniques and Future Directions. Surv. Geophys. 28, 33–109. doi:10.1007/s10712-007-9017-8
Christian, H. J., Blakeslee, R. J., Boccippio, D. J., Boeck, W. L., Buechler, D. E., Driscoll, K. T., et al. (2003). Global Frequency and Distribution of Lightning as Observed from Space by the Optical Transient Detector. J. Geophys. Res. 108, D1. doi:10.1029/2002JD002347
Christofilakis, V., Tatsis, G., Votis, C., Contopoulos, I., Repapis, C., and Tritakis, V. (2019). Significant ELF Perturbations in the Schumann Resonance Band Before and During a Shallow Mid-magnitude Seismic Activity in the Greek Area (Kalpaki). J. Atmos. Solar-Terrestrial Phys. 182, 138–146. doi:10.1016/j.jastp.2018.11.009
Clilverd, M. A., Meredith, N. P., Horne, R. B., Glauert, S. A., Anderson, R. R., Thomson, N. R., et al. (2007). Longitudinal and Seasonal Variations in Plasmaspheric Electron Density: Implications for Electron Precipitation. J. Geophys. Res. 112, A11. doi:10.1029/2007JA012416
Clilverd, M. A., Rodger, C. J., Gamble, R. J., Ulich, T., Raita, T., Seppälä, A., et al. (2010). Ground-based Estimates of Outer Radiation belt Energetic Electron Precipitation Fluxes into the Atmosphere. J. Geophys. Res. 115, A12. doi:10.1029/2010JA015638
Cummer, S. A. (2000). Modeling Electromagnetic Propagation in the Earth-Ionosphere Waveguide. IEEE Trans. Antennas Propagat. 48, 1420–1429. doi:10.1109/8.898776
Danilov, A. D., and Vanina, L. B. (1999). Comparison of the Polar D-Region Behavior in the Arctic and Antarctic. Adv. Space Res. 24 (12), 1655–1664. doi:10.1016/S0273-1177(99)00333-6
Davis, T. N., and Sugiura, M. (1966). Auroral Electrojet Activity indexAEand its Universal Time Variations. J. Geophys. Res. 71 (3), 785–801. doi:10.1029/JZ071i003p00785
Duderstadt, K. A., Huang, C. L., Spence, H. E., Smith, S., Blake, J. B., Crew, A. B., et al. (2021). Estimating the Impacts of Radiation Belt Electrons on Atmospheric Chemistry Using FIREBIRD II and Van Allen Probes Observations. Geophys. Res. Atmos. 126, e2020JD033098. doi:10.1029/2020JD033098
Dyrda, M., Kulak, A., Mlynarczyk, J., and Ostrowski, M. (2015). Novel Analysis of a Sudden Ionospheric Disturbance Using Schumann Resonance Measurements. J. Geophys. Res. Space Phys. 120 (3), 2255–2262. doi:10.1002/2014JA020854
Elhalel, G., Price, C., Fixler, D., and Shainberg, A. (2019). Cardioprotection from Stress Conditions by Weak Magnetic Fields in the Schumann Resonance Band. Sci. Rep. 9, 1645. doi:10.1038/s41598-018-36341-z
Fdez-Arroyabe, P., Fornieles-Callejón, J., Santurtún, A., Szangolies, L., and Donner, R. V. (2020). Schumann Resonance and Cardiovascular Hospital Admission in the Area of Granada, Spain: An Event Coincidence Analysis Approach. Sci. Total Environ. 705, 135813. doi:10.1016/j.scitotenv.2019.135813
Ferencz, O. E., Ferencz, C., Steinbach, P., Lichtenberger, J., Hamar, D., Parrot, M., et al. (2007). The Effect of Subionospheric Propagation on Whistlers Recorded by the DEMETER Satellite - Observation and Modelling. Ann. Geophys. 25, 1103–1112. doi:10.5194/angeo-25-1103-2007
Feynman, R. P., Leighton, R. B., and Sands, M. L. (1963). The Feynman Lectures on Physics, 1. Reading, Mass: Addison-Wesley Pub. Co.
Florios, K., Contopoulos, I., Christofilakis, V., Tatsis, G., Chronopoulos, S., Repapis, C., et al. (2020). Pre-seismic Electromagnetic Perturbations in Two Earthquakes in Northern Greece. Pure Appl. Geophys. 177, 787–799. doi:10.1007/s00024-019-02362-6
Fornieles-Callejón, J., Salinas, A., Toledo-Redondo, S., Portí, J., Méndez, A., Navarro, E. A., et al. (2015). Extremely Low Frequency Band Station for Natural Electromagnetic Noise Measurement. Radio Sci. 50 (3), 191–201. doi:10.1002/2014RS005567
Fraser-Smith, A. C., McGill, P. R., Bernardi, A., Helliwell, R. A., and Ladd, M. E. (1991a). “Global Measurements of Low-Frequency Radio Noise,” in Environmental and Space Electromagnetics. Editor H. Kikuchi (Tokyo): Springer).
Fraser-Smith, A. C., Ogawa, T., McGill, P. R., Bernardi, A., Ladd, M. E., and Helliwell, R. A. (1991b). “Measurements of ELF/VLF Radio Noise in Japan,” in Environmental and Space Electromagnetics. Editor H. Kikuchi (Tokyo): Springer). doi:10.1007/978-4-431-68162-5_20
Fröhlich, C., and Lean, J. (1998). The Sun's Total Irradiance: Cycles, Trends and Related Climate Change Uncertainties since 1976. Geophys. Res. Lett. 25 (23), 4377–4380. doi:10.1029/1998GL900157
Füllekrug, M., Fraser-Smith, A. C., and Schlegel, K. (2002). Global Ionospheric D-Layer Height Monitoring. Europhys. Lett. 59, 626–632. doi:10.1209/epl/i2002-00150-y
Galuk, Y. P., Kudintseva, I. G., Nickolaenko, A. P., and Hayakawa, M. (2019). Scattering of ELF Radio Waves by a Localized Non-uniformity in the Lower Ionosphere. J. Atmos. Solar-Terrestrial Phys. 194, 105093. doi:10.1016/j.jastp.2019.105093
Greenwald, R. A., Baker, K. B., Dudeney, J. R., Pinnock, M., Jones, T. B., Thomas, E. C., et al. (1995). DARN/SuperDARN. Space Sci. Rev. 71, 761–796. doi:10.1007/BF00751350
Greifinger, C., and Greifinger, P. (1978). Approximate Method for Determining ELF Eigenvalues in the Earth-Ionosphere Waveguide. Radio Sci. 13 (5), 831–837. doi:10.1029/RS013i005p00831
Greifinger, P., Mushtak, V., and Williams, E. (2005). “The Lower Characteristic ELF Altitude of the Earth–Ionosphere Waveguide: Schumann Resonance Observations and Aeronomical Estimates,” in IEEE 6th International Symposium on Electromagnetic Compatibility and Electromagnetic Ecology, St. Petersburg, Russia, 21-24 June 2005 (IEEE), 250–254. doi:10.1109/EMCECO.2005.1513116
Greifinger, P. S., Mushtak, V. C., and Williams, E. R. (2007). On Modeling the Lower Characteristic ELF Altitude from Aeronomical Data. Radio Sci. 42, 2. doi:10.1029/2006RS003500
Guha, A., Williams, E., Boldi, R., Sátori, G., Nagy, T., Bór, J., et al. (2017). Aliasing of the Schumann Resonance Background Signal by Sprite-Associated Q-Bursts. J. Atmos. Solar-Terrestrial Phys. 165-166, 25–37. doi:10.1016/j.jastp.2017.11.003
Hayakawa, M., Nickolaenko, A. P., Galuk, Y. P., and Kudintseva, I. G. (2020). Scattering of Extremely Low Frequency Electromagnetic Waves by a Localized Seismogenic Ionospheric Perturbation: Observation and Interpretation. Radio Sci. 55, 12. doi:10.1029/2020RS007130
Koloskov, A. V., Nickolaenko, A. P., Yampolsky, Y. M., Yu, C., Budanov, O. V., and Budanov, O. V. (2020). Variations of Global Thunderstorm Activity Derived from the Long-Term Schumann Resonance Monitoring in the Antarctic and in the Arctic. J. Atmos. Solar-Terrestrial Phys. 201, 105231. doi:10.1016/j.jastp.2020.105231
Kudintseva, I. G., Galuk, Y. P., Nickolaenko, A. P., and Hayakawa, M. (2018). Modifications of Middle Atmosphere Conductivity During Sudden Ionospheric Disturbances Deduced from Changes of Schumann Resonance Peak Frequencies. Radio Sci. 53 (5), 670–682. doi:10.1029/2018RS006554
Kulak, A., Kubisz, J., Michalec, A., Zięba, S., and Nieckarz, Z. (2003b). Solar Variations in Extremely Low Frequency Propagation Parameters: 2. Observations of Schumann Resonances and Computation of the ELF Attenuation Parameter. J. Geophys. Res. 108, A7. doi:10.1029/2002JA009305
Kulak, A., and Mlynarczyk, J. (2013). ELF Propagation Parameters for the Ground-Ionosphere Waveguide with Finite Ground Conductivity. IEEE Trans. Antennas Propagat. 61 (4), 2269–2275. doi:10.1109/TAP.2012.2227445
Kulak, A., Zięba, S., Micek, S., and Nieckarz, Z. (2003a). Solar Variations in Extremely Low Frequency Propagation Parameters: 1. A Two-Dimensional Telegraph Equation (TDTE) Model of ELF Propagation and Fundamental Parameters of Schumann Resonances. J. Geophys. Res. 108, A7. doi:10.1029/2002JA009304
Lam, M. M., Horne, R. B., Meredith, N. P., Glauert, S. A., Moffat-Griffin, T., and Green, J. C. (2010). Origin of Energetic Electron Precipitation >30 keV into the Atmosphere. J. Geophys. Res. 115, A4. doi:10.1029/2009JA014619
Lockwood, M., Owens, M. J., Barnard, L. A., Haines, C., Scott, C. J., McWilliams, K. A., et al. (2020). Semi-Annual, Annual and Universal Time Variations in the Magnetosphere and in Geomagnetic Activity: 1. Geomagnetic Data. J. Space Weather Space Clim. 10, 23. doi:10.1051/swsc/2020023
Madden, T., and Thompson, W. (1965). Low-Frequency Electromagnetic Oscillations of the Earth-Ionosphere Cavity. Rev. Geophys. 3 (2), 211–254. doi:10.1029/RG003i002p00211
Manu, S., Rawat, R., Sinha, A. K., Gurubaran, S., and Jeeva, K. (2015). Schumann Resonances Observed at Maitri, Antarctica: Diurnal Variation and its Interpretation in Terms of Global Thunderstorm Activity. Curr. Sci. 109 (4), 784–790.
Melnikov, A., Price, C., Sátori, G., and Füllekrug, M. (2004). Influence of Solar Terminator Passages on Schumann Resonance Parameters. J. Atmos. Solar-Terrestrial Phys. 66 (13-14), 1187–1194. doi:10.1016/j.jastp.2004.05.014
Mironova, I. A., Aplin, K. L., Arnold, F., Bazilevskaya, G. A., Harrison, R. G., Krivolutsky, A. A., et al. (2015). Energetic Particle Influence on the Earth's Atmosphere. Space Sci. Rev. 194, 1–96. doi:10.1007/s11214-015-0185-4
Mironova, I., Artamonov, A. A., Bazilevskaya, G. A., Rozanov, E. V., Kovaltsov, G. A., Makhmutov, V. S., et al. (2019b). Ionization of the Polar Atmosphere by Energetic Electron Precipitation Retrieved from Balloon Measurements. Geophys. Res. Lett. 46, 990–996. doi:10.1029/2018GL079421
Mironova, I., Bazilevskaya, G., Kovaltsov, G. A. A., Artamonov, A., Rozanov, E., Mishev, A., et al. (2019a). Spectra of High Energy Electron Precipitation and Atmospheric Ionization Rates Retrieval from Balloon Measurements. Sci. Total Environ. 693, 133242. doi:10.1016/j.scitotenv.2019.07.048
Miyoshi, Y., Oyama, S., Saito, S., Kurita, S., Fujiwara, H., Kataoka, R., et al. (2015). Energetic Electron Precipitation Associated with Pulsating Aurora: EISCAT and Van Allen Probe Observations. J. Geophys. Res. Space Phys. 120 (4), 2754–2766. doi:10.1002/2014JA020690
Mushtak, V. C., and Williams, E. R. (2002). ELF Propagation Parameters for Uniform Models of the Earth‐ionosphere Waveguide. J. Atmos. Sol. Terr. Phys. 64 (18), 1989–2001. doi:10.1016/S1364-6826(02)00222-5
Musur, M. A., and Beggan, C. D. (2019). Seasonal and Solar Cycle Variation of Schumann Resonance Intensity and Frequency at Eskdalemuir Observatory, UK. Sun and Geosphere 14, 1. doi:10.31401/SunGeo.2019.01.11
Nelson, P. H. (1967). Ionospheric Perturbations and Schumann Resonance Data. PhD thesis. Project NR‐371‐401 (Cambridge Mass: Geophysics Lab. MIT).
Neska, M., Czubak, P., and Reda, J. (2019). Schumann Resonance Monitoring in Hornsund (Spitsbergen) and Suwałki (Poland). Publs. Inst. Geophys. P.A.S. 425, 41–45. doi:10.25171/InstGeoph_PAS_Publs-2019-008
Neska, M., Sátori, G., Szendroi, J., Marianiuk, J., Nowozynski, K., and Tomczyk, S. (2007). Schumann Resonance Observation in Polish Polar Station at Spitsbergen and Central Geophysical Observatory in Belsk. Publs. Inst. Geophys. Pol. Acad. Sc. C 99, 398.
Nickolaenko, A., and Hayakawa, M. (2014). Schumann Resonance for Tyros. Tokyo: Springer. doi:10.1007/978-4-431-54358-9
Nickolaenko, A. P., and Hayakawa, M. (2002). Resonances in the Earth–Ionosphere Cavity. Amsterdam: Springer Netherlands.
Nickolaenko, A. P., Koloskov, A. V., Hayakawa, M., Yampolski, Yu. M., Budanov, O. V., and Korepanov, V. E. (2015). 11-Year Solar Cycle in Schumann Resonance Data as Observed in Antarctica. Sun and Geosphere 10 (1), 39–50.
Ondrášková, A., Kostecký, P., Ševčík, S., and Rosenberg, L. (2007). Long-Term Observations of Schumann Resonances at Modra Observatory. Radio Sci. 42, 2. doi:10.1029/2006RS003478
Ondrášková, A., Ševčík, S., and Kostecký, P. (2011). Decrease of Schumann Resonance Frequencies and Changes in the Effective Lightning Areas Toward the Solar Cycle Minimum of 2008-2009. J. Atmos. Solar-Terrestrial Phys. 73 (4), 534–543. doi:10.1016/j.jastp.2010.11.013
Pazos, M., Mendoza, B., Sierra, P., Andrade, E., Rodríguez, D., Mendoza, V., et al. (2019). Analysis of the Effects of Geomagnetic Storms in the Schumann Resonance Station Data in Mexico. J. Atmos. Solar-Terrestrial Phys. 193, 105091. doi:10.1016/j.jastp.2019.105091
Prácser, E., Bozóki, T., Sátori, G., Takátsy, J., Williams, E., and Guha, A. (2021). Two Approaches for Modeling ELF Wave Propagation in the Earth-Ionosphere Cavity with Day-Night Asymmetry. IEEE Trans. Antennas Propagat. 69, 4093–4099. doi:10.1109/TAP.2020.3044669
Prácser, E., Bozóki, T., Sátori, G., Williams, E., Guha, A., and Yu, H. (2019). Reconstruction of Global Lightning Activity Based on Schumann Resonance Measurements: Model Description and Synthetic Tests. Radio Sci. 54 (3), 254–267. doi:10.1029/2018RS006772
Price, C., and Melnikov, A. (2004). Diurnal, Seasonal and Inter-Annual Variations in the Schumann Resonance Parameters. J. Atmos. Solar-Terrestrial Phys. 66 (13-14), 1179–1185. doi:10.1016/j.jastp.2004.05.004
Price, C., Williams, E., Elhalel, G., and Sentman, D. (2021). Natural ELF Fields in the Atmosphere and in Living Organisms. Int. J. Biometeorol. 65, 85–92. doi:10.1007/s00484-020-01864-6
Rawat, R., Singh, A. K., Pathan, B. M., Sinha, A. K., Jeeva, K., Labde, S., et al. (2012). Diurnal and Seasonal Characteristics of Schumann Resonance. Mysore, India: 39th COSPAR Scientific Assembly.
Rees, M. H. (1989). Physics and Chemistry of the Upper Atmosphere. Cambridge: Cambridge University Press.
Reeves, G. D., McAdams, K. L., Friedel, R. H. W., and O'Brien, T. P. (2003). Acceleration and Loss of Relativistic Electrons During Geomagnetic Storms. Geophys. Res. Lett. 30, 10. doi:10.1029/2002GL016513
Rodger, C. J., Clilverd, M. A., Green, J. C., and Lam, M. M. (2010). Use of POES SEM-2 Observations to Examine Radiation Belt Dynamics and Energetic Electron Precipitation into the Atmosphere. J. Geophys. Res. 115, A4. doi:10.1029/2008JA014023
Roldugin, V. C., Maltsev, Y. P., Vasiljev, A. N., Schokotov, A. Y., and Belyajev, G. G. (2004a). Diurnal Variations of Schumann Resonance Frequency in NS and EW Magnetic Components. J. Geophys. Res. 109, A8. doi:10.1029/2004JA010487
Roldugin, V. C., Maltsev, Y. P., Vasiljev, A. N., Schokotov, A. Y., and Belyajev, G. G. (2004b). Schumann Resonance Frequency Increase during Solar X-ray Bursts. J. Geophys. Res. 109, A1. doi:10.1029/2003JA010019
Roldugin, V. C., Maltsev, Y. P., Vasiljev, A. N., Shvets, A. V., and Nikolaenko, A. P. (2003). Changes of Schumann Resonance Parameters During the Solar Proton Event of 14 July 2000. J. Geophys. Res. 108, A3. doi:10.1029/2002JA009495
Salinas, A., Toledo-Redondo, S., Navarro, E. A., Fornieles-Callejón, J., and Portí, J. A. (2016). Solar Storm Effects During Saint Patrick's Days in 2013 and 2015 on the Schumann Resonances Measured by the ELF Station at Sierra Nevada (Spain). J. Geophys. Res. Space Phys. 121 (12), 234. doi:10.1002/2016JA023253
Sato, M., and Fukunishi, H. (2005). New Evidence for a Link Between Lightning Activity and Tropical Upper Cloud Coverage. Geophys. Res. Lett. 32, 12. doi:10.1029/2005GL022865
Sátori, G. (1996). Monitoring Schumann Resonances-11. Daily and Seasonal Frequency Variations. J. Atmos. Terrestrial Phys. 58 (13), 1483–1488. doi:10.1016/0021-9169(95)00146-8
Sátori, G., Neska, M., Williams, E., and Szendrői, J. (2007). Signatures of the Day-Night Asymmetry of the Earth-Ionosphere Cavity in High Time Resolution Schumann Resonance Records. Radio Sci. 42, 2. doi:10.1029/2006RS003483
Sátori, G., Szendröi, J., and Verö, J. (1996). Monitoring Schumann Resonances-I. Methodology. J. Atmos. Terrestrial Phys. 58 (13), 1475–1481. doi:10.1016/0021-9169(95)00145-X
Sátori, G., Williams, E., and Mushtak, V. (2005). Response of the Earth-Ionosphere Cavity Resonator to the 11-year Solar Cycle in X-Radiation. J. Atmos. Solar-Terrestrial Phys. 67 (6), 553–562. doi:10.1016/j.jastp.2004.12.006
Sátori, G., Williams, E., Price, C., Boldi, R., Koloskov, A., Yampolski, Y., et al. (2016). Effects of Energetic Solar Emissions on the Earth-Ionosphere Cavity of Schumann Resonances. Surv. Geophys. 37, 757–789. doi:10.1007/s10712-016-9369-z
Sátori, G., and Zieger, B. (1996). Spectral Characteristics of Schumann Resonances Observed in Central Europe. J. Geophys. Res. 101, 29663–29669. doi:10.1029/96JD00549
Savoska, S., Fdez-Arroyabe, P., Cifra, M., Kourtidis, K., Rozanov, E., Nicoll, K., et al. (2021). Toward the Creation of an Ontology for the Coupling of Atmospheric Electricity with Biological Systems. Int. J. Biometeorol. 65, 31–44. doi:10.1007/s00484-020-02051-3
Schlegel, K., and Füllekrug, M. (1999). Schumann Resonance Parameter Changes during High-Energy Particle Precipitation. J. Geophys. Res. 104, 10111–10118. doi:10.1029/1999JA900056
Schumann, W. O. (1952). Über die strahlungslosen Eigenschwingungen einer leitenden Kugel, die von einer Luftschicht und einer Ionosphärenhülle umgeben ist. Z. Naturfirschung 7 (2), 149–154. doi:10.1515/zna-1952-0202
Sentman, D. D., and Fraser, B. J. (1991). Simultaneous Observations of Schumann Resonances in California and Australia: Evidence for Intensity Modulation by the Local Height of theDregion. J. Geophys. Res. 96 (15), 15973–15984. doi:10.1029/91JA01085
Shvets, A. V., Nickolaenko, A. P., and Chebrov, V. N. (2017). Effect of Solar Flares on the Schumann-Resonance Frequences. Radiophys Quan. El 60, 186–199. doi:10.1007/s11141-017-9789-8
Singh, B., Tyagi, R., Hobara, Y., and Hayakawa, M. (2014). X-Rays and Solar Proton Event Induced Changes in the First Mode Schumann Resonance Frequency Observed at a Low Latitude Station Agra, India. J. Atmos. Solar-Terrestrial Phys. 113, 1–9. doi:10.1016/j.jastp.2014.02.010
Sukhov, V., Sukhova, E., Sinitsyna, Y., Gromova, E., Mshenskaya, N., Ryabkova, A., et al. (2021). Influence of Magnetic Field with Schumann Resonance Frequencies on Photosynthetic Light Reactions in Wheat and Pea. Cells 10 (1), 149. doi:10.3390/cells10010149
Suvorova, A. V. (2017). Flux Enhancements of > 30 keV Electrons at Low Drift Shells L. J. Geophys. Res. Space Phys. 122 (12), 274. doi:10.1002/2017JA024556
Tatsis, G., Christofilakis, V., Chronopoulos, S. K., Baldoumas, G., Sakkas, A., Paschalidou, A. K., et al. (2020). Study of the Variations in the Schumann Resonances Parameters Measured in a Southern Mediterranean Environment. Sci. Total Environ. 715, 136926. doi:10.1016/j.scitotenv.2020.136926
Tatsis, G., Sakkas, A., Christofilakis, V., Baldoumas, G., Chronopoulos, S. K., Paschalidou, A. K., et al. (2021). Correlation of Local Lightning Activity with Extra Low Frequency Detector for Schumann Resonance Measurements. Sci. Total Environ. 787, 147671. doi:10.1016/j.scitotenv.2021.147671
Toledo-Redondo, S., Parrot, M., and Salinas, A. (2012). Variation of the First Cut-Off Frequency of the Earth-Ionosphere Waveguide Observed by DEMETER. J. Geophys. Res. 117, A4. doi:10.1029/2011JA017400
Toledo-Redondo, S., Salinas, A., Portí, J., Morente, J. A., Fornieles, J., Méndez, A., et al. (2010). Study of Schumann Resonances Based on Magnetotelluric Records from the Western Mediterranean and Antarctica. J. Geophys. Res. 115, D22. doi:10.1029/2010JD014316
Tritakis, V., Contopoulos, I., Florios, C., Tatsis, G., Christofilakis, V., Baldoumas, G., et al. (2021). Anthropogenic Noise and its Footprint on ELF Schumann Resonance Recordings. Front. Earth Sci. 9. doi:10.3389/feart.2021.646277
van de Kamp, M., Rodger, C. J., Seppälä, A., Clilverd, M. A., and Verronen, P. T. (2018). An Updated Model Providing Long-Term Data Sets of Energetic Electron Precipitation, Including Zonal Dependence. J. Geophys. Res. Atmos. 123 (17), 9891–9915. doi:10.1029/2017JD028253
van de Kamp, M., Seppälä, A., Clilverd, M. A., Rodger, C. J., Verronen, P. T., and Whittaker, I. C. (2016). A Model Providing Long-Term Data Sets of Energetic Electron Precipitation during Geomagnetic Storms. J. Geophys. Res. Atmos. 121 (12), 520. doi:10.1002/2015JD024212
Welch, P. (1967). The Use of Fast Fourier Transform for the Estimation of Power Spectra: A Method Based on Time Averaging over Short, Modified Periodograms. IEEE Trans. Audio Electroacoust. 15 (2), 70–73. doi:10.1109/TAU.1967.1161901
Williams, E., Bozóki, T., Sátori, G., Price, C., Steinbach, P., Guha, A., et al. (2021). Evolution of Global Lightning in the Transition from Cold to Warm Phase Preceding Two Super El Niño Events. Geophys. Res. Atmos. 126, 3. doi:10.1029/2020JD033526
Williams, E. (2016). Comments on: “11-year Cycle in Schumann Resonance Data as Observed in Antarctica”. Sun and Geosphere 11 (1), 75–76.
Williams, E., Guha, A., Boldi, R., Satori, G., Koloskov, A., and Yampolski, Y. (2014). “Global Circuit Response to the 11-Year Solar Cycle: Changes in Source or in Medium?,” in XV International Conference on Atmospheric Electricity, Norman, Oklahoma, USA, 15-20 June 2014.
Williams, E. R., Mushtak, V. C., and Nickolaenko, A. P. (2006). Distinguishing Ionospheric Models Using Schumann Resonance Spectra. J. Geophys. Res. 111 (D16). doi:10.1029/2005JD006944
Williams, E. R., Rothkin, K., Stevenson, D., and Boccippio, D. (2000). Global Lightning Variations Caused by Changes in Thunderstorm Flash Rate and by Changes in the Number of Thunderstorms. J. Appl. Meteorol. Climatol. (TRMM Spec. Issue) 39 (12), 2223–2230. doi:10.1175/1520-0450(2001)040<2223:GLVCBC>2.0.CO;2
Williams, E. R., and Sátori, G. (2007). Solar Radiation-Induced Changes in Ionospheric Height and the Schumann Resonance Waveguide on Different Timescales. Radio Sci. 42, 2. doi:10.1029/2006RS003494
Williams, E. R. (1992). The Schumann Resonance: A Global Tropical Thermometer. Science 256 (5060), 1184–1187. doi:10.1126/science.256.5060.1184
Yatsevich, E. I., Nickolaenko, A. P., and Pechonaya, O. B. (2008). Diurnal and Seasonal Variations in the Intensities and Peak Frequencies of the First Three Schumann-Resonance Modes. Radiophys Quan. El 51, 528–538. doi:10.1007/s11141-008-9056-0
Zhou, H., and Qiao, X. (2015). Studies of the Variations of the First Schumann Resonance Frequency During the Solar Flare on 7 March 2012. J. Geophys. Res. Atmos. 120 (10), 4600–4612. doi:10.1002/2014JD022696
Keywords: Schumann resonance, earth-ionosphere cavity, energetic electron precipitation, solar cycle, solar X-rays, DEMETER, extremely low frequency, Q-factor
Citation: Bozóki T, Sátori G, Williams E, Mironova I, Steinbach P, Bland EC, Koloskov A, Yampolski YM, Budanov OV, Neska M, Sinha AK, Rawat R, Sato M, Beggan CD, Toledo-Redondo S, Liu Y and Boldi R (2021) Solar Cycle-Modulated Deformation of the Earth–Ionosphere Cavity. Front. Earth Sci. 9:689127. doi: 10.3389/feart.2021.689127
Received: 31 March 2021; Accepted: 10 August 2021;
Published: 26 August 2021.
Edited by:
Konstantinos Kourtidis, Democritus University of Thrace, GreeceReviewed by:
Rosane Rodrigues Chaves, Federal University of Rio Grande do Norte, BrazilCopyright © 2021 Bozóki, Sátori, Williams, Mironova, Steinbach, Bland, Koloskov, Yampolski, Budanov, Neska, Sinha, Rawat, Sato, Beggan, Toledo-Redondo, Liu and Boldi. This is an open-access article distributed under the terms of the Creative Commons Attribution License (CC BY). The use, distribution or reproduction in other forums is permitted, provided the original author(s) and the copyright owner(s) are credited and that the original publication in this journal is cited, in accordance with accepted academic practice. No use, distribution or reproduction is permitted which does not comply with these terms.
*Correspondence: Tamás Bozóki, Ym96b2tpLnRhbWFzQGVwc3MuaHU=
Disclaimer: All claims expressed in this article are solely those of the authors and do not necessarily represent those of their affiliated organizations, or those of the publisher, the editors and the reviewers. Any product that may be evaluated in this article or claim that may be made by its manufacturer is not guaranteed or endorsed by the publisher.
Research integrity at Frontiers
Learn more about the work of our research integrity team to safeguard the quality of each article we publish.