
94% of researchers rate our articles as excellent or good
Learn more about the work of our research integrity team to safeguard the quality of each article we publish.
Find out more
ORIGINAL RESEARCH article
Front. Earth Sci., 01 December 2021
Sec. Interdisciplinary Climate Studies
Volume 9 - 2021 | https://doi.org/10.3389/feart.2021.688250
To investigate the pure long-term influence of single mega volcanic eruption (SMVE) of universal significance on Arctic temperature changes in summer and winter, the Samalas eruption in Indonesia which is the largest eruption over the past millennium is selected as an ideal eruption for simulation study based on Community Earth System Model. The significant Arctic cooling lasts for 16 years after the Samalas eruption. The obvious Arctic cooling shifts from summer to winter, and this seasonal change of cooling after the SMVE only exists in the high-latitude Arctic region. The cooling range in Arctic summer is larger than that in winter during the first 2 years, due to the strong weakening effect of volcanic aerosol on summer incident solar radiation and the snow-ice positive feedback caused by the rapid expansion of summer sea ice, while the winter sea ice in the same period doesn’t increase obviously. Starting from the third year, the Arctic winter cooling is more intense and lasting than summer cooling. The direct weakening effect of aerosol on solar radiation, which is the main heat source in Arctic summer, is greatly weakened during this period, making summer cooling difficult to sustain. However, as the main heat source in Arctic winter, the sea surface upward longwave radiation, sensible heat, and latent heat transport still maintain a large decrease. Furthermore, sea ice expansion and albedo increase result in the decrease in solar radiation and heat absorbed and stored by the ocean in summer. And the isolation effect of sea ice expansion on air-sea heat transfer in winter during this period makes the heat transfer from the ocean to the atmosphere correspondingly reduce in winter, thus intensifying the Arctic winter cooling. Additionally, the Arctic Oscillation (AO) changes from the negative phase to the positive phase in summer after the SMVE (such as Samalas), while it is reversed in winter. This phase change of AO is also one of the reasons for the seasonal changes in Arctic cooling.
Global warming is more and more severe with the increase of greenhouse gases after the Industrial Revolution. The warming over the Arctic is particularly serious. In recent decades, the rise in Arctic surface air temperature has almost doubled the global average, which is the so-called Arctic amplification effect (Serreze and Francis, 2006; Screen and Simmonds, 2010). Due to the strong sensitivity of polar climate to external forcing and its influence on the global climate system, Arctic climate change has become the focus of earth system research (Zanchettin et al., 2014).
Volcanic eruption, as a sudden occurred natural factor, plays an important role in suppressing global and Arctic warming. Large volcanic eruption, especially the mega tropical eruption, injects SO2 into the stratosphere, where it changes into sulfate aerosols and spreads out globally over following months after the eruption, and influences incoming solar radiation (Iles and Hegerl, 2014). A previous modeling study proposed that the inclusion of volcanic forcing enhanced climate variability on annual-to-decadal timescales, and the decades with negative global temperature trends became about 50% more commonplace with volcanic activity (Bethke et al., 2017). In the past 2,500 years, large-scale volcanic eruptions in the tropics and high latitudes were the main driving factors of interannual to decadal temperature changes in the Northern Hemisphere (NH) (Sigl et al., 2015). A previous study has found that global cooling will occur after a large volcanic eruption, and the cooling is most obvious in the middle and high latitudes of the NH (Man et al., 2014). After volcanic eruption, due to the strong weakening effect of aerosol on incident solar radiation, the temperature drops abruptly, which leads to the extensive growth of ice sheet and the expansion of snow cover in the high latitudes of the NH, increasing albedo and further strengthening the cold surface temperature anomalies (Zhong et al., 2010). The most important long-term impact is the cooling of high latitudes in the NH caused by multiple tropical volcanic eruptions, which indicates that the positive feedback mechanism associated with ice and snow cover could lead to the long-term cooling of the Arctic climate (Schneider et al., 2009). Some scholars have pointed out that the increase of albedo, the expansion of sea ice, and the decrease of sea temperature produce a continuous drop of summer air temperature across Arctic North Atlantic continents (Miller et al., 2012). It can be seen that the decrease of Arctic temperature after a large volcanic eruption is a broad consensus of the scientific community.
The most direct reason for the summer cooling over the Arctic is that the sulfate aerosol released by volcanic eruption shields and weakens the incident solar radiation, resulting in the decrease of solar radiation reaching the surface in summer, which will lead to surface cooling. However, in boreal winter, because the Arctic is in the polar night for a long time and there is little incoming solar radiation, would a large volcanic eruption also cause significant cooling in the Arctic? The previous study has shown that the Arctic is the most impacted latitude band in the winter after volcanic eruptions, because of the ice-albedo feedback and changes in the circulation of the atmosphere and the ocean (Schneider et al., 2009). Although volcanic aerosol forcing is strongest in the summer, the cooling response at NH high latitudes following volcanic eruptions appears to be most persistent in the boreal winter (Schneider et al., 2009; Liu et al., 2020b). Some scholars also pointed out that after eliminating the direct radiation forcing caused by explosive volcanic activity, four consecutive volcanic eruptions in the 13th century led to a significant expansion of sea ice in the NH, especially in March (Zhong et al., 2010). These studies suggest that the changes in Arctic temperature and sea ice in the winter also respond strongly to the large volcanic eruption.
Previous studies have paid more attention to the Arctic temperature changes after volcanic eruptions but mostly based on the climate simulation experiments with multiple external forcings or continuous volcanic eruption disturbances, which means that it is difficult to obtain the pure long-term climatic effect of the single mega volcanic eruption (SMVE) on Arctic cooling. Moreover, there is still a lack of in-depth research on the similarities and differences of Arctic cooling changes in summer and winter after the mega volcanic eruption. Besides, it has been shown that in the winter, the relative effects of direct radiative forcing and dynamical changes are different for very large tropical eruptions compared with smaller eruptions (Schneider et al., 2009). Therefore, it is necessary to investigate the response of the Arctic winter cooling to the SMVE. What are the similarities and differences between summer and winter cooling in the Arctic after the SMVE? In which season does the temperature drop more strongly? What accounts for these differences? These questions need to be further explored.
In this study, the Samalas mega volcanic eruption is selected as an ideal eruption case for simulation study to address these questions based on Community Earth System Model (CESM). The 1258 AD Samalas mega volcanic eruption in Lombok Island, Indonesia, which was estimated to have been about eight times larger than the 1991 Pinatubo volcanic eruption (Gao et al., 2008), was the largest volcanic eruption over the past 1,500 years with sulfur deposition in ice cores reaching twice the volume of 1815 AD Tambora volcanic eruption (Guillet et al., 2017; Liu et al., 2020a). Sedimentological analyses of deposits confirm the exceptional size of this event, which had both an eruption magnitude and a volcanic explosivity index of seven and a peak intensity of 12 (Vidal et al., 2015; Guillet et al., 2017). Sulfate aerosol transport into both hemispheres suggests Samalas event is a low latitude eruption with an initial injection of 260 ± 60 Tg SO2 (Oppenheimer, 2003). During the Samalas eruption, more than 40 km3 of dense magma was expelled and the eruption column is estimated to have reached altitudes of 43 km (Guillet et al., 2017). The scale of this emission causes a global temperature decrease during the second half of the 13th century (Lavigne et al., 2013; Vidal et al., 2015; Vidal et al., 2016). Based on proxy records and historic evidence, previous studies suggested that NH experienced some of the coldest summers of the past millennium in the following 2 years after the Samalas volcanic eruption (Briffa et al., 2001; Oppenheimer, 2003; Guillet et al., 2017). A recent modeling study also showed that it would take nearly two decades for the global and hemispheric cooling caused by the Samalas mega eruption to disappear completely if other external forcings and new volcanic disturbances were excluded (Liu et al., 2020b). Most previous volcanic modeling studies that contain the Samalas eruption focused on the cumulative climatic effects of a sequence of volcanic eruptions, such as Samalas and the following three eruptions in the 13th century (Schneider et al., 2009; Zhong et al., 2010; Miller et al., 2012; Slawinska and Robock, 2018). There is still a lack of research on the pure long-term effect of SMVE (such as Samalas magnitude) on temperature changes in summer and winter over the Arctic region.
The organizational structure of this paper is as follows: Section 2 introduces the model and experiments. Section 3 shows and discusses the detailed response and mechanisms of Arctic temperature changes in summer and winter to SMVE (such as Samalas). Section 4 presents the main conclusions of this study.
The fully-coupled Community Earth System Model 1.0.3 (CESM 1.0.3) low-resolution version T31_g37 (equivalent to 3.75° × 3.75°) is used to carry out the climate simulation experiments in this study, given the limited computing resources available to us and the limitation of server settings. The CESM, which is developed by National Center for Atmospheric Research (NCAR), consists of the Community Atmosphere Model version 4 (CAM4) (Neale et al., 2013), the Parallel Ocean Program version 2 (POP2) (Danabasoglu et al., 2012), the Community Land Model version 4 (CLM4) (Lawrence et al., 2012), and the Sea Ice Model version 4 (CICE4) (Caldeira and Cvijanovic, 2014). Through comparing with observations, reconstructions, and multi-model simulations, the good simulation performance and reliability of CESM have been verified by numerous previous studies (Marsh et al., 2013; Lehner et al., 2015; Wang et al., 2015; Otto-Bliesner et al., 2016; Stevenson et al., 2016).
A 2400-years control experiment (Ctrl) which uses fixed external forcing conditions of 1850 AD was carried out firstly, with the first 400 years as spin-up run (Wang et al., 2015). Then, to better highlight the climatic impact of SMVE, the mega volcanic sensitivity experiments (Vol) which contain 8-member ensemble simulations with a length of 20 model years are performed. Each Vol member is initiated with different initial conditions adopted from the Ctrl and driven by the same prescribed mega volcanic forcing. Compared with Ctrl, the volcanic forcing is the only changing external forcing in the Vol. In this study, the magnitude of SMVE refers to the magnitude of Samalas mega volcanic eruption which is an ideal historical event. Each Vol member is forced by the reconstructed 1258 AD Samalas mega volcanic forcing based on Ice-core Volcanic Index 2 (Gao et al., 2008). Additionally, in order to isolate the net climatic effects of volcanic forcing more clearly, we choose eight members from the Ctrl to form a no-volcano ensemble. The model years of these eight no-volcano members chosen from the Ctrl are the same as the years when volcanic forcing was placed in the Vol. The climate anomalies in each Vol experiment are calculated as the departures from the corresponding unperturbed counterpart (Vol-Ctrl). Compared with four NH temperature reconstructions, the Vol simulation results are good and reliable (Liu et al., 2020b).
In this study, the Samalas mega volcanic eruption is assumed to occur in April. The eruption year and the first year after the Samalas eruption are named year 0 and year 1, respectively, with the same naming scheme for other years. The summer refers to June to September (JJAS), and the winter refers to December to March (DJFM).
The time series of monthly mean surface air temperature (SAT) anomalies over NH and Arctic region (60°N–90°N) are shown in Figure 1A. A clear SAT decrease over NH following Samalas volcanic eruption can be seen in the ensemble mean results, particularly over the Arctic region. The NH cooling anomalies are significant from year 0 to year 5 and return to normal state completely after two decades. The greatest cooling over NH occurs in year 0 and year 1. Compared with the NH, the Arctic temperature drops much more, and the seasonal fluctuations are stronger. The maximum temperature decrease over the Arctic (−7.78°C) is almost twice larger than that of NH (−3.95°C). The Arctic experiences significant cooling from year 0 to year 15, that is, before the month 192, and the SAT decreases with sharp seasonal fluctuations. This suggests that the impact of the Samalas mega volcanic eruption on Arctic temperature change is more dramatic and that there is a strong signal of seasonal variations in Arctic cooling.
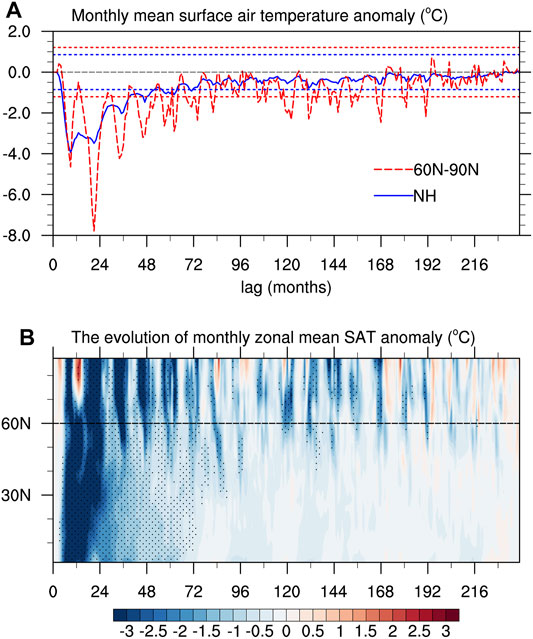
FIGURE 1. (A) Time series of monthly mean surface air temperature (SAT) anomaly over NH (blue solid line) and Arctic (60°N–90°N, red dashed line). The blue and red horizontal dots lines in (A) indicate the standard deviation of SAT over the NH and Arctic, respectively. (B) The evolution of monthly zonal mean SAT anomaly over NH. The dots in (B) denote areas with confidence exceeding the 90% level. Lag (0) represents the January of the eruption year.
To better understand the latitude-dependence of SAT changes, the time evolution of monthly zonal mean SAT anomaly is shown in Figure 1B. The strongest cooling after the Samalas eruption appears in year 0 and year 1 both in the mid-low latitudes and high latitudes over NH (Figure 1B). The latitude-dependence of SAT changes exhibits a polar-amplification phenomenon partly due to ice-albedo positive feedback in the high latitudes. From the perspective of latitude distribution, after the volcanic eruption, the SAT decrease over mid-low latitudes is significant for 6 years (year 0–5, i.e. month 0–72), while the SAT decrease over Arctic (60°N–90°N) lasts for 16 years (year 0–15, i.e. month 0–192). In combination with Figures 1A,B, it can be seen that the cooling over the Arctic plays a dominant role in the continued cooling over NH from month 72 to month 240. Interestingly, it also can be seen from Figure 1 that the remarkable Arctic cooling shifts from summer in the earlier period to winter in the later period after the Samalas mega volcanic eruption.
Figure 2 shows the time series of SAT anomalies in summer (JJAS) and winter (DJFM) over the Arctic after the Samalas volcanic eruption. The seasonal shifts in Arctic temperature changes after SMVE can be seen more clearly in Figure 2. The amplitude of SAT decrease is much larger in the first and second summer than in winter. However, from third summer and winter, the situation is reversed, i.e., the SAT drops more in winter than in summer basically. In this reversed situation, the SAT changes over the Arctic are undulate and gradually return to the normal state after the 16th year. To reveal these seasonal changes in Arctic cooling after SMVE, we select three time periods to analyze the characteristics and mechanisms. The first period (Period-1, P1), the second period (Period-2, P2), and the third period (Period-3, P3) are 1st to 2nd, 3rd to 8th, and 9th to 16th summer and winter after the Samalas mega volcanic eruption, respectively.
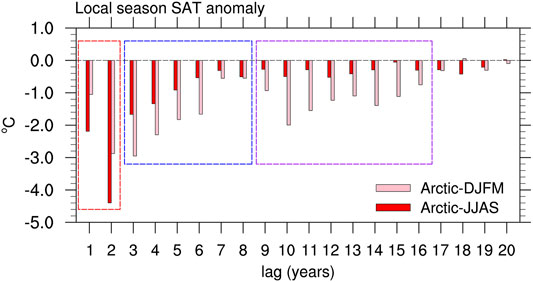
FIGURE 2. Surface air temperature (SAT) anomalies in summer (JJAS, red bar) and winter (DJFM, pink bar) over the Arctic after the Samalas mega volcanic eruption. Lag (1) represents the first summer and winter after the eruption. The red, blue, and purple dashed box represents Period-1 (P1), Period-2 (P2), and Period-3 (P3), respectively.
The annual cycle of the SAT anomalies over the Arctic during the three periods (Period-1, Period-2, and Period-3) are shown in Figure 3. The Arctic cooling after the Samalas mega volcanic eruption is very strong in Period-1, with the strongest cooling in September and October, and the weakest cooling in April and May. In Period-2, the Arctic cooling is weaker than that of Period-1. The seasonal distribution of Arctic cooling has a minimum in June and July with a peak occurring in November and December. Compared to summer and winter, the most significant cooling appears in autumn for the first two periods, while the processes and mechanisms for this phenomenon are still uncertain and require further study. In Period-3, the Arctic cooling continues to weaken compared with that in Period-1 and Period-2, but similar to that in Period-2, it continues to show the characteristics that the cooling in winter is stronger than that in summer. The temperature drop is the strongest in December and January, and the weakest in June and July.
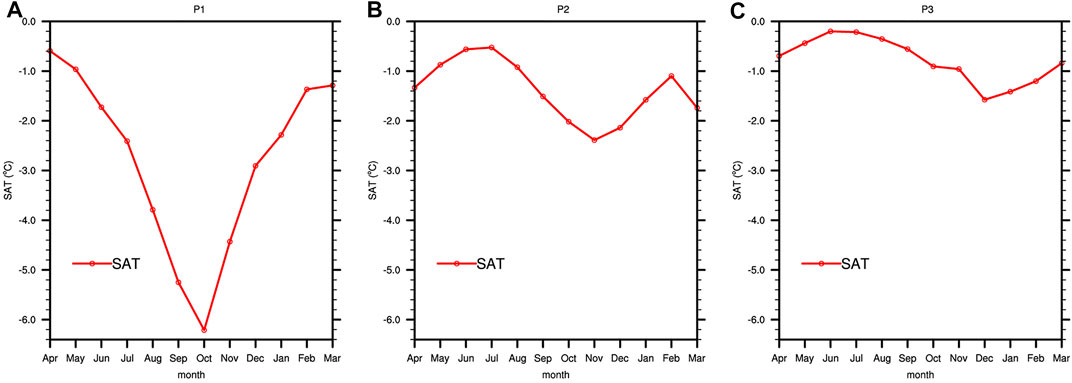
FIGURE 3. Annual cycle of the surface air temperature (SAT) anomalies over the Arctic during Period-1 (A), Period-2 (B), and Period-3 (C) after the Samalas mega volcanic eruption.
Figure 4 shows the zonal mean SAT anomalies in summer and winter over the NH after the Samalas mega eruption. It can be seen that the temperature drop over the Arctic is greater than that over the mid-low latitudes in the Period-1 summer, while the Arctic temperature decrease in Period-1 winter is smaller than that over the mid-low latitudes. Besides, the temperature drop in the Arctic summer is much greater than that in winter. In Period-2, there is little difference between the temperature decline in summer and winter over the mid-low latitudes of the NH. However, with the increase of latitude, the temperature decline in winter is gradually greater than that in summer, indicating that the seasonal shift of cooling after the SMVE mainly exists in the high latitudes of the NH, that is, the Arctic region. Similar to Period-2, in Period-3, there is little difference in the temperature decline between summer and winter in the mid-low latitudes of the NH, but with the increase of latitude, the temperature decline in winter is also gradually greater than that in summer. Compared the Period-3 with the Period-2, the amplitude of Arctic cooling has little change in winter but is obviously smaller in summer, indicating that the Arctic temperature in summer is easier to recover to the normal state, while the temperature in winter is easier to maintain sustained cooling after the SMVE (Figure 4). In addition, in the summer of Period-2 and Period-3, the cooling amplitude at all latitudes in the NH is basically the same, but the temperature drop in winter at high latitudes is always much stronger than that at mid-low latitudes, which again indicates that the continuous cooling in winter over the Arctic is different from that at mid-low latitudes of the NH.
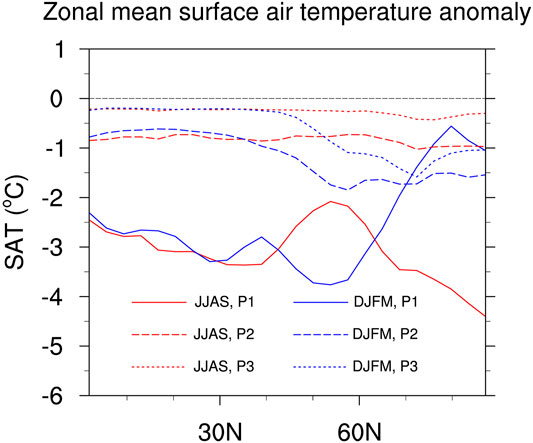
FIGURE 4. Zonal mean SAT anomalies in summer (JJAS, red lines) and winter (DJFM, blue lines) over NH during Period-1 (solid line), Period-2 (dashed line), and Period-3 (dotted line).
To better quantify the spatial variation of Arctic cooling, we analyzed the patterns of SAT anomalies over the NH in summer and winter during Period-1, Period-2, and Period-3 after the Samalas mega volcanic eruption, as shown in Figure 5. In Period-1, the Arctic cooling in summer is obviously stronger than that in winter. The NH, especially the Arctic, presents a consistent and significant cooling feature throughout the region in the summer. The cooling is particularly severe over land areas in the NH and areas north of 60°N. Previous studies have also pointed out that the short-term direct radiation effects of tropical volcanic eruptions will cause significant summer cooling over continental regions (Schneider et al., 2009). In the winter of Period-1, the temperature drop in the land area of the NH is still obvious, but there is no significant cooling in the Arctic region, especially the Arctic Ocean, and even warm anomalies appear in the Barents Sea, the Kara Sea, and the Greenland Sea. Previous analyses of observation data also show that in the high latitudes of the NH, radiation cooling after the volcanic eruption is dominant in summer, while warm anomalies are prevalent in the boreal winter (Groisman, 1992; Robock and Mao, 1992; Shindell et al., 2004). Climate simulation studies show that this winter warming is caused by atmospheric dynamic effects in the form of the positive phase of the Arctic Oscillation (AO) and North Atlantic Oscillation (NAO) (Shindell et al., 2001; Stenchikov et al., 2002; Stenchikov et al., 2006). In Period-2, the Arctic summer cooling is weaker than the winter cooling. The temperature decreases significantly in summer over the NH, but the cooling is weaker than that in the summer of Period-1, and the cooling amplitude in high latitudes is almost identical to that in mid-low latitudes. In the winter of Period-2, the Arctic cooling is stronger than that in the Period-1 winter, and also stronger than that in the summer of Period-2. The main cooling centers are located in the Arctic Archipelago, the Greenland Sea, the Norwegian Sea, and the Bering Sea. During Period-3, there is no significant cooling in summer over the NH, but only in sporadic areas such as Greenland and Iceland. However, in the winter of Period-3, the Arctic cooling is still very significant, which is stronger than the summer cooling in the same period. The cooling centers are mainly maintained in the Greenland Sea, Norwegian Sea, northern Canada, and the Bering Sea. It is worth noting that, as shown in Figure 5, the strongest cooling centers are found in the Greenland Sea and the Norwegian Sea in the Arctic region in the winters of Period-2 and Period-3 after the SMVE. This region is located at the junction of the Arctic Ocean and the North Atlantic Ocean. Because the Bering Strait is almost closed, this area has become the only outlet for Arctic sea ice to drift and melt into the mid-low latitudes ocean, and it is a key area for the Arctic temperature change. The temperature variation over this region may be related to Barents Oscillation (BO) and Arctic Ocean sea ice feedback (Zanchettin et al., 2014). The BO is a mode of atmospheric circulation anomaly in the NH in winter. It is found as the second Empirical Orthogonal Function (EOF) of monthly winter sea level pressure (SLP) anomalies poleward of 30°N where the leading EOF is the AO (Skeie, 2000). The most prominent center of action of the BO is located over the Barents region, which is related to the meridional circulation and the sensible heat loss over the Nordic Seas.
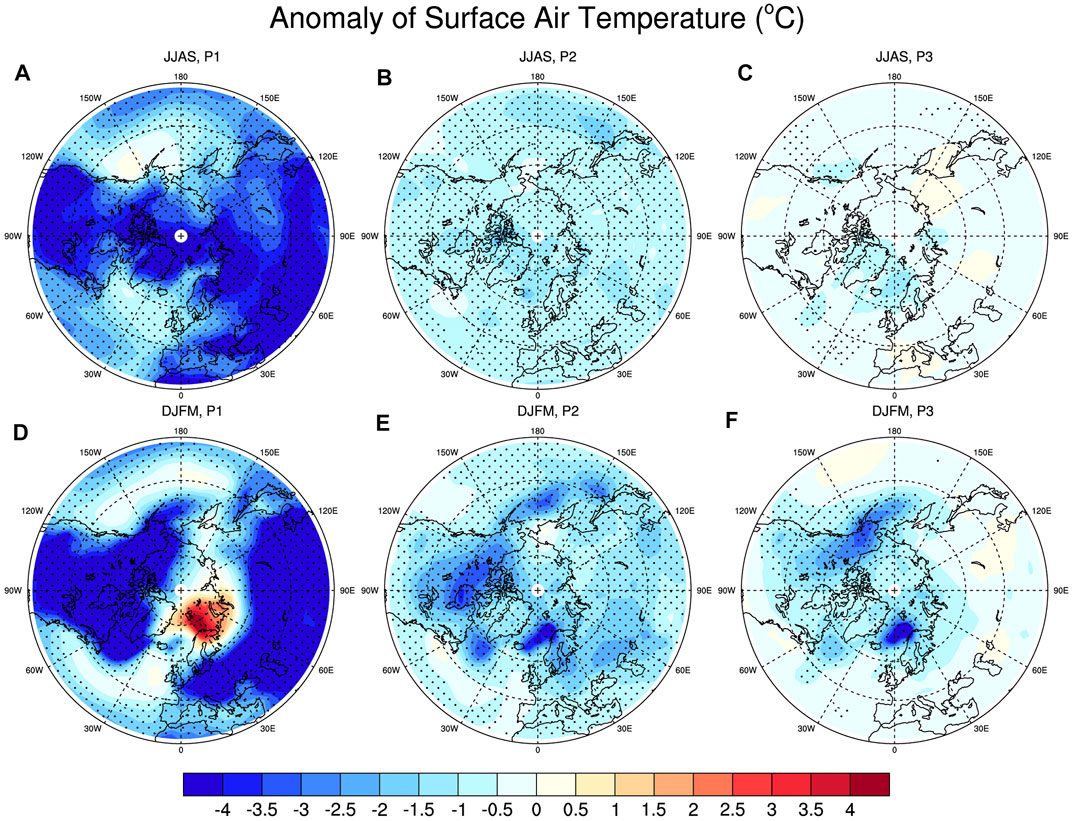
FIGURE 5. Ensemble-mean simulated Arctic surface air temperature (SAT) anomalies in summer (JJAS, top panels) and winter (DJFM, bottom panels) during Period-1 (A,D), Period-2 (B,E), and Period-3 (C,F). The dots denote areas with confidence exceeding the 90% level.
Because the Arctic is mainly covered by the Arctic Ocean, and the high latitude is cold all year round, there is a large amount of sea ice in the Arctic. The response of sea ice is the key to understanding the response of Arctic climate to volcanic forcing (Schneider et al., 2009). Previous studies have shown that sea ice plays an important role in Arctic climate change, and the most famous one is the positive feedback mechanism of ice and snow (Curry et al., 1995; Eisenman and Wettlaufer, 2009; Pithan and Mauritsen, 2014). Figure 6 shows the Arctic sea ice concentration anomalies in September and March during Period-1, Period-2, and Period-3. September and March are the periods when Arctic sea ice reaches its minimum and maximum values after the rapid melting in summer and expansion in winter, respectively, and are usually used to characterize the Arctic sea ice changes in summer and winter. After the Samalas mega volcanic eruption, the increase of Arctic sea ice is most obvious in September during Period-1 (Figure 6A). In September of Period-2 and Period-3, the Arctic sea ice increase area is mainly maintained in the sea area north of Iceland, and the sea ice increase gradually weakens (Figures 6B,C). However, the sea ice in March shows no obvious change in Period-1, but increases significantly in Period-2 and Period-3, and remains in the southeast waters of Iceland such as the Norwegian Sea. Since the Norwegian Sea is the outlet of Arctic sea ice to the Atlantic Ocean, the expansion of sea ice there suggests that it is more difficult for sea ice to drift away and melt towards the mid-low latitudes in March, which is conducive to the accumulation of Arctic sea ice in winter and the promotion of winter cooling. Compared Figure 6 with Figure 5, it can be seen that the most significant cooling occurs in the regions where the Arctic sea ice increases significantly in winter during Period-2 and Period-3, which is consistent with previous studies. They proposed that tropical volcanic eruptions could cause cooling in the NH areas where sea ice concentrations increase during the winter (Schneider et al., 2009). After the Samalas mega volcanic eruption, the increases of sea ice in September gradually weaken and the increases of sea ice in March gradually strengthen, which reflects the different variation characteristics of sea ice in winter and summer.
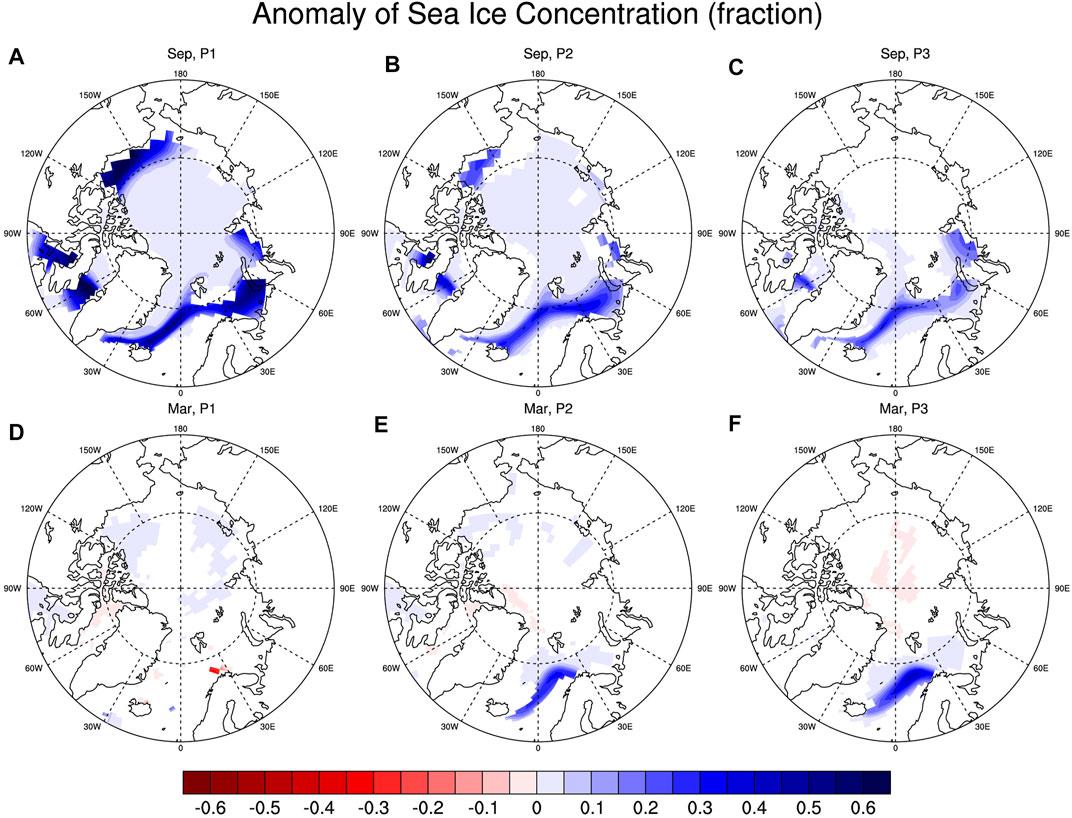
FIGURE 6. Ensemble-mean simulated Arctic sea ice concentration (fraction) anomalies in September (top panels) and March (bottom panels) during Period-1 (A,D), Period-2 (B,E) and Period-3 (C,F). Only changes statistically significant at the 90% confidence level are shown.
The annual cycles of the anomalies of sea ice concentration (SIC) and sea ice extent (SIE) over the Arctic during Period-1, Period-2, and Period-3 after the Samalas mega volcanic eruption are shown in Figure 7. Sea ice extent in Figure 7 is calculated as the areal sum of cells with sea ice concentration greater than 15%. If the grid cell has a sea ice concentration ≥15%, we consider it to be fully ice covered; otherwise, it is considered ice free, in line with the National Snow and Ice Data Center (NSIDC) sea ice extent definition (Berdahl and Robock, 2013). It can be seen that the variation of the annual cycles of SIC and SIE are basically consistent in the three periods, and the sea ice expansion reaches its peak in September (Figure 7). From Period-1 to Period-3, the amplitude of the anomalies of SIE and SIC gradually decrease in summer but increase in winter. This indicates that summer sea ice expansion is gradually weakening, while winter sea ice expansion is steadily enhancing, although the absolute value of the increase of SIE in summer is stronger than that in winter in the three periods. However, this is mainly due to the fact that in the average climate state, the sea ice in the Arctic Ocean in summer is far less than that in winter, and the Arctic Ocean region is basically covered by sea ice in winter. Therefore, the condensation and expansion of summer sea ice are more obvious when the short-term temperature drops rapidly after the SMVE. In winter, the Arctic Ocean is normally largely covered with sea ice, so the winter cooling caused by the SMVE can only lead the sea ice to continue to condense and expand at the edge of the Arctic Ocean, that is, at the junction of the Arctic Ocean and the Atlantic Ocean, as shown in Figure 6.
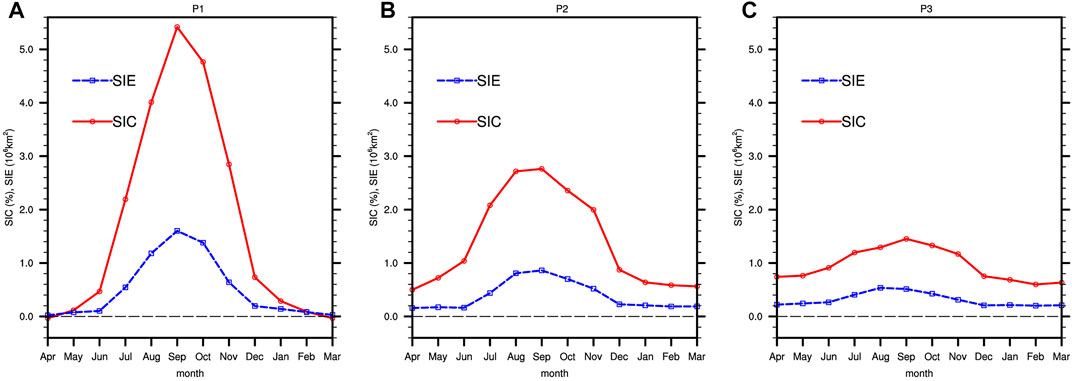
FIGURE 7. Annual cycle of the sea ice concentration (SIC, %) anomalies (red lines) and sea ice extent (SIE, 106km2) anomalies (blue lines) over the Arctic during Period-1 (A), Period-2 (B), and Period-3 (C) after the Samalas mega volcanic eruption.
The changes of Arctic sea ice have an impact on Arctic temperature changes by affecting the changes in surface heat flux. In the boreal summer, the main source of heat in the Arctic is solar radiation. A previous study pointed that in the normal state without volcanic eruptions, the seasonal melting of sea ice from May to September opens a large portion of the Arctic Ocean and allows the ocean to absorb solar radiation in summer (Dai et al., 2019). In the winter, the relatively warm Arctic Ocean becomes the main heat source of the atmosphere, and the energy stored in the ocean during the warm season is released into the atmosphere through longwave radiation, sensible heat flux, and latent heat flux (Serreze and Barry, 2011; Liu et al., 2018). The annual cycles of the anomalies of the surface net shortwave flux (FSNS), the sum of sensible and latent heat fluxes (SH + LH), and the upward longwave flux (FLUS) over the Arctic during Period-1, Period-2, and Period-3 after the Samalas mega volcanic eruption are shown in Figure 8.
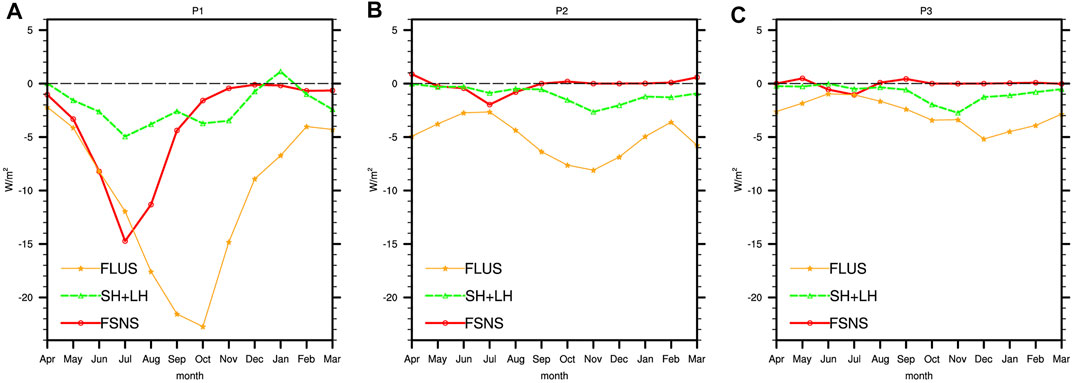
FIGURE 8. Annual cycle of the anomalies of the surface net shortwave flux (FSNS, positive downward, red), sensible plus latent heat flux (SH + LH, positive upward, green), and upward longwave flux (FLUS, positive upward, orange) over the Arctic during Period-1 (A), Period-2 (B) and Period-3 (C) after the Samalas mega volcanic eruption.
After the Samalas mega volcanic eruption, both SIC and SIE increase obviously during the three periods, especially from July to November (Figure 7). This indicates that the Arctic Ocean is covered by more sea ice in summer, which leads to the decreased absorption of solar radiation by the Arctic Ocean in summer (Figure 8), resulting in that release less heat subsequently as more areas of the Arctic Ocean became ice-covered during cold seasons (Figures 6, 7), thereby amplifying Arctic cooling in winter. This process involves the seasonal storage and release of solar radiation over the Arctic, which is different from the positive feedback of ice-albedo (Hall, 2004; Graversen and Wang, 2009). The increased SIC and SIE in summer (Figure 7) allow the Arctic Ocean to absorb less sunlight from April to October in Period-1 and from June to August in Period-2 and Period-3 (FSNS as shown in Figure 8). Due to the high heat capacity of the ocean-mixed layer, the absorbed energy is not immediately used to heat the SAT but is stored in the upper layers of the Arctic Ocean. This results in a slight decrease in the surface upward longwave radiation, sensible heat and latent heat fluxes in summer, and a large decrease in winter, especially during Period-2 and Period-3 after the Samalas eruption (FLUS and SH + LH as shown in Figures 8B,C). From Period-1 to Period-3, the largest declines in FLUS occur in October, November, and December, respectively. Similarly, the maximum decrease in SH + LH is also changed from July in Period-1 to November in Period-2 and Period-3 (Figure 8). This indicates that the heating effect of the Arctic Ocean on the atmosphere in the cold season becomes weaker over time after the Samalas volcanic eruption.
Additionally, during Period-1, the FSNS decreases significantly in the Arctic summer (Figure 8A). This is mainly due to the fact that large amounts of volcanic aerosols reside in the Arctic summer during Period-1 after the eruption, which greatly weakens the shortwave solar radiation reaching the surface. In the winter of the same period, there is no obvious decrease in solar shortwave radiation due to the polar night in the Arctic. Compared with Period-1, the decrease of FSNS in summer during Period-2 and Period-3 is greatly reduced and gradually returns to the normal state, which will lead to the weakening of summer cooling (Figure 8). This is mainly because volcanic aerosols only exist in the Arctic stratosphere for about 3 years in summer. Due to the deposition of volcanic aerosol over the Arctic, the weakening effect of aerosol on solar shortwave radiation has been very weak in Period-2 and Period-3, which causes the solar shortwave radiation to gradually return to the normal state in summer. Therefore, the summer cooling over the Arctic is difficult to sustain in Period-2 and Period-3. However, in Period-2 and Period-3, the changes of surface upward longwave radiation, sensible heat flux, and latent heat flux make the Arctic cooling more significant and continuous in winter than in summer (Figure 8). By comparing the annual cycle of the changes of Arctic SAT (Figure 3) and surface heat flux (Figure 8) in three periods, it is found that the change of surface upward longwave radiation flux dominates the change of Arctic SAT after the Samalas mega volcanic eruption. The correlation coefficients between the annual cycle of Arctic SAT anomalies (Figure 3) and the annual cycle of FLUS anomalies (Figure 8) are 0.96, 0.96, and 0.99 in Period-1, Period-2, and Period-3, respectively (significant at 99% confidence level).
In addition to the change of radiation flux, the Arctic temperature change is also affected by the change of atmospheric circulation such as AO. Figure 9 shows the spatial patterns of sea level pressure (SLP) anomaly in summer and winter during the three periods. The summer SLP in the Arctic changes from a strong negative phase to a weak positive phase of AO from Period-1 to Period-3 after the Samalas mega volcanic eruption (Figure 9). In the summer of Period-1, there is a positive pressure anomaly center in the Arctic region, while there are negative pressure anomalies in the mid-latitude Pacific and the North Atlantic (Figure 9A). This pattern of high pressure in the Arctic and low pressure in mid-latitude is similar to the SLP anomaly in the negative phase of AO. The enhancement of low pressure in middle latitudes and high pressure in high latitudes causes the westerly winds to weaken and the meridional circulation to prevail in the middle latitudes. Strong northerly wind anomalies in the lower troposphere limit the northward transport of warm air in the middle latitudes. In the summer of Period-2, the negative phase of AO is obviously weakened (Figure 9B). During Period-3, there is a weak negative SLP anomaly in the central region of the Arctic, which turns into a weak positive phase pattern of the AO (Figure 9C). This facilitates the transportation of warm air from low latitudes to high latitudes, helping to weaken the Arctic summer cooling.
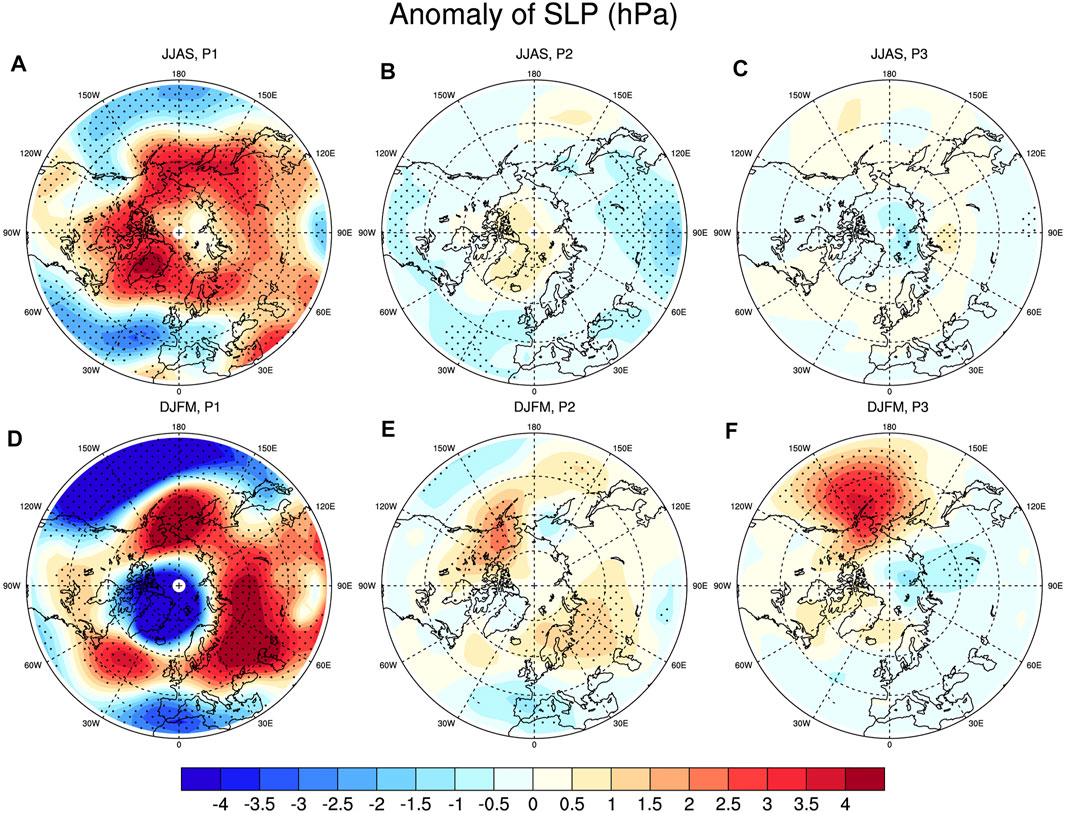
FIGURE 9. Ensemble-mean simulated sea level pressure (SLP) anomalies in summer (JJAS, top panels) and winter (DJFM, bottom panels) during Period-1 (A,D), Period-2 (B,E), and Period-3 (C,F). The dots denote areas with confidence exceeding the 90% level.
As shown in Figure 9, after the Samalas mega volcanic eruption, the Arctic winter SLP anomaly changes from a strong positive AO phase to a weak negative phase. In the winter of Period-1, there is a significant negative pressure anomaly center in the Arctic central region, while there is an annular positive pressure anomaly in the North Atlantic, the North Pacific, and the northern part of Eurasia (Figure 9D). This is a pattern of positive AO phase, which is conducive to the meridional circulation to transport the warm air from the middle latitudes to the high latitudes, resulting in the weak winter cooling during Period-1, and even local regional warming (Figure 5D). Previous observations and model simulations also show that strong low-latitude volcanic eruptions are generally followed by an enhanced positive phase of the AO for one or two NH winters (Robock and Mao, 1992; Graft et al., 1993; Robock and Mao, 1995; Kirchner et al., 1999; Stenchikov et al., 2002; Stenchikov et al., 2004). Climate simulation studies also suggest that the winter warming in the high latitudes of NH after the volcanic eruption is produced by atmosphere-dynamical effects in form of a positive phase of the AO/NAO (Shindell et al., 2001; Stenchikov et al., 2002; Stenchikov et al., 2006). The positive phase of the AO/NAO is induced by an enhancement of the stratospheric meridional temperature gradient caused by radiative heating in the aerosol cloud over the tropics (Kirchner et al., 1999). Scholars further proposed that ozone depletion as well as the tropospheric cooling effect of aerosols contribute to a positive AO/NAO (Stenchikov et al., 2002). In the winter of Period-2 and Period-3, the SLP anomaly turns into a weak negative phase of AO. The relatively warm air in the middle latitudes cannot be transported to the higher latitudes, causing the Arctic winter cooling to be more pronounced.
The multi-member ensemble simulations based on the fully coupled CESM are used to investigate the pure long-term influence of SMVE (such as Samalas magnitude) of universal significance on Arctic temperature changes in summer and winter. Our simulations facilitate the direct comparison of the impacts of the single mega tropical eruption on Arctic summer and winter temperature changes by performing a systematic comparison of the radiative and dynamical effects of SMVE. The major findings are as follows.
The significant cooling over the Arctic lasts for 16 years after the Samalas mega volcanic eruption. The greatest cooling (−7.78°C) occurs in the first year after the eruption. In the first 2 years (Period-1) after the volcanic eruption, the cooling range in Arctic summer is larger than that in winter, and then the cooling range in winter is larger. The obvious Arctic cooling shifts from summer to winter, and this seasonal change of cooling after the SMVE only exists in the high-latitude Arctic region. In the later period (Period-2 and Period-3) of Arctic cooling, the summer temperature is easier to return to the normal state, while the winter cooling is more likely to sustain.
In the first 2 years (Period-1) after the SMVE (such as Samalas), the Arctic cooling in summer is stronger than that in winter due to the strong weakening effect of volcanic aerosol on summer incident solar radiation in the early stage after the eruption and the snow-ice positive feedback caused by the rapid expansion of summer sea ice, while the winter sea ice in the same period does not increase obviously. Additionally, the strong negative AO phase in summer and positive AO phase in winter also play an important role.
Starting from the third year (Period-2 and Period-3) after the SMVE (such as Samalas), the Arctic temperature decrease in winter is stronger than that in summer. During these periods, the direct weakening effect of aerosol on solar radiation, which is the main heat source in Arctic summer, is greatly weakened, making summer cooling difficult to sustain. However, as the main heat source in Arctic winter, the sea surface upward longwave radiation, sensible heat, and latent heat transport still maintain a large decrease, causing the Arctic winter cooling stronger and more sustained than summer cooling during these periods. At the same time, sea ice expansion and albedo increase result in a decrease in solar radiation, and less heat is absorbed and stored by the ocean in summer. In the following winter, the Arctic Ocean becomes the atmospheric heat source, and the isolation effect of sea ice expansion correspondingly suppresses the ocean transfers heat to the atmosphere through surface upward longwave radiation, sensible heat, and latent heat flux, thus intensifying the cooling in Arctic winter. This process involves the seasonal storage and release of solar radiation over the Arctic, which is different from the positive feedback of ice albedo. Additionally, the AO changes from the negative phase to the positive phase in summer after the SMVE (such as Samalas), while it is reversed in winter. This phase change of AO is also one of the reasons for the seasonal changes in Arctic cooling after the SMVE.
There are some limitations in our simulated results. In this study, the effects of the SMVE (such as Samalas) on the temperature and sea ice changes in summer and winter over the Arctic region are analyzed, but the influences of Arctic changes on mid-low latitudes climate change after the SMVE are not discussed. Previous studies found that the Arctic sea ice plays an important role in seasonal prediction of the northern and southern temperature modes of the East Asian winter monsoon, and the winter NAO can affect the early summer precipitation in Northeast Asia through the “capacitor” effect of the Barents sea ice (Zhang et al., 2020; Zhang et al., 2021). These findings provide important clues for future research. In addition, the effects of local energy and radiation budget on the Arctic temperature changes are fully paid attention to in this study. However, the role of atmospheric circulation and ocean-atmosphere interactions still needs to be further analyzed and explored in future studies. Besides, the findings obtained in this work are based on the simulation results of one earth system model. Thus, further analysis based on multi-model comparison should be conducted in the future.
The raw data supporting the conclusion of this article will be made available by the authors, without undue reservation.
BL and JL contributed to conception and design of the study. BL and CZ performed the relevant analysis. BL wrote the original draft of the manuscript. All authors contributed to manuscript revision, read, and approved the submitted version.
This research is jointly supported by the National Natural Science Foundation of China (Grant Nos. 41971108, 42130604, 42111530182, and 91437218), the Priority Academic Program Development of Jiangsu Higher Education Institutions (Grant No. 164320H116), the Research Foundation for Humanities and Social Science of NJUPT (Scientific Research Start-up Funds), the Postgraduate Research and Practice Innovation Program of Jiangsu Province (Grant No. KYZZ16_0456), and the Jiangsu Center for Collaborative Innovation in Geographical Information Resource Development and Application.
The authors declare that the research was conducted in the absence of any commercial or financial relationships that could be construed as a potential conflict of interest.
All claims expressed in this article are solely those of the authors and do not necessarily represent those of their affiliated organizations, or those of the publisher, the editors and the reviewers. Any product that may be evaluated in this article, or claim that may be made by its manufacturer, is not guaranteed or endorsed by the publisher.
Berdahl, M., and Robock, A. (2013). Northern Hemispheric Cryosphere Response to Volcanic Eruptions in the Paleoclimate Modeling Intercomparison Project 3 Last Millennium Simulations. J. Geophys. Res. Atmos. 118 (22), 12,359. doi:10.1002/2013jd019914
Bethke, I., Outten, S., Otterå, O. H., Hawkins, E., Wagner, S., Sigl, M., et al. (2017). Potential Volcanic Impacts on Future Climate Variability. Nat. Clim Change. 7 (11), 799–805. doi:10.1038/nclimate3394
Briffa, K. R., Osborn, T. J., Schweingruber, F. H., Harris, I. C., Jones, P. D., Shiyatov, S. G., et al. (2001). Low-frequency Temperature Variations from a Northern Tree Ring Density Network. J. Geophys. Res. 106 (D3), 2929–2941. doi:10.1029/2000jd900617
Caldeira, K., and Cvijanovic, I. (2014). Estimating the Contribution of Sea Ice Response to Climate Sensitivity in a Climate Model. J. Clim. 27 (22), 8597–8607. doi:10.1175/jcli-d-14-00042.1
Curry, J. A., Schramm, J. L., and Ebert, E. E. (1995). Sea Ice-Albedo Climate Feedback Mechanism. J. Clim. 8 (2), 240. doi:10.1175/1520-0442(1995)008<0240:siacfm>2.0.co;2
Dai, A., Luo, D., Song, M., and Liu, J. (2019). Arctic Amplification Is Caused by Sea-Ice Loss under Increasing CO2. Nat. Commun. 10 (1), 121. doi:10.1038/s41467-018-07954-9
Danabasoglu, G., Bates, S. C., Briegleb, B. P., Jayne, S. R., Jochum, M., Large, W. G., et al. (2012). The CCSM4 Ocean Component. J. Clim. 25 (5), 1361–1389. doi:10.1175/jcli-d-11-00091.1
Eisenman, I., and Wettlaufer, J. S. (2009). Nonlinear Threshold Behavior during the Loss of Arctic Sea Ice. Proc. Natl. Acad. Sci. 106 (1), 28–32. doi:10.1073/pnas.0806887106
Gao, C., Robock, A., and Ammann, C. (2008). Volcanic Forcing of Climate over the Past 1500 years: An Improved Ice Core-Based index for Climate Models. J. Geophys. Res. 113, D23111. doi:10.1029/2008jd010239
Graft, H.-F., Kirchner, I., Robock, A., and Schult, I. (1993). Pinatubo Eruption winter Climate Effects: Model versus Observations. Clim. Dyn. 9 (2), 81–93. doi:10.1007/BF00210011
Graversen, R. G., and Wang, M. (2009). Polar Amplification in a Coupled Climate Model with Locked Albedo. Clim. Dyn. 33 (5), 629–643. doi:10.1007/s00382-009-0535-6
Groisman, P. Y. (1992). Possible Regional Climate Consequences of the Pinatubo Eruption: An Empirical Approach. Geophys. Res. Lett. 19 (15), 1603–1606. doi:10.1029/92gl01474
Guillet, S., Corona, C., Stoffel, M., Khodri, M., Lavigne, F., Ortega, P., et al. (2017). Climate Response to the Samalas Volcanic Eruption in 1257 Revealed by Proxy Records. Nat. Geosci. 10 (2), 123–128. doi:10.1038/ngeo2875
Hall, A. (2004). The Role of Surface Albedo Feedback in Climate. J. Clim. 17 (7), 1550–1568. doi:10.1175/1520-0442(2004)017<1550:trosaf>2.0.co;2
Iles, C. E., and Hegerl, G. C. (2014). The Global Precipitation Response to Volcanic Eruptions in the CMIP5 Models. Environ. Res. Lett. 9 (10), 104012. doi:10.1088/1748-9326/9/10/104012
Kirchner, I., Stenchikov, G. L., Graf, H.-F., Robock, A., and Antuña, J. C. (1999). Climate Model Simulation of winter Warming and Summer Cooling Following the 1991 Mount Pinatubo Volcanic Eruption. J. Geophys. Res. 104 (D16), 19039–19055. doi:10.1029/1999jd900213
Lavigne, F., Degeai, J.-P., Komorowski, J.-C., Guillet, S., Robert, V., Lahitte, P., et al. (2013). Source of the Great A.D. 1257 Mystery Eruption Unveiled, Samalas Volcano, Rinjani Volcanic Complex, Indonesia. Proc. Natl. Acad. Sci. 110 (42), 16742–16747. doi:10.1073/pnas.1307520110
Lawrence, D. M., Oleson, K. W., Flanner, M. G., Fletcher, C. G., Lawrence, P. J., Levis, S., et al. (2012). The CCSM4 Land Simulation, 1850-2005: Assessment of Surface Climate and New Capabilities. J. Clim. 25 (7), 2240–2260. doi:10.1175/jcli-d-11-00103.1
Lehner, F., Joos, F., Raible, C. C., Mignot, J., Born, A., Keller, K. M., et al. (2015). Climate and Carbon Cycle Dynamics in a CESM Simulation from 850-2100 CE. Earth Syst. Dyn. Discuss. 6 (1), 351–406. doi:10.5194/esdd-6-351-2015
Liu, B., Liu, J., Ning, L., Sun, W., Yan, M., Zhao, C., et al. (2020a). The Role of Samalas Mega Volcanic Eruption in European Summer Hydroclimate Change. Atmosphere 11 (11), 1182. doi:10.3390/atmos11111182
Liu, B., Wang, B., Liu, J., Chen, D., Ning, L., Yan, M., et al. (2020b). Global and Polar Region Temperature Change Induced by Single Mega Volcanic Eruption Based on Community Earth System Model Simulation. Geophys. Res. Lett. 47 (18), e2020GL089416. doi:10.1029/2020gl089416
Liu, F., Zhao, T., Wang, B., Liu, J., and Luo, W. (2018). Different Global Precipitation Responses to Solar, Volcanic, and Greenhouse Gas Forcings. J. Geophys. Res. Atmos. 123 (8), 4060–4072. doi:10.1029/2017jd027391
Man, W., Zhou, T., and Jungclaus, J. H. (2014). Effects of Large Volcanic Eruptions on Global Summer Climate and East Asian Monsoon Changes during the Last Millennium: Analysis of MPI-ESM Simulations. J. Clim. 27 (19), 7394–7409. doi:10.1175/jcli-d-13-00739.1
Marsh, D. R., Mills, M. J., Kinnison, D. E., Lamarque, J.-F., Calvo, N., and Polvani, L. M. (2013). Climate Change from 1850 to 2005 Simulated in CESM1(WACCM). J. Clim. 26 (19), 7372–7391. doi:10.1175/jcli-d-12-00558.1
Miller, G. H., Geirsdóttir, Á., Zhong, Y., Larsen, D. J., Otto-Bliesner, B. L., Holland, M. M., et al. (2012). Abrupt Onset of the Little Ice Age Triggered by Volcanism and Sustained by Sea-Ice/ocean Feedbacks. Geophys. Res. Lett. 39 (2), L02708. doi:10.1029/2011gl050168
Neale, R. B., Richter, J., Park, S., Lauritzen, P. H., Vavrus, S. J., Rasch, P. J., et al. (2013). The Mean Climate of the Community Atmosphere Model (CAM4) in Forced SST and Fully Coupled Experiments. J. Clim. 26 (14), 5150–5168. doi:10.1175/jcli-d-12-00236.1
Oppenheimer, C. (2003). Ice Core and Palaeoclimatic Evidence for the Timing and Nature of the Great Mid-13th century Volcanic Eruption. Int. J. Climatol. 23 (4), 417–426. doi:10.1002/joc.891
Otto-Bliesner, B. L., Brady, E. C., Fasullo, J., Jahn, A., Landrum, L., Stevenson, S., et al. (2016). Climate Variability and Change since 850 CE: An Ensemble Approach with the Community Earth System Model. Bull. Am. Meteorol. Soc. 97 (5), 735–754. doi:10.1175/bams-d-14-00233.1
Pithan, F., and Mauritsen, T. (2014). Arctic Amplification Dominated by Temperature Feedbacks in Contemporary Climate Models. Nat. Geosci 7 (3), 181–184. doi:10.1038/ngeo2071
Robock, A., and Mao, J. (1995). The Volcanic Signal in Surface Temperature Observations. J. Clim. 8 (5), 10862–11103. doi:10.1175/1520-0442(1995)008<1086:tvsist>2.0.co;2
Robock, A., and Mao, J. (1992). Winter Warming from Large Volcanic Eruptions. Geophys. Res. Lett. 19 (24), 2405–2408. doi:10.1029/92GL02627
Schneider, D. P., Ammann, C. M., Otto-Bliesner, B. L., and Kaufman, D. S. (2009). Climate Response to Large, High-Latitude and Low-Latitude Volcanic Eruptions in the Community Climate System Model. J. Geophys. Res. 114, D15101. doi:10.1029/2008jd011222
Screen, J. A., and Simmonds, I. (2010). The central Role of Diminishing Sea Ice in Recent Arctic Temperature Amplification. Nature 464 (7293), 1334–1337. doi:10.1038/nature09051
Serreze, M. C., and Barry, R. G. (2011). Processes and Impacts of Arctic Amplification: A Research Synthesis. Glob. Planet. Change 77 (1-2), 85–96. doi:10.1016/j.gloplacha.2011.03.004
Serreze, M. C., and Francis, J. A. (2006). The Arctic Amplification Debate. Climatic Change 76 (3-4), 241–264. doi:10.1007/s10584-005-9017-y
Shindell, D. T., Schmidt, G. A., Mann, M. E., and Faluvegi, G. (2004). Dynamic winter Climate Response to Large Tropical Volcanic Eruptions since 1600. J. Geophys. Res. 109, D05104. doi:10.1029/2003jd004151
Shindell, D. T., Schmidt, G. A., Miller, R. L., and Rind, D. (2001). Northern Hemisphere winter Climate Response to Greenhouse Gas, Ozone, Solar, and Volcanic Forcing. J. Geophys. Res. 106 (D7), 7193–7210. doi:10.1029/2000jd900547
Sigl, M., Winstrup, M., McConnell, J. R., Welten, K. C., Plunkett, G., Ludlow, F., et al. (2015). Timing and Climate Forcing of Volcanic Eruptions for the Past 2,500 Years. Nature 523 (7562), 543–549. doi:10.1038/nature14565
Skeie, P. (2000). Meridional Flow Variability over the Nordic Seas in the Arctic Oscillation Framework. Geophys. Res. Lett. 27 (16), 2569–2572. doi:10.1029/2000gl011529
Slawinska, J., and Robock, A. (2018). Impact of Volcanic Eruptions on Decadal to Centennial Fluctuations of Arctic Sea Ice Extent during the Last Millennium and on Initiation of the Little Ice Age. J. Clim. 31 (6), 2145–2167. doi:10.1175/jcli-d-16-0498.1
Stenchikov, G., Hamilton, K., Robock, A., Ramaswamy, V., and Schwarzkopf, M. D. (2004). Arctic Oscillation Response to the 1991 Pinatubo Eruption in the SKYHI General Circulation Model with a Realistic Quasi-Biennial Oscillation. J. Geophys. Res. 109, D03112. doi:10.1029/2003jd003699
Stenchikov, G., Hamilton, K., Stouffer, R. J., Robock, A., Ramaswamy, V., Santer, B., et al. (2006). Arctic Oscillation Response to Volcanic Eruptions in the IPCC AR4 Climate Models. J. Geophys. Res. 111, D07107. doi:10.1029/2005jd006286
Stenchikov, G., Robock, A., Ramaswamy, V., Schwarzkopf, M. D., Hamilton, K., and Ramachandran, S. (2002). Arctic Oscillation Response to the 1991 Mount Pinatubo Eruption: Effects of Volcanic Aerosols and Ozone Depletion. J.‐Geophys.‐Res. 107 (D24), 4803. doi:10.1029/2002jd002090
Stevenson, S., Otto-Bliesner, B., Fasullo, J., and Brady, E. (2016). "El Niño like" Hydroclimate Responses to Last Millennium Volcanic Eruptions. J. Clim. 29 (8), 2907–2921. doi:10.1175/jcli-d-15-0239.1
Vidal, C. M., Komorowski, J.-C., Métrich, N., Pratomo, I., Kartadinata, N., Prambada, O., et al. (2015). Dynamics of the Major Plinian Eruption of Samalas in 1257 A.D. (Lombok, Indonesia). Bull. Volcanol 77 (9), 73. doi:10.1007/s00445-015-0960-9
Vidal, C. M., Métrich, N., Komorowski, J.-C., Pratomo, I., Michel, A., Kartadinata, N., et al. (2016). The 1257 Samalas Eruption (Lombok, Indonesia): the Single Greatest Stratospheric Gas Release of the Common Era. Sci. Rep. 6, 34868. doi:10.1038/srep34868
Wang, Z., Li, Y., Liu, B., and Liu, J. (2015). Global Climate Internal Variability in a 2000-year Control Simulation with Community Earth System Model (CESM). Chin. Geogr. Sci. 25 (3), 263–273. doi:10.1007/s11769-015-0754-1
Zanchettin, D., Bothe, O., Timmreck, C., Bader, J., Beitsch, A., Graf, H.-F., et al. (2014). Inter-hemispheric Asymmetry in the Sea-Ice Response to Volcanic Forcing Simulated by MPI-ESM (COSMOS-Mill). Earth Syst. Dynam. 5 (1), 223–242. doi:10.5194/esd-5-223-2014
Zhang, P., Wu, Z., and Jin, R. (2021). How Can the winter North Atlantic Oscillation Influence the Early Summer Precipitation in Northeast Asia: Effect of the Arctic Sea Ice. Clim. Dyn. 56 (5), 1989–2005. doi:10.1007/s00382-020-05570-2
Zhang, P., Wu, Z., Li, J., and Xiao, Z. (2020). Seasonal Prediction of the Northern and Southern Temperature Modes of the East Asian winter Monsoon: the Importance of the Arctic Sea Ice. Clim. Dyn. 54 (7), 3583–3597. doi:10.1007/s00382-020-05182-w
Keywords: mega volcanic eruption, arctic cooling, seasonal changes, samalas, climate simulation
Citation: Liu B, Zhao C, Zhu L and Liu J (2021) Seasonal Changes in Arctic Cooling After Single Mega Volcanic Eruption. Front. Earth Sci. 9:688250. doi: 10.3389/feart.2021.688250
Received: 15 April 2021; Accepted: 01 November 2021;
Published: 01 December 2021.
Edited by:
Zoe Courville, Cold Regions Research and Engineering Laboratory, United StatesReviewed by:
Libin Ma, Chinese Academy of Meteorological Sciences, ChinaCopyright © 2021 Liu, Zhao, Zhu and Liu. This is an open-access article distributed under the terms of the Creative Commons Attribution License (CC BY). The use, distribution or reproduction in other forums is permitted, provided the original author(s) and the copyright owner(s) are credited and that the original publication in this journal is cited, in accordance with accepted academic practice. No use, distribution or reproduction is permitted which does not comply with these terms.
*Correspondence: Jian Liu, amxpdUBuam51LmVkdS5jbg==
Disclaimer: All claims expressed in this article are solely those of the authors and do not necessarily represent those of their affiliated organizations, or those of the publisher, the editors and the reviewers. Any product that may be evaluated in this article or claim that may be made by its manufacturer is not guaranteed or endorsed by the publisher.
Research integrity at Frontiers

Learn more about the work of our research integrity team to safeguard the quality of each article we publish.