 Qingyuan Yang
 Tonghuan Liu1
 Xiekang Wang
95% of researchers rate our articles as excellent or good
Learn more about the work of our research integrity team to safeguard the quality of each article we publish.
Find out more
ORIGINAL RESEARCH article
Front. Earth Sci. , 21 July 2021
Sec. Geohazards and Georisks
Volume 9 - 2021 | https://doi.org/10.3389/feart.2021.686925
This article is part of the Research Topic Water-Related Natural Disasters in Mountainous Area View all 39 articles
In 2018, a flash flood occurred in the Zhongdu river, which lies in Yibin, Sichuan province of China. The flood caused many casualties and significant damage to people living nearby. Due to the difficulty in predicting where and when flash floods will happen, it is nearly impossible to set up monitors in advance to detect the floods in detail. Field investigations are usually carried out to study the flood propagation and disaster-causing mechanism after the flood’s happening. The field studies take the relic left by the flash flood to deduce the peak level, peak discharge, bed erosion, etc. and further revel the mechanism between water and sediment transport during the flash flood This kind of relic-based study will generate bigger errors in regions with great bed deformation. In this study, we come up with numerical simulations to investigate the flash flood that happened in the Zhongdu river. The simulations are based on two-dimensional shallow water models coupled with sediment transport and bed deformation models. Based on the real water level and discharge profile measured by a hydrometric station nearby, the numerical simulation reproduced the flash flood in the valley. The results show the flood coverage, water level variation, and velocity distribution during the flood. The simulation offers great help in studying the damage-causing process. Furthermore, simulations without considering sediment transport are also carried out to study the impact of bed erosion and sedimentation. The study proved that, without considering bed deformation, the flood may be greatly underestimated, and the sediment lying in the valley has great impact on flood power.
Mountainous areas take up 75% of the world’s land. In Europe there have been 1,564 flood events (1870–2016), of which 879 (56%) were flash floods, 606 (39%) were river floods, 56 (4%) were coastal floods, and the remaining 23 (1.5%) were compound events (Paprotny, et al., 2018). In China, mountainous areas cover 2/3 of the country’s land, and regions at high risk of mountainous flash floods take 48% of the land and support 44.2% of the population (He, et al., 2018; Wang, et al., 2019). Flash floods, induced by heavy rain, cause great destruction to people’s lives and property because of sharply changing landslides, debris flow, and huge floods. According to statistics, 70% of the flood disasters since the foundation of PRC have occurred in mountainous areas. Due to the continuous construction of levees at plain rivers, the percentage of flood disasters of plain rivers keeps decreasing, while the proportion of mountainous flash floods is rising. Furthermore, due to the rapid economic development in mountainous areas, more and more people are gathering in the towns and villages near rivers. From 2003 to 2013, mountainous flash floods led to 79.5% of casualties of flood-induced deaths (Ma et al., 2019). Disaster prevention and control of mountainous flash floods are major issues for the local government.
Flash floods happen more frequently than landslides or debris flow. In 2015, the occurrence rates of the three types of disasters were 54.2, 21.0, and 25.1%, respectively. Flash floods are usually induced by rapidly gathered rain. The flood takes sediments down the hill. Usually, the density of the water is lower than the debris flow, and the fluid still functions in the way of Newtonian fluid and suffers low resistance from the bed. The flood moves quickly, affects a large region, and leaves little time for early warning. The flood causes great damage to people living nearby. In mountainous areas, people usually live in flat places along the river, and facilities, such as villages, roads, and railways, are all put there.
For long-term and large-scale flooding, like the flooding in large rivers, the use of satellite remote sensing is the most efficient way to identify the area of flood inundations (Bates, 2012; Rahman and Di, 2016). The remote sensing method utilizes topographic data to estimate the dynamics of flood inundation. While for flash flooding in mountainous catchments, the flood is abrupt and small-scale, the image interval of satellites is too long to analyze the flooding process. The data obtained by satellites is usually taken as one post-survey tool to figure out the damage caused by the flash flood (Mashaly and Ghoneim, 2018; Sayama, et al., 2019). Furthermore, if a large amount of remote sensing data about different flash floods is obtained, data mining techniques or artificial intelligence (AI) methods can make predications for the possibility of future flash floods (Prasad and Pani, 2017; Wu, et al., 2019; Bui, et al., 2020). Based on certain similarities among previous flash floods, these studies present us with large-scale properties of flash floods, while the demand for studying the flash flood in detail and making safeguard manners is urgent.
In order to deal with the threat of flash floods, pre-warning systems are set by many countries. These systems usually firstly carry out statistical analysis of the rainfall and floods, make a standard for the identification of disaster, and use the standard to classify the possible impact area of flash floods. Then a monitor system will be set at the mountainous area to collect the instantaneous rainfall and water level. When the rainfall and water level reach the disaster value, an alarm signal will be sent to people living there. People are supposed to go to the safe areas planned beforehand. The local government needs a model to predict the impact area and arrival time of flash floods as soon as heavy rain is forecasted or detected, and make further protection manners and evacuation plans for the flash flood.
Since these warning systems should respond in a rather short time, the modeling tools for flood propagation are simplified to save the calculation time. Models, such as statistical models or simplified hydrodynamic models, focus on water levels, discharge, and rainfall, but the propagation process of flow and sediment are seldom mentioned (Chen, et al., 2014; Zhou, et al., 2015; Zhang, et al., 2020).
To study the flood in detail, many researchers simulated the flash flood with depth-averaged two-dimensional hydrodynamic models, which is a comprising tool to capture the flow dynamic behavior and save computational time for spatially large-scale flow domains (Guan, et al., 2016; Liu, et al., 2020). These models solve the full governing equations, including rainfall and infiltration sections. The equations discretization use the Godunov method (Toro, 2001), which can capture the shock wave accurately and deal with the sharp change of bed form stably. The calculation time is acceptable, and is a very promising tool (Cao, et al., 2011; Yang, et al., 2014; Kvočka, et al., 2015; Yoshioka, et al., 2015; Guan, et al., 2016; Liang, et al., 2016; Hu and Song, 2018; Bellos, et al., 2020; Contreras and Escauriaza, 2020; Khosronejad, et al., 2020).
The hydrodynamic models do not simulate the transport of sediment, even though this is a key and complicated issue that impacts flash flood movement. This is because intense sediment transport tends to cause river morphological changes (bed and bank), which alters the computational domain for flood propagation. Therefore, a rational modeling of flash floods is to couple the simulations of both flow motion and sediment-transport-induced bed morphological change (as bank erosion is neglected). For a mountainous river, the river basin is small. The annual variation of rainfall changes significantly. In the dry-season, the discharge is rather small, and parts of the riverbed are bare. The flow can only transport fine sand so the bed form changes insignificantly. On the contrary, in the wet season, the discharge is large, and the entire riverbed is underwater. The flow can move large amounts of sediment and large-size gravels and rocks to the river. However, these gravel or rocks cannot move a long way; they will deposit at the lower velocity region of the river until a next large flood re-initiates them in the transport process (Liu and He, 2017; Li, et al., 2019; Lorenzo Lacruz et al., 2019).
The transport of sediment in mountainous rivers is very complicated, and traditional methods, such as field investigations and lab experiments, have great difficulty in exploring the mechanism of flash flood propagation. In this study, we use a depth-average two-dimensional model coupling hydrodynamic and morphological modules to conduct a numerical inversion of a flash flood in the Zhongdu River.
The study area covers the Zhongdu River, which lies in Yibin, in the Sichuan Province. On August 15th and 16th of 2018, heavy rain fell into the Zhongdu River drainage basin, and the flood rushed into the river and destroyed Zhongdu Town lying by the river. Figure 1 shows the satellite image of the Zhongdu River and Zhongdu Town. Zhongdu Town is separated by the river and connected by the Zhongdu Bridge. The study region comes from 5 km upstream of the town to 9 km downstream of the town along the Zhongdu River.
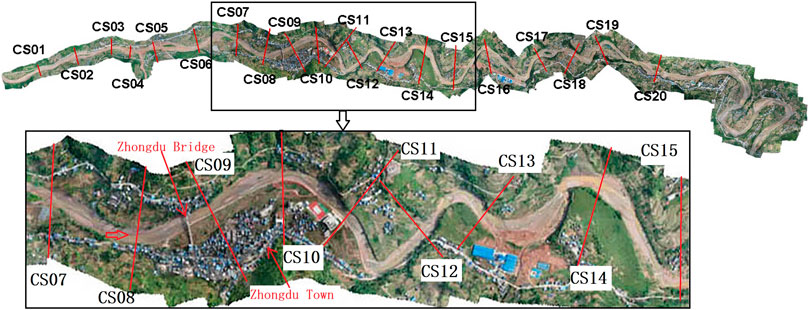
FIGURE 1. Satellite image of the Zhongdu River and Zhongdu Town.
In this study, we collected high-resolution (5 m) DEM (Digital Elevation Model) data by remote sensing (Figure 1), sieved the sediment of the river bed, and got the flood discharge (Figure 2) through the hydrometric station of Zhongdu River (near CS20). The discharge data at the hydrometric station was collected at an interval of 40 min. All these data contribute to the numerical inversion of the flash flood.
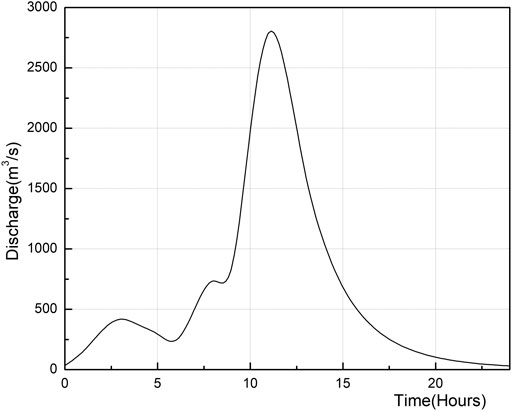
FIGURE 2. Monitored discharge during the flash flood (near CS20).
In this study, we adopted the depth-averaged two-dimensional shallow water equations coupled with sediment transport and bed variation equations (Xia, et al., 2010) to simulate the flash flood and sediment transport during the disaster.
Continuity equation:
Momentum equation:
Equation of bed load transport:
Equation of bed deformation:
in which
where
in which
The governing Eqs 1–4 can be rewritten in the uniform:
in which
S is source section, and equal to the rest of the sections of each governing equation.
The governing equations are solved by the method of finite volume with triangular meshes (Figure 3). The variables (h,u,v,qb, and zb) in each mesh are updated in a time marching way (Eq. 11).
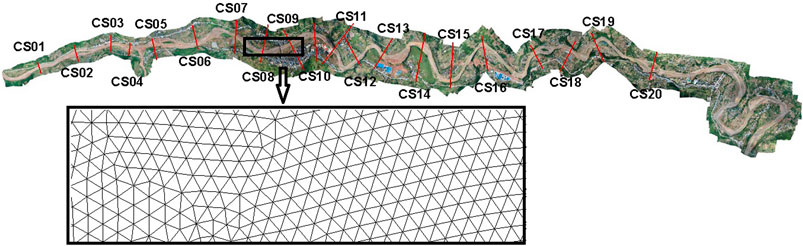
FIGURE 3. Part of the calculation meshes.
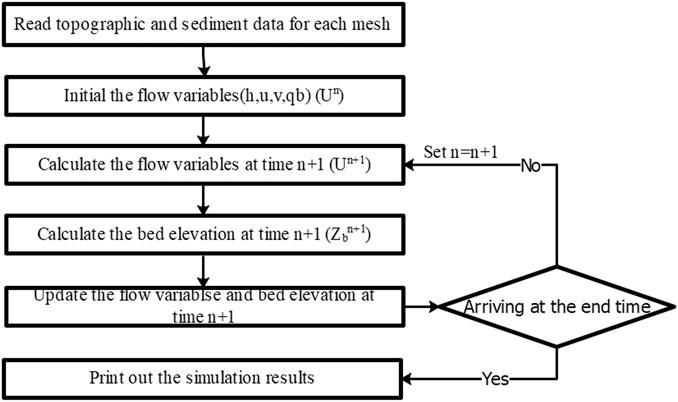
FIGURE 4. Flow chart of the calculation.
In this study, four scenarios, with and without considering the sediment transport, are simulated using the above-mentioned model. The flow conditions for the simulation are listed in Table 1. Scenario one comes from the traditional flood simulation that sediment transport is neglected (in Figure 4, qb and bed elevation are not calculated), and scenario two to four presents the coupled calculation of water and sediment transport with different assumed initial thicknesses of sediment (2, 4, and 6 m, respectively). For each scenario, only two empirical parameters need to be set: the diameter of the sediment and the roughness of bed. The medium diameter of the sediments is 0.02 m, and the roughness n is set as 0.025. Among all the scenarios, the initial bed elevations are the same with the high-resolution terrain data. In order to study the unsteady process of the flash flood, hydraulic data of 20 cross sections (Figure 1) are saved at every time step and data of the full simulation region are saved every 6 min during the calculation (the total simulation time is 1,440 min).
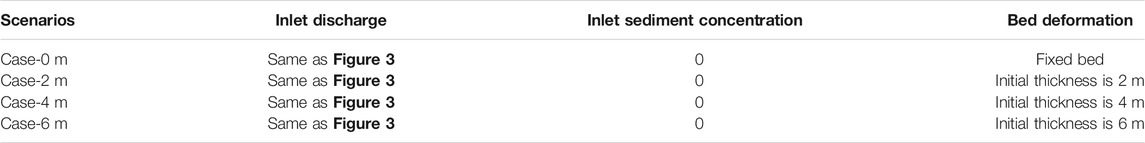
TABLE 1. Flow conditions for the simulation scenarios.
In this study, the inlet (upstream CS01) discharge is based on the discharge profile monitored by the hydrometric station near CS20. The simulated discharge profiles at CS20 in four scenarios are shown in Figure 5. The shape of the four discharge profiles are nearly the same as the monitor data, except for the peak value and arrival time of the flood wave. Nash-Sutcliffe efficiency coefficient (NSE) and Root Mean Squared Error (Error (RMSE) between the simulated discharge and monitored discharge for each case is listed in Table 2. and it also presents that the discharge profile could be similar after a 14 km long flow and sediment transport.
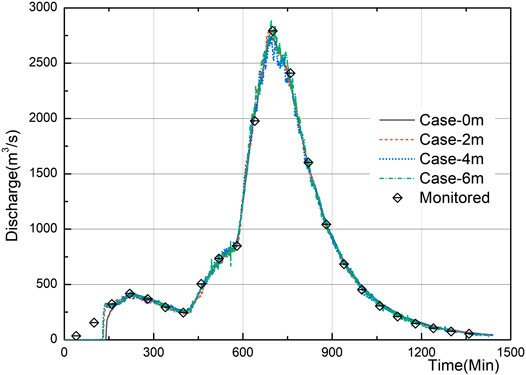
FIGURE 5. Monitored and simulated discharge at Cross section 20.

TABLE 2. NSE and RMSE for each case at CS20.
The enlargement of peak discharge is a common property of flash floods, meaning that the peak discharge of the flood can be amplified by sediment intrusion and bed form obstruction. The enlargement may lead to more serious destruction for places with high velocity than other places suffering the same flood.
Figure 6A presents the arrival time of the flood at each cross section. Since the discharge is small compared to the peak value, the beginning flood wave takes about 2 h to reach CS20. The differences among the four scenarios are about 2 min at CS01∼CS14 (Figure 6B), which means the sediment intrusion advances the flood wave 2 min earlier to the cross sections. While at cross CS20, the flood wave of Case-6 m arrives 10 min earlier than that of Case-0 m.
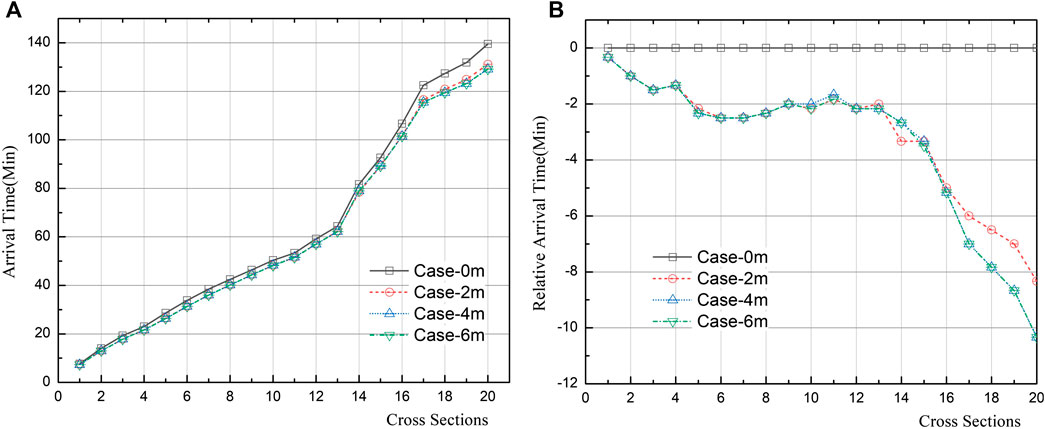
FIGURE 6. Simulated arrival time (A) and relative arrival time (B) of flood wave at cross sections.
Figure 7A shows the peak level at each cross section, and Figure 7B presents the relative peak water level (relative to case-0 m) at all the cross sections. The water level falls about 130 m along the 14 km long river. Among all 20 cross sections, the peak water level can be divided into two categories: raised sections and lowered sections. For raised sections, such as CS05∼CS13, the peak water levels of Case-2 m, Case-4 m, and Case-6 m are about 2 m higher than that of Case-0 m. On the contrary, for lowered sections, like CS14 and CS17, the peak water levels of Case-2 m, Case-4 m, and Case-6 m are about 2 m lower than that of Case-0 m. The sediment could raise or lower the water level, which will add much uncertainty to the preventive measure for the flood.
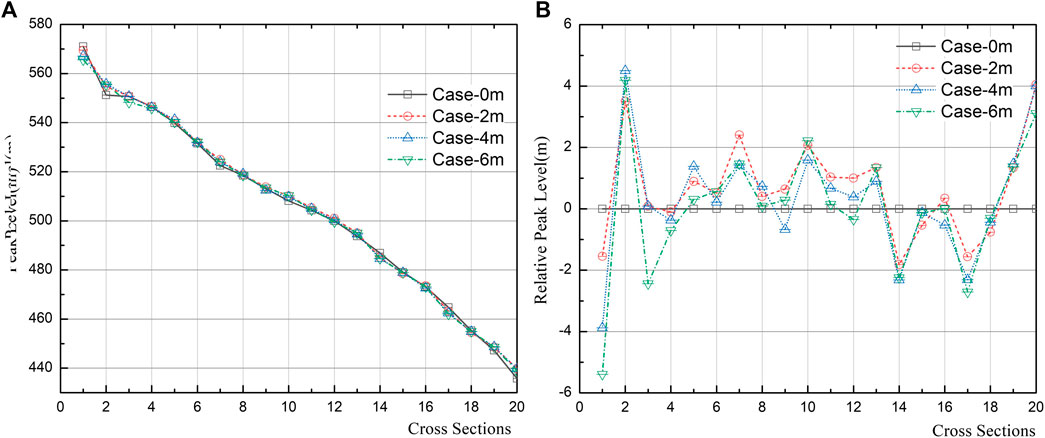
FIGURE 7. Peak water level (A) and relative peak water level (B) at cross sections.
Peak discharges at 20 cross sections are shown in Figure 8. At CS01∼CS05, due to the sediment intrusion, the bulk of the flood expands, and the peak discharge keeps rising along the Zhongdu River. After a certain distance, the water comes to its transport capacity of sediment, some of the sediment deposits at the low velocity region, and the bulk of the flood shrinks, such as in CS06∼CS14. Furthermore, the discharges may get enlarged again by the sharp contract channel (CS16∼CS20), which induces a bigger velocity and higher sediment transport capacity. Overall, scenarios with sediment transport reveal much larger peak discharge than cases without sediment transport. Therefore, for rivers with huge sediment supply, sediment transport should be taken into account, the neglection of which would produce huge errors.

FIGURE 8. Peak discharge at cross sections.
For better understanding of the bed elevation variation, we define the siltation thickness as the difference between the instantaneous and the initial bed elevation of the simulation. Where the siltation thickness is larger than zero, it means the sediment deposits there. On the contrary, if the value is smaller than zero, it denotes the bed is being scoured.
In order to analyze the impact of sediment transport on the flash flood disaster near Zhongdu Town, the velocity and depth distribution are present in Figure 9. The contour shows the depth distribution, while the arrows shows the velocity direction and magnitude. The solution time is at 720 min, when the inlet discharge is approaching the peak value. As shown in Figure 9A, the sediment transport is not simulated, and the calculated main flow (regions with deeper depth) approaches the concave brims along the river channel. On the contrary, as shown in Figure 9B, the sediment transport is modeled, and the main flow runs along the central line of the channel.
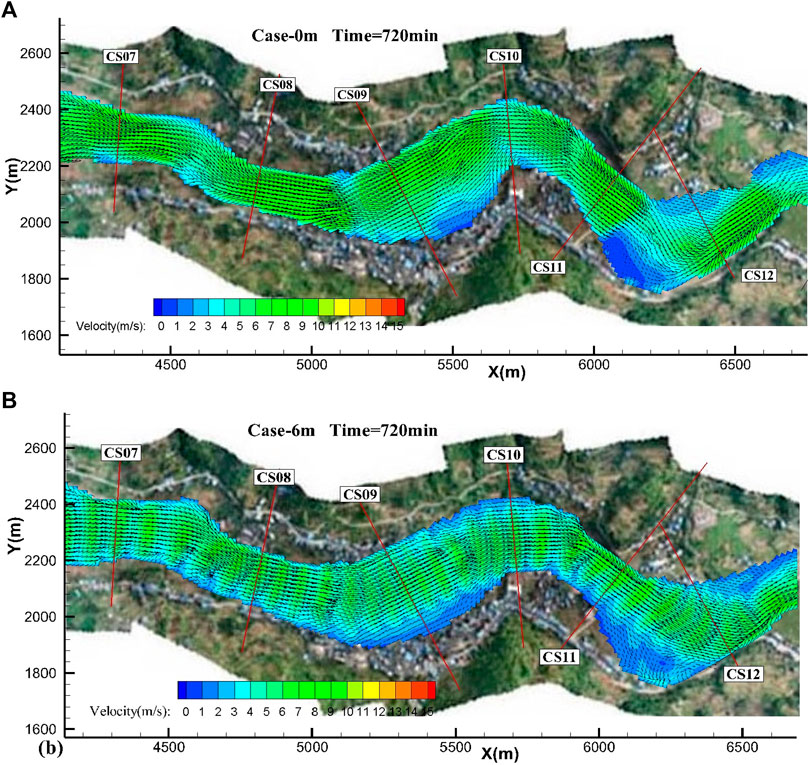
FIGURE 9. Velocity and depth distribution at Zhongdu Town in case-0m (A) and case-6m (B).
Figure 10 presents siltation distribution at Zhongdu Town. Sediments deposit at the concave side of the bend, while some sediment is silted at the convex side of the bend. Two major deposit regions lie at the opposite bank of Zhongdu Town and downstream of the same side of the town. The high-rise bed deflects the water near the concave side to the center of the channel, which contributes to the velocity distribution and inundated area in Figure 9B.

FIGURE 10. Siltation distribution at Zhongdu Town.
Figure 11A shows the results downstream of Zhongdu Town. The region between CS13 and CS14, where the channel width changes rapidly, has a much smaller velocity than in other regions. As sediment transport is simulated, huge deposition happened in this area (Figure 12). The sedimentation decreases the water depth and raises the velocity there (Figure 11B). Similar velocity and deposition distribution can also be noted in the area between CS15 and CS16, and the region between CS16 and CS17.
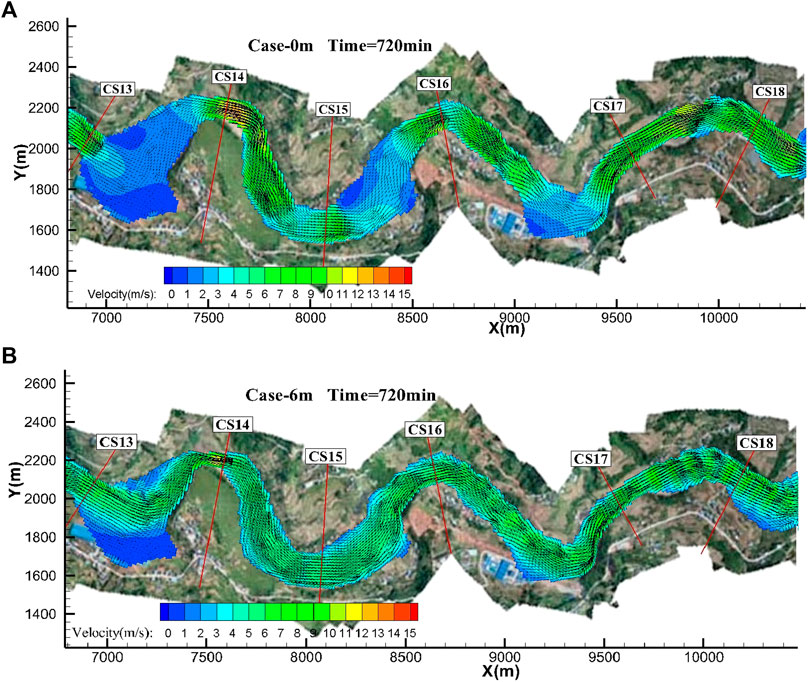
FIGURE 11. Velocity and depth distribution downstream the Zhongdu Town in case-0m (A) and case-6m (B).

FIGURE 12. Siltation distribution downstream the Zhongdu Town.
Among all the cross sections, CS14 and CS17 have the lowest level cross section, shown in Figure 7. Actually, the two cross sections all lie in the scour region (Figure 12). The bed elevation is lowered during the flood, and the water level is also lowered due to the sharp contract effect.
In this study, we adopted the two-dimensional shallow water models coupled with sediment transport and bed deformation models for flash flood waves in a mountain river. The models calculated the water and sediment transport in a time marching way. In each time step, conservation of mass and conservation of momentum is always fulfilled. The model can provide much detailed information about the flash flood.
For flash flood simulations with two-dimensional shallow water models, high resolution topography data, grading profile of sediment, and discharge profile are all essential for simulation accuracy. So theoretically, if the data about topography, sediment, and discharge is collected, the model can be used to simulate other flash floods. However, the data for the discharge usually cannot be obtained directly; unlike the discharge monitored by the hydrometric station at Zhongdu River, the discharge is generally calculated by a hydrological model based on the rainfall data, which contains much uncertainty due to the non-uniformity of underlying surface and rainfall. Poor discharge profiles will ruin the accuracy of simulation results.
Both scenarios with and without sediment transport are simulated by the proposed model. In case-0 m, the sediment transport is not modeled, and the bed is fixed. The peak discharge decreased a little along the channel, which may be induced by the bend boundary. However, as sediment transport is modeled in case-2 m ∼ case-6 m, the peak discharge is amplified significantly along the river. Compared to Case-0 m, the arrival time of the flash flood at each cross-section is advanced, and the peak level at each cross-section is raised or lowered by the sediment deposition and erosion. The sediment transport plays an important role in flash flood wave propagation in mountain rivers, and it should be taken into account in the flash flood modeling of rivers with heavy amounts of sediment.
For the verification of flood wave enlargement of actual flash floods, it is difficult to verify the arrival time of flood wave, peak water level, and peak discharge, as it is much hard to predict where and when a flash flood will happen, not to mention setting monitors to detect the flood. Furthermore, it is nearly impossible to find two real flash floods with the same discharge profile and different thicknesses of bed sediment. However, we can verify the flood wave enlargement by physical modeling of the flash floods with the same discharge profile and different sediment thicknesses of bed sediment. We generate prescribed discharge profiles by delicate flow rate controller, and mimic the sediment transport by setting well-chosen sediment in a topographically similar flume. Detectors can be set in the flume, and a large amount of data of the flash floods can be collected for study and verification of numerical models. Although the physical modeling is more expensive and time consuming than numerical modeling and may counter the scale effect problem (difference between physical modeling flash floods and actual flash floods), the physical modeling of flash floods is still valuable for studying the detail of complicate flash floods. (3).
Zhongdu River, a mountain river, is composed of a series of bends (Figure 1), and the flow moves in a similar way as that of a plain river. The major difference is that bed load transport plays a major role in bed variation. During the flood, since the velocity and sediment concentration is so high, sediment deposits at the concave side of the bend, and seldom lies down or is taken up at the convex side of the bend. Furthermore, the frequency and duration of flash floods in mountain rivers is much smaller than that of floods in plain rivers. At times without flood, the water contains little sediment, and takes small size sediment away continuously. The bed form is sharpened by the flash flood and smoothed by the streamlet.
For prevention of hazards caused by flash floods in river with a series of bends, it is better to study the flow and sediment movement during the flood. The convex brims of the bend have a higher chance to suffer flash floods, and it is recommended to set residential areas at the concave side of the bend. Using the numerical hydro-dynamic models coupled with sediment simulation is a good way to plan for safeguard facilities.
(1) In this study, the disaster in Zhongdu Town is analyzed by the depth-averaged two-dimensional model. The simulation shows the flow and bed change process in detail, and offers great help in studying the mechanism of flash floods and coming up with engineering manners for preventing the impact of the flood.
(2) Flash floods usually takes large amounts of sediment during the transport. The flood wave arrival time could be advanced and the peak discharge and peak level could be enlarged by the sediment intrusion. Without considering the sediment movement, the traditional numerical models may underestimate the destructive power of floods.
(3) Due to the difficulty in obtaining the sediment parameters of the riverbed, the amount of sediment coming from upstream and fetched from the riverbed is based on assumption. The simulation result may be different from the actual flood in quantity, but the general mechanism is authentic for flash floods in rivers with a series of bends, which are common in mountain rivers, and water and sediment in bends move in a much different way during flash floods compared to those on low discharge occasions. Figuring out the rules of flash floods in bends will help in planning residential areas, safeguard facilities, and evacuation procedures for flash floods.
The original contributions presented in the study are included in the article/Supplementary Material, further inquiries can be directed to the corresponding author.
QY: Numerical simulation, Writing, Funding acquisition. TL: Analysis. JZ: Analysis. XW: Field investigation, Supervision, Conceptualization, Funding acquisition.
The study is supported by the National Key R&D Program of China (Grant No. 2019YFC1510703-03), National Natural Science Foundation of China (Grant No. 51639007 and No. 51609014), and the Fundamental Research Funds for Central Public Welfare Research Institutes (Grant No. CKSF2021482/SL).
The authors declare that the research was conducted in the absence of any commercial or financial relationships that could be construed as a potential conflict of interest.
Bates, P. D. (2012). Integrating Remote Sensing Data with Flood Inundation Models: How Far Have We Got?. Hydrol. Process. 26 (16), 2515–2521. doi:10.1002/hyp.9374
Bellos, V., Papageorgaki, I., Kourtis, I., Vangelis, H., Kalogiros, I., and Tsakiris, G. (2020). Reconstruction of a Flash Flood Event Using a 2D Hydrodynamic Model under Spatial and Temporal Variability of Storm. Nat. Hazards 101 (3), 711–726. doi:10.1007/s11069-020-03891-3
Bui, D. T., Hoang, N. D., Martinez-Alvarez, F., Ngo, P. T. T., Hoa, P. V., Pham, T. D., et al. (2020). A Novel Deep Learning Neural Network Approach for Predicting Flash Flood Susceptibility: A Case Study at a High Frequency Tropical Storm Area. Sci. Total Environ. 701, 134413. doi:10.1016/j.scitotenv.2019.134413
Cao, Z., Yue, Z., and Pender, G. (2011). Landslide Dam Failure and Flood Hydraulics. Part I: Experimental Investigation. Nat. Hazards 59 (2), 1003–1019. doi:10.1007/s11069-011-9814-8
Chen, H.-Y., Cui, P., Zhou, G. G. D., Zhu, X.-H., and Tang, J.-B. (2014). Experimental Study of Debris Flow Caused by Domino Failures of Landslide Dams. Int. J. Sediment Res. 29 (3), 414–422. doi:10.1016/s1001-6279(14)60055-x
Contreras, M. T., and Escauriaza, C. (2020). Modeling the Effects of Sediment Concentration on the Propagation of Flash Floods in an Andean Watershed. Nat. Hazards Earth Syst. Sci. 20 (1), 221–241. doi:10.5194/nhess-20-221-2020
Guan, M., Carrivick, J. L., Wright, N. G., Sleigh, P. A., and Staines, K. E. H. (2016). Quantifying the Combined Effects of Multiple Extreme Floods on River Channel Geometry and on Flood Hazards. J. Hydrol. 538 (538), 256–268. doi:10.1016/j.jhydrol.2016.04.004
He, B., Huang, X., Ma, M., Chang, Q., Tu, Y., Li, Q., et al. (2018). Analysis of Flash Flood Disaster Characteristics in China from 2011 to 2015. Nat. Hazards 90 (1), 407–420. doi:10.1007/s11069-017-3052-7
Hu, X., and Song, L. (2018). Hydrodynamic Modeling of Flash Flood in Mountain Watersheds Based on High-Performance GPU Computing. Nat. Hazards 91 (2), 567–586. doi:10.1007/s11069-017-3141-7
Khosronejad, A., Flora, K., Zhang, Z., and Kang, S. (2020). Large-eddy Simulation of Flash Flood Propagation and Sediment Transport in a Dry-Bed Desert Stream. Int. J. Sediment Res. 35 (6), 576–586. doi:10.1016/j.ijsrc.2020.02.002
Kvočka, D., Falconer, R. A., and Bray, M. (2015). Appropriate Model Use for Predicting Elevations and Inundation Extent for Extreme Flood Events [J]. Nat. Hazards 79 (3), 1791–1808. doi:10.1007/s11069-015-1926-0
Li, W., Lin, K., Zhao, T., Lan, T., Chen, X., Du, H., et al. (2019). Risk Assessment and Sensitivity Analysis of Flash Floods in Ungauged Basins Using Coupled Hydrologic and Hydrodynamic Models. J. Hydrol. 572, 108–120. doi:10.1016/j.jhydrol.2019.03.002
Liang, Q., Xia, X., and Hou, J. (2016). Catchment-scale High-Resolution Flash Flood Simulation Using the GPU-Based Technology. Proced. Eng. 154, 975–981. doi:10.1016/j.proeng.2016.07.585
Liu, T.-H., Wang, Y.-K., Wang, X.-K., Duan, H.-F., and Yan, X.-F. (2020). Morphological Environment Survey and Hydrodynamic Modeling of a Large Bifurcation-confluence Complex in Yangtze River, China. Sci. Total Environ. 737, 139705. doi:10.1016/j.scitotenv.2020.139705
Liu, W., and He, S. (2017). Dynamic Simulation of a Mountain Disaster Chain: Landslides, Barrier Lakes, and Outburst Floods. Nat. Hazards 90 (2), 757–775. doi:10.1007/s11069-017-3073-2
Lorenzo-Lacruz, J., Amengual, A., Garcia, C., Morán-Tejeda, E., Homar, V., Maimó-Far, A., et al. (2019). Hydro-meteorological Reconstruction and Geomorphological Impact Assessment of the October 2018 Catastrophic Flash Flood at Sant Llorenç, Mallorca (Spain). Nat. Hazards Earth Syst. Sci. 19 (11), 2597–2617. doi:10.5194/nhess-19-2597-2019
Ma, M. H., Huang, X. L., and He, B. S. (2019). Analysis of the Characteristics of China’s Flash Flood Disaster in 2015.[J]. Yellow River 41 (01), 23–27. (In Chinese). doi:10.3969/j.issn.1000-1379.2019.01.006
Mashaly, J., and Ghoneim, E. (2018). Flash Flood Hazard Using Optical, Radar, and Stereo-Pair Derived DEM: Eastern Desert, Egypt. Remote Sens-Basel 1 (8), 1204. doi:10.3390/rs10081204
Paprotny, D., Sebastian, A., Morales-Napoles, O., and Jonkman, S. N. (2018). Trends in Flood Losses in Europe over the Past 150 Years. Nat. Commun. 9 (1), 1985. doi:10.1038/s41467-018-04253-1
Prasad, R. N., and Pani, P. (2017). Geo-hydrological Analysis and Sub Watershed Prioritization for Flash Flood Risk Using Weighted Sum Model and Snyder's Synthetic Unit Hydrograph. Model. Earth Syst. Environ. 3 (4), 1491–1502. doi:10.1007/s40808-017-0354-4
Rahman, M. S., and Di, L. (2016). The State of the Art of Spaceborne Remote Sensing in Flood Management. Nat. Hazards 85 (2), 1223–1248. doi:10.1007/s11069-016-2601-9
Sayama, T., Matsumoto, K., Kuwano, Y., and Takara, K. (2019). Application of Backpack-Mounted Mobile Mapping System and Rainfall-Runoff-Inundation Model for Flash Flood Analysis. Water 11 (5):963. doi:10.3390/w11050963
Toro, E. F. (2001). Shock Capturing Methods for Free Surface Shallow Flows [M]. Chichester: John Wiley & Sons.
Wang, X. K., Liu, X. N., and Zhou, J. W. (2019). Research Framework and Anticipated Results of Flash Flood Disasters under the Mutation of Sediment Supply [J]. Adv. Eng. Sci. 51 (04), 1–10. (In Chinese). doi:10.15961/j.jsuese.201900261
Wu, J., Liu, H., Wei, G. Z., Song, T. Y., Zhang, C., and Zhou, H. C. (2019). Flash Flood Forecasting Using Support Vector Regression Model in a Small Mountainous Catchment. Water 11 (7):1327. doi:10.3390/w11071327
Xia, J., Falconer, R. A., Lin, B., and Tan, G. (2010). Modelling Flood Routing on Initially Dry Beds with the Refined Treatment of Wetting and Drying. Int. J. River Basin Manag. 8 (3-4), 225–243. doi:10.1080/15715124.2010.502121
Yang, Q.-y., Lu, W.-Z., Zhou, S.-f., and Wang, X.-k. (2014). Impact of Dissipation and Dispersion Terms on Simulations of Open-Channel confluence Flow Using Two-Dimensional Depth-Averaged Model. Hydrol. Process. 28 (8), 3230–3240. doi:10.1002/hyp.9881
Yang, Q., Guan, M., Peng, Y., and Chen, H. (2020). Numerical Investigation of Flash Flood Dynamics Due to Cascading Failures of Natural Landslide Dams. Eng. Geology. 276, 105765. doi:10.1016/j.enggeo.2020.105765
Yoshioka, H., Unami, K., and Fujihara, M. (2015). A Dual Finite Volume Method Scheme for Catastrophic Flash Floods in Channel Networks. Appl. Math. Model. 39 (1), 205–229. doi:10.1016/j.apm.2014.05.021
Zhang, Y., Wang, Y., Zhang, Y., Luan, Q., and Liu, H. (2020). Multi-scenario Flash Flood hazard Assessment Based on Rainfall-Runoff Modeling and Flood Inundation Modeling: a Case Study. Nat. Hazards 105 (1), 967–981. doi:10.1007/s11069-020-04345-6
Keywords: flash flood, sediment transport, shallow water models, zhongdu flood, numerical simulation
Citation: Yang Q, Liu T, Zhai J and Wang X (2021) Numerical Investigation of a Flash Flood Process that Occurred in Zhongdu River, Sichuan, China. Front. Earth Sci. 9:686925. doi: 10.3389/feart.2021.686925
Received: 28 March 2021; Accepted: 02 June 2021;
Published: 21 July 2021.
Edited by:
Chong Xu, Ministry of Emergency Management (China), ChinaReviewed by:
Supattra Puttinaovarat, Prince of Songkla University, ThailandCopyright © 2021 Yang, Liu, Zhai and Wang. This is an open-access article distributed under the terms of the Creative Commons Attribution License (CC BY). The use, distribution or reproduction in other forums is permitted, provided the original author(s) and the copyright owner(s) are credited and that the original publication in this journal is cited, in accordance with accepted academic practice. No use, distribution or reproduction is permitted which does not comply with these terms.
*Correspondence: Xiekang Wang, d2FuZ3hpZWthbmdAc2N1LmVkdS5jbg==
Disclaimer: All claims expressed in this article are solely those of the authors and do not necessarily represent those of their affiliated organizations, or those of the publisher, the editors and the reviewers. Any product that may be evaluated in this article or claim that may be made by its manufacturer is not guaranteed or endorsed by the publisher.
Research integrity at Frontiers
Learn more about the work of our research integrity team to safeguard the quality of each article we publish.